The bar chart and the performance table below illustrate some of the risks and volatility of an investment in the Fund (and Predecessor Fund for periods prior to February 2025) for the indicated periods.
The Fund commenced investment operations in February 2025 after the conversion of the Intech U.S. Enhanced Plus Fund LLC, an unregistered private investment fund (the “Predecessor Fund”) into shares of the Fund. The Predecessor Fund commenced operations on March 1, 2004. The Sub-Adviser was either the investment adviser or the sub-adviser for the Predecessor Fund for the entire performance period shown. The Predecessor Fund transferred all its portfolio securities to the Fund.
The bar chart and the performance table below are for the Predecessor Fund for dates prior to the commencement of the Fund’s operations. The Fund’s objectives, policies, guidelines and restrictions are, in all material respects, equivalent to those of the Predecessor Fund and for the Fund after it commenced operations. The Predecessor Fund was a private investment fund structured as a commingled vehicle under Section 3(c)(7) of the Investment Company Act of 1940. The conversion of the Predecessor Fund into an exchange-traded fund (“ETF”) allowed for operational and legal continuity for existing investors while enhancing the commingled structure with improved accessibility, tax efficiency, and lower fees.
The Predecessor Fund was managed in a materially equivalent way as the Sub-Adviser manages the Fund, and its performance reflects its results prior to the conversion into the Fund. The Predecessor Fund was not registered under the 1940 Act and therefore was not subject to certain restrictions imposed by the 1940 Act on registered investment companies and by the Internal Revenue Code of 1986, as amended (the “Code”), on regulated investment companies. If the Predecessor Fund had been registered under the 1940 Act, the Predecessor Fund’s performance may have been adversely affected. Past performance before and after taxes does not necessarily indicate how the Fund will perform in the future. Returns for the Fund’s shares prior to its commencement of operations reflect all charges, expenses, and fees of the Predecessor Fund, gross of any waivers. In addition, the Predecessor Fund did not charge a sales load.
The performance of the Predecessor Fund was calculated using standardized SEC calculation methodologies.
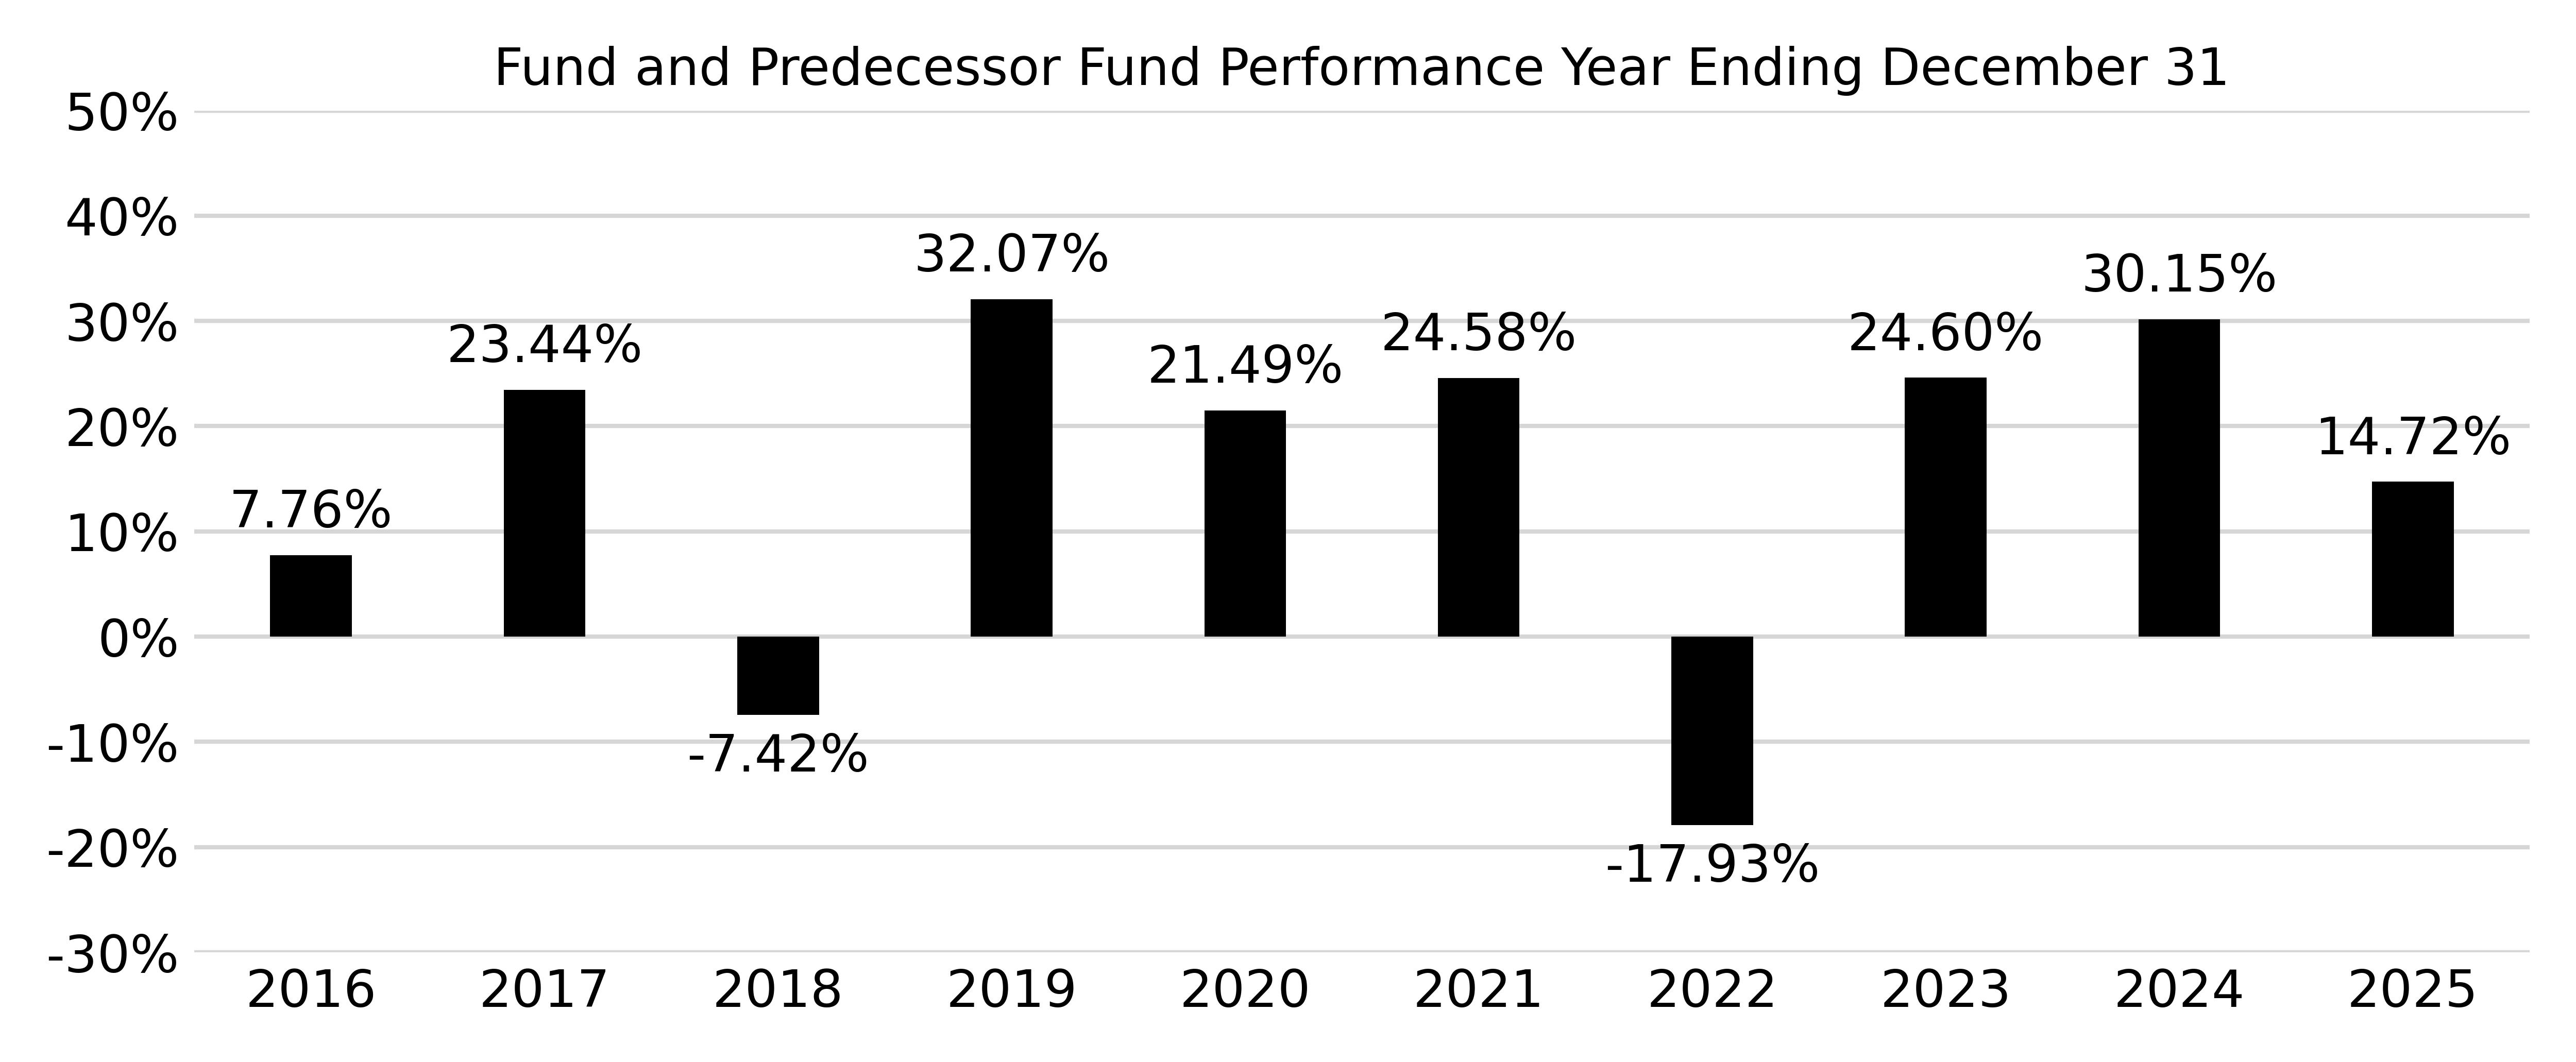
During the period of time shown in the bar chart, the highest return for a calendar quarter was 21.40% (quarter ended June 30, 2020) and the lowest return for a calendar quarter was -19.87% (quarter ended March 31, 2020).
This table shows the Fund’s (and for periods prior to February 2025, the Predecessor Fund’s) average annual total returns for the periods ending December 31, 2025. The table also shows how the Predecessor Fund’s performance compares with a broad measure of market performance. The Predecessor Fund was organized as a Delaware limited liability company, did not qualify as a regulated investment company for federal income tax purposes, and did not pay dividends and distributions. As a result, we are unable to show the after-tax-on-distributions returns for the Predecessor Fund.
|
|
1 Year
|
5 Year
|
10 Year
|
Since Inception
(March 1, 2004)
|
|---|---|---|---|---|
|
Return Before Taxes
|
14.72%
|
13.73%
|
14.16%
|
10.73%
|
|
Return After Taxes on Distributions
|
14.58%
|
13.70%
|
14.14%
|
10.73%
|
|
Return After Taxes on Distributions and Sale of Fund Shares
|
8.82%
|
11.03%
|
11.99%
|
9.53%
|
|
S&P 500® Total Return Index
(reflects no deduction for fees, expenses, or taxes)
|
17.88%
|
14.42%
|
14.82%
|
10.58%
|
Performance information for the Fund is not included because the Fund has not completed a full calendar year of operations as of the date of this Prospectus. When such information is included, this section will provide some indication of the risks of investing in the Fund by showing changes in the Fund’s performance history from year to year and showing how the Fund’s average annual total returns compare with those of a broad measure of market performance and the Index. Although past performance of the Fund is no guarantee of how it will perform in the future, historical performance may give you some indication of the risks of investing in the Fund. Updated performance information is available on the Fund’s website at www.IntechETFs.com.