Pay vs Performance Disclosure - USD ($)
Dec. 31, 2025
Dec. 31, 2024
Dec. 31, 2023
PAY VERSUS PERFORMANCE
As required by Item 402(v) of Regulation S-K, we are providing the following information about the relationship between the “compensation actually paid” (“CAP”) to our current and former principal executive officers (“PEOs”) and our non-PEO named executive officers (“Non-PEO NEOs”) and certain aspects of our financial performance for the fiscal years ended December 31, 2025, 2024 and 2023.
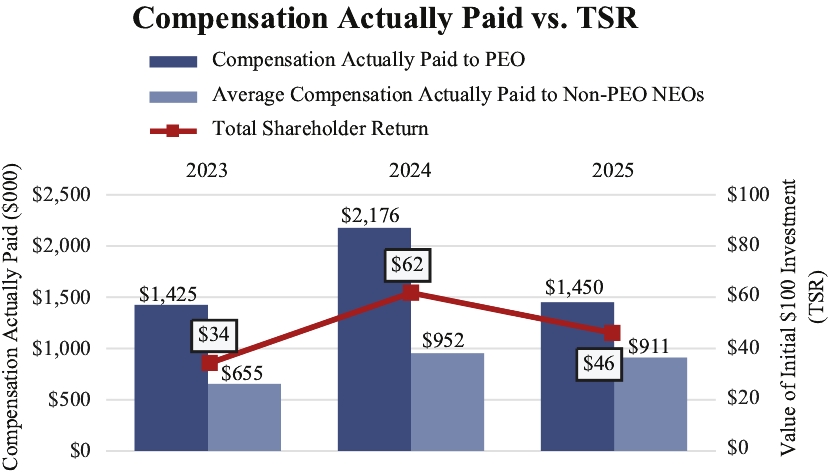
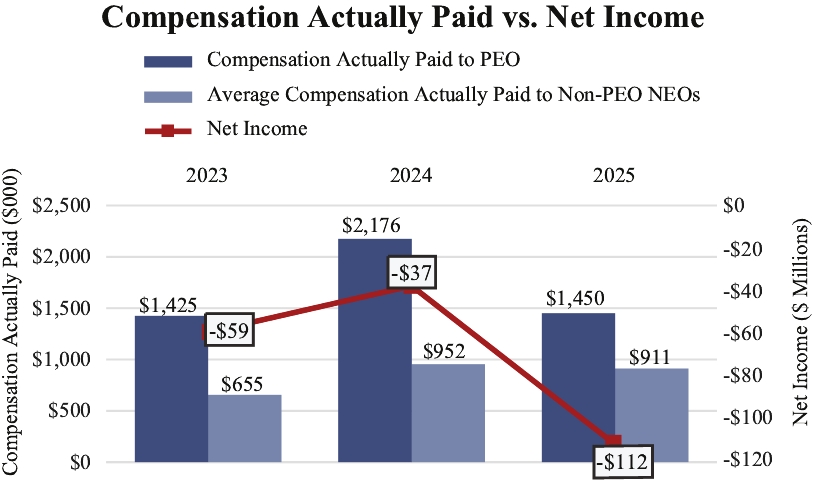
Year(1) | Summary Compensation Table Total for PEO(2) | Compensation Actually Paid to PEO(3) | Average Summary Compensation Table Total for Non-PEO NEOs(2) | Average Compensation Actually Paid to Non-PEO NEOs(4) | Total Shareholder Return: Value of Initial $100 Investment(5) | Net Income/(Loss)(6) | ||||||||||||
2025 | $2,506,450 | $1,450,213 | $1,103,837 | $910,867 | $46 | ($111,732,000) | ||||||||||||
2024 | $3,804,665 | $2,176,330 | $1,423,378 | $952,463 | $62 | ($37,384,000) | ||||||||||||
2023 | $2,875,167 | $1,424,903 | $1,200,561 | $654,974 | $34 | ($58,625,000) | ||||||||||||
(1) | Ryan Steelberg served as our PEO for the entirety of 2023, 2024, and 2025. Our Non-PEO NEOs for the applicable years were as follows: |
• | 2025: Michael Zemetra |
• | 2024: Michael Zemetra |
• | 2023: Michael Zemetra |
(2) | Amounts reported in these columns represent (i) the total compensation reported in the Summary Compensation Table for the applicable years for our PEO and (ii) the average of the total compensation reported in the Summary Compensation Table for the applicable years for our Non-PEO NEOs. |
(3) | Amounts reported in this column represent CAP to our PEO, based on his total compensation reported in the Summary Compensation Table for the indicated fiscal years and certain adjustments required by Item 402(v) of Regulation S-K. The following adjustments were made to the reported total compensation of the PEO for 2025 to determine CAP for 2025: |
PEO | 2025 | |||||
Summary Compensation Table - Total Compensation | $2,506,450 | |||||
- | Grant Date Fair Value of Stock Awards and Option Awards Granted in Fiscal Year | $1,675,200 | ||||
+ | Fair Value at Fiscal Year End of Outstanding and Unvested Stock Awards and Option Awards Granted in Fiscal Year | $1,432,980 | ||||
+ | Change in Fair Value of Outstanding and Unvested Stock Awards and Option Awards Granted in Prior Fiscal Years | $-814,017 | ||||
+ | Fair Value at Vesting of Stock Awards and Option Awards Granted in Fiscal Year That Vested During Fiscal Year | $0 | ||||
+ | Change in Fair Value as of Vesting Date of Stock Awards and Option Awards Granted in Prior Fiscal Years For Which Applicable Vesting Conditions Were Satisfied During Fiscal Year | $0 | ||||
- | Fair Value as of Prior Fiscal Year End of Stock Awards and Option Awards Granted in Prior Fiscal Years That Failed to Meet Applicable Vesting Conditions During Fiscal Year | $0 | ||||
= | Compensation Actually Paid | $1,450,213 | ||||
Equity award values are calculated in accordance with FASB ASC Topic 718, and the valuation assumptions used to calculate fair values did not materially differ from those disclosed at the time of grant.
(4) | Amounts reported in this column represent average CAP to our Non-PEO NEOs, based on their average total compensation reported in the Summary Compensation Table for the indicated fiscal years and certain adjustments required by Item 402(v) of Regulation S-K. The following adjustments were made to the reported total compensation of the Non-PEO NEOs for 2025 to determine CAP for 2025: |
Non-PEO NEO Average | 2025 | |||||
Summary Compensation Table - Total Compensation | $1,103,837 | |||||
- | Grant Date Fair Value of Stock Awards and Option Awards Granted in Fiscal Year | $575,850 | ||||
+ | Fair Value at Fiscal Year End of Outstanding and Unvested Stock Awards and Option Awards Granted in Fiscal Year | $626,264 | ||||
+ | Change in Fair Value of Outstanding and Unvested Stock Awards and Option Awards Granted in Prior Fiscal Years | $-243,384 | ||||
+ | Fair Value at Vesting of Stock Awards and Option Awards Granted in Fiscal Year That Vested During Fiscal Year | $0 | ||||
+ | Change in Fair Value as of Vesting Date of Stock Awards and Option Awards Granted in Prior Fiscal Years For Which Applicable Vesting Conditions Were Satisfied During Fiscal Year | $0 | ||||
- | Fair Value as of Prior Fiscal Year End of Stock Awards and Option Awards Granted in Prior Fiscal Years That Failed to Meet Applicable Vesting Conditions During Fiscal Year | $0 | ||||
= | Compensation Actually Paid | $910,867 | ||||
Please see footnote 1 for the Non-PEO NEOs included in the average CAP for 2025. Equity award values are calculated in accordance with FASB ASC Topic 718, and the valuation assumptions used to calculate fair values did not materially differ from those disclosed at the time of grant.
(5) | Pursuant to Item 402(v), the comparison assumes $100 was invested on December 31, 2022 in our common stock. Historic stock price performance is not necessarily indicative of future stock price performance. |
(6) | The dollar amounts reported represent the amount of net income/(loss) reflected in our audited financial statements for the applicable year. |
(1) | Ryan Steelberg served as our PEO for the entirety of 2023, 2024, and 2025. Our Non-PEO NEOs for the applicable years were as follows: |
• | 2025: Michael Zemetra |
• | 2024: Michael Zemetra |
• | 2023: Michael Zemetra |
(3) | Amounts reported in this column represent CAP to our PEO, based on his total compensation reported in the Summary Compensation Table for the indicated fiscal years and certain adjustments required by Item 402(v) of Regulation S-K. The following adjustments were made to the reported total compensation of the PEO for 2025 to determine CAP for 2025: |
PEO | 2025 | |||||
Summary Compensation Table - Total Compensation | $2,506,450 | |||||
- | Grant Date Fair Value of Stock Awards and Option Awards Granted in Fiscal Year | $1,675,200 | ||||
+ | Fair Value at Fiscal Year End of Outstanding and Unvested Stock Awards and Option Awards Granted in Fiscal Year | $1,432,980 | ||||
+ | Change in Fair Value of Outstanding and Unvested Stock Awards and Option Awards Granted in Prior Fiscal Years | $-814,017 | ||||
+ | Fair Value at Vesting of Stock Awards and Option Awards Granted in Fiscal Year That Vested During Fiscal Year | $0 | ||||
+ | Change in Fair Value as of Vesting Date of Stock Awards and Option Awards Granted in Prior Fiscal Years For Which Applicable Vesting Conditions Were Satisfied During Fiscal Year | $0 | ||||
- | Fair Value as of Prior Fiscal Year End of Stock Awards and Option Awards Granted in Prior Fiscal Years That Failed to Meet Applicable Vesting Conditions During Fiscal Year | $0 | ||||
= | Compensation Actually Paid | $1,450,213 | ||||
Equity award values are calculated in accordance with FASB ASC Topic 718, and the valuation assumptions used to calculate fair values did not materially differ from those disclosed at the time of grant.
(4) | Amounts reported in this column represent average CAP to our Non-PEO NEOs, based on their average total compensation reported in the Summary Compensation Table for the indicated fiscal years and certain adjustments required by Item 402(v) of Regulation S-K. The following adjustments were made to the reported total compensation of the Non-PEO NEOs for 2025 to determine CAP for 2025: |
Non-PEO NEO Average | 2025 | |||||
Summary Compensation Table - Total Compensation | $1,103,837 | |||||
- | Grant Date Fair Value of Stock Awards and Option Awards Granted in Fiscal Year | $575,850 | ||||
+ | Fair Value at Fiscal Year End of Outstanding and Unvested Stock Awards and Option Awards Granted in Fiscal Year | $626,264 | ||||
+ | Change in Fair Value of Outstanding and Unvested Stock Awards and Option Awards Granted in Prior Fiscal Years | $-243,384 | ||||
+ | Fair Value at Vesting of Stock Awards and Option Awards Granted in Fiscal Year That Vested During Fiscal Year | $0 | ||||
+ | Change in Fair Value as of Vesting Date of Stock Awards and Option Awards Granted in Prior Fiscal Years For Which Applicable Vesting Conditions Were Satisfied During Fiscal Year | $0 | ||||
- | Fair Value as of Prior Fiscal Year End of Stock Awards and Option Awards Granted in Prior Fiscal Years That Failed to Meet Applicable Vesting Conditions During Fiscal Year | $0 | ||||
= | Compensation Actually Paid | $910,867 | ||||
Please see footnote 1 for the Non-PEO NEOs included in the average CAP for 2025. Equity award values are calculated in accordance with FASB ASC Topic 718, and the valuation assumptions used to calculate fair values did not materially differ from those disclosed at the time of grant.