Shareholder Report
Oct. 31, 2025
USD ($)
Holding
Shareholder Report |
12 Months Ended |
|---|---|
|
Oct. 31, 2025
USD ($)
Holding
| |
| Shareholder Report [Line Items] | |
| Document Type | N-CSR |
| Amendment Flag | false |
| Registrant Name | Advisors' Inner Circle Fund |
| Entity Central Index Key | 0000878719 |
| Entity Investment Company Type | N-1A |
| Document Period End Date | Oct. 31, 2025 |
| C000017646 | |
| Shareholder Report [Line Items] | |
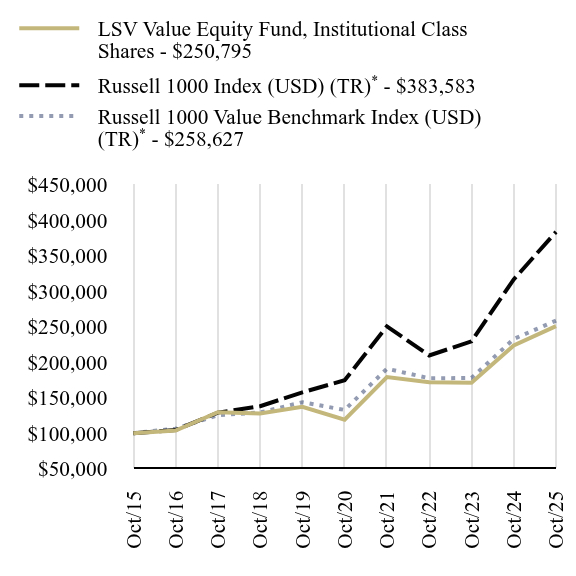
| Fund Name | LSV Value Equity Fund |
| Class Name | Institutional Class Shares |
| Trading Symbol | LSVEX |
| Annual or Semi-Annual Statement [Text Block] | This annual shareholder report contains important information about Institutional Class Shares of the LSV Value Equity Fund (the "Fund") for the period from November 1, 2024 to October 31, 2025. |
| Additional Information [Text Block] | You can find additional information about the Fund at https://www.lsvasset.com/value-equity-fund/. You can also request this information by contacting us at 888-386-3578. |
| Additional Information Phone Number | 888-386-3578 |
| Additional Information Website | https://www.lsvasset.com/value-equity-fund/ |
| Expenses [Text Block] | |
| Expenses Paid, Amount | $ 71 |
| Expense Ratio, Percent | 0.67% |
| Performance Past Does Not Indicate Future [Text] | Past performance is not indicative of future performance. |
| Line Graph [Table Text Block] | |
| Average Annual Return [Table Text Block] | |
| No Deduction of Taxes [Text Block] | The table and graph presented do not reflect the deduction of taxes a shareholder would pay on Fund distributions or the redemption of Fund shares. |
| AssetsNet | $ 1,141,922,000 |
| Holdings Count | Holding | 147 |
| Advisory Fees Paid, Amount | $ 6,940 |
| InvestmentCompanyPortfolioTurnover | 12.00% |
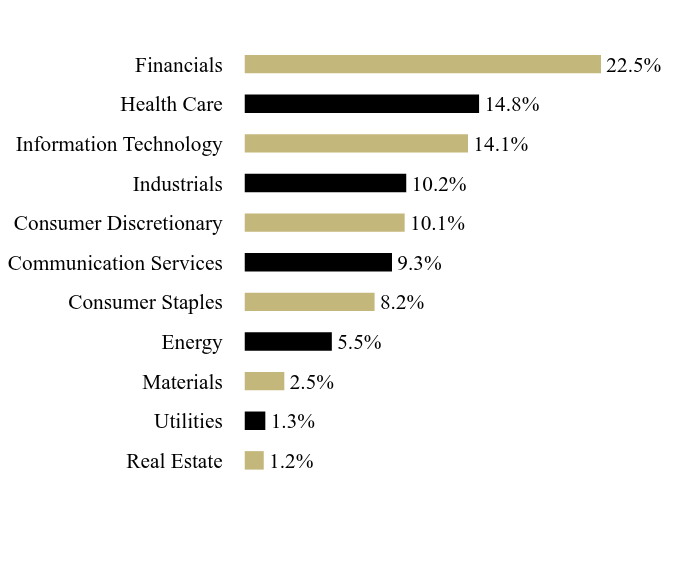
| Holdings [Text Block] | |
| Material Fund Change [Text Block] | |
| Updated Prospectus Phone Number | 888-386-3578 |
| Updated Prospectus Web Address | https://www.lsvasset.com/value-equity-fund/ |
| C000142889 | |
| Shareholder Report [Line Items] | |
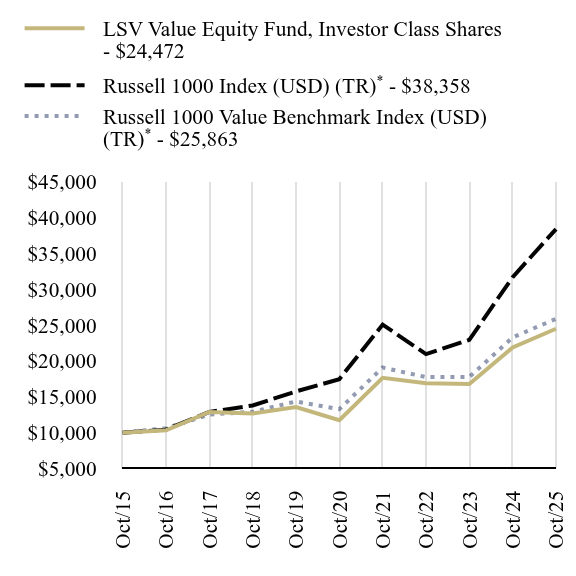
| Fund Name | LSV Value Equity Fund |
| Class Name | Investor Class Shares |
| Trading Symbol | LVAEX |
| Annual or Semi-Annual Statement [Text Block] | This annual shareholder report contains important information about Investor Class Shares of the LSV Value Equity Fund (the "Fund") for the period from November 1, 2024 to October 31, 2025. |
| Additional Information [Text Block] | You can find additional information about the Fund at https://www.lsvasset.com/value-equity-fund/. You can also request this information by contacting us at 888-386-3578. |
| Additional Information Phone Number | 888-386-3578 |
| Additional Information Website | https://www.lsvasset.com/value-equity-fund/ |
| Expenses [Text Block] | |
| Expenses Paid, Amount | $ 97 |
| Expense Ratio, Percent | 0.92% |
| Performance Past Does Not Indicate Future [Text] | Past performance is not indicative of future performance. |
| Line Graph [Table Text Block] | |
| Average Annual Return [Table Text Block] | |
| No Deduction of Taxes [Text Block] | The table and graph presented do not reflect the deduction of taxes a shareholder would pay on Fund distributions or the redemption of Fund shares. |
| AssetsNet | $ 1,141,922,000 |
| Holdings Count | Holding | 147 |
| Advisory Fees Paid, Amount | $ 6,940 |
| InvestmentCompanyPortfolioTurnover | 12.00% |
| Holdings [Text Block] | |
| Material Fund Change [Text Block] | |
| Updated Prospectus Phone Number | 888-386-3578 |
| Updated Prospectus Web Address | https://www.lsvasset.com/value-equity-fund/ |