Shareholder Report
|
12 Months Ended |
|
Oct. 31, 2025
USD ($)
Holding
|
|---|
| Shareholder Report [Line Items] |
|
| Document Type |
N-CSR
|
| Amendment Flag |
false
|
| Registrant Name |
Advisors' Inner Circle Fund
|
| Entity Central Index Key |
0000878719
|
| Entity Investment Company Type |
N-1A
|
| Document Period End Date |
Oct. 31, 2025
|
| C000086650 |
|
| Shareholder Report [Line Items] |
|
| Fund Name |
Sands Capital Global Growth Fund
|
| Class Name |
Institutional Class Shares
|
| Trading Symbol |
SCMGX
|
| Annual or Semi-Annual Statement [Text Block] |
This annual shareholder report contains important information about Institutional Class Shares of the Sands Capital Global Growth Fund (the "Fund") for the period from November 1, 2024 to October 31, 2025.
|
| Additional Information [Text Block] |
You can find additional information about the Fund at https://www.sandscapital.com/document-library-mutual-funds/. You can also request this information by contacting us at 1-888-826-5646.
|
| Additional Information Phone Number |
1-888-826-5646
|
| Additional Information Website |
https://www.sandscapital.com/document-library-mutual-funds/
|
| Expenses [Text Block] |
What were the Fund costs for the last year?(based on a hypothetical $10,000 investment) Fund Name | Costs of a $10,000 investment | Costs paid as a percentage of a $10,000 investment |
|---|
Sands Capital Global Growth Fund, Institutional Class Shares | $109 | 0.97% |
|---|
|
| Expenses Paid, Amount |
$ 109
|
| Expense Ratio, Percent |
0.97%
|
| Factors Affecting Performance [Text Block] |
How did the Fund perform in the last year? The Fund outperformed the MSCI ACWI, net of fees, for the twelve-month period ending October 31, 2025. Relative results were attributable to a mix of favorable sector positioning as well as security selection within sectors. The health care and communication services sectors contributed most to relative results, while financials and consumer discretionary were the largest relative sector detractors. From a regional perspective, the U.S./Canada was the top relative contributor, while Developed Asia was the top detractor. The top five individual absolute contributors to investment results were NVIDIA, Axon Enterprise, Netflix, Cloudflare, and Shopify. The top individual detractors were Keyence, On Holding, Intercontinental Exchange, Nike, and ServiceNow. During the period the Fund purchased 3i Group, AppLovin, argenx, Builders FirstSource, Carlisle Companies, Carvana, CTS Eventim, Galderma, Intercontinental Exchange, Intuitive Surgical, On Holding, Pro Medicus, Samsara, ServiceNow, Taiwan Semiconductor, and Tetra Tech. The Fund exited Airbnb, Align Technology, Asian Paints, Atlassian, Edwards Lifesciences, Entegris, IMCD, Nike, Okta, Repligen, Sika, Snowflake, and Zalando. Elevated portfolio turnover for the period did not reflect a change in investment approach, but rather a normalization after four years of below-average turnover. Our investment horizon remains five years or more. From a positioning perspective, the Fund continues to balance what we view as “high-growth, high-valuation” businesses with “classic growth” businesses. Regional and sector exposures are largely a byproduct of our bottom-up investment process. Below was the positioning at the end of the period: - The U.S./Canada was the largest absolute regional exposure and Latin America was the largest overweight relative to the MSCI ACWI. The Fund had no exposure to Eastern Europe or to the Mid-East & Africa. Developed Asia was the largest underweight. - Information technology was the largest absolute sector weight and consumer discretionary was the largest overweight relative to the MSCI ACWI. The Fund had no exposure to the consumer staples, energy, materials, real estate, or utilities sectors, with the consumer staples sector representing the largest underweight. |
| Performance Past Does Not Indicate Future [Text] |
Past performance is not indicative of future performance.
|
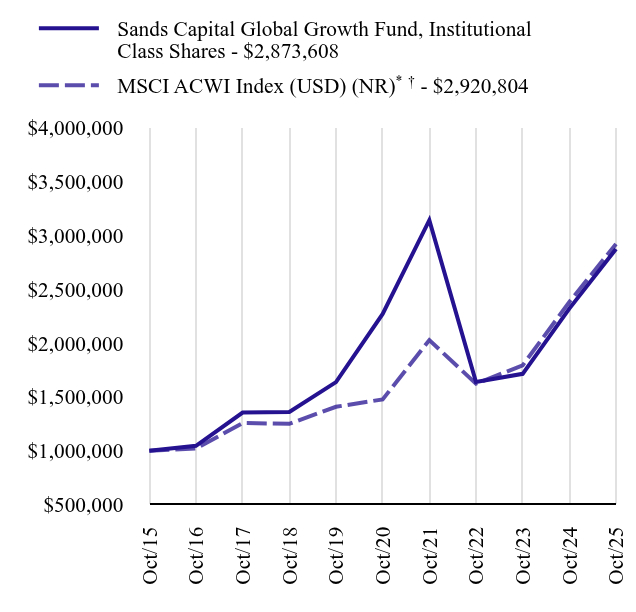
| Line Graph [Table Text Block] |
| Sands Capital Global Growth Fund, Institutional Class Shares | MSCI ACWI Index (USD) (NR)Footnote Reference*Footnote Reference† |
|---|
Oct/15 | $1,000,000 | $1,000,000 |
|---|
Oct/16 | $1,045,964 | $1,020,480 |
|---|
Oct/17 | $1,354,260 | $1,257,261 |
|---|
Oct/18 | $1,359,756 | $1,250,753 |
|---|
Oct/19 | $1,637,488 | $1,408,241 |
|---|
Oct/20 | $2,269,955 | $1,477,073 |
|---|
Oct/21 | $3,141,490 | $2,027,687 |
|---|
Oct/22 | $1,637,863 | $1,623,015 |
|---|
Oct/23 | $1,714,449 | $1,793,463 |
|---|
Oct/24 | $2,320,306 | $2,381,553 |
|---|
Oct/25 | $2,873,608 | $2,920,804 |
|---|
|
| Average Annual Return [Table Text Block] |
Fund/Index Name | 1 Year | 5 Years | 10 Years |
|---|
Sands Capital Global Growth Fund, Institutional Class Shares | 23.85% | 4.83% | 11.13% |
|---|
MSCI ACWI Index (USD) (NR)Footnote Reference*Footnote Reference† | 22.64% | 14.61% | 11.31% |
|---|
|
| No Deduction of Taxes [Text Block] |
The table and graph presented above do not reflect the deduction of taxes a shareholder would pay on Fund distributions or the redemption of Fund shares.
|
| AssetsNet |
$ 958,059,595
|
| Holdings Count | Holding |
39
|
| Advisory Fees Paid, Amount |
$ 10,172,518
|
| InvestmentCompanyPortfolioTurnover |
37.00%
|
| Additional Fund Statistics [Text Block] |
Key Fund Statistics as of October 31, 2025 | Total Net Assets | Number of Holdings | Total Advisory Fees Paid | Portfolio Turnover Rate |
|---|
| $958,059,595 | 39 | $10,172,518 | 37% |
|---|
|
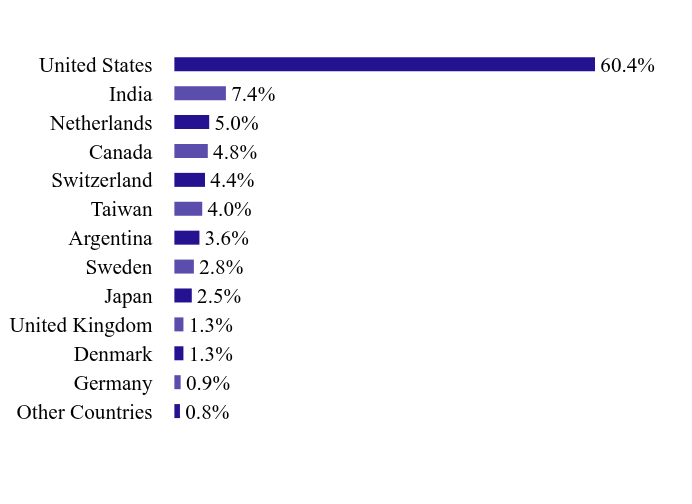
| Holdings [Text Block] |
Country WeightingsFootnote Reference*Value | Value |
|---|
Other Countries | 0.8% | Germany | 0.9% | Denmark | 1.3% | United Kingdom | 1.3% | Japan | 2.5% | Sweden | 2.8% | Argentina | 3.6% | Taiwan | 4.0% | Switzerland | 4.4% | Canada | 4.8% | Netherlands | 5.0% | India | 7.4% | United States | 60.4% |
| Footnote | Description | Footnote* | Percentages are calculated based on total net assets. |
|
| Largest Holdings [Text Block] |
Holding Name | | | Percentage of
Total Net Assets |
|---|
NVIDIA | | | 9.2% | Amazon.com | | | 4.9% | Alphabet, Cl A | | | 4.6% | Taiwan Semiconductor Manufacturing ADR | | | 4.0% | Visa, Cl A | | | 3.9% | Netflix | | | 3.7% | Axon Enterprise | | | 3.6% | MercadoLibre | | | 3.6% | DoorDash, Cl A | | | 3.4% | Shopify, Cl A | | | 3.3% |
|
| Material Fund Change [Text Block] |
There were no material changes during the reporting period. |
| Updated Prospectus Phone Number |
1-888-826-5646
|
| Updated Prospectus Web Address |
https://www.sandscapital.com/document-library-mutual-funds/
|
| C000086651 |
|
| Shareholder Report [Line Items] |
|
| Fund Name |
Sands Capital Global Growth Fund
|
| Class Name |
Investor Class Shares
|
| Trading Symbol |
SCGVX
|
| Annual or Semi-Annual Statement [Text Block] |
This annual shareholder report contains important information about Investor Class Shares of the Sands Capital Global Growth Fund (the "Fund") for the period from November 1, 2024 to October 31, 2025.
|
| Additional Information [Text Block] |
You can find additional information about the Fund at https://www.sandscapital.com/document-library-mutual-funds/. You can also request this information by contacting us at 1-888-826-5646.
|
| Additional Information Phone Number |
1-888-826-5646
|
| Additional Information Website |
https://www.sandscapital.com/document-library-mutual-funds/
|
| Expenses [Text Block] |
What were the Fund costs for the last year?(based on a hypothetical $10,000 investment) Fund Name | Costs of a $10,000 investment | Costs paid as a percentage of a $10,000 investment |
|---|
Sands Capital Global Growth Fund, Investor Class Shares | $129 | 1.15% |
|---|
|
| Expenses Paid, Amount |
$ 129
|
| Expense Ratio, Percent |
1.15%
|
| Factors Affecting Performance [Text Block] |
How did the Fund perform in the last year? The Fund outperformed the MSCI ACWI, net of fees, for the twelve-month period ending October 31, 2025. Relative results were attributable to a mix of favorable sector positioning as well as security selection within sectors. The health care and communication services sectors contributed most to relative results, while financials and consumer discretionary were the largest relative sector detractors. From a regional perspective, the U.S./Canada was the top relative contributor, while Developed Asia was the top detractor. The top five individual absolute contributors to investment results were NVIDIA, Axon Enterprise, Netflix, Cloudflare, and Shopify. The top individual detractors were Keyence, On Holding, Intercontinental Exchange, Nike, and ServiceNow. During the period the Fund purchased 3i Group, AppLovin, argenx, Builders FirstSource, Carlisle Companies, Carvana, CTS Eventim, Galderma, Intercontinental Exchange, Intuitive Surgical, On Holding, Pro Medicus, Samsara, ServiceNow, Taiwan Semiconductor, and Tetra Tech. The Fund exited Airbnb, Align Technology, Asian Paints, Atlassian, Edwards Lifesciences, Entegris, IMCD, Nike, Okta, Repligen, Sika, Snowflake, and Zalando. Elevated portfolio turnover for the period did not reflect a change in investment approach, but rather a normalization after four years of below-average turnover. Our investment horizon remains five years or more. From a positioning perspective, the Fund continues to balance what we view as “high-growth, high-valuation” businesses with “classic growth” businesses. Regional and sector exposures are largely a byproduct of our bottom-up investment process. Below was the positioning at the end of the period: - The U.S./Canada was the largest absolute regional exposure and Latin America was the largest overweight relative to the MSCI ACWI. The Fund had no exposure to Eastern Europe or to the Mid-East & Africa. Developed Asia was the largest underweight. - Information technology was the largest absolute sector weight and consumer discretionary was the largest overweight relative to the MSCI ACWI. The Fund had no exposure to the consumer staples, energy, materials, real estate, or utilities sectors, with the consumer staples sector representing the largest underweight. |
| Performance Past Does Not Indicate Future [Text] |
Past performance is not indicative of future performance.
|
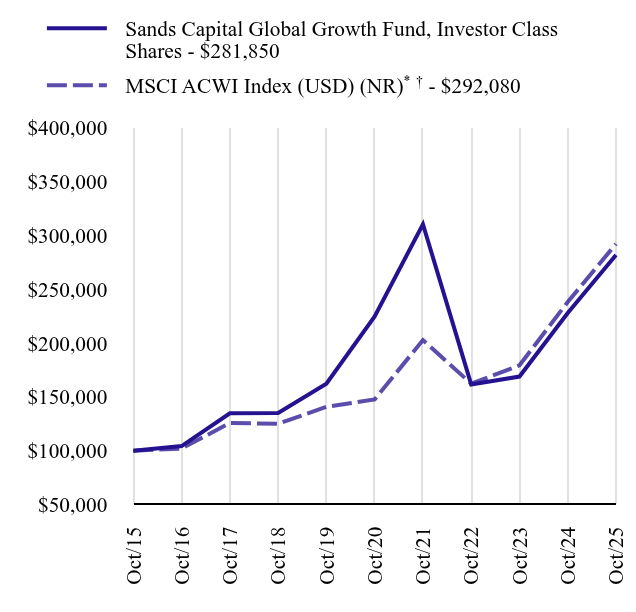
| Line Graph [Table Text Block] |
| Sands Capital Global Growth Fund, Investor Class Shares | MSCI ACWI Index (USD) (NR)Footnote Reference*Footnote Reference† |
|---|
Oct/15 | $100,000 | $100,000 |
|---|
Oct/16 | $104,353 | $102,048 |
|---|
Oct/17 | $134,822 | $125,726 |
|---|
Oct/18 | $135,126 | $125,075 |
|---|
Oct/19 | $162,332 | $140,824 |
|---|
Oct/20 | $224,644 | $147,707 |
|---|
Oct/21 | $310,340 | $202,769 |
|---|
Oct/22 | $161,652 | $162,302 |
|---|
Oct/23 | $168,933 | $179,346 |
|---|
Oct/24 | $227,952 | $238,155 |
|---|
Oct/25 | $281,850 | $292,080 |
|---|
|
| Average Annual Return [Table Text Block] |
Fund/Index Name | 1 Year | 5 Years | 10 Years |
|---|
Sands Capital Global Growth Fund, Investor Class Shares | 23.64% | 4.64% | 10.92% |
|---|
MSCI ACWI Index (USD) (NR)Footnote Reference*Footnote Reference† | 22.64% | 14.61% | 11.31% |
|---|
|
| No Deduction of Taxes [Text Block] |
The table and graph presented above do not reflect the deduction of taxes a shareholder would pay on Fund distributions or the redemption of Fund shares.
|
| AssetsNet |
$ 958,059,595
|
| Holdings Count | Holding |
39
|
| Advisory Fees Paid, Amount |
$ 10,172,518
|
| InvestmentCompanyPortfolioTurnover |
37.00%
|
| Additional Fund Statistics [Text Block] |
Key Fund Statistics as of October 31, 2025 | Total Net Assets | Number of Holdings | Total Advisory Fees Paid | Portfolio Turnover Rate |
|---|
| $958,059,595 | 39 | $10,172,518 | 37% |
|---|
|
| Holdings [Text Block] |
Country WeightingsFootnote Reference*Value | Value |
|---|
Other Countries | 0.8% | Germany | 0.9% | Denmark | 1.3% | United Kingdom | 1.3% | Japan | 2.5% | Sweden | 2.8% | Argentina | 3.6% | Taiwan | 4.0% | Switzerland | 4.4% | Canada | 4.8% | Netherlands | 5.0% | India | 7.4% | United States | 60.4% |
| Footnote | Description | Footnote* | Percentages are calculated based on total net assets. |
|
| Largest Holdings [Text Block] |
Holding Name | | | Percentage of
Total Net Assets |
|---|
NVIDIA | | | 9.2% | Amazon.com | | | 4.9% | Alphabet, Cl A | | | 4.6% | Taiwan Semiconductor Manufacturing ADR | | | 4.0% | Visa, Cl A | | | 3.9% | Netflix | | | 3.7% | Axon Enterprise | | | 3.6% | MercadoLibre | | | 3.6% | DoorDash, Cl A | | | 3.4% | Shopify, Cl A | | | 3.3% |
|
| Material Fund Change [Text Block] |
There were no material changes during the reporting period. |
| Updated Prospectus Phone Number |
1-888-826-5646
|
| Updated Prospectus Web Address |
https://www.sandscapital.com/document-library-mutual-funds/
|