Shareholder Report
Oct. 31, 2025
USD ($)
Holding
Shareholder Report |
12 Months Ended |
|---|---|
|
Oct. 31, 2025
USD ($)
Holding
| |
| Shareholder Report [Line Items] | |
| Document Type | N-CSR |
| Amendment Flag | false |
| Registrant Name | Advisors' Inner Circle Fund |
| Entity Central Index Key | 0000878719 |
| Entity Investment Company Type | N-1A |
| Document Period End Date | Oct. 31, 2025 |
| C000203678 | |
| Shareholder Report [Line Items] | |
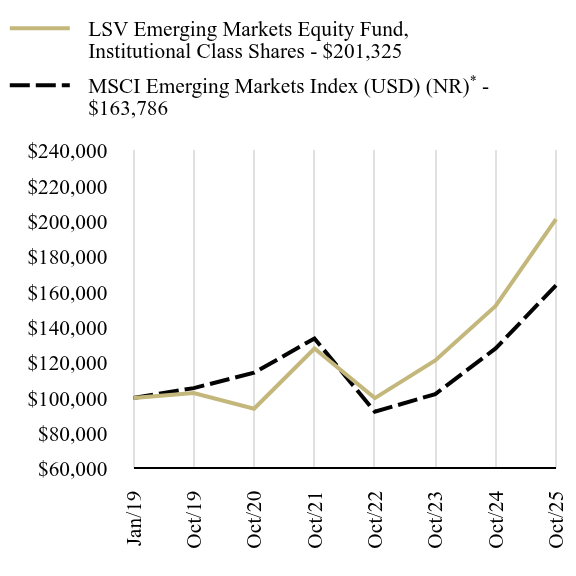
| Fund Name | LSV Emerging Markets Equity Fund |
| Class Name | Institutional Class Shares |
| Trading Symbol | LSVZX |
| Annual or Semi-Annual Statement [Text Block] | This annual shareholder report contains important information about Institutional Class Shares of the LSV Emerging Markets Equity Fund (the "Fund") for the period from November 1, 2024 to October 31, 2025. |
| Additional Information [Text Block] | You can find additional information about the Fund at https://www.lsvasset.com/emerging-markets-equity-fund/. You can also request this information by contacting us at 888-386-3578. |
| Additional Information Phone Number | 888-386-3578 |
| Additional Information Website | https://www.lsvasset.com/emerging-markets-equity-fund/ |
| Expenses [Text Block] | |
| Expenses Paid, Amount | $ 110 |
| Expense Ratio, Percent | 0.95% |
| Performance Past Does Not Indicate Future [Text] | Past performance is not indicative of future performance. |
| Line Graph [Table Text Block] | |
| Average Annual Return [Table Text Block] | |
| No Deduction of Taxes [Text Block] | The table and graph presented above do not reflect the deduction of taxes a shareholder would pay on Fund distributions or the redemption of Fund shares. |
| AssetsNet | $ 258,551,000 |
| Holdings Count | Holding | 269 |
| Advisory Fees Paid, Amount | $ 699 |
| InvestmentCompanyPortfolioTurnover | 27.00% |
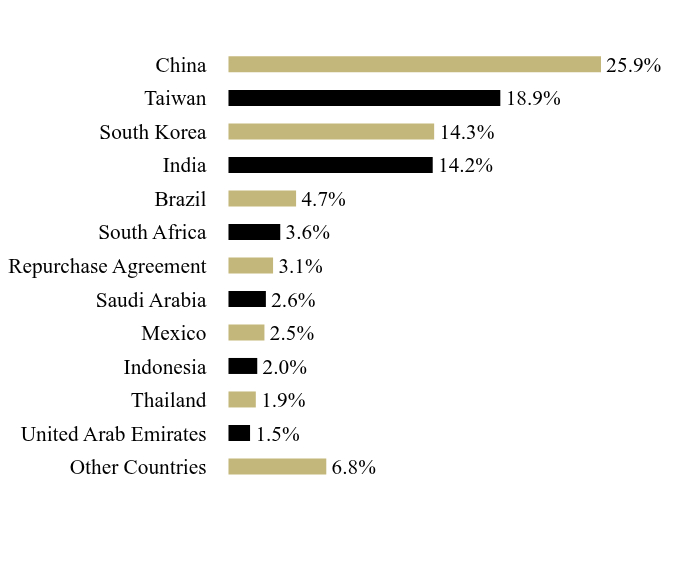
| Holdings [Text Block] | |
| Material Fund Change [Text Block] | |
| Updated Prospectus Phone Number | 888-386-3578 |
| Updated Prospectus Web Address | https://www.lsvasset.com/emerging-markets-equity-fund/ |
| C000203679 | |
| Shareholder Report [Line Items] | |
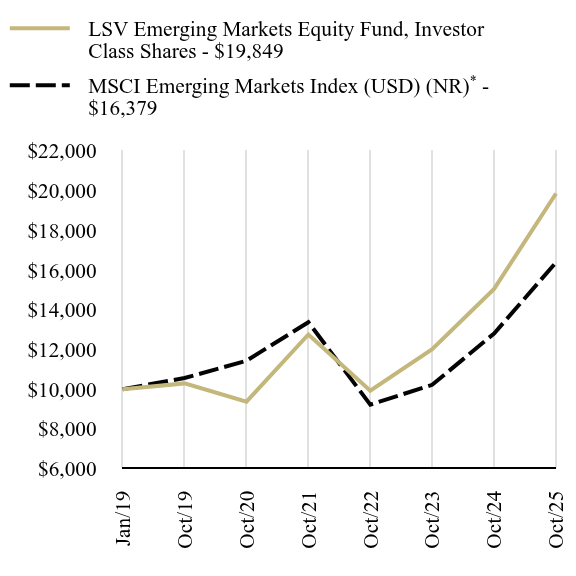
| Fund Name | LSV Emerging Markets Equity Fund |
| Class Name | Investor Class Shares |
| Trading Symbol | LVAZX |
| Annual or Semi-Annual Statement [Text Block] | This annual shareholder report contains important information about Investor Class Shares of the LSV Emerging Markets Equity Fund (the "Fund") for the period from November 1, 2024 to October 31, 2025. |
| Additional Information [Text Block] | You can find additional information about the Fund at https://www.lsvasset.com/emerging-markets-equity-fund/. You can also request this information by contacting us at 888-386-3578. |
| Additional Information Phone Number | 888-386-3578 |
| Additional Information Website | https://www.lsvasset.com/emerging-markets-equity-fund/ |
| Expenses [Text Block] | |
| Expenses Paid, Amount | $ 139 |
| Expense Ratio, Percent | 1.20% |
| Performance Past Does Not Indicate Future [Text] | Past performance is not indicative of future performance. |
| Line Graph [Table Text Block] | |
| Average Annual Return [Table Text Block] | |
| No Deduction of Taxes [Text Block] | The table and graph presented above do not reflect the deduction of taxes a shareholder would pay on Fund distributions or the redemption of Fund shares. |
| AssetsNet | $ 258,551,000 |
| Holdings Count | Holding | 269 |
| Advisory Fees Paid, Amount | $ 699 |
| InvestmentCompanyPortfolioTurnover | 27.00% |
| Holdings [Text Block] | |
| Material Fund Change [Text Block] | |
| Updated Prospectus Phone Number | 888-386-3578 |
| Updated Prospectus Web Address | https://www.lsvasset.com/emerging-markets-equity-fund/ |