Shareholder Report
|
12 Months Ended |
|
Oct. 31, 2025
USD ($)
Holding
|
|---|
| Shareholder Report [Line Items] |
|
| Document Type |
N-CSR
|
| Amendment Flag |
false
|
| Registrant Name |
Advisors' Inner Circle Fund III
|
| Entity Central Index Key |
0001593547
|
| Entity Investment Company Type |
N-1A
|
| Document Period End Date |
Oct. 31, 2025
|
| C000149725 |
|
| Shareholder Report [Line Items] |
|
| Fund Name |
MetLife Core Plus Fund
|
| Class Name |
I Class Shares
|
| Trading Symbol |
LPCIX
|
| Annual or Semi-Annual Statement [Text Block] |
This annual shareholder report contains important information about I Class Shares of the MetLife Core Plus Fund (the "Fund") for the period from November 1, 2024 to October 31, 2025.
|
| Additional Information [Text Block] |
You can find additional information about the Fund at https://investments.metlife.com/mutual-fund-documents/. You can also request this information by contacting us at 800-252-4993.
|
| Additional Information Phone Number |
800-252-4993
|
| Additional Information Website |
https://investments.metlife.com/mutual-fund-documents/
|
| Expenses [Text Block] |
What were the Fund costs for the last year?(based on a hypothetical $10,000 investment) Fund Name | Costs of a $10,000 investment | Costs paid as a percentage of a $10,000 investment |
|---|
MetLife Core Plus Fund, I Class Shares | $46 | 0.45% |
|---|
|
| Expenses Paid, Amount |
$ 46
|
| Expense Ratio, Percent |
0.45%
|
| Performance Past Does Not Indicate Future [Text] |
Past performance is not indicative of future performance.
|
| Line Graph [Table Text Block] |
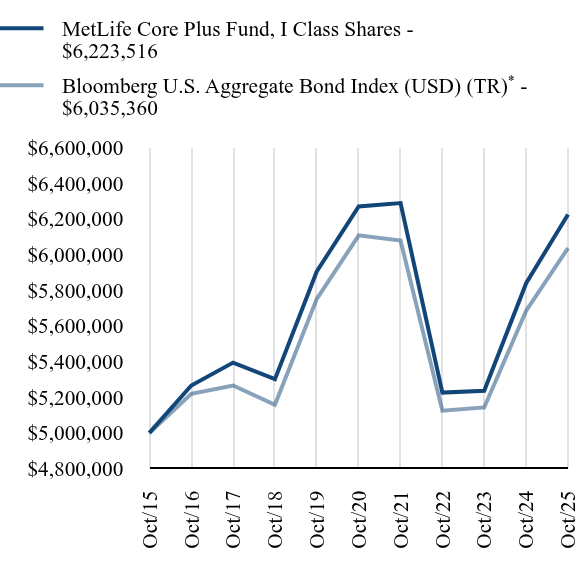
| MetLife Core Plus Fund, I Class Shares | Bloomberg U.S. Aggregate Bond Index (USD) (TR)Footnote Reference* |
|---|
Oct/15 | $5,000,000 | $5,000,000 |
|---|
Oct/16 | $5,265,825 | $5,218,525 |
|---|
Oct/17 | $5,393,993 | $5,265,611 |
|---|
Oct/18 | $5,300,816 | $5,157,485 |
|---|
Oct/19 | $5,904,360 | $5,751,077 |
|---|
Oct/20 | $6,268,913 | $6,106,914 |
|---|
Oct/21 | $6,287,435 | $6,077,723 |
|---|
Oct/22 | $5,225,909 | $5,124,584 |
|---|
Oct/23 | $5,235,797 | $5,142,825 |
|---|
Oct/24 | $5,838,609 | $5,685,201 |
|---|
Oct/25 | $6,223,516 | $6,035,360 |
|---|
|
| Average Annual Return [Table Text Block] |
Average Annual Total Returns as of October 31, 2025Fund/Index Name | 1 Year | 5 Years | 10 Years |
|---|
MetLife Core Plus Fund, I Class Shares | 6.59% | -0.15% | 2.21% |
|---|
Bloomberg U.S. Aggregate Bond Index (USD) (TR)Footnote Reference* | 6.16% | -0.24% | 1.90% |
|---|
|
| No Deduction of Taxes [Text Block] |
The table and graph presented do not reflect the deduction of taxes a shareholder would pay on Fund distributions or the redemption of Fund shares.
|
| AssetsNet |
$ 111,930,546
|
| Holdings Count | Holding |
359
|
| Advisory Fees Paid, Amount |
$ 35,116
|
| InvestmentCompanyPortfolioTurnover |
198.00%
|
| Holdings [Text Block] |
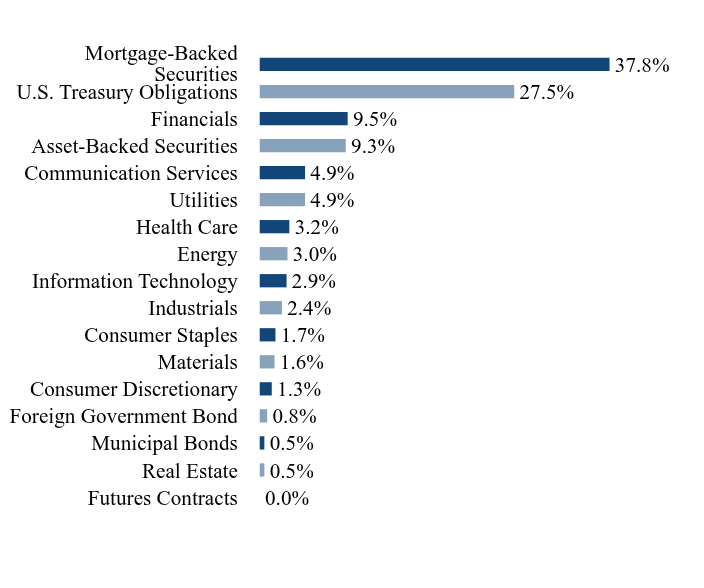
Asset/Sector WeightingsFootnote Reference*Value | Value |
|---|
Futures Contracts | 0.0% | Real Estate | 0.5% | Municipal Bonds | 0.5% | Foreign Government Bond | 0.8% | Consumer Discretionary | 1.3% | Materials | 1.6% | Consumer Staples | 1.7% | Industrials | 2.4% | Information Technology | 2.9% | Energy | 3.0% | Health Care | 3.2% | Utilities | 4.9% | Communication Services | 4.9% | Asset-Backed Securities | 9.3% | Financials | 9.5% | U.S. Treasury Obligations | 27.5% | Mortgage-Backed Securities | 37.8% |
| Footnote | Description | Footnote* | Percentages are calculated based on total net assets. |
Holding Name | | | Percentage of
Total Net Assets |
|---|
U.S. Treasury Notes, 3.50%, 10/15/2028 | | | 3.7% | U.S. Treasury Bonds, 4.75%, 5/15/2055 | | | 3.3% | U.S. Treasury Bonds, 4.88%, 8/15/2045 | | | 2.8% | U.S. Treasury Notes, 3.88%, 7/15/2028 | | | 2.6% | FNMA, 5.00%, 5/1/2055 | | | 2.3% | U.S. Treasury Notes, 3.63%, 10/31/2030 | | | 2.3% | U.S. Treasury Bonds, 3.00%, 2/15/2049 | | | 2.0% | U.S. Treasury Bonds, 3.13%, 5/15/2048 | | | 1.9% | U.S. Treasury Notes, 3.50%, 9/30/2027 | | | 1.7% | U.S. Treasury Notes, 3.38%, 9/15/2028 | | | 1.3% |
|
| Material Fund Change [Text Block] |
There were no material changes during the reporting period. |
| Updated Prospectus Phone Number |
800-252-4993
|
| Updated Prospectus Web Address |
https://investments.metlife.com/mutual-fund-documents/
|
| C000149726 |
|
| Shareholder Report [Line Items] |
|
| Fund Name |
MetLife Core Plus Fund
|
| Class Name |
R Class Shares
|
| Trading Symbol |
LPCYX
|
| Annual or Semi-Annual Statement [Text Block] |
This annual shareholder report contains important information about R Class Shares of the MetLife Core Plus Fund (the "Fund") for the period from November 1, 2024 to October 31, 2025.
|
| Additional Information [Text Block] |
You can find additional information about the Fund at https://investments.metlife.com/mutual-fund-documents/. You can also request this information by contacting us at 800-252-4993.
|
| Additional Information Phone Number |
800-252-4993
|
| Additional Information Website |
https://investments.metlife.com/mutual-fund-documents/
|
| Expenses [Text Block] |
What were the Fund costs for the last year?(based on a hypothetical $10,000 investment) Fund Name | Costs of a $10,000 investment | Costs paid as a percentage of a $10,000 investment |
|---|
MetLife Core Plus Fund, R Class Shares | $46 | 0.45% |
|---|
|
| Expenses Paid, Amount |
$ 46
|
| Expense Ratio, Percent |
0.45%
|
| Performance Past Does Not Indicate Future [Text] |
Past performance is not indicative of future performance.
|
| Line Graph [Table Text Block] |
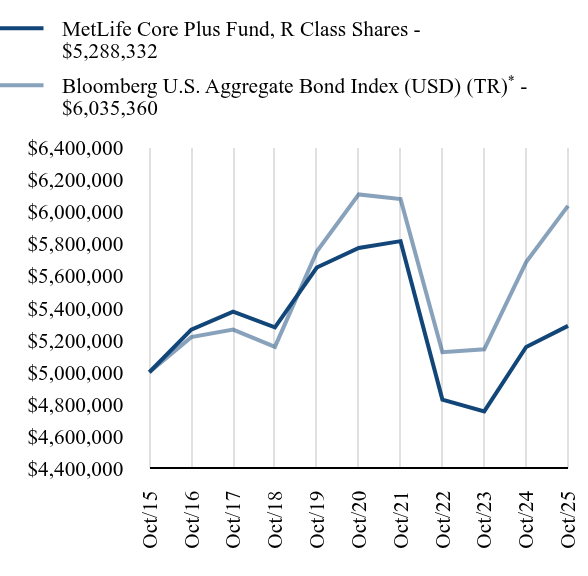
| MetLife Core Plus Fund, R Class Shares | Bloomberg U.S. Aggregate Bond Index (USD) (TR)Footnote Reference* |
|---|
Oct/15 | $5,000,000 | $5,000,000 |
|---|
Oct/16 | $5,265,484 | $5,218,525 |
|---|
Oct/17 | $5,377,625 | $5,265,611 |
|---|
Oct/18 | $5,279,193 | $5,157,485 |
|---|
Oct/19 | $5,651,579 | $5,751,077 |
|---|
Oct/20 | $5,773,256 | $6,106,914 |
|---|
Oct/21 | $5,815,998 | $6,077,723 |
|---|
Oct/22 | $4,829,658 | $5,124,584 |
|---|
Oct/23 | $4,756,458 | $5,142,825 |
|---|
Oct/24 | $5,157,223 | $5,685,201 |
|---|
Oct/25 | $5,288,332 | $6,035,360 |
|---|
|
| Average Annual Return [Table Text Block] |
Average Annual Total Returns as of October 31, 2025Fund/Index Name | 1 Year | 5 Years | 10 Years |
|---|
MetLife Core Plus Fund, R Class Shares | 2.54% | -1.74% | 0.56% |
|---|
Bloomberg U.S. Aggregate Bond Index (USD) (TR)Footnote Reference* | 6.16% | -0.24% | 1.90% |
|---|
|
| No Deduction of Taxes [Text Block] |
The table and graph presented do not reflect the deduction of taxes a shareholder would pay on Fund distributions or the redemption of Fund shares.
|
| AssetsNet |
$ 111,930,546
|
| Holdings Count | Holding |
359
|
| Advisory Fees Paid, Amount |
$ 35,116
|
| InvestmentCompanyPortfolioTurnover |
198.00%
|
| Holdings [Text Block] |
Asset/Sector WeightingsFootnote Reference*Value | Value |
|---|
Futures Contracts | 0.0% | Real Estate | 0.5% | Municipal Bonds | 0.5% | Foreign Government Bond | 0.8% | Consumer Discretionary | 1.3% | Materials | 1.6% | Consumer Staples | 1.7% | Industrials | 2.4% | Information Technology | 2.9% | Energy | 3.0% | Health Care | 3.2% | Utilities | 4.9% | Communication Services | 4.9% | Asset-Backed Securities | 9.3% | Financials | 9.5% | U.S. Treasury Obligations | 27.5% | Mortgage-Backed Securities | 37.8% |
| Footnote | Description | Footnote* | Percentages are calculated based on total net assets. |
Holding Name | | | Percentage of
Total Net Assets |
|---|
U.S. Treasury Notes, 3.50%, 10/15/2028 | | | 3.7% | U.S. Treasury Bonds, 4.75%, 5/15/2055 | | | 3.3% | U.S. Treasury Bonds, 4.88%, 8/15/2045 | | | 2.8% | U.S. Treasury Notes, 3.88%, 7/15/2028 | | | 2.6% | FNMA, 5.00%, 5/1/2055 | | | 2.3% | U.S. Treasury Notes, 3.63%, 10/31/2030 | | | 2.3% | U.S. Treasury Bonds, 3.00%, 2/15/2049 | | | 2.0% | U.S. Treasury Bonds, 3.13%, 5/15/2048 | | | 1.9% | U.S. Treasury Notes, 3.50%, 9/30/2027 | | | 1.7% | U.S. Treasury Notes, 3.38%, 9/15/2028 | | | 1.3% |
|
| Material Fund Change [Text Block] |
There were no material changes during the reporting period. |
| Updated Prospectus Phone Number |
800-252-4993
|
| Updated Prospectus Web Address |
https://investments.metlife.com/mutual-fund-documents/
|