Shareholder Report
|
12 Months Ended |
|
Oct. 31, 2025
USD ($)
Holding
|
|---|
| Shareholder Report [Line Items] |
|
| Document Type |
N-CSR
|
| Amendment Flag |
false
|
| Registrant Name |
Advisors' Inner Circle Fund III
|
| Entity Central Index Key |
0001593547
|
| Entity Investment Company Type |
N-1A
|
| Document Period End Date |
Oct. 31, 2025
|
| C000164187 |
|
| Shareholder Report [Line Items] |
|
| Fund Name |
PineBridge Dynamic Asset Allocation Fund
|
| Class Name |
Institutional Shares
|
| Trading Symbol |
PDAIX
|
| Annual or Semi-Annual Statement [Text Block] |
This annual shareholder report contains important information about Institutional Shares of the PineBridge Dynamic Asset Allocation Fund (the "Fund") for the period from November 1, 2024 to October 31, 2025.
|
| Additional Information [Text Block] |
You can find additional information about the Fund at https://www.pinebridge.com/en-us/intermediary/funds/pinebridge-dynamic-asset-allocation-fund/institutional. You can also request this information by contacting us at 877-225-4164.
|
| Additional Information Phone Number |
877-225-4164
|
| Additional Information Website |
https://www.pinebridge.com/en-us/intermediary/funds/pinebridge-dynamic-asset-allocation-fund/institutional
|
| Expenses [Text Block] |
What were the Fund costs for the last year?(based on a hypothetical $10,000 investment) Fund Name | Costs of a $10,000 investment | Costs paid as a percentage of a $10,000 investment |
|---|
PineBridge Dynamic Asset Allocation Fund, Institutional Shares | $81 | 0.75% |
|---|
|
| Expenses Paid, Amount |
$ 81
|
| Expense Ratio, Percent |
0.75%
|
| Factors Affecting Performance [Text Block] |
How did the Fund perform in the last year?As of October 2025, on a rolling one-year basis, the Fund delivered a gross return of 16.86%, exceeding its return objective of CPI + 5%. The Fund seeks to achieve CPI + 5% over rolling five-year periods while dynamically managing risk to the 60% MSCI ACWI / 40% Bloomberg Global Treasury risk budget across full market cycles. Our aim is to provide investors with a diversifying return stream that offers growth-like returns with lower volatility, helping to balance risk and return in their portfolios. At the start of the period, we maintained a constructive risk posture, supported by expectations of global economic easing, U.S. exceptionalism, and widening global growth gaps, alongside AI leadership and a pro-growth agenda. Toward the end of Q1, we reduced risk in our portfolio to a neutral level, acknowledging the heightened uncertainty around U.S. economic policy, where business-unfriendly trade and immigration measures may outweigh the delayed benefits of deregulation. With tariffs and labor market shifts threatening confidence and raising recession risk, we fine-tuned our asset allocation mix to reduce exposure to asset classes are more vulnerable in recessionary conditions in favor of those that are more resilient. With signs of financial easing, positive developments in fiscal stimulus and secular acceleration from AI investment emerging later in the period, we raised our preference for risk taking and shifted our asset class mix toward pockets of the market that stand to benefit from a cyclical reacceleration. This period’s strongest contributors were allocations aligned with enduring secular trends, particularly companies in the AI supply chain and those positioned to benefit from increased fiscal spending in Europe. Our U.S. Quality, Productivity Basket, China Internet Basket, and Energy Evolution Basket allocations target pockets of the market that are poised to benefit from accelerated AI investment and adoption, a theme reinforced by supportive earnings as businesses prioritize AI infrastructure to drive productivity. The German Fiscal Beneficiaries basket was another standout. This basket captures companies at the heart of Germany’s spending initiatives—industrial leaders driving infrastructure modernization, defense firms benefiting from elevated security budgets, and select sectors positioned for long-term competitiveness. Gold, a portfolio allocation since November 2023, continued to perform well amid concerns over U.S. central bank independence, a weaker dollar, and persistent geopolitical tensions. These drivers remained intact, while additional tailwinds—including a dovish Fed, signs of labor market softening, and government shutdown risks—further enhanced gold’s appeal as a defensive asset with growth-like characteristics. |
| Performance Past Does Not Indicate Future [Text] |
Past performance is not indicative of future performance.
|
| Line Graph [Table Text Block] |
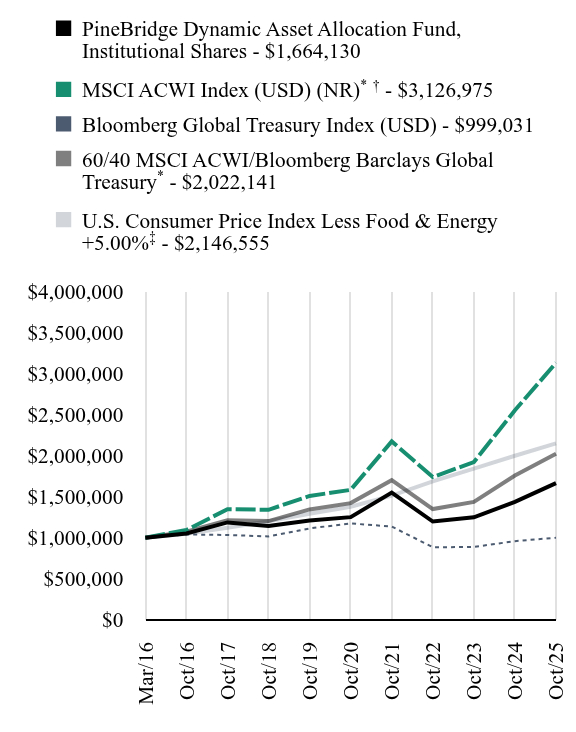
| PineBridge Dynamic Asset Allocation Fund, Institutional Shares | MSCI ACWI Index (USD) (NR)Footnote Reference*Footnote Reference† | Bloomberg Global Treasury Index (USD) | 60/40 MSCI ACWI/Bloomberg Barclays Global TreasuryFootnote Reference* | U.S. Consumer Price Index Less Food & Energy +5.00%Footnote Reference‡ |
|---|
Mar/16 | $1,000,000 | $1,000,000 | $1,000,000 | $1,000,000 | $1,000,000 |
|---|
Oct/16 | $1,051,000 | $1,092,513 | $1,039,138 | $1,071,540 | $1,047,878 |
|---|
Oct/17 | $1,185,455 | $1,346,008 | $1,032,859 | $1,212,545 | $1,119,706 |
|---|
Oct/18 | $1,142,825 | $1,339,040 | $1,015,064 | $1,202,096 | $1,200,735 |
|---|
Oct/19 | $1,207,541 | $1,507,645 | $1,112,479 | $1,343,555 | $1,289,832 |
|---|
Oct/20 | $1,249,371 | $1,581,335 | $1,173,393 | $1,420,281 | $1,376,048 |
|---|
Oct/21 | $1,548,480 | $2,170,815 | $1,135,512 | $1,699,606 | $1,510,503 |
|---|
Oct/22 | $1,196,173 | $1,737,579 | $883,119 | $1,347,967 | $1,685,286 |
|---|
Oct/23 | $1,248,054 | $1,920,058 | $887,179 | $1,435,540 | $1,840,584 |
|---|
Oct/24 | $1,434,729 | $2,549,660 | $957,356 | $1,756,159 | $1,996,760 |
|---|
Oct/25 | $1,664,130 | $3,126,975 | $999,031 | $2,022,141 | $2,146,555 |
|---|
|
| Average Annual Return [Table Text Block] |
Fund/Index Name | 1 Year | 5 Years | Annualized
Since
Inception |
|---|
PineBridge Dynamic Asset Allocation Fund, Institutional Shares | 15.99% | 5.90% | 5.41% |
|---|
MSCI ACWI Index (USD) (NR)Footnote Reference*Footnote Reference† | 22.64% | 14.61% | 12.51% |
|---|
Bloomberg Global Treasury Index (USD) | 4.35% | -3.17% | -0.01% |
|---|
60/40 MSCI ACWI/Bloomberg Barclays Global TreasuryFootnote Reference* | 15.15% | 7.32% | 7.55% |
|---|
U.S. Consumer Price Index Less Food & Energy +5.00%Footnote Reference‡ | 7.94% | 9.39% | 8.26% |
|---|
|
| No Deduction of Taxes [Text Block] |
The table and graph presented above do not reflect the deduction of taxes a shareholder would pay on Fund distributions or the redemption of Fund shares.
|
| AssetsNet |
$ 129,728,048
|
| Holdings Count | Holding |
725
|
| Advisory Fees Paid, Amount |
$ 320,830
|
| InvestmentCompanyPortfolioTurnover |
133.00%
|
| Additional Fund Statistics [Text Block] |
Key Fund Statistics as of October 31, 2025 | Total Net Assets | Number of Holdings | Total Advisory Fees Paid | Portfolio Turnover Rate |
|---|
| $129,728,048 | 725 | $320,830 | 133% |
|---|
|
| Holdings [Text Block] |
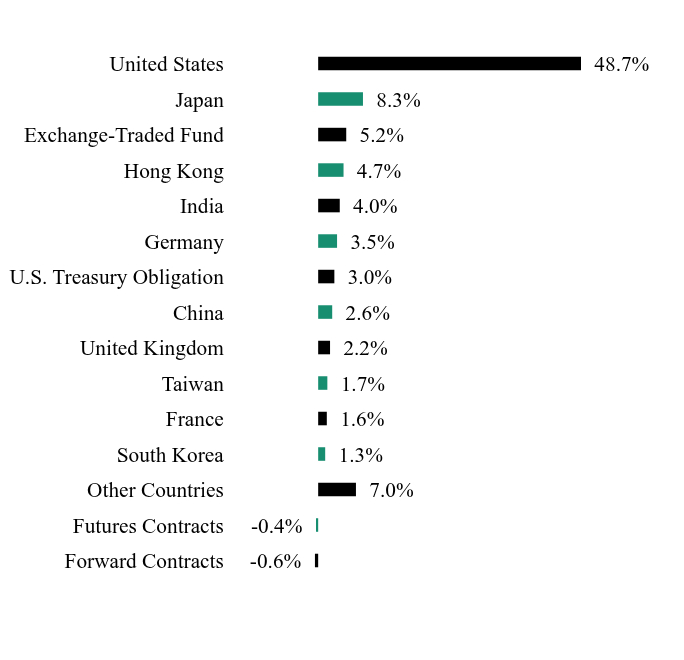
Country/Asset WeightingsFootnote Reference* Value | Value |
|---|
Forward Contracts | -0.6% | Futures Contracts | -0.4% | Other Countries | 7.0% | South Korea | 1.3% | France | 1.6% | Taiwan | 1.7% | United Kingdom | 2.2% | China | 2.6% | U.S. Treasury Obligation | 3.0% | Germany | 3.5% | India | 4.0% | Hong Kong | 4.7% | Exchange-Traded Fund | 5.2% | Japan | 8.3% | United States | 48.7% |
| Footnote | Description | Footnote* | Percentages are calculated based on total net assets. |
|
| Largest Holdings [Text Block] |
Holding Name | | | Percentage of
Total Net Assets |
|---|
NVIDIA | | | 5.6% | Invesco DB Precious Metals Fund | | | 5.1% | Microsoft | | | 4.0% | Apple | | | 3.1% | U.S. Treasury Bill, 3.98%, 11/12/2025 | | | 3.0% | Alphabet, Cl A | | | 2.3% | Amazon.com | | | 1.8% | JPMorgan Chase | | | 1.3% | Bank of America | | | 1.3% | Palo Alto Networks | | | 1.2% |
|
| Material Fund Change [Text Block] |
There were no material changes during the reporting period. |
| Updated Prospectus Phone Number |
877-225-4164
|
| Updated Prospectus Web Address |
https://www.pinebridge.com/en-us/intermediary/funds/pinebridge-dynamic-asset-allocation-fund/institutional
|
| C000164186 |
|
| Shareholder Report [Line Items] |
|
| Fund Name |
PineBridge Dynamic Asset Allocation Fund
|
| Class Name |
Investor Servicing Shares
|
| Trading Symbol |
PDAVX
|
| Annual or Semi-Annual Statement [Text Block] |
This annual shareholder report contains important information about Investor Servicing Shares of the PineBridge Dynamic Asset Allocation Fund (the "Fund") for the period from November 1, 2024 to October 31, 2025.
|
| Additional Information [Text Block] |
You can find additional information about the Fund at https://www.pinebridge.com/en-us/intermediary/funds/pinebridge-dynamic-asset-allocation-fund/institutional. You can also request this information by contacting us at 877-225-4164.
|
| Additional Information Phone Number |
877-225-4164
|
| Additional Information Website |
https://www.pinebridge.com/en-us/intermediary/funds/pinebridge-dynamic-asset-allocation-fund/institutional
|
| Expenses [Text Block] |
What were the Fund costs for the last year?(based on a hypothetical $10,000 investment) Fund Name | Costs of a $10,000 investment | Costs paid as a percentage of a $10,000 investment |
|---|
PineBridge Dynamic Asset Allocation Fund, Investor Servicing Shares | $97 | 0.90% |
|---|
|
| Expenses Paid, Amount |
$ 97
|
| Expense Ratio, Percent |
0.90%
|
| Factors Affecting Performance [Text Block] |
How did the Fund perform in the last year?As of October 2025, on a rolling one-year basis, the Fund delivered a gross return of 16.86%, exceeding its return objective of CPI + 5%. The Fund seeks to achieve CPI + 5% over rolling five-year periods while dynamically managing risk to the 60% MSCI ACWI / 40% Bloomberg Global Treasury risk budget across full market cycles. Our aim is to provide investors with a diversifying return stream that offers growth-like returns with lower volatility, helping to balance risk and return in their portfolios. At the start of the period, we maintained a constructive risk posture, supported by expectations of global economic easing, U.S. exceptionalism, and widening global growth gaps, alongside AI leadership and a pro-growth agenda. Toward the end of Q1, we reduced risk in our portfolio to a neutral level, acknowledging the heightened uncertainty around U.S. economic policy, where business-unfriendly trade and immigration measures may outweigh the delayed benefits of deregulation. With tariffs and labor market shifts threatening confidence and raising recession risk, we fine-tuned our asset allocation mix to reduce exposure to asset classes are more vulnerable in recessionary conditions in favor of those that are more resilient. With signs of financial easing, positive developments in fiscal stimulus and secular acceleration from AI investment emerging later in the period, we raised our preference for risk taking and shifted our asset class mix toward pockets of the market that stand to benefit from a cyclical reacceleration. This period’s strongest contributors were allocations aligned with enduring secular trends, particularly companies in the AI supply chain and those positioned to benefit from increased fiscal spending in Europe. Our U.S. Quality, Productivity Basket, China Internet Basket, and Energy Evolution Basket allocations target pockets of the market that are poised to benefit from accelerated AI investment and adoption, a theme reinforced by supportive earnings as businesses prioritize AI infrastructure to drive productivity. The German Fiscal Beneficiaries basket was another standout. This basket captures companies at the heart of Germany’s spending initiatives—industrial leaders driving infrastructure modernization, defense firms benefiting from elevated security budgets, and select sectors positioned for long-term competitiveness. Gold, a portfolio allocation since November 2023, continued to perform well amid concerns over U.S. central bank independence, a weaker dollar, and persistent geopolitical tensions. These drivers remained intact, while additional tailwinds—including a dovish Fed, signs of labor market softening, and government shutdown risks—further enhanced gold’s appeal as a defensive asset with growth-like characteristics. |
| Performance Past Does Not Indicate Future [Text] |
Past performance is not indicative of future performance.
|
| Line Graph [Table Text Block] |
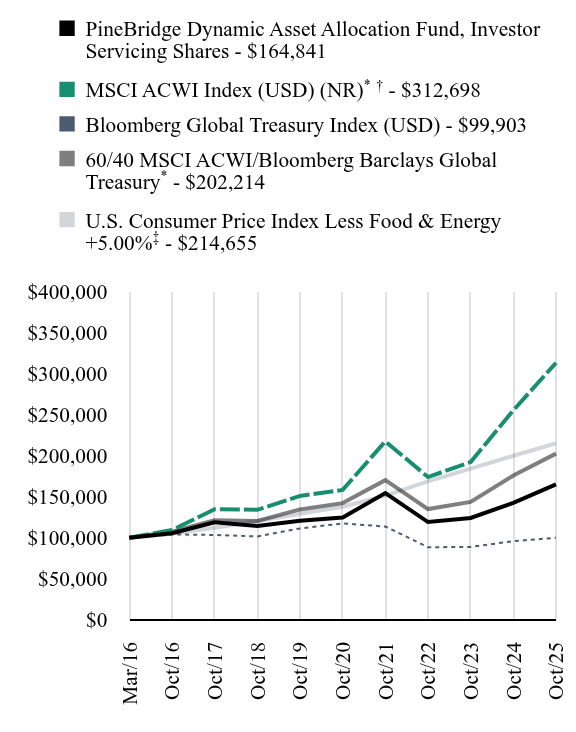
| PineBridge Dynamic Asset Allocation Fund, Investor Servicing Shares | MSCI ACWI Index (USD) (NR)Footnote Reference*Footnote Reference† | Bloomberg Global Treasury Index (USD) | 60/40 MSCI ACWI/Bloomberg Barclays Global TreasuryFootnote Reference* | U.S. Consumer Price Index Less Food & Energy +5.00%Footnote Reference‡ |
|---|
Mar/16 | $100,000 | $100,000 | $100,000 | $100,000 | $100,000 |
|---|
Oct/16 | $105,300 | $109,251 | $103,914 | $107,154 | $104,788 |
|---|
Oct/17 | $118,645 | $134,601 | $103,286 | $121,255 | $111,971 |
|---|
Oct/18 | $114,120 | $133,904 | $101,506 | $120,210 | $120,073 |
|---|
Oct/19 | $120,487 | $150,764 | $111,248 | $134,356 | $128,983 |
|---|
Oct/20 | $124,513 | $158,133 | $117,339 | $142,028 | $137,605 |
|---|
Oct/21 | $154,215 | $217,082 | $113,551 | $169,961 | $151,050 |
|---|
Oct/22 | $119,011 | $173,758 | $88,312 | $134,797 | $168,529 |
|---|
Oct/23 | $123,925 | $192,006 | $88,718 | $143,554 | $184,058 |
|---|
Oct/24 | $142,343 | $254,966 | $95,736 | $175,616 | $199,676 |
|---|
Oct/25 | $164,841 | $312,698 | $99,903 | $202,214 | $214,655 |
|---|
|
| Average Annual Return [Table Text Block] |
Fund/Index Name | 1 Year | 5 Years | Annualized
Since
Inception |
|---|
PineBridge Dynamic Asset Allocation Fund, Investor Servicing Shares | 15.81% | 5.77% | 5.30% |
|---|
MSCI ACWI Index (USD) (NR)Footnote Reference*Footnote Reference† | 22.64% | 14.61% | 12.51% |
|---|
Bloomberg Global Treasury Index (USD) | 4.35% | -3.17% | -0.01% |
|---|
60/40 MSCI ACWI/Bloomberg Barclays Global TreasuryFootnote Reference* | 15.15% | 7.32% | 7.55% |
|---|
U.S. Consumer Price Index Less Food & Energy +5.00%Footnote Reference‡ | 7.94% | 9.39% | 8.26% |
|---|
|
| No Deduction of Taxes [Text Block] |
The table and graph presented above do not reflect the deduction of taxes a shareholder would pay on Fund distributions or the redemption of Fund shares.
|
| AssetsNet |
$ 129,728,048
|
| Holdings Count | Holding |
725
|
| Advisory Fees Paid, Amount |
$ 320,830
|
| InvestmentCompanyPortfolioTurnover |
133.00%
|
| Additional Fund Statistics [Text Block] |
Key Fund Statistics as of October 31, 2025 | Total Net Assets | Number of Holdings | Total Advisory Fees Paid | Portfolio Turnover Rate |
|---|
| $129,728,048 | 725 | $320,830 | 133% |
|---|
|
| Holdings [Text Block] |
Country/Asset WeightingsFootnote Reference* Value | Value |
|---|
Forward Contracts | -0.6% | Futures Contracts | -0.4% | Other Countries | 7.0% | South Korea | 1.3% | France | 1.6% | Taiwan | 1.7% | United Kingdom | 2.2% | China | 2.6% | U.S. Treasury Obligation | 3.0% | Germany | 3.5% | India | 4.0% | Hong Kong | 4.7% | Exchange-Traded Fund | 5.2% | Japan | 8.3% | United States | 48.7% |
| Footnote | Description | Footnote* | Percentages are calculated based on total net assets. |
|
| Largest Holdings [Text Block] |
Holding Name | | | Percentage of
Total Net Assets |
|---|
NVIDIA | | | 5.6% | Invesco DB Precious Metals Fund | | | 5.1% | Microsoft | | | 4.0% | Apple | | | 3.1% | U.S. Treasury Bill, 3.98%, 11/12/2025 | | | 3.0% | Alphabet, Cl A | | | 2.3% | Amazon.com | | | 1.8% | JPMorgan Chase | | | 1.3% | Bank of America | | | 1.3% | Palo Alto Networks | | | 1.2% |
|
| Material Fund Change [Text Block] |
There were no material changes during the reporting period. |
| Updated Prospectus Phone Number |
877-225-4164
|
| Updated Prospectus Web Address |
https://www.pinebridge.com/en-us/intermediary/funds/pinebridge-dynamic-asset-allocation-fund/institutional
|