Shareholder Report
|
12 Months Ended |
|
Mar. 31, 2026
USD ($)
Holding
|
|---|
| Shareholder Report [Line Items] |
|
| Document Type |
N-CSR
|
| Amendment Flag |
false
|
| Registrant Name |
FORUM FUNDS
|
| Entity Central Index Key |
0000315774
|
| Entity Investment Company Type |
N-1A
|
| Document Period End Date |
Mar. 31, 2026
|
| C000081163 |
|
| Shareholder Report [Line Items] |
|
| Fund Name |
Beck Mack + Oliver Partners Fund
|
| Trading Symbol |
BMPEX
|
| Annual or Semi-Annual Statement [Text Block] |
This annual shareholder report contains important information about the Beck Mack + Oliver Partners Fund for the period of April 1, 2025, to March 31, 2026.
|
| Shareholder Report Annual or Semi-Annual |
Annual Shareholder Report
|
| Additional Information [Text Block] |
This annual shareholder report contains important information about the Beck Mack + Oliver Partners Fund for the period of April 1, 2025, to March 31, 2026. You can find additional information about the Fund at https://www.beckmack.com/products. You can also request this information by contacting us at (800) 943-6786.
|
| Additional Information Phone Number |
(800) 943-6786
|
| Additional Information Website |
https://www.beckmack.com/products
|
| Expenses [Text Block] |
What were the Fund's costs for the last year? (based on a hypothetical $10,000 investment) Table SummaryFund Name | Costs of a $10,000 investment | Costs paid as a percentage of a $10,000 investment |
|---|
Beck Mack + Oliver Partners Fund | $99 | 1.00% |
|---|
|
| Expenses Paid, Amount |
$ 99
|
| Expense Ratio, Percent |
1.00%
|
| Factors Affecting Performance [Text Block] |
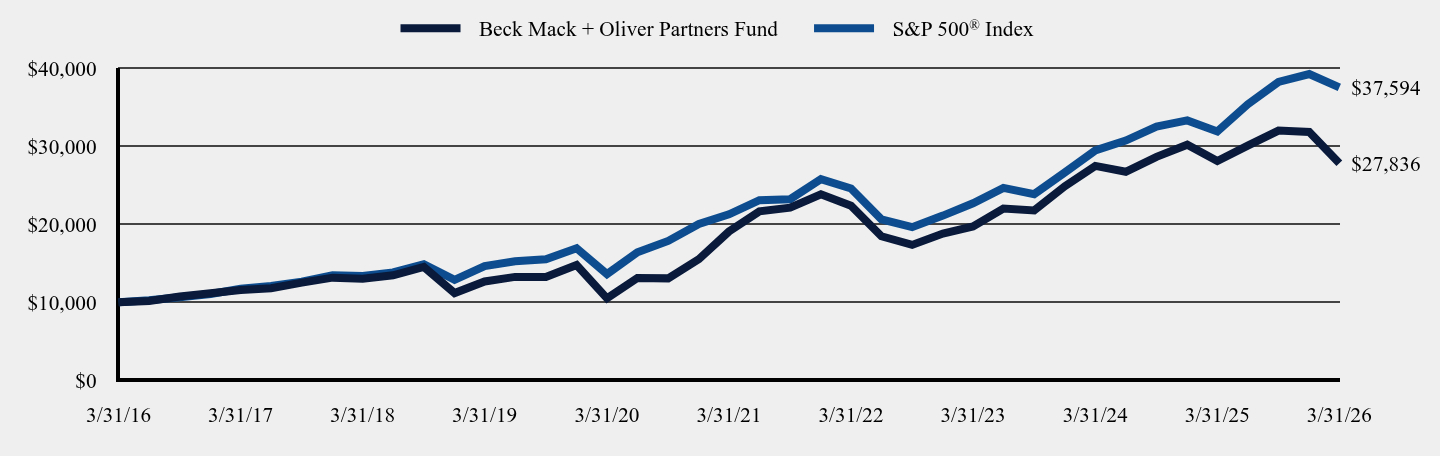
How did the Fund perform in the last year? During the fiscal year ended March 31, 2026 (the “Fiscal Year”), the Beck Mack + Oliver Partners Fund (the “Partners Fund”) returned -1.05% net of fees and expenses, resulting in a net asset value of $24.45. By comparison, the S&P 500 Index (the “S&P 500”), which is the Partners Fund’s principal benchmark, returned +17.80%. With respect to the underperformance of the Partners Fund relative to the S&P 500 during the Fiscal Year, our investment in Fiserv (“FISV”) detracted significantly from performance. At the beginning of 2025, FISV announced a new CEO, whom we researched intensely and about whom we arrived at a positive conclusion. Unfortunately, the performance of the underlying business was not as robust as we had previously underwritten, and we subsequently exited the position. In addition, two of the Partners Fund’s largest positions, Apollo Global Management (“APO”) and Blackstone (“BX”) substantially underperformed the S&P 500 during the Fiscal Year. We believe that the recent underperformance represents a temporary share price drawdown. Other positions that detracted from performance during the Fiscal Year include Arthur J. Gallagher, CoStar Group, and Roper Technologies. In all three instances, we believe the underlying investment thesis remains intact. Positive contributors to performance include Alphabet, Ferguson Enterprises, Hilton Worldwide Holdings, and Zurn Elkay Water Solutions. |
| Performance Past Does Not Indicate Future [Text] |
The Fund’s past performance is not a good predictor of how the Fund will perform in the future.
|
| Line Graph [Table Text Block] |
Table SummaryDate | Beck Mack + Oliver Partners Fund | S&P 500® Index |
|---|
3/31/16 | $10,000 | $10,000 |
|---|
6/30/16 | $10,145 | $10,246 |
|---|
9/30/16 | $10,724 | $10,640 |
|---|
12/31/16 | $11,151 | $11,047 |
|---|
3/31/17 | $11,545 | $11,717 |
|---|
6/30/17 | $11,781 | $12,079 |
|---|
9/30/17 | $12,501 | $12,620 |
|---|
12/31/17 | $13,143 | $13,459 |
|---|
3/31/18 | $13,019 | $13,357 |
|---|
6/30/18 | $13,447 | $13,815 |
|---|
9/30/18 | $14,528 | $14,881 |
|---|
12/31/18 | $11,161 | $12,869 |
|---|
3/31/19 | $12,659 | $14,625 |
|---|
6/30/19 | $13,244 | $15,255 |
|---|
9/30/19 | $13,233 | $15,514 |
|---|
12/31/19 | $14,772 | $16,921 |
|---|
3/31/20 | $10,485 | $13,605 |
|---|
6/30/20 | $13,109 | $16,399 |
|---|
9/30/20 | $13,053 | $17,864 |
|---|
12/31/20 | $15,519 | $20,034 |
|---|
3/31/21 | $19,080 | $21,271 |
|---|
6/30/21 | $21,663 | $23,089 |
|---|
9/30/21 | $22,141 | $23,224 |
|---|
12/31/21 | $23,847 | $25,785 |
|---|
3/31/22 | $22,391 | $24,599 |
|---|
6/30/22 | $18,466 | $20,638 |
|---|
9/30/22 | $17,351 | $19,631 |
|---|
12/31/22 | $18,814 | $21,115 |
|---|
3/31/23 | $19,713 | $22,698 |
|---|
6/30/23 | $22,012 | $24,682 |
|---|
9/30/23 | $21,773 | $23,874 |
|---|
12/31/23 | $24,888 | $26,665 |
|---|
3/31/24 | $27,495 | $29,480 |
|---|
6/30/24 | $26,743 | $30,743 |
|---|
9/30/24 | $28,668 | $32,553 |
|---|
12/31/24 | $30,227 | $33,337 |
|---|
3/31/25 | $28,132 | $31,913 |
|---|
6/30/25 | $30,102 | $35,405 |
|---|
9/30/25 | $32,038 | $38,281 |
|---|
12/31/25 | $31,867 | $39,298 |
|---|
3/31/26 | $27,836 | $37,594 |
|---|
|
| No Deduction of Taxes [Text Block] |
The graph and table do not reflect the deduction of taxes that a shareholder would pay on Fund distributions or redemption of Fund shares.
|
| Performance Table Market Index Changed [Text Block] |
|
| Updated Performance Information Location [Text Block] |
|
| AssetsNet |
$ 70,965,136
|
| Holdings Count | Holding |
25
|
| Advisory Fees Paid, Amount |
$ 348,149
|
| InvestmentCompanyPortfolioTurnover |
6.00%
|
| Additional Fund Statistics [Text Block] |
Table SummaryTotal Net Assets | $70,965,136 |
|---|
# of Portfolio Holdings | 25 |
|---|
Portfolio Turnover Rate | 6% |
|---|
Investment Advisory Fees (Net of fees waived)
| $348,149 |
|---|
|
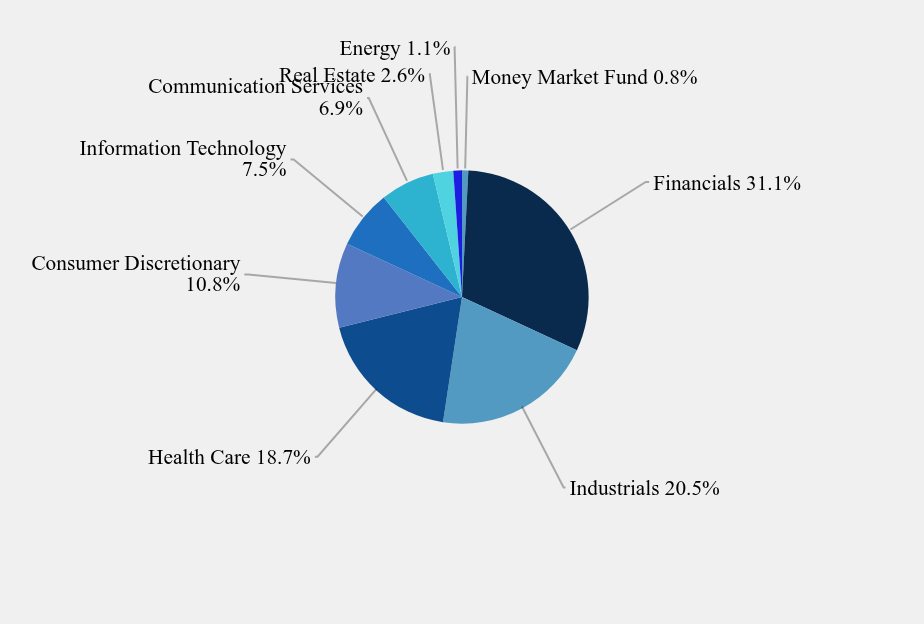
| Holdings [Text Block] |
Sector Weightings(% total investments)Table SummaryValue | Value |
|---|
Money Market Fund | 0.8% | Financials | 31.1% | Industrials | 20.5% | Health Care | 18.7% | Consumer Discretionary | 10.8% | Information Technology | 7.5% | Communication Services | 6.9% | Real Estate | 2.6% | Energy | 1.1% | |
| Largest Holdings [Text Block] |
Top Ten Holdings (% total investments)Table SummaryAlphabet, Inc., Class C | 6.88% |
|---|
Apollo Global Management, Inc. | 6.76% |
|---|
RadNet, Inc. | 6.31% |
|---|
Blackstone, Inc., Class A | 6.00% |
|---|
Ferguson Enterprises, Inc. | 5.59% |
|---|
Sunbelt Rentals Holdings, Inc. | 5.51% |
|---|
Microsoft Corp. | 5.48% |
|---|
Hilton Worldwide Holdings, Inc. | 5.15% |
|---|
Zurn Elkay Water Solutions Corp. | 5.06% |
|---|
Arthur J Gallagher & Co. | 4.89% |
|---|
|