Pay vs Performance Disclosure - USD ($)
|
12 Months Ended |
14 Months Ended |
21 Months Ended |
Dec. 31, 2025 |
Dec. 31, 2024 |
Dec. 31, 2023 |
Apr. 11, 2024 |
Jan. 31, 2023 |
Dec. 31, 2025 |
| Pay vs Performance Disclosure |
|
|
|
|
|
|
| Pay vs Performance Disclosure, Table |
| | | | | | | | | | | | | | | | | | | | | | | | | | | | | | | | | | | | | Summary Compensation Table Total for PEO(1) | | Compensation Actually Paid Total for PEO(2) | | | | | | Year | Tech(1) | Fong(1) | Hayes(1) | | Tech(2) | Fong(2) | Hayes(2) | Average Summary Comp Table Total for Non-PEO NEOs(3) | Average Compensation Actually Paid to Non-PEO NEOs(4) | Value of Initial Fixed $100 Investment Based On Total Shareholder Return(5) | Net Income (Loss)
(thousands)(6) | | (a) | (b) | (c) | (d) | | (e) | (f) | (g) | (h) | (i) | (j) | (k) | | 2025 | ― | ― | $ | 2,196,806 | | | ― | ― | $ | 4,385,633 | | $ | 596,714 | | $ | 782,559 | | $ | 69 | | $ | (26,027) | | | 2024 | ― | $ | 2,082,483 | | $ | 2,197,306 | | | ― | $ | 505,982 | | $ | 1,948,521 | | $ | 882,724 | | $ | 666,021 | | $ | 40 | | $ | (70,489) | | | 2023 | $ | 1,889,652 | | $ | 1,317,900 | | ― | | $ | 2,230,876 | | $ | 391,456 | | ― | $ | 800,430 | | $ | 646,216 | | $ | 60 | | $ | (65,831) | |
|
|
|
|
|
|
| Named Executive Officers, Footnote |
Mr. Tech served as CEO of the Company from December 2021 until February 1, 2023. Mr. Fong served as CEO of the Company from February 1, 2023 until April 12, 2024. Mr. Hayes has served as our CEO since April 12, 2024. Amounts reported in columns (b), (c), and (d) represent the total compensation reported for Messrs. Tech, Fong, and Hayes for each corresponding year in the “Total” column of the Summary Compensation Table, as applicable.The dollar amounts reported in column (h) represent the average of the amounts reported for the Company’s non-PEO NEOs as a group in the “Total” column of the Summary Compensation Table in each applicable year. The non-PEO NEOs included for the purposes of calculating the average amounts in each applicable year are as follows: (1) for 2025, Thomas J. Cimino, Sarah Weber Wells, and Jonathan M. Norling; (2) for 2024, Sarah Weber Wells and Jonathan M. Norling; and (3) for 2023, Sarah Weber Wells, Donald Klein, Jonathan M. Norling, and Stacey Constas.
|
|
|
|
|
|
| Adjustment To PEO Compensation, Footnote |
The dollar amounts reported in columns (e), (f), and (g) represent the amount of CAP to Mr. Hayes in 2025, Messrs. Hayes and Fong in 2024, and Messrs. Fong and Tech in 2023, in each case as computed in accordance with Item 402(v) of Regulation S-K. The dollar amounts may not reflect the actual amount of compensation earned by or paid to Messrs. Hayes, Fong, or Tech during the applicable year. In accordance with the requirements of Item 402(v) of Regulation S-K, the following adjustments were made to average total compensation for Mr. Hayes for 2025 to determine CAP: | | | | | | | | | | | | | | | | | | | | | | | | | | | | | | | | | | | PEO (Hayes) | | PEO (Fong) | | PEO (Tech) | | | | 2025 | 2024 | | 2024 | | 2023 | | 2023 | | | Total Compensation for CEO as reported SCT for the covered year | | $ | 2,196,806 | | $ | 2,197,306 | | | $ | 2,082,483 | | | $ | 1,317,900 | | | $ | 1,889,652 | | | Subtract grant date fair value of equity awards reported in the “Stock Awards” and “Option Awards” columns of the Summary Compensation Table for the covered fiscal year | | 894,806 | | 1,070,431 | | | 1,007,591 | | | — | | | — | | | Add fair values as of the end of the covered fiscal year of all equity awards granted during the covered fiscal year that are outstanding and unvested as of the end of such covered fiscal year | | 2,743,714 | | 847,792 | | | — | | | — | | | — | | | Add the change in fair value (whether positive or negative) as of the end of the covered fiscal year (from the end of the prior fiscal year) of any equity awards granted in any prior fiscal year that are outstanding and unvested as of the end of such covered fiscal year | | 408,236 | | — | | | — | | | (862,463) | | | — | | | Add the fair value as of the vesting date of any equity awards granted during the covered fiscal year that vested during the covered fiscal year
| | (68,317) | | (26,146) | | | (18,749) | | | (63,982) | | | 341,224 | | | | | | | | | | | | | | Subtract the fair value of any equity awards granted in a prior fiscal year that failed to meet the applicable vesting conditions in the covered fiscal year determined as of the end of the prior fiscal year
| | — | | — | | | 825,717 | | | — | | | — | | | Add the average value of dividends or other earnings paid on equity awards during the covered fiscal year that are not otherwise reflected in fair value or total compensation
| | — | | — | | | — | | | — | | | — | | | | Compensation Actually Paid to CEO | | $ | 4,385,633 | | $ | 1,948,521 | | | $ | 505,982 | | | $ | 391,456 | | | $ | 2,230,876 | | |
|
|
|
|
|
|
| Non-PEO NEO Average Total Compensation Amount |
$ 596,714
|
$ 882,724
|
$ 800,430
|
|
|
|
| Non-PEO NEO Average Compensation Actually Paid Amount |
$ 782,559
|
666,021
|
646,216
|
|
|
|
| Adjustment to Non-PEO NEO Compensation Footnote |
The dollar amounts reported in column (i) represent the average amount of CAP to the non-PEO NEOs as a group, as computed in accordance with Item 402(v) of Regulation S-K. The dollar amounts may not reflect the actual average amount of compensation earned by or paid to the non-PEO NEOs as a group during the applicable year. In accordance with the requirements of Item 402(v) of Regulation S-K, the following adjustments were made to average total compensation for the non-PEO NEOs as a group for 2025 to determine CAP:: | | | | | | | | | | | | | | | | | | | | | | | NEO Average | | | 2025 | | 2024 | | 2023 | | Total Compensation for CEO as reported SCT for the covered year | | $ | 596,714 | | | $ | 882,724 | | | $ | 800,430 | | Subtract grant date fair value of equity awards reported in the “Stock Awards” and “Option Awards” columns of the Summary Compensation Table for the covered fiscal year | | (231,143) | | | (430,852) | | | (208,123) | | Add fair values as of the end of the covered fiscal year of all equity awards granted during the covered fiscal year that are outstanding and unvested as of the end of such covered fiscal year | | 492,882 | | | 353,489 | | | 138,539 | | Add the change in fair value (whether positive or negative) as of the end of the covered fiscal year (from the end of the prior fiscal year) of any equity awards granted in any prior fiscal year that are outstanding and unvested as of the end of such covered fiscal year | | 96,956 | | | (106,328) | | | (57,880) | | | | | | | | | Add the change in fair value (whether positive or negative) as of the vesting date (from the end of the prior fiscal year) of any equity awards granted in any prior fiscal year for which all applicable vesting conditions were satisfied during the covered fiscal year | | (33,243) | | | (33,012) | | | (26,750) | | Subtract the fair value of any equity awards granted in a prior fiscal year that failed to meet the applicable vesting conditions in the covered fiscal year determined as of the end of the prior fiscal year
| | (139,607) | | | — | | | — | | | | | | | | | | Compensation Actually Paid to CEO | | $ | 782,559 | | | $ | 666,021 | | | $ | 646,216 | |
|
|
|
|
|
|
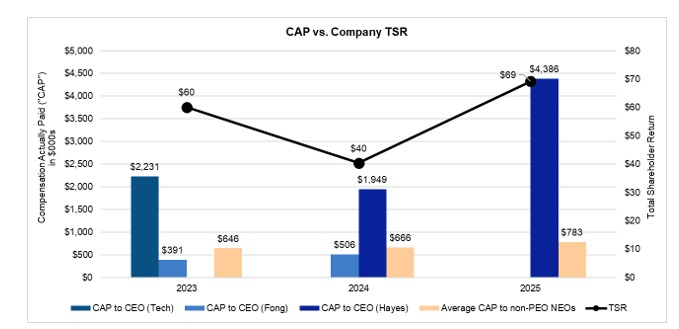
| Compensation Actually Paid vs. Total Shareholder Return |
The relationship between (1) CAP to the PEO and the average CAP to the non-PEO NEOs and (2) cumulative TSR on the common stock of the Company for the last three fiscal years is shown in the graphic below.
|
|
|
|
|
|
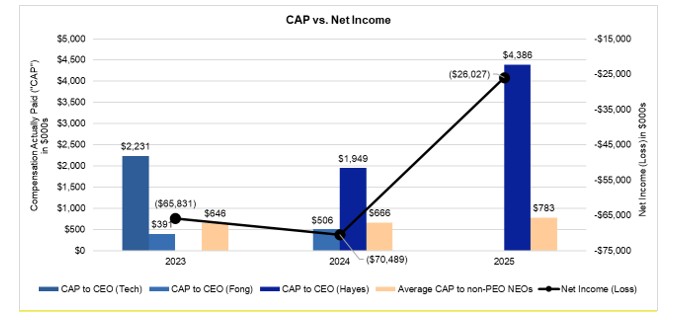
| Compensation Actually Paid vs. Net Income |
The relationship between (1) CAP to the PEO and the average of CAP to the non-PEO NEOs and (2) the net income of the Company for the last three fiscal years is shown in the graphic below.
|
|
|
|
|
|
| Total Shareholder Return Amount |
$ 69
|
40
|
60
|
|
|
|
| Net Income (Loss) |
$ (26,027,000)
|
(70,489,000)
|
(65,831,000)
|
|
|
|
| Additional 402(v) Disclosure |
Cumulative total shareholder return (“TSR”) is calculated by dividing the sum of the cumulative amount of dividends for the measurement period, assuming dividend reinvestment, and the difference between the Company’s share price at the end and the beginning of the measurement period by the Company’s share price at the beginning of the measurement period.The dollar amounts reported represent the amount of net income (loss) reflected in the Company’s audited financial statements for the applicable fiscal year.
|
|
|
|
|
|
| Hayes [Member] |
|
|
|
|
|
|
| Pay vs Performance Disclosure |
|
|
|
|
|
|
| PEO Total Compensation Amount |
$ 2,196,806
|
2,197,306
|
|
|
|
|
| PEO Actually Paid Compensation Amount |
4,385,633
|
1,948,521
|
|
|
|
|
| PEO Name |
|
|
|
|
|
Hayes
|
| Fong [Member] |
|
|
|
|
|
|
| Pay vs Performance Disclosure |
|
|
|
|
|
|
| PEO Total Compensation Amount |
|
2,082,483
|
1,317,900
|
|
|
|
| PEO Actually Paid Compensation Amount |
|
505,982
|
391,456
|
|
|
|
| PEO Name |
|
|
|
Fong
|
|
|
| Tech [Member] |
|
|
|
|
|
|
| Pay vs Performance Disclosure |
|
|
|
|
|
|
| PEO Total Compensation Amount |
|
|
1,889,652
|
|
|
|
| PEO Actually Paid Compensation Amount |
|
|
2,230,876
|
|
|
|
| PEO Name |
|
|
|
|
Tech
|
|
| PEO | Hayes [Member] | Aggregate Grant Date Fair Value of Equity Award Amounts Reported in Summary Compensation Table |
|
|
|
|
|
|
| Pay vs Performance Disclosure |
|
|
|
|
|
|
| Adjustment to Compensation, Amount |
(894,806)
|
(1,070,431)
|
|
|
|
|
| PEO | Hayes [Member] | Year-end Fair Value of Equity Awards Granted in Covered Year that are Outstanding and Unvested |
|
|
|
|
|
|
| Pay vs Performance Disclosure |
|
|
|
|
|
|
| Adjustment to Compensation, Amount |
2,743,714
|
847,792
|
|
|
|
|
| PEO | Hayes [Member] | Vesting Date Fair Value of Equity Awards Granted and Vested in Covered Year |
|
|
|
|
|
|
| Pay vs Performance Disclosure |
|
|
|
|
|
|
| Adjustment to Compensation, Amount |
(68,317)
|
(26,146)
|
|
|
|
|
| PEO | Hayes [Member] | Change in Fair Value as of Vesting Date of Prior Year Equity Awards Vested in Covered Year |
|
|
|
|
|
|
| Pay vs Performance Disclosure |
|
|
|
|
|
|
| Adjustment to Compensation, Amount |
408,236
|
|
|
|
|
|
| PEO | Fong [Member] | Aggregate Grant Date Fair Value of Equity Award Amounts Reported in Summary Compensation Table |
|
|
|
|
|
|
| Pay vs Performance Disclosure |
|
|
|
|
|
|
| Adjustment to Compensation, Amount |
|
(1,007,591)
|
|
|
|
|
| PEO | Fong [Member] | Vesting Date Fair Value of Equity Awards Granted and Vested in Covered Year |
|
|
|
|
|
|
| Pay vs Performance Disclosure |
|
|
|
|
|
|
| Adjustment to Compensation, Amount |
|
(18,749)
|
(63,982)
|
|
|
|
| PEO | Fong [Member] | Change in Fair Value as of Vesting Date of Prior Year Equity Awards Vested in Covered Year |
|
|
|
|
|
|
| Pay vs Performance Disclosure |
|
|
|
|
|
|
| Adjustment to Compensation, Amount |
|
|
(862,463)
|
|
|
|
| PEO | Fong [Member] | Prior Year End Fair Value of Equity Awards Granted in Any Prior Year that Fail to Meet Applicable Vesting Conditions During Covered Year |
|
|
|
|
|
|
| Pay vs Performance Disclosure |
|
|
|
|
|
|
| Adjustment to Compensation, Amount |
|
(825,717)
|
|
|
|
|
| PEO | Tech [Member] | Vesting Date Fair Value of Equity Awards Granted and Vested in Covered Year |
|
|
|
|
|
|
| Pay vs Performance Disclosure |
|
|
|
|
|
|
| Adjustment to Compensation, Amount |
|
|
341,224
|
|
|
|
| Non-PEO NEO | Aggregate Grant Date Fair Value of Equity Award Amounts Reported in Summary Compensation Table |
|
|
|
|
|
|
| Pay vs Performance Disclosure |
|
|
|
|
|
|
| Adjustment to Compensation, Amount |
(231,143)
|
(430,852)
|
(208,123)
|
|
|
|
| Non-PEO NEO | Year-end Fair Value of Equity Awards Granted in Covered Year that are Outstanding and Unvested |
|
|
|
|
|
|
| Pay vs Performance Disclosure |
|
|
|
|
|
|
| Adjustment to Compensation, Amount |
492,882
|
353,489
|
138,539
|
|
|
|
| Non-PEO NEO | Vesting Date Fair Value of Equity Awards Granted and Vested in Covered Year |
|
|
|
|
|
|
| Pay vs Performance Disclosure |
|
|
|
|
|
|
| Adjustment to Compensation, Amount |
96,956
|
(106,328)
|
(57,880)
|
|
|
|
| Non-PEO NEO | Change in Fair Value as of Vesting Date of Prior Year Equity Awards Vested in Covered Year |
|
|
|
|
|
|
| Pay vs Performance Disclosure |
|
|
|
|
|
|
| Adjustment to Compensation, Amount |
(33,243)
|
$ (33,012)
|
$ (26,750)
|
|
|
|
| Non-PEO NEO | Prior Year End Fair Value of Equity Awards Granted in Any Prior Year that Fail to Meet Applicable Vesting Conditions During Covered Year |
|
|
|
|
|
|
| Pay vs Performance Disclosure |
|
|
|
|
|
|
| Adjustment to Compensation, Amount |
$ (139,607)
|
|
|
|
|
|