Pay vs Performance Disclosure - USD ($)
Dec. 31, 2025
Dec. 31, 2024
Dec. 31, 2023
Dec. 31, 2022
Dec. 31, 2021
Year | Summary Compensation Table Total for PEO | Compensation Actually Paid to PEO | Average Summary Compensation Table Total for Non-PEO NEOs | Average Compensation Actually Paid to Non-PEO NEOs | Value of Initial Fixed $100 Investment Based On: | Net Income (in thousands) | Home Closings Revenue (in thousands) | |
Total Shareholder Return | Peer Group Total Shareholder Return | |||||||
(a) | (b) | (c) | (d) | (e) | (f) | (g) | (h) | (i) |
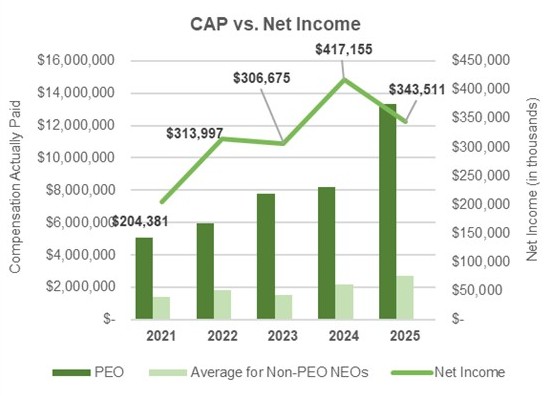
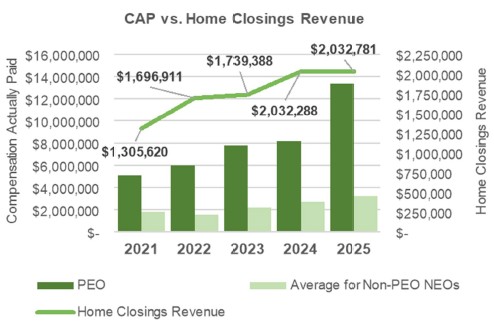
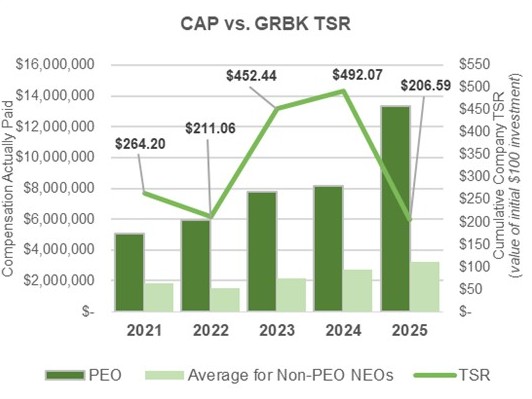
2025 | $13,400,745 | $13,343,379 | $3,218,280 | $3,231,877 | $206.59 | $189.23 | $343,511 | $2,032,781 |
2024 | $8,175,587 | $8,175,587 | $2,701,873 | $2,721,165 | $492.07 | $242.76 | $417,155 | $2,032,288 |
2023 | $7,759,877 | $7,759,877 | $2,146,469 | $2,181,195 | $452.44 | $220.06 | $306,675 | $1,739,388 |
2022 | $5,960,838 | $5,960,838 | $1,538,111 | $1,538,410 | $211.06 | $136.96 | $313,997 | $1,696,911 |
2021 | $5,087,182 | $5,087,182 | $1,814,672 | $1,814,672 | $264.20 | $192.00 | $204,381 | $1,305,620 |
respective years shown.
Column (d). The following non-PEO named executive officers are included in the average figures shown for the 2020 and 2021 covered years: Richard A. Costello and Jed Dolson; for the 2023 and 2024 covered years: Richard A. Costello, Jed Dolson and Neal Suit; for the 2025 covered
years: Richard A. Costello, Jeffery Cox, Jed Dolson, Neal Suit and Bobby L. Samuel III.
periods ending on December 31 of each of 2025, 2024, 2023, 2022 and 2021, respectively.
forth in column (b), adjusted as set forth in the table below, as determined in accordance with SEC rules. The dollar amounts reflected in
column (c) do not reflect the actual amount of compensation earned by or paid to our PEO during the applicable year. For information regarding
decisions made by our Compensation Committee with respect to the PEO’s compensation for each fiscal year, please see the “Compensation
Discussion and Analysis” section of this proxy statement and the proxy statement for the 2025, 2024 and 2023 annual meeting of stockholders
and the “Executive Compensation Information” section of the proxy statement for the 2021 annual meeting of stockholders.
Year PEO | 2021 Mr. Brickman | 2022 Mr. Brickman | 2023 Mr. Brickman | 2024 Mr. Brickman | 2025 Mr. Brickman |
SCT Total Compensation ($) | $5,087,182 | $5,960,838 | $7,759,877 | $8,175,587 | $13,400,745 |
Less: Stock and Option Award Values Reported in SCT for the Covered Year on Grant Date ($) | $1,225,000 | $1,349,988 | $3,100,497 | $3,146,000 | $7,643,096 |
Plus: Fair Value of Stock Awards Granted and Vested in the Covered Year (on Vest Date) | $1,225,000 | $1,349,988 | $3,100,497 | $3,146,000 | $3,433,843 |
Fair Value for Stock and Option Awards Granted in the Covered Year at Year-End ($) | - | - | - | - | $4,151,887 |
Change in Fair Value of Outstanding Unvested Stock and Option Awards from Prior Years ($) | - | - | - | - | - |
Change in Fair Value of Stock and Option Awards from Prior Years that Vested in the Covered Year ($) | - | - | - | - | - |
Less: Fair Value of Stock and Option Awards Forfeited during the Covered Year ($) | - | - | - | - | - |
Compensation Actually Paid ($) | $5,087,182 | $5,960,838 | $7,759,877 | $8,175,587 | $13,343,379 |
column (d), adjusted as set forth in the table below, as determined in accordance with SEC rules. The dollar amounts reflected in column (e) do
not reflect the actual amount of compensation earned by or paid to our non-PEO NEOs during the applicable year. For information regarding
the decisions made by our Compensation Committee with respect to the non-PEO NEOs’ compensation for each fiscal year, please see the
“Compensation Discussion and Analysis” section of this proxy statement and the proxy statement for the 2025, 2024, 2023 and 2022 annual
meeting of stockholders and the “Executive Compensation Information” section of the proxy statement for the 2021 annual meetings of
stockholders.
Year | 2021 | 2022 | 2023 | 2024 | 2025 |
Non-PEO NEOs | See column (d) note | See column (d) note | See column (d) note | See column (d) note | See column (d) note |
SCT Total Compensation ($) | $1,814,672 | $1,538,111 | $2,146,469 | $2,701,873 | $3,218,280 |
Less: Stock and Option Award Values Reported in SCT for the Covered Year ($) | $499,325 | $524,336 | $780,807 | $888,444 | $1,640,109 |
Plus: Fair Value of Stock Awards Granted and Vested in the Covered Year (on Vest Date) | $499,325 | $524,336 | $734,153 | $888,444 | $735,837 |
Fair Value for Stock and Option Awards Granted in the Covered Year at Year-End ($) | - | $299 | $73,409 | - | $892,339 |
Change in Fair Value of Outstanding Unvested Stock and Option Awards from Prior Years ($) | - | - | $7,971 | $19,292 | $25,530 |
Change in Fair Value of Stock and Option Awards from Prior Years that Vested in the Covered Year ($) | - | - | - | - | - |
Less: Fair Value of Stock and Option Awards Forfeited during the Covered Year ($) | - | - | - | - | - |
Compensation Actually Paid ($) | $1,814,672 | $1,538,410 | $2,181,195 | $2,721,165 | $3,231,877 |
Measure | Nature | Explanation |
Earnings Per Share | Financial measure | Metric of profitability on a per share basis, which includes the effect of all dilutive securities. |
Home Closings Revenue Growth | Financial measure | Increase, period over period, in revenue from home closings. |
Homebuilding Gross Margin | Financial measure | Homebuilding gross margin is calculated as Home Closings Revenue minus Cost of Homebuilding units. |
Return on Assets | Financial measure | Return on assets is calculated by dividing net income by total assets. |
ending on December 31 of each of 2025, 2024, 2023, 2022 and 2021, respectively.
Column (h). Reflects “Net Income” in our consolidated income statements included in our Annual Reports on Form 10-K for each of the years ended December 31, 2025, 2024, 2023, 2022 and 2021.
Column (i). Company-selected Measure is Home Closings Revenue Growth, which is described below.