Pay vs Performance Disclosure - USD ($)
Dec. 31, 2025
Dec. 31, 2024
Dec. 31, 2023
| Year (A) | Summary
Compensation Table Total for PEO - T. Wittenschlaeger ($) (1) (b1) | Summary
Compensation Table Total for PEO - J. Silverman ($) (2) (b2) | Compensation
Actually Paid to PEO - T. Wittenschlaeger ($) (3) (c1) | Compensation
Actually Paid to PEO - J. Silverman ($) (3) (c2) | Average Summary Compensation Table Total for Non-PEO Named Executive Officers ($) (4) (d) | Average Compensation Actually Paid to Non-PEO Named Executive Officers ($) (5) (e) | Value of Initial Fixed $100 Investment Based On: Total Stockholder Return ($) (6) (f) | Net Loss ($) (7) (h) | ||||||||||||||||||||||||
| 2025 | $ | $ | 1,678,206 | $ | $ | 1,678,206 | $ | 862,228 | $ | 896,968 | $ | 1.23 | $ | 21,089,145 | ||||||||||||||||||
| 2024 | $ | $ | 460,132 | $ | $ | 460,132 | $ | 371,048 | $ | 357,798 | $ | 5.06 | $ | 1,755,479 | ||||||||||||||||||
| 2023 | $ | $ | 280,996 | $ | $ | 201,052 | $ | 302,667 | $ | 324,667 | $ | 12.72 | $ | 34,160,455 | ||||||||||||||||||
| (4) | For the years ended December 31, 2025 and 2024, our non-PEO Named Executive Officers (“Non-PEO Named Executive Officers”) as shown in Column (d), were Gilbert Villarreal and Joseph Ramelli. For the year ended December 31, 2023, our non-PEO Named Executive Officer was David Hollingsworth. For the year ended December 31, 2022, our Non-PEO Named Executive Officers were Curt Smith, Richard Perley and David Hollingsworth. |
| Year | Less: Grant Date Fair Value of Equity Awards (a) | Plus: Year-End Fair Value of Unvested Awards Granted During the Year (b) | Plus: Year-Over-Year Change in Fair Value of Unvested Awards (c) | Plus: Vesting Date Fair Value of Current Year Awards Vesting During the Year (d) | Plus: Change in Fair Value of Prior Year Awards Vesting During the Year (e) | Total Adjustments | ||||||||||||||||||
| 2025 | $ | (1,378,206 | ) | $ | $ | $ | 1,378,206 | $ | $ | |||||||||||||||
| 2024 | $ | (180,132 | ) | $ | $ | $ | 180,132 | $ | $ | |||||||||||||||
| 2023 | $ | (148,000 | ) | $ | 7,192 | $ | $ | 60,864 | $ | $ | (79,944 | ) | ||||||||||||
| (a) | Subtract the grant date fair values of the equity awards reported in the “Option Awards” column of the Summary Compensation Table for the covered fiscal year. |
| (b) | Add the fair values as of the end of the covered fiscal year of all equity awards granted during the fiscal year that are outstanding and unvested as of the end of the fiscal year. |
| (c) | Add the change in fair value as of the end of the covered fiscal year of any equity awards granted in any prior fiscal year that are outstanding and unvested as of the end of the fiscal year. |
| (d) | Add, for awards that are granted and vest in the same fiscal year, the fair value as of the vesting date. |
| (e) | Add the change in fair value as of the vesting date of any awards granted in any prior fiscal year for which all applicable vesting conditions were satisfied at the end of or during the covered fiscal year. |
| Year | Less: Grant Date Fair Value of Equity Awards (a) | Plus: Year-End Fair Value of Unvested Awards Granted During the Year (b) | Plus: Year-Over-Year Change in Fair Value of Unvested Awards (c) | Plus: Vesting Date Fair Value of Current Year Awards Vesting During the Year (d) | Plus: Change in Fair Value of Prior Year Awards Vesting During the Year (e) | Total Adjustments | ||||||||||||||||||
| 2025 | $ | (69,480 | ) | $ | $ | $ | 69,480 | $ | $ | |||||||||||||||
| 2024 | $ | $ | $ | $ | $ | (13,250 | ) | $ | (13,250 | ) | ||||||||||||||
| 2023 | $ | $ | $ | 22,000 | $ | $ | $ | 22,000 | ||||||||||||||||
2023: David Hollingsworth
2024: David Hollingsworth
2025: Gilbert Villarreal and Joseph Ramelli
| (a) | Subtract the grant date fair values of the equity awards reported in the “Option Awards” column of the Summary Compensation Table for the covered fiscal year. |
| (b) | Add the fair values as of the end of the covered fiscal year of all equity awards granted during the fiscal year that are outstanding and unvested as of the end of the fiscal year. |
| (c) | Add the change in fair value as of the end of the covered fiscal year of any equity awards granted in any prior fiscal year that are outstanding and unvested as of the end of the fiscal year. |
| (d) | Add, for awards that are granted and vest in the same fiscal year, the fair value as of the vesting date. |
| (e) | Add the change in fair value as of the vesting date of any awards granted in any prior fiscal year for which all applicable vesting conditions were satisfied at the end of or during the covered fiscal year. |
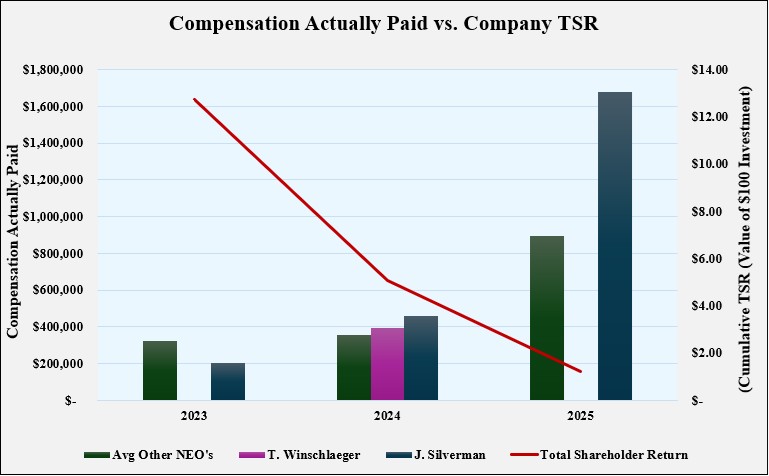
Compensation Actually Paid and Cumulative TSR
The following graph shows the relationship of “compensation actually paid” to our PEOs and Non-PEO Named Executive Officers in 2025, 2024, and 2023 to the cumulative TSR of the Company assuming an initial investment of $100.
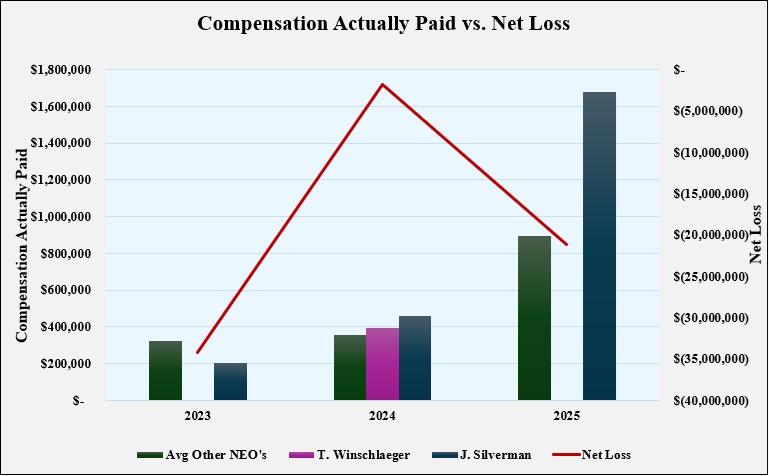
Compensation Actually Paid and Net (Loss) Income
The following graph shows the relationship of “compensation actually paid” to our PEOs and Non-PEO Named Executive Officers in 2025, 2024, and 2023 to the Company’s net loss.
| [1] | For the years ended December 31, 2025 and 2024, our non-PEO Named Executive Officers (“Non-PEO Named Executive Officers”) as shown in Column (d), were Gilbert Villarreal and Joseph Ramelli. For the year ended December 31, 2023, our non-PEO Named Executive Officer was David Hollingsworth. For the year ended December 31, 2022, our Non-PEO Named Executive Officers were Curt Smith, Richard Perley and David Hollingsworth. |
| [2] | The amounts disclosed in Column (e) reflect the adjustments listed in the table below to the total amount reported in the SCT for Non-PEO Named Executive Officers. Equity values are calculated in accordance with FASB ASC Topic 718. The table below summarizes the adjustments to the total amount reported in the SCT for Non-PEO Named Executive Officers in calculating CAP: |
| [3] | The Company’s cumulative TSR, as indicated in Column (f), assumes $100 was invested in the Company for the period starting January 1, 2023, through the end of each listed year. We did not pay dividends during this period. |
| [4] | Net Income presented in Column (h) reflects “Net Loss” in the Company’s Consolidated Statements of Operations included in the Company’s Annual Reports on Form 10-K for each of the years ended December 31, 2025, 2024, and 2023. |
| [5] | The amount listed in Column (b1) indicates all compensation received by Thomas Wittenschlaeger in 2022. Mr. Wittenschlaeger joined the Company as PEO in 2021. Mr. Wittenschlaeger was not a PEO of the Company in 2023 and 2024. |
| [6] | The amounts disclosed in Columns (c1) and (c2) reflect the adjustments listed in the tables below to the total amount reported in the SCT for the PEOs. Equity values are calculated in accordance with FASB ASC Topic 718. The tables below summarize the adjustments to the total amount reported in the SCT for the PEOs in calculating CAP: |
| [7] | The amount listed in Column (b2) indicates all compensation received by Joshua Silverman in 2023 and 2024. Mr. Silverman joined the Company as PEO at the departure of Thomas Wittenschlaeger in 2023. |
| [8] | Subtract the grant date fair values of the equity awards reported in the “Option Awards” column of the Summary Compensation Table for the covered fiscal year. |
| [9] | Add the fair values as of the end of the covered fiscal year of all equity awards granted during the fiscal year that are outstanding and unvested as of the end of the fiscal year. |
| [10] | Add the change in fair value as of the end of the covered fiscal year of any equity awards granted in any prior fiscal year that are outstanding and unvested as of the end of the fiscal year. |
| [11] | Add, for awards that are granted and vest in the same fiscal year, the fair value as of the vesting date. |
| [12] | Add the change in fair value as of the vesting date of any awards granted in any prior fiscal year for which all applicable vesting conditions were satisfied at the end of or during the covered fiscal year. |
| [13] | Subtract the grant date fair values of the equity awards reported in the “Option Awards” column of the Summary Compensation Table for the covered fiscal year. |
| [14] | Add the fair values as of the end of the covered fiscal year of all equity awards granted during the fiscal year that are outstanding and unvested as of the end of the fiscal year. |
| [15] | Add the change in fair value as of the end of the covered fiscal year of any equity awards granted in any prior fiscal year that are outstanding and unvested as of the end of the fiscal year. |
| [16] | Add, for awards that are granted and vest in the same fiscal year, the fair value as of the vesting date. |
| [17] | Add the change in fair value as of the vesting date of any awards granted in any prior fiscal year for which all applicable vesting conditions were satisfied at the end of or during the covered fiscal year. |