Pay vs Performance Disclosure - USD ($)
Feb. 01, 2026
Feb. 02, 2025
Jan. 28, 2024
Jan. 29, 2023
Jan. 30, 2022
Pay Versus Performance
As required by Section 953(a) of the Dodd-Frank Wall Street Reform and Consumer Protection Act and Item 402(v) of Regulation S-K, we are providing the following pay versus performance table to illustrate the relationship between executive compensation actually paid and certain of the Company’s financial performance measures. For information regarding the Company’s pay-for-performance philosophy and how the Company aligns executive compensation with its performance, refer to the Compensation Discussion and Analysis section above.
Fiscal Year (a) | Summary Compensation Table (“SCT”) Total for Principal Executive Officer (“PEO”) (b)(1) | Compensation Actually Paid (“CAP”) to PEO (c)(2) | Average SCT Total for non-PEO NEOs (d)(1) | Average CAP to non-PEO NEOs (e)(2) | Value of Initial Fixed $100 Investment Based On: | |||||||||||||||||||||
Total Shareholder Return (“TSR”) (f)(3) | Peer Group TSR (g)(4) | Net Income (Loss)(7) (in millions) (h)(5) | Net Sales(7) (in millions) (i)(6) | |||||||||||||||||||||||
2025 | $25,721,751 | $13,941,635 | $5,596,468 | $(20,186,443) | $28.59 | $206.33 | $222.8 | $12,601.5 | ||||||||||||||||||
2024 | $29,738,828 | $80,467,604 | $11,745,207 | $26,694,754 | $147.04 | $145.07 | $392.7 | $11,861.3 | ||||||||||||||||||
2023 | $35,186,195 | $32,600,316 | $3,821,594 | $1,288,780 | $73.10 | $76.96 | $39.6 | $11,147.7 | ||||||||||||||||||
2022 | $2,481,735 | $(2,550,628) | $896,717 | $(984,632) | $173.18 | $84.41 | $49.9 | $10,119.0 | ||||||||||||||||||
2021 | $12,450,338 | $(85,796,398) | $2,242,415 | $(32,080,908) | $165.79 | $168.83 | $(75.2) | $8,967.4 | ||||||||||||||||||
(1) | Included in column (b) are the total compensation amounts reported in the Summary Compensation Table for Mr. Singh, our PEO for each of the fiscal years presented. Included in column (d) are the average total compensation amounts for non-PEO NEOs reported in the Summary Compensation Table. Our non-PEO NEOs for fiscal years 2021 and 2022 include Mr. Marte, Mr. Mehta and Ms. Helfrick. Our non-PEO NEOs for Fiscal Year 2023 include Mr. Marte, Mr. Mehta, Ms. Helfrick, Ms. Bowman and Mr. Morant. Our non-PEO NEOs for Fiscal Year 2024 include Mr. Reeder, Mr. Mehta and Ms. Bowman. Our non-PEO NEOs for Fiscal Year 2025 include Mr. Reeder, Mr. Mehta and Mr. Billings. |
(2) | Included in columns (c) and (e) are CAP and average CAP to the PEO and the non-PEO NEOs, respectively, for each of the fiscal years presented. To calculate CAP and average CAP, amounts in columns (b) and (d) are adjusted in accordance with Item 402(v) of Regulation S-K requirements and are presented in the tables below. These amounts do not reflect the actual amount of compensation earned by or paid to the PEO and our non-PEO NEOs for each of the fiscal years presented. |
PEO SCT to CAP Reconciliation | |||||||||||||||||
Fiscal Year | |||||||||||||||||
2025 | 2024 | 2023 | 2022 | 2021 | |||||||||||||
SCT Total | $25,721,751 | $29,738,828 | $35,186,195 | $2,481,735 | $12,450,338 | ||||||||||||
Less value of Stock Awards reported in SCT | (20,004,002) | (23,889,477) | (31,048,358) | — | (10,106,250) | ||||||||||||
Plus year-end fair value of outstanding and unvested equity awards granted in the year | 17,911,965 | 50,724,245 | 31,209,397 | — | 5,493,750 | ||||||||||||
Plus (less) year over year change in fair value of outstanding and unvested equity awards granted in prior years | (4,259,758) | 9,427,335 | — | 854,397 | (64,828,925) | ||||||||||||
Plus (less) year over year change in fair value of equity awards granted in prior years that vested in the year | (5,428,321) | 8,340,381 | (2,746,918) | (5,886,760) | (28,805,311) | ||||||||||||
Plus fair value as of vesting date of equity awards granted and vested in the year | — | 6,126,292 | — | — | — | ||||||||||||
CAP Total | $13,941,635 | $80,467,604 | $32,600,316 | $(2,550,628) | $(85,796,398) | ||||||||||||
Average of Non-PEO NEOs SCT to CAP Reconciliation | |||||||||||||||||
Fiscal Year | |||||||||||||||||
2025 | 2024 | 2023 | 2022 | 2021 | |||||||||||||
SCT Total | $5,596,468 | $11,745,207 | $3,821,594 | $896,717 | $2,242,415 | ||||||||||||
Less value of Stock Awards reported in SCT | (5,012,522) | (10,537,614) | (3,284,969) | — | (1,347,500) | ||||||||||||
Plus year-end fair value of outstanding and unvested equity awards granted in the year | 1,533,418 | 17,445,330 | 1,412,899 | — | 732,500 | ||||||||||||
Plus (less) year over year change in fair value of outstanding and unvested equity awards granted in prior years | (2,869,310) | 642,118 | (61,656) | 279,816 | (23,338,392) | ||||||||||||
Plus (less) year over year change in fair value of equity awards granted in prior years that vested in the year | (435,203) | 520,322 | (723,564) | (2,161,165) | (10,369,931) | ||||||||||||
Plus fair value as of vesting date of equity awards granted and vested in the year | — | 7,206,596 | 173,563 | — | — | ||||||||||||
Less prior year-end fair value for any equity awards forfeited in the year | (18,999,294) | (327,205) | (49,087) | — | — | ||||||||||||
CAP Total | $(20,186,443) | $26,694,754 | $1,288,780 | $(984,632) | $(32,080,908) | ||||||||||||
(3) | Based on an initial fixed investment of $100 on January 29, 2021, the last business day of our 2020 fiscal year. |
(4) | Represents the Dow Jones Internet Commerce Index, which we consider to be our peer group under Regulation S-K Item 201(e), as presented in our 2025 Annual Report. Based on an initial fixed investment of $100 on January 29, 2021, the last business day of our 2020 fiscal year. TSR is weighted according to each peer company’s stock market capitalization at the beginning of each period for which a return is indicated. |
(5) | Represents our net income (loss) amounts for each of the years presented as reported in the respective annual report on Form 10-K. |
(6) | We have selected net sales as our most important financial measure (that is not otherwise required to be disclosed in the table) used to link the CAP of our NEOs to company performance for Fiscal Year 2025. |
(7) | Consistent with the Company's Annual Report on Form 10-K for Fiscal Year 2025, the Company has updated historical comparative periods to reflect the operations of Chewy Pharmacy KY beginning with the Company's 2021 Fiscal Year. Any historical comparatives prior to Fiscal Year 2021 are consistent with previously reported financial information. |
(1) | Included in column (b) are the total compensation amounts reported in the Summary Compensation Table for Mr. Singh, our PEO for each of the fiscal years presented. Included in column (d) are the average total compensation amounts for non-PEO NEOs reported in the Summary Compensation Table. Our non-PEO NEOs for fiscal years 2021 and 2022 include Mr. Marte, Mr. Mehta and Ms. Helfrick. Our non-PEO NEOs for Fiscal Year 2023 include Mr. Marte, Mr. Mehta, Ms. Helfrick, Ms. Bowman and Mr. Morant. Our non-PEO NEOs for Fiscal Year 2024 include Mr. Reeder, Mr. Mehta and Ms. Bowman. Our non-PEO NEOs for Fiscal Year 2025 include Mr. Reeder, Mr. Mehta and Mr. Billings. |
(4) | Represents the Dow Jones Internet Commerce Index, which we consider to be our peer group under Regulation S-K Item 201(e), as presented in our 2025 Annual Report. Based on an initial fixed investment of $100 on January 29, 2021, the last business day of our 2020 fiscal year. TSR is weighted according to each peer company’s stock market capitalization at the beginning of each period for which a return is indicated. |
(2) | Included in columns (c) and (e) are CAP and average CAP to the PEO and the non-PEO NEOs, respectively, for each of the fiscal years presented. To calculate CAP and average CAP, amounts in columns (b) and (d) are adjusted in accordance with Item 402(v) of Regulation S-K requirements and are presented in the tables below. These amounts do not reflect the actual amount of compensation earned by or paid to the PEO and our non-PEO NEOs for each of the fiscal years presented. |
PEO SCT to CAP Reconciliation | |||||||||||||||||
Fiscal Year | |||||||||||||||||
2025 | 2024 | 2023 | 2022 | 2021 | |||||||||||||
SCT Total | $25,721,751 | $29,738,828 | $35,186,195 | $2,481,735 | $12,450,338 | ||||||||||||
Less value of Stock Awards reported in SCT | (20,004,002) | (23,889,477) | (31,048,358) | — | (10,106,250) | ||||||||||||
Plus year-end fair value of outstanding and unvested equity awards granted in the year | 17,911,965 | 50,724,245 | 31,209,397 | — | 5,493,750 | ||||||||||||
Plus (less) year over year change in fair value of outstanding and unvested equity awards granted in prior years | (4,259,758) | 9,427,335 | — | 854,397 | (64,828,925) | ||||||||||||
Plus (less) year over year change in fair value of equity awards granted in prior years that vested in the year | (5,428,321) | 8,340,381 | (2,746,918) | (5,886,760) | (28,805,311) | ||||||||||||
Plus fair value as of vesting date of equity awards granted and vested in the year | — | 6,126,292 | — | — | — | ||||||||||||
CAP Total | $13,941,635 | $80,467,604 | $32,600,316 | $(2,550,628) | $(85,796,398) | ||||||||||||
(2) | Included in columns (c) and (e) are CAP and average CAP to the PEO and the non-PEO NEOs, respectively, for each of the fiscal years presented. To calculate CAP and average CAP, amounts in columns (b) and (d) are adjusted in accordance with Item 402(v) of Regulation S-K requirements and are presented in the tables below. These amounts do not reflect the actual amount of compensation earned by or paid to the PEO and our non-PEO NEOs for each of the fiscal years presented. |
Average of Non-PEO NEOs SCT to CAP Reconciliation | |||||||||||||||||
Fiscal Year | |||||||||||||||||
2025 | 2024 | 2023 | 2022 | 2021 | |||||||||||||
SCT Total | $5,596,468 | $11,745,207 | $3,821,594 | $896,717 | $2,242,415 | ||||||||||||
Less value of Stock Awards reported in SCT | (5,012,522) | (10,537,614) | (3,284,969) | — | (1,347,500) | ||||||||||||
Plus year-end fair value of outstanding and unvested equity awards granted in the year | 1,533,418 | 17,445,330 | 1,412,899 | — | 732,500 | ||||||||||||
Plus (less) year over year change in fair value of outstanding and unvested equity awards granted in prior years | (2,869,310) | 642,118 | (61,656) | 279,816 | (23,338,392) | ||||||||||||
Plus (less) year over year change in fair value of equity awards granted in prior years that vested in the year | (435,203) | 520,322 | (723,564) | (2,161,165) | (10,369,931) | ||||||||||||
Plus fair value as of vesting date of equity awards granted and vested in the year | — | 7,206,596 | 173,563 | — | — | ||||||||||||
Less prior year-end fair value for any equity awards forfeited in the year | (18,999,294) | (327,205) | (49,087) | — | — | ||||||||||||
CAP Total | $(20,186,443) | $26,694,754 | $1,288,780 | $(984,632) | $(32,080,908) | ||||||||||||
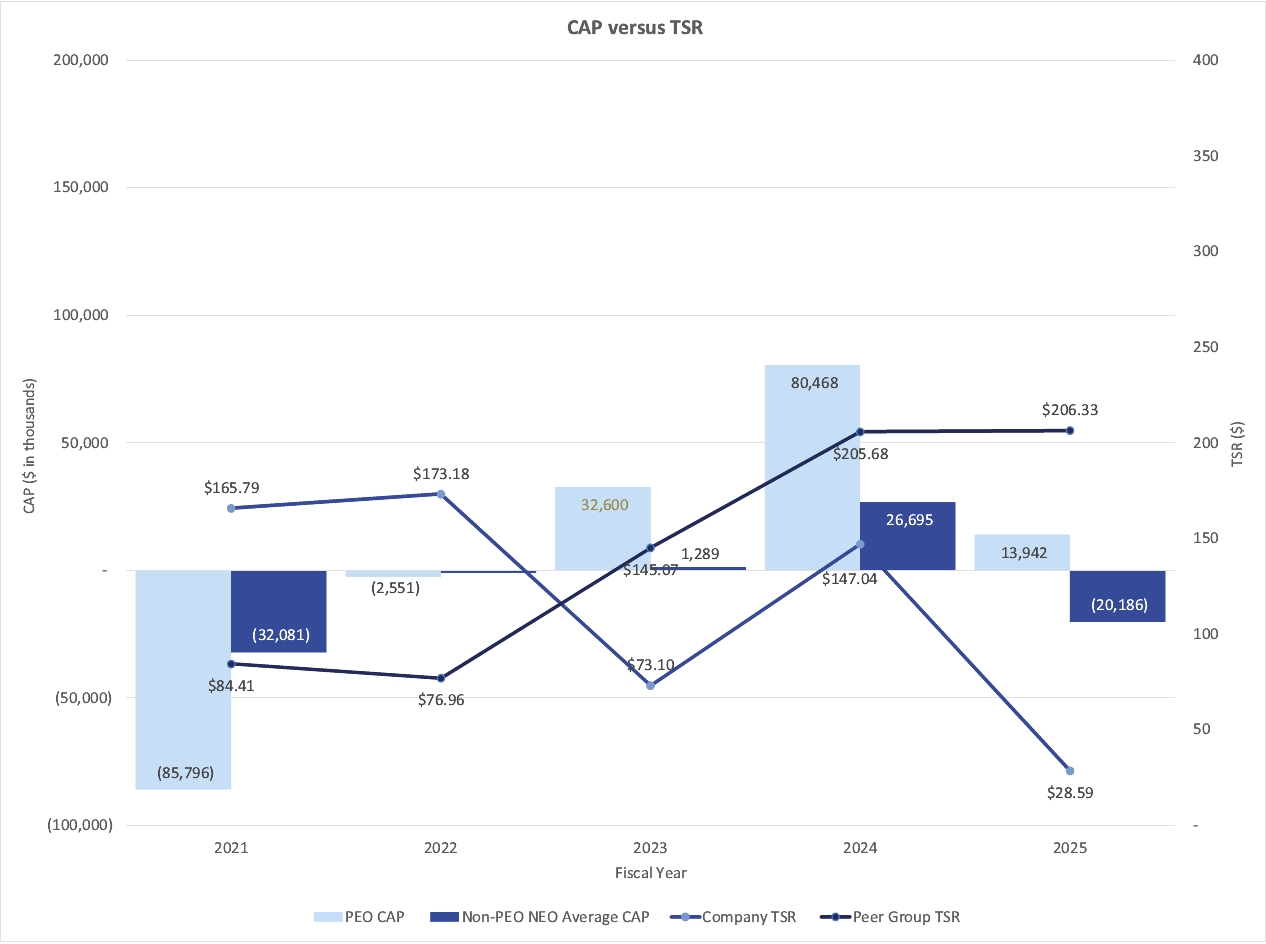
Compensation Actually Paid versus Company TSR and Peer Group TSR
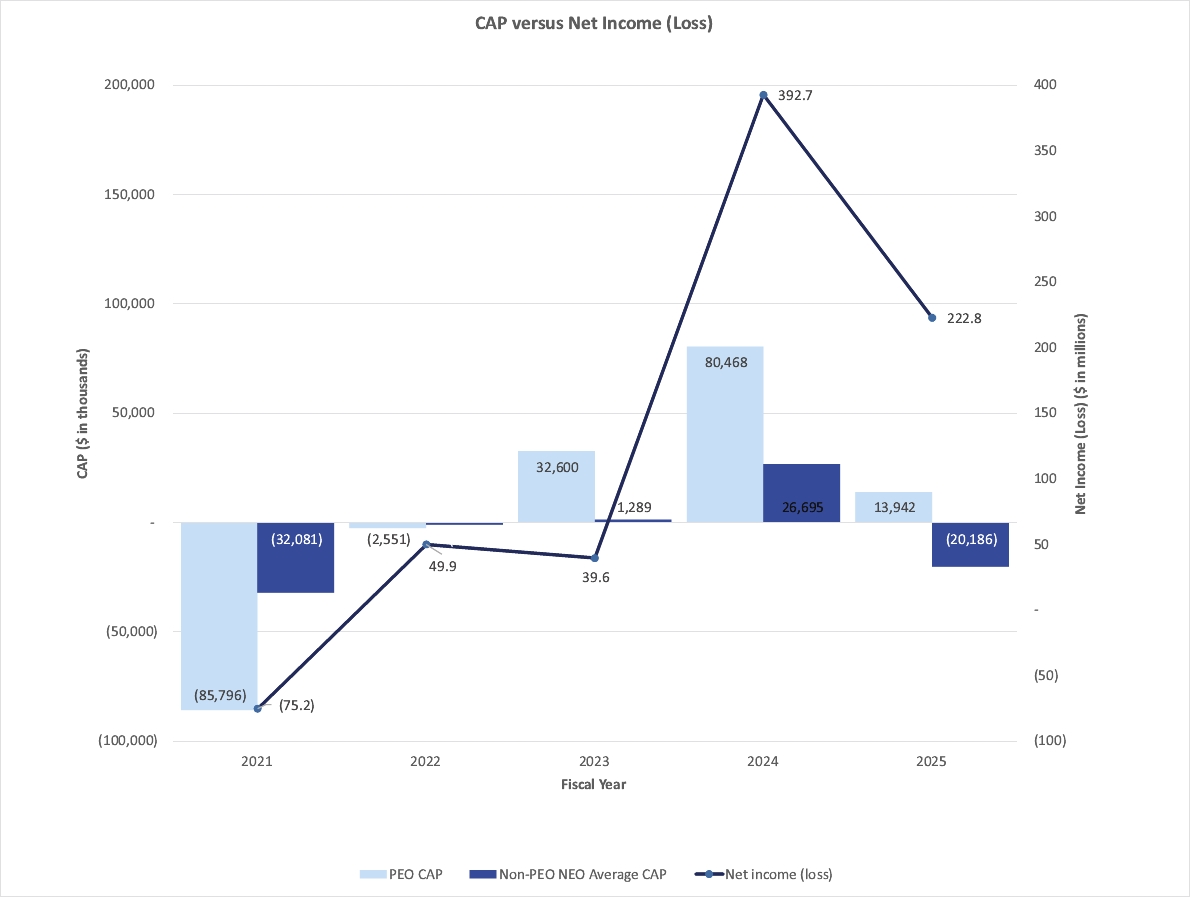
Compensation Actually Paid and Net Income (Loss)
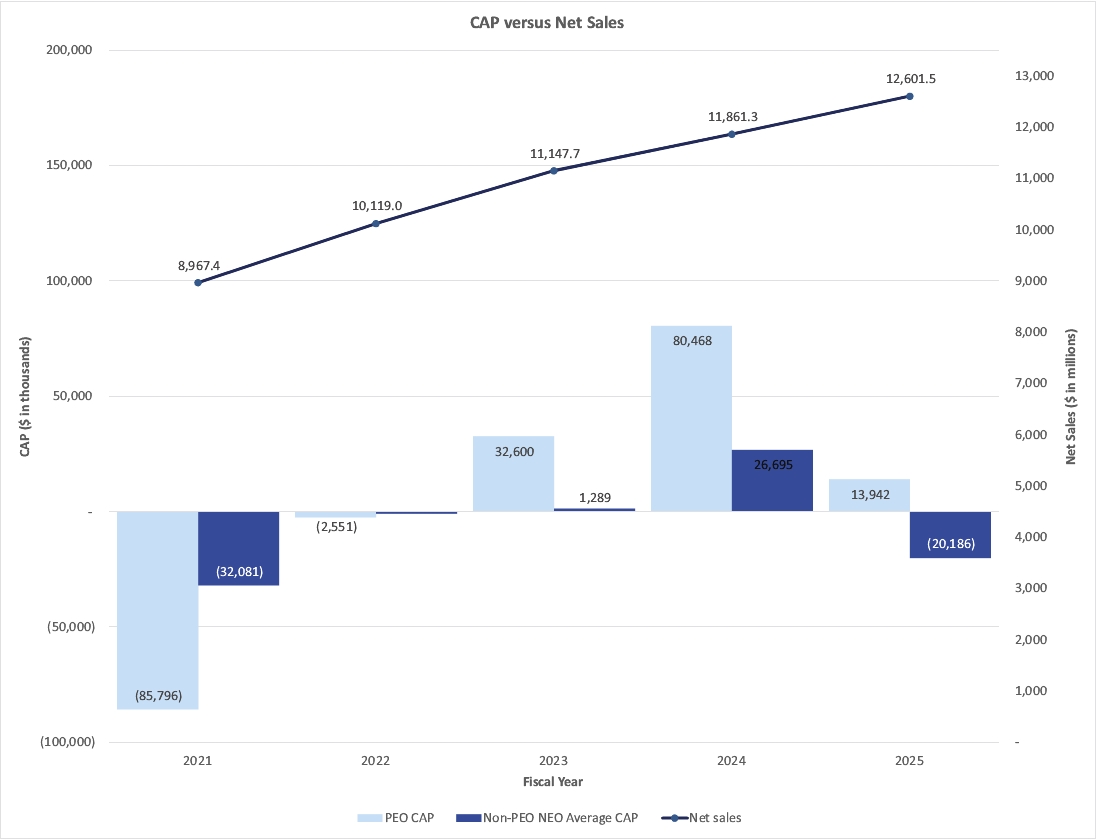
Compensation Actually Paid and Net Sales
Compensation Actually Paid versus Company TSR and Peer Group TSR
Tabular List of Performance Measures
The following table lists our most important performance measures used by us to link CAP of our NEOs to the Company’s performance for Fiscal Year 2025. For more information, refer to “Named Executive Officer Compensation – Compensation Discussion and Analysis.” We are providing this list in accordance with Item 402(v) of Regulation S-K to provide information on performance measures used by the Compensation Committee to determine NEO compensation, as more fully described in “Named Executive Officer Compensation – Compensation Discussion and Analysis.”
Most Important Performance Measures | ||
Net income (loss) | ||
Net sales | ||
Adjusted EBITDA margin(1) | ||
Free cash flow(1) | ||
(1) | Adjusted EBITDA margin and free cash flow are non-GAAP financial measures. For a reconciliation of non-GAAP to GAAP financial measures refer to “Reconciliation of Non-GAAP Financial Measures” in Appendix A. |
(1) | Adjusted EBITDA margin and free cash flow are non-GAAP financial measures. For a reconciliation of non-GAAP to GAAP financial measures refer to “Reconciliation of Non-GAAP Financial Measures” in Appendix A. |
(1) | Adjusted EBITDA margin and free cash flow are non-GAAP financial measures. For a reconciliation of non-GAAP to GAAP financial measures refer to “Reconciliation of Non-GAAP Financial Measures” in Appendix A. |