Pay vs Performance.
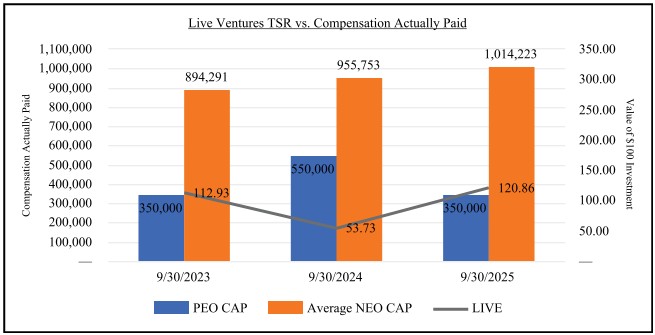
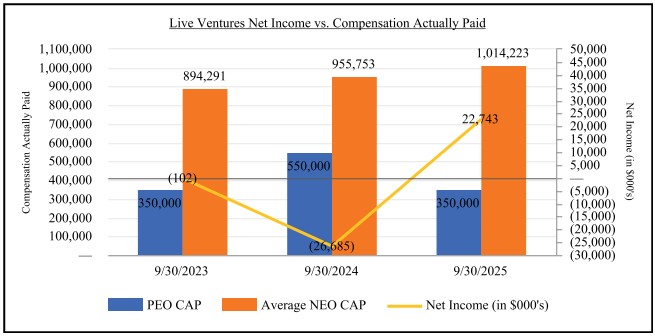
The table below specifies executive compensation paid to Jon Isaac, the Company’s Principal Executive Officer (“PEO”), and the other NEOs for the Company’s three most recently completed fiscal years, and certain financial performance measures for the Company’s three most recently completed fiscal years. The methodology for calculating amounts presented in the columns “Compensation Actually Paid to PEO” [column (4)] and “Average Compensation Actually Paid to Non-PEO NEOs” [column (6)], including details regarding the amounts that were deducted from, and added to, the Summary Compensation Table totals to arrive at the values presented for Compensation Actually Paid, are provided in the footnotes to the table. With respect to the measures of performance, the table includes the Company’s cumulative total stockholder return (“TSR”) and net income as noted in the Company’s audited financial statements. Also, below is a description of the relationship between the executive compensation actually paid and the Company’s cumulative TSR and Net Income for the periods noted in the Pay vs Performance Table below.
Year |
| PEO | | Summary Compensation Table Total for PEO | | | Compensation Actually Paid to PEO | | | | Average Summary Compensation Table Total for Non-PEO NEO’s | | | Average Compensation Actually Paid to Non-PEO NEO’s | | | | Value of Initial $100 Investment Based on Total Stockholder Return | | | | Net Income (in $000's) | |
||||||
(1) |
| (2) | | (3) | | | (4) | | | | (5) | | | (6) | | | | (7) | | | | (8) | |
||||||
2025 |
| Jon Isaac | | $ | 360,226 | | | $ | 350,000 | | (a) | | $ | 1,068,299 | | | $ | 1,014,223 | | (d) | | $ | 120.86 | | (g) | | $ | 22,743 | |
2024 |
| Jon Isaac | | $ | 560,226 | | | $ | 550,000 | | (b) | | $ | 1,008,216 | | | $ | 955,753 | | (e) | | $ | 53.73 | | (h) | | $ | (26,685 | ) |
2023 |
| Jon Isaac | | $ | 429,403 | | | $ | 350,000 | | (c) | | $ | 1,057,916 | | | $ | 894,291 | | (f) | | $ | 112.93 | | (i) | | $ | (102 | ) |
| (a) | Actual Compensation paid to the PEO in 2025 [column (4)] is less than the Summary Compensation Table (“SCT”) Total [column (3)] resulting from a reduction of the amount paid for Mr. Isaac’s life insurance premiums of $10,226. |
| (b) | Actual Compensation paid to the PEO in 2024 [column (4)] is less than the Summary Compensation Table (“SCT”) Total [column (3)] resulting from a reduction of the amount paid for Mr. Isaac’s life insurance premiums of $10,226. |
| (c) | Actual Compensation paid to the PEO in 2023 [column (4)] is less than the Summary Compensation Table (“SCT”) Total [column (3)] resulting from a reduction of the amount paid for Mr. Isaac’s life insurance premiums of $10,226 and $69,177 from the extension of Mr. Isaac's existing equity awards. |
| (d) | For the Non-PEO NEOs, Average Compensation Actually Paid in 2025 [column (6)] is less than the Average SCT Total [column (5)] as reported for the corresponding year in the “Total” column of the SCT due to vehicle allowances, deferred compensation, and life insurance amounts paid on behalf the Non-PEO NEOs during 2025. The Non-PEO NEOs for 2025 were: Rodney Spriggs and Thomas Sedlak. |
| (e) | For the Non-PEO NEOs, Average Compensation Actually Paid in 2024 [column (6)] is less than the Average SCT Total [column (5)] as reported for the corresponding year in the “Total” column of the SCT due to vehicle allowances, deferred compensation, and life insurance amounts paid on behalf the Non-PEO NEOs during 2024. The Non-PEO NEOs for 2024 were: Rodney Spriggs and Thomas Sedlak. |
| (f) | For the Non-PEO NEOs, Average Compensation Actually Paid in 2023 [column (6)] is less than the Average SCT Total [column (5)] as reported for the corresponding year in the “Total” column of the SCT due to equity awards that were granted during 2023. The Non-PEO NEOs for 2023 were: Thomas Sedlak and Eric Althofer. |
| (g) | Cumulative TSR for the period September 30, 2024 through September 30, 2025 was (20.9)%. An investment of $100.00 as of September 30, 2024 would resultingly have a value of $120.86 as of September 30, 2025. |
| (h) | Cumulative TSR for the period September 30, 2023 through September 30, 2024 was (46.3)%. An investment of $100.00 as of September 30, 2023 would resultingly have a value of $53.73 as of September 30, 2024. |
| (i) | Cumulative TSR for the period September 30, 2022 through September 30, 2023 was 12.9%. An investment of $100.00 as of September 30, 2022 would resultingly have a value of $112.93 as of September 30, 2023. |
Relationship Between Compensation Actually Paid (“CAP) and Performance Measures
The following charts show graphically the relationships over the past three years of the CAP amounts for the Company’s PEO and non-PEO NEOs as compared to the Company’s (i) total stockholder return; and (ii) net income.