Shareholder Report
Mar. 31, 2026
USD ($)
Holding
What were the fund costs during the last year ?
(Based on a hypothetical $10,000 investment)
| Fund (Class) | Costs of a $10,000 investment | Costs paid as a percentage of a $10,000 investment |
| International Growth Fund (Class R6/JIGTX) |
$98 | 0.89% |
Management’s Discussion of Fund Performance
SUMMARY OF RESULTS
International Growth Fund (Class R6/JIGTX) returned 21.29% for the year ended March 31, 2026. Global equities rose during the 12-month period, with gains earlier in the year supported by improving inflation trends, resilient U.S. growth, and strong performance in certain markets. However, stock market returns became more varied and volatile as geopolitical conflict drove a sharp rise in oil and gas prices, reigniting inflation concerns and pushing up global interest rates. International markets, particularly in Europe and more energy-dependent economies, underperformed toward period end as higher energy costs, tighter financial conditions, and a stronger U.S. dollar weighed on growth expectations.
TOP PERFORMANCE CONTRIBUTORS
Information technology | Performance in this sector was led by semiconductor foundry Taiwan Semiconductor Manufacturing Company, Ltd. and Delta Electronics, Inc., a Taiwanese electronics manufacturer.
Financials | In the financials sector, Itau Unibanco Holding SA, a Brazilian financial services company, was a standout.
Industrials | Within the industrials sector, the fund’s top contributor on an absolute basis was Siemens Energy AG, a German energy company.
TOP PERFORMANCE DETRACTORS
Energy | The energy sector detracted from the fund’s absolute performance.
Consumer discretionary | The consumer discretionary sector hampered results on an absolute basis, most notably due to the fund’s position in Trip.com Group, Ltd., a China-based online travel services company.
Adyen NV | Shares of this company fell sharply during the period, particularly in February 2026 after the company reported weaker-than-expected financial results.
The views expressed in this report are those of the portfolio management team and are subject to change. They are not meant as investment advice.
Fund Performance
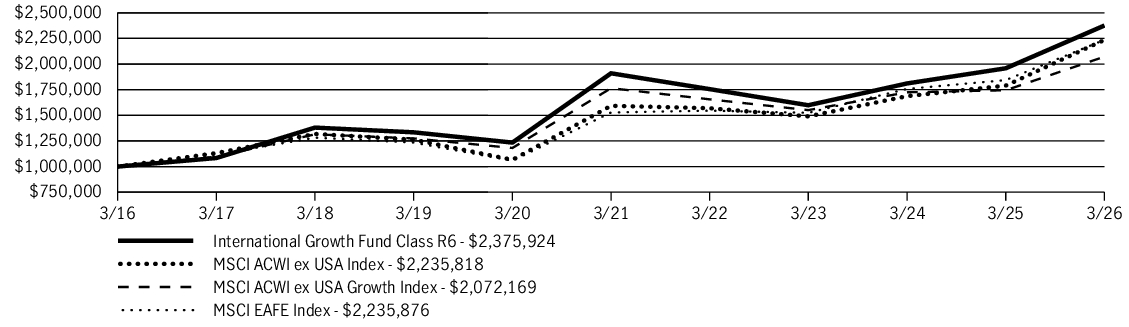
The following graph compares the initial and subsequent account values at the end of each of the most recently completed 10 fiscal years of the fund (or for the life of the fund, if shorter). It assumes a $1,000,000 initial investment in the fund and in an appropriate, broad-based securities market index for the same period.
GROWTH OF $1,000,000
| AVERAGE ANNUAL TOTAL RETURN | 1 Year | 5 Years | 10 Years |
| International Growth Fund (Class R6/JIGTX) | 21.29% | 4.46% | 9.04% |
| MSCI ACWI ex USA Index | 24.91% | 7.02% | 8.38% |
| MSCI ACWI ex USA Growth Index | 18.77% | 3.26% | 7.56% |
| MSCI EAFE Index | 21.27% | 7.91% | 8.38% |
Fund Statistics
| Fund net assets | $5,554,156,440 |
| Total number of portfolio holdings | 64 |
| Total advisory fees paid (net) | $43,901,284 |
| Portfolio turnover rate | 72% |
Graphical Representation of Holdings
The tables below show the investment makeup of the fund, representing a percentage of the total net assets of the fund.
Top Ten Holdings
| Taiwan Semiconductor Manufacturing Company, Ltd. | 8.5% |
| ASML Holding NV | 4.2% |
| Tencent Holdings, Ltd. | 3.9% |
| Safran SA | 2.6% |
| Hitachi, Ltd. | 2.5% |
| SK Hynix, Inc. | 2.3% |
| UBS Group AG | 2.2% |
| DSV A/S | 2.0% |
| Tokyo Electron, Ltd. | 2.0% |
| Bharti Airtel, Ltd. | 2.0% |
Sector Composition
| Information technology | 23.7% |
| Industrials | 23.1% |
| Financials | 15.4% |
| Communication services | 10.7% |
| Materials | 6.4% |
| Consumer discretionary | 6.2% |
| Health care | 5.6% |
| Consumer staples | 5.3% |
| Utilities | 1.4% |
| Real estate | 1.1% |
| Short-term investments and other | 1.1% |
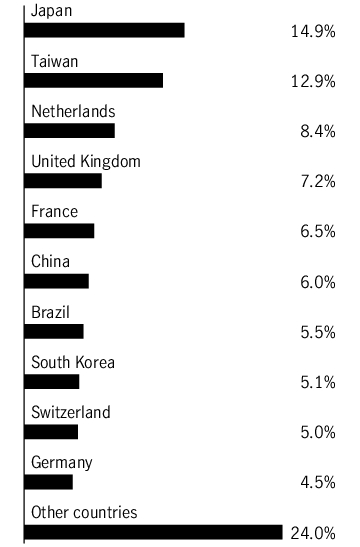
Country Composition

Holdings may not have been held by the fund for the entire period and are subject to change without notice. Portfolio composition is subject to review in accordance with the fund’s investment strategy and may vary in the future. Current and future portfolio holdings are subject to risk and may change at any time.
Top Ten Holdings
| Taiwan Semiconductor Manufacturing Company, Ltd. | 8.5% |
| ASML Holding NV | 4.2% |
| Tencent Holdings, Ltd. | 3.9% |
| Safran SA | 2.6% |
| Hitachi, Ltd. | 2.5% |
| SK Hynix, Inc. | 2.3% |
| UBS Group AG | 2.2% |
| DSV A/S | 2.0% |
| Tokyo Electron, Ltd. | 2.0% |
| Bharti Airtel, Ltd. | 2.0% |
What were the fund costs during the last year ?
(Based on a hypothetical $10,000 investment)
| Fund (Class) | Costs of a $10,000 investment | Costs paid as a percentage of a $10,000 investment |
| International Growth Fund (Class R4/JIGIX) |
$126 | 1.14% |
Management’s Discussion of Fund Performance
SUMMARY OF RESULTS
International Growth Fund (Class R4/JIGIX) returned 21.02% for the year ended March 31, 2026. Global equities rose during the 12-month period, with gains earlier in the year supported by improving inflation trends, resilient U.S. growth, and strong performance in certain markets. However, stock market returns became more varied and volatile as geopolitical conflict drove a sharp rise in oil and gas prices, reigniting inflation concerns and pushing up global interest rates. International markets, particularly in Europe and more energy-dependent economies, underperformed toward period end as higher energy costs, tighter financial conditions, and a stronger U.S. dollar weighed on growth expectations.
TOP PERFORMANCE CONTRIBUTORS
Information technology | Performance in this sector was led by semiconductor foundry Taiwan Semiconductor Manufacturing Company, Ltd. and Delta Electronics, Inc., a Taiwanese electronics manufacturer.
Financials | In the financials sector, Itau Unibanco Holding SA, a Brazilian financial services company, was a standout.
Industrials | Within the industrials sector, the fund’s top contributor on an absolute basis was Siemens Energy AG, a German energy company.
TOP PERFORMANCE DETRACTORS
Energy | The energy sector detracted from the fund’s absolute performance.
Consumer discretionary | The consumer discretionary sector hampered results on an absolute basis, most notably due to the fund’s position in Trip.com Group, Ltd., a China-based online travel services company.
Adyen NV | Shares of this company fell sharply during the period, particularly in February 2026 after the company reported weaker-than-expected financial results.
The views expressed in this report are those of the portfolio management team and are subject to change. They are not meant as investment advice.
Fund Performance
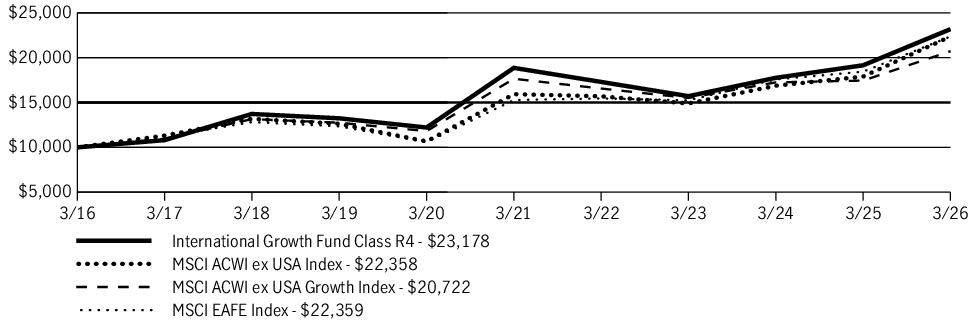
The following graph compares the initial and subsequent account values at the end of each of the most recently completed 10 fiscal years of the fund (or for the life of the fund, if shorter). It assumes a $10,000 initial investment in the fund and in an appropriate, broad-based securities market index for the same period.
GROWTH OF $10,000
| AVERAGE ANNUAL TOTAL RETURN | 1 Year | 5 Years | 10 Years |
| International Growth Fund (Class R4/JIGIX) | 21.02% | 4.21% | 8.77% |
| MSCI ACWI ex USA Index | 24.91% | 7.02% | 8.38% |
| MSCI ACWI ex USA Growth Index | 18.77% | 3.26% | 7.56% |
| MSCI EAFE Index | 21.27% | 7.91% | 8.38% |
Fund Statistics
| Fund net assets | $5,554,156,440 |
| Total number of portfolio holdings | 64 |
| Total advisory fees paid (net) | $43,901,284 |
| Portfolio turnover rate | 72% |
Graphical Representation of Holdings
The tables below show the investment makeup of the fund, representing a percentage of the total net assets of the fund.
Top Ten Holdings
| Taiwan Semiconductor Manufacturing Company, Ltd. | 8.5% |
| ASML Holding NV | 4.2% |
| Tencent Holdings, Ltd. | 3.9% |
| Safran SA | 2.6% |
| Hitachi, Ltd. | 2.5% |
| SK Hynix, Inc. | 2.3% |
| UBS Group AG | 2.2% |
| DSV A/S | 2.0% |
| Tokyo Electron, Ltd. | 2.0% |
| Bharti Airtel, Ltd. | 2.0% |
Sector Composition
| Information technology | 23.7% |
| Industrials | 23.1% |
| Financials | 15.4% |
| Communication services | 10.7% |
| Materials | 6.4% |
| Consumer discretionary | 6.2% |
| Health care | 5.6% |
| Consumer staples | 5.3% |
| Utilities | 1.4% |
| Real estate | 1.1% |
| Short-term investments and other | 1.1% |
Country Composition

Holdings may not have been held by the fund for the entire period and are subject to change without notice. Portfolio composition is subject to review in accordance with the fund’s investment strategy and may vary in the future. Current and future portfolio holdings are subject to risk and may change at any time.
Top Ten Holdings
| Taiwan Semiconductor Manufacturing Company, Ltd. | 8.5% |
| ASML Holding NV | 4.2% |
| Tencent Holdings, Ltd. | 3.9% |
| Safran SA | 2.6% |
| Hitachi, Ltd. | 2.5% |
| SK Hynix, Inc. | 2.3% |
| UBS Group AG | 2.2% |
| DSV A/S | 2.0% |
| Tokyo Electron, Ltd. | 2.0% |
| Bharti Airtel, Ltd. | 2.0% |
What were the fund costs during the last year ?
(Based on a hypothetical $10,000 investment)
| Fund (Class) | Costs of a $10,000 investment | Costs paid as a percentage of a $10,000 investment |
| International Growth Fund (Class R2/JHIGX) |
$153 | 1.39% |
Management’s Discussion of Fund Performance
SUMMARY OF RESULTS
International Growth Fund (Class R2/JHIGX) returned 20.72% for the year ended March 31, 2026. Global equities rose during the 12-month period, with gains earlier in the year supported by improving inflation trends, resilient U.S. growth, and strong performance in certain markets. However, stock market returns became more varied and volatile as geopolitical conflict drove a sharp rise in oil and gas prices, reigniting inflation concerns and pushing up global interest rates. International markets, particularly in Europe and more energy-dependent economies, underperformed toward period end as higher energy costs, tighter financial conditions, and a stronger U.S. dollar weighed on growth expectations.
TOP PERFORMANCE CONTRIBUTORS
Information technology | Performance in this sector was led by semiconductor foundry Taiwan Semiconductor Manufacturing Company, Ltd. and Delta Electronics, Inc., a Taiwanese electronics manufacturer.
Financials | In the financials sector, Itau Unibanco Holding SA, a Brazilian financial services company, was a standout.
Industrials | Within the industrials sector, the fund’s top contributor on an absolute basis was Siemens Energy AG, a German energy company.
TOP PERFORMANCE DETRACTORS
Energy | The energy sector detracted from the fund’s absolute performance.
Consumer discretionary | The consumer discretionary sector hampered results on an absolute basis, most notably due to the fund’s position in Trip.com Group, Ltd., a China-based online travel services company.
Adyen NV | Shares of this company fell sharply during the period, particularly in February 2026 after the company reported weaker-than-expected financial results.
The views expressed in this report are those of the portfolio management team and are subject to change. They are not meant as investment advice.
Fund Performance
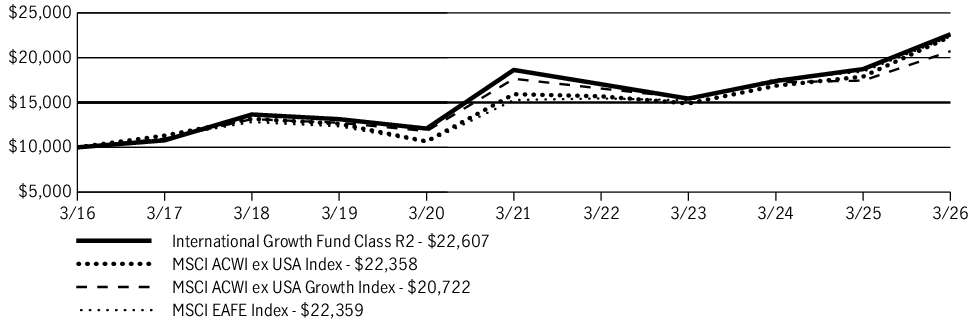
The following graph compares the initial and subsequent account values at the end of each of the most recently completed 10 fiscal years of the fund (or for the life of the fund, if shorter). It assumes a $10,000 initial investment in the fund and in an appropriate, broad-based securities market index for the same period.
GROWTH OF $10,000
| AVERAGE ANNUAL TOTAL RETURN | 1 Year | 5 Years | 10 Years |
| International Growth Fund (Class R2/JHIGX) | 20.72% | 3.95% | 8.50% |
| MSCI ACWI ex USA Index | 24.91% | 7.02% | 8.38% |
| MSCI ACWI ex USA Growth Index | 18.77% | 3.26% | 7.56% |
| MSCI EAFE Index | 21.27% | 7.91% | 8.38% |
Fund Statistics
| Fund net assets | $5,554,156,440 |
| Total number of portfolio holdings | 64 |
| Total advisory fees paid (net) | $43,901,284 |
| Portfolio turnover rate | 72% |
Graphical Representation of Holdings
The tables below show the investment makeup of the fund, representing a percentage of the total net assets of the fund.
Top Ten Holdings
| Taiwan Semiconductor Manufacturing Company, Ltd. | 8.5% |
| ASML Holding NV | 4.2% |
| Tencent Holdings, Ltd. | 3.9% |
| Safran SA | 2.6% |
| Hitachi, Ltd. | 2.5% |
| SK Hynix, Inc. | 2.3% |
| UBS Group AG | 2.2% |
| DSV A/S | 2.0% |
| Tokyo Electron, Ltd. | 2.0% |
| Bharti Airtel, Ltd. | 2.0% |
Sector Composition
| Information technology | 23.7% |
| Industrials | 23.1% |
| Financials | 15.4% |
| Communication services | 10.7% |
| Materials | 6.4% |
| Consumer discretionary | 6.2% |
| Health care | 5.6% |
| Consumer staples | 5.3% |
| Utilities | 1.4% |
| Real estate | 1.1% |
| Short-term investments and other | 1.1% |
Country Composition

Holdings may not have been held by the fund for the entire period and are subject to change without notice. Portfolio composition is subject to review in accordance with the fund’s investment strategy and may vary in the future. Current and future portfolio holdings are subject to risk and may change at any time.
Top Ten Holdings
| Taiwan Semiconductor Manufacturing Company, Ltd. | 8.5% |
| ASML Holding NV | 4.2% |
| Tencent Holdings, Ltd. | 3.9% |
| Safran SA | 2.6% |
| Hitachi, Ltd. | 2.5% |
| SK Hynix, Inc. | 2.3% |
| UBS Group AG | 2.2% |
| DSV A/S | 2.0% |
| Tokyo Electron, Ltd. | 2.0% |
| Bharti Airtel, Ltd. | 2.0% |
What were the fund costs during the last year ?
(Based on a hypothetical $10,000 investment)
| Fund (Class) | Costs of a $10,000 investment | Costs paid as a percentage of a $10,000 investment |
| International Growth Fund (Class NAV/JIGHX) |
$98 | 0.89% |
Management’s Discussion of Fund Performance
SUMMARY OF RESULTS
International Growth Fund (Class NAV/JIGHX) returned 21.33% for the year ended March 31, 2026. Global equities rose during the 12-month period, with gains earlier in the year supported by improving inflation trends, resilient U.S. growth, and strong performance in certain markets. However, stock market returns became more varied and volatile as geopolitical conflict drove a sharp rise in oil and gas prices, reigniting inflation concerns and pushing up global interest rates. International markets, particularly in Europe and more energy-dependent economies, underperformed toward period end as higher energy costs, tighter financial conditions, and a stronger U.S. dollar weighed on growth expectations.
TOP PERFORMANCE CONTRIBUTORS
Information technology | Performance in this sector was led by semiconductor foundry Taiwan Semiconductor Manufacturing Company, Ltd. and Delta Electronics, Inc., a Taiwanese electronics manufacturer.
Financials | In the financials sector, Itau Unibanco Holding SA, a Brazilian financial services company, was a standout.
Industrials | Within the industrials sector, the fund’s top contributor on an absolute basis was Siemens Energy AG, a German energy company.
TOP PERFORMANCE DETRACTORS
Energy | The energy sector detracted from the fund’s absolute performance.
Consumer discretionary | The consumer discretionary sector hampered results on an absolute basis, most notably due to the fund’s position in Trip.com Group, Ltd., a China-based online travel services company.
Adyen NV | Shares of this company fell sharply during the period, particularly in February 2026 after the company reported weaker-than-expected financial results.
The views expressed in this report are those of the portfolio management team and are subject to change. They are not meant as investment advice.
Fund Performance
The following graph compares the initial and subsequent account values at the end of each of the most recently completed 10 fiscal years of the fund (or for the life of the fund, if shorter). It assumes a $10,000 initial investment in the fund and in an appropriate, broad-based securities market index for the same period.
GROWTH OF $10,000

| AVERAGE ANNUAL TOTAL RETURN | 1 Year | 5 Years | 10 Years |
| International Growth Fund (Class NAV/JIGHX) | 21.33% | 4.47% | 9.05% |
| MSCI ACWI ex USA Index | 24.91% | 7.02% | 8.38% |
| MSCI ACWI ex USA Growth Index | 18.77% | 3.26% | 7.56% |
| MSCI EAFE Index | 21.27% | 7.91% | 8.38% |
Fund Statistics
| Fund net assets | $5,554,156,440 |
| Total number of portfolio holdings | 64 |
| Total advisory fees paid (net) | $43,901,284 |
| Portfolio turnover rate | 72% |
Graphical Representation of Holdings
The tables below show the investment makeup of the fund, representing a percentage of the total net assets of the fund.
Top Ten Holdings
| Taiwan Semiconductor Manufacturing Company, Ltd. | 8.5% |
| ASML Holding NV | 4.2% |
| Tencent Holdings, Ltd. | 3.9% |
| Safran SA | 2.6% |
| Hitachi, Ltd. | 2.5% |
| SK Hynix, Inc. | 2.3% |
| UBS Group AG | 2.2% |
| DSV A/S | 2.0% |
| Tokyo Electron, Ltd. | 2.0% |
| Bharti Airtel, Ltd. | 2.0% |
Sector Composition
| Information technology | 23.7% |
| Industrials | 23.1% |
| Financials | 15.4% |
| Communication services | 10.7% |
| Materials | 6.4% |
| Consumer discretionary | 6.2% |
| Health care | 5.6% |
| Consumer staples | 5.3% |
| Utilities | 1.4% |
| Real estate | 1.1% |
| Short-term investments and other | 1.1% |
Country Composition

Holdings may not have been held by the fund for the entire period and are subject to change without notice. Portfolio composition is subject to review in accordance with the fund’s investment strategy and may vary in the future. Current and future portfolio holdings are subject to risk and may change at any time.
Top Ten Holdings
| Taiwan Semiconductor Manufacturing Company, Ltd. | 8.5% |
| ASML Holding NV | 4.2% |
| Tencent Holdings, Ltd. | 3.9% |
| Safran SA | 2.6% |
| Hitachi, Ltd. | 2.5% |
| SK Hynix, Inc. | 2.3% |
| UBS Group AG | 2.2% |
| DSV A/S | 2.0% |
| Tokyo Electron, Ltd. | 2.0% |
| Bharti Airtel, Ltd. | 2.0% |
What were the fund costs during the last year ?
(Based on a hypothetical $10,000 investment)
| Fund (Class) | Costs of a $10,000 investment | Costs paid as a percentage of a $10,000 investment |
| International Growth Fund (Class I/GOGIX) |
$111 | 1.00% |
Management’s Discussion of Fund Performance
SUMMARY OF RESULTS
International Growth Fund (Class I/GOGIX) returned 21.18% for the year ended March 31, 2026. Global equities rose during the 12-month period, with gains earlier in the year supported by improving inflation trends, resilient U.S. growth, and strong performance in certain markets. However, stock market returns became more varied and volatile as geopolitical conflict drove a sharp rise in oil and gas prices, reigniting inflation concerns and pushing up global interest rates. International markets, particularly in Europe and more energy-dependent economies, underperformed toward period end as higher energy costs, tighter financial conditions, and a stronger U.S. dollar weighed on growth expectations.
TOP PERFORMANCE CONTRIBUTORS
Information technology | Performance in this sector was led by semiconductor foundry Taiwan Semiconductor Manufacturing Company, Ltd. and Delta Electronics, Inc., a Taiwanese electronics manufacturer.
Financials | In the financials sector, Itau Unibanco Holding SA, a Brazilian financial services company, was a standout.
Industrials | Within the industrials sector, the fund’s top contributor on an absolute basis was Siemens Energy AG, a German energy company.
TOP PERFORMANCE DETRACTORS
Energy | The energy sector detracted from the fund’s absolute performance.
Consumer discretionary | The consumer discretionary sector hampered results on an absolute basis, most notably due to the fund’s position in Trip.com Group, Ltd., a China-based online travel services company.
Adyen NV | Shares of this company fell sharply during the period, particularly in February 2026 after the company reported weaker-than-expected financial results.
The views expressed in this report are those of the portfolio management team and are subject to change. They are not meant as investment advice.
Fund Performance
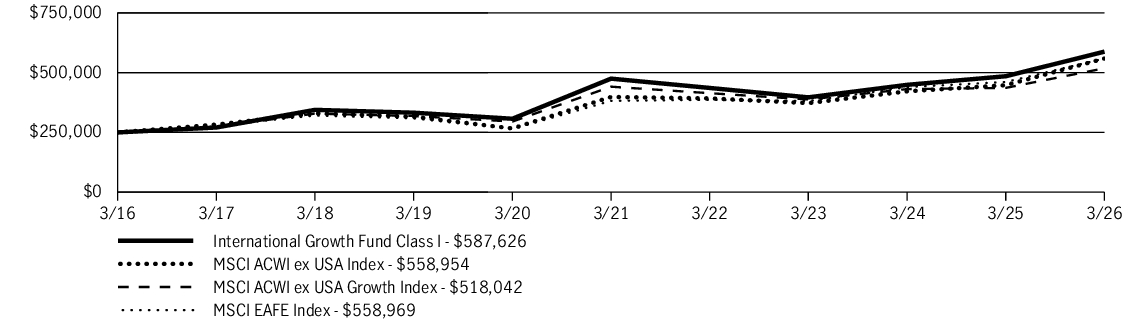
The following graph compares the initial and subsequent account values at the end of each of the most recently completed 10 fiscal years of the fund (or for the life of the fund, if shorter). It assumes a $250,000 initial investment in the fund and in an appropriate, broad-based securities market index for the same period.
GROWTH OF $250,000
| AVERAGE ANNUAL TOTAL RETURN | 1 Year | 5 Years | 10 Years |
| International Growth Fund (Class I/GOGIX) | 21.18% | 4.35% | 8.92% |
| MSCI ACWI ex USA Index | 24.91% | 7.02% | 8.38% |
| MSCI ACWI ex USA Growth Index | 18.77% | 3.26% | 7.56% |
| MSCI EAFE Index | 21.27% | 7.91% | 8.38% |
Fund Statistics
| Fund net assets | $5,554,156,440 |
| Total number of portfolio holdings | 64 |
| Total advisory fees paid (net) | $43,901,284 |
| Portfolio turnover rate | 72% |
Graphical Representation of Holdings
The tables below show the investment makeup of the fund, representing a percentage of the total net assets of the fund.
Top Ten Holdings
| Taiwan Semiconductor Manufacturing Company, Ltd. | 8.5% |
| ASML Holding NV | 4.2% |
| Tencent Holdings, Ltd. | 3.9% |
| Safran SA | 2.6% |
| Hitachi, Ltd. | 2.5% |
| SK Hynix, Inc. | 2.3% |
| UBS Group AG | 2.2% |
| DSV A/S | 2.0% |
| Tokyo Electron, Ltd. | 2.0% |
| Bharti Airtel, Ltd. | 2.0% |
Sector Composition
| Information technology | 23.7% |
| Industrials | 23.1% |
| Financials | 15.4% |
| Communication services | 10.7% |
| Materials | 6.4% |
| Consumer discretionary | 6.2% |
| Health care | 5.6% |
| Consumer staples | 5.3% |
| Utilities | 1.4% |
| Real estate | 1.1% |
| Short-term investments and other | 1.1% |
Country Composition

Holdings may not have been held by the fund for the entire period and are subject to change without notice. Portfolio composition is subject to review in accordance with the fund’s investment strategy and may vary in the future. Current and future portfolio holdings are subject to risk and may change at any time.
Top Ten Holdings
| Taiwan Semiconductor Manufacturing Company, Ltd. | 8.5% |
| ASML Holding NV | 4.2% |
| Tencent Holdings, Ltd. | 3.9% |
| Safran SA | 2.6% |
| Hitachi, Ltd. | 2.5% |
| SK Hynix, Inc. | 2.3% |
| UBS Group AG | 2.2% |
| DSV A/S | 2.0% |
| Tokyo Electron, Ltd. | 2.0% |
| Bharti Airtel, Ltd. | 2.0% |
What were the fund costs during the last year ?
(Based on a hypothetical $10,000 investment)
| Fund (Class) | Costs of a $10,000 investment | Costs paid as a percentage of a $10,000 investment |
| International Growth Fund (Class C/GONCX) |
$220 | 2.00% |
Management’s Discussion of Fund Performance
SUMMARY OF RESULTS
International Growth Fund (Class C/GONCX) returned 19.96% (excluding sales charges) for the year ended March 31, 2026. Global equities rose during the 12-month period, with gains earlier in the year supported by improving inflation trends, resilient U.S. growth, and strong performance in certain markets. However, stock market returns became more varied and volatile as geopolitical conflict drove a sharp rise in oil and gas prices, reigniting inflation concerns and pushing up global interest rates. International markets, particularly in Europe and more energy-dependent economies, underperformed toward period end as higher energy costs, tighter financial conditions, and a stronger U.S. dollar weighed on growth expectations.
TOP PERFORMANCE CONTRIBUTORS
Information technology | Performance in this sector was led by semiconductor foundry Taiwan Semiconductor Manufacturing Company, Ltd. and Delta Electronics, Inc., a Taiwanese electronics manufacturer.
Financials | In the financials sector, Itau Unibanco Holding SA, a Brazilian financial services company, was a standout.
Industrials | Within the industrials sector, the fund’s top contributor on an absolute basis was Siemens Energy AG, a German energy company.
TOP PERFORMANCE DETRACTORS
Energy | The energy sector detracted from the fund’s absolute performance.
Consumer discretionary | The consumer discretionary sector hampered results on an absolute basis, most notably due to the fund’s position in Trip.com Group, Ltd., a China-based online travel services company.
Adyen NV | Shares of this company fell sharply during the period, particularly in February 2026 after the company reported weaker-than-expected financial results.
The views expressed in this report are those of the portfolio management team and are subject to change. They are not meant as investment advice.
Fund Performance
The following graph compares the initial and subsequent account values at the end of each of the most recently completed 10 fiscal years of the fund (or for the life of the fund, if shorter). It assumes a $10,000 initial investment in the fund and in an appropriate, broad-based securities market index for the same period.
GROWTH OF $10,000
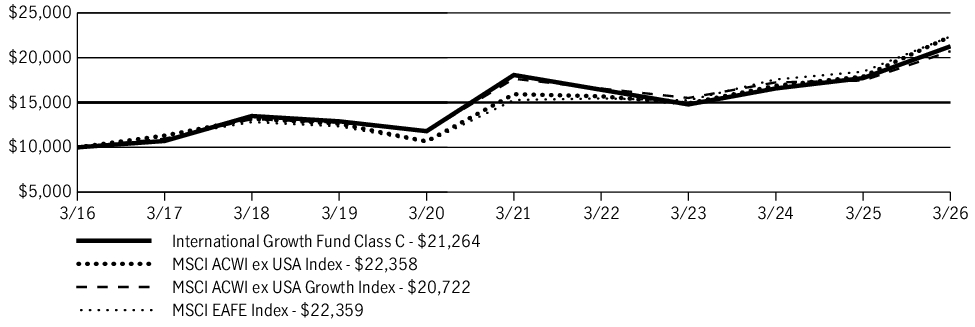
| AVERAGE ANNUAL TOTAL RETURN | 1 Year | 5 Years | 10 Years |
| International Growth Fund (Class C/GONCX) | 18.96% | 3.31% | 7.84% |
| International Growth Fund (Class C/GONCX)—excluding sales charge | 19.96% | 3.31% | 7.84% |
| MSCI ACWI ex USA Index | 24.91% | 7.02% | 8.38% |
| MSCI ACWI ex USA Growth Index | 18.77% | 3.26% | 7.56% |
| MSCI EAFE Index | 21.27% | 7.91% | 8.38% |
Fund Statistics
| Fund net assets | $5,554,156,440 |
| Total number of portfolio holdings | 64 |
| Total advisory fees paid (net) | $43,901,284 |
| Portfolio turnover rate | 72% |
Graphical Representation of Holdings
The tables below show the investment makeup of the fund, representing a percentage of the total net assets of the fund.
Top Ten Holdings
| Taiwan Semiconductor Manufacturing Company, Ltd. | 8.5% |
| ASML Holding NV | 4.2% |
| Tencent Holdings, Ltd. | 3.9% |
| Safran SA | 2.6% |
| Hitachi, Ltd. | 2.5% |
| SK Hynix, Inc. | 2.3% |
| UBS Group AG | 2.2% |
| DSV A/S | 2.0% |
| Tokyo Electron, Ltd. | 2.0% |
| Bharti Airtel, Ltd. | 2.0% |
Sector Composition
| Information technology | 23.7% |
| Industrials | 23.1% |
| Financials | 15.4% |
| Communication services | 10.7% |
| Materials | 6.4% |
| Consumer discretionary | 6.2% |
| Health care | 5.6% |
| Consumer staples | 5.3% |
| Utilities | 1.4% |
| Real estate | 1.1% |
| Short-term investments and other | 1.1% |
Country Composition

Holdings may not have been held by the fund for the entire period and are subject to change without notice. Portfolio composition is subject to review in accordance with the fund’s investment strategy and may vary in the future. Current and future portfolio holdings are subject to risk and may change at any time.
Top Ten Holdings
| Taiwan Semiconductor Manufacturing Company, Ltd. | 8.5% |
| ASML Holding NV | 4.2% |
| Tencent Holdings, Ltd. | 3.9% |
| Safran SA | 2.6% |
| Hitachi, Ltd. | 2.5% |
| SK Hynix, Inc. | 2.3% |
| UBS Group AG | 2.2% |
| DSV A/S | 2.0% |
| Tokyo Electron, Ltd. | 2.0% |
| Bharti Airtel, Ltd. | 2.0% |
What were the fund costs during the last year ?
(Based on a hypothetical $10,000 investment)
| Fund (Class) | Costs of a $10,000 investment | Costs paid as a percentage of a $10,000 investment |
| International Growth Fund (Class A/GOIGX) |
$144 | 1.30% |
Management’s Discussion of Fund Performance
SUMMARY OF RESULTS
International Growth Fund (Class A/GOIGX) returned 20.82% (excluding sales charges) for the year ended March 31, 2026. Global equities rose during the 12-month period, with gains earlier in the year supported by improving inflation trends, resilient U.S. growth, and strong performance in certain markets. However, stock market returns became more varied and volatile as geopolitical conflict drove a sharp rise in oil and gas prices, reigniting inflation concerns and pushing up global interest rates. International markets, particularly in Europe and more energy-dependent economies, underperformed toward period end as higher energy costs, tighter financial conditions, and a stronger U.S. dollar weighed on growth expectations.
TOP PERFORMANCE CONTRIBUTORS
Information technology | Performance in this sector was led by semiconductor foundry Taiwan Semiconductor Manufacturing Company, Ltd. and Delta Electronics, Inc., a Taiwanese electronics manufacturer.
Financials | In the financials sector, Itau Unibanco Holding SA, a Brazilian financial services company, was a standout.
Industrials | Within the industrials sector, the fund’s top contributor on an absolute basis was Siemens Energy AG, a German energy company.
TOP PERFORMANCE DETRACTORS
Energy | The energy sector detracted from the fund’s absolute performance.
Consumer discretionary | The consumer discretionary sector hampered results on an absolute basis, most notably due to the fund’s position in Trip.com Group, Ltd., a China-based online travel services company.
Adyen NV | Shares of this company fell sharply during the period, particularly in February 2026 after the company reported weaker-than-expected financial results.
The views expressed in this report are those of the portfolio management team and are subject to change. They are not meant as investment advice.
Fund Performance
The following graph compares the initial and subsequent account values at the end of each of the most recently completed 10 fiscal years of the fund (or for the life of the fund, if shorter). It assumes a $10,000 initial investment in the fund and in an appropriate, broad-based securities market index for the same period.
GROWTH OF $10,000
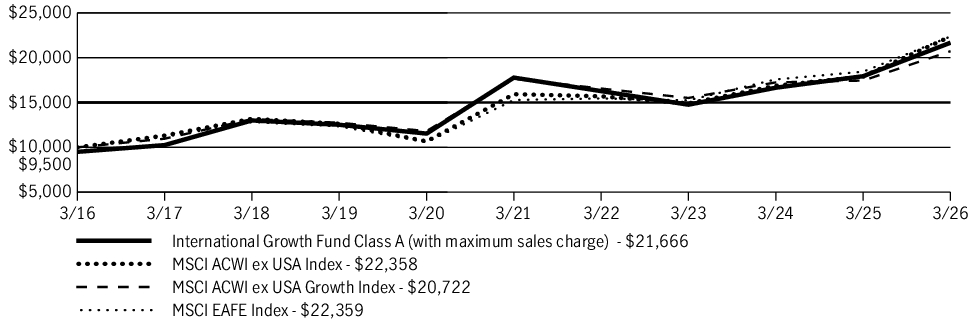
| AVERAGE ANNUAL TOTAL RETURN | 1 Year | 5 Years | 10 Years |
| International Growth Fund (Class A/GOIGX) | 14.79% | 2.98% | 8.04% |
| International Growth Fund (Class A/GOIGX)—excluding sales charge | 20.82% | 4.04% | 8.59% |
| MSCI ACWI ex USA Index | 24.91% | 7.02% | 8.38% |
| MSCI ACWI ex USA Growth Index | 18.77% | 3.26% | 7.56% |
| MSCI EAFE Index | 21.27% | 7.91% | 8.38% |
Fund Statistics
| Fund net assets | $5,554,156,440 |
| Total number of portfolio holdings | 64 |
| Total advisory fees paid (net) | $43,901,284 |
| Portfolio turnover rate | 72% |
Graphical Representation of Holdings
The tables below show the investment makeup of the fund, representing a percentage of the total net assets of the fund.
Top Ten Holdings
| Taiwan Semiconductor Manufacturing Company, Ltd. | 8.5% |
| ASML Holding NV | 4.2% |
| Tencent Holdings, Ltd. | 3.9% |
| Safran SA | 2.6% |
| Hitachi, Ltd. | 2.5% |
| SK Hynix, Inc. | 2.3% |
| UBS Group AG | 2.2% |
| DSV A/S | 2.0% |
| Tokyo Electron, Ltd. | 2.0% |
| Bharti Airtel, Ltd. | 2.0% |
Sector Composition
| Information technology | 23.7% |
| Industrials | 23.1% |
| Financials | 15.4% |
| Communication services | 10.7% |
| Materials | 6.4% |
| Consumer discretionary | 6.2% |
| Health care | 5.6% |
| Consumer staples | 5.3% |
| Utilities | 1.4% |
| Real estate | 1.1% |
| Short-term investments and other | 1.1% |
Country Composition

Holdings may not have been held by the fund for the entire period and are subject to change without notice. Portfolio composition is subject to review in accordance with the fund’s investment strategy and may vary in the future. Current and future portfolio holdings are subject to risk and may change at any time.
Top Ten Holdings
| Taiwan Semiconductor Manufacturing Company, Ltd. | 8.5% |
| ASML Holding NV | 4.2% |
| Tencent Holdings, Ltd. | 3.9% |
| Safran SA | 2.6% |
| Hitachi, Ltd. | 2.5% |
| SK Hynix, Inc. | 2.3% |
| UBS Group AG | 2.2% |
| DSV A/S | 2.0% |
| Tokyo Electron, Ltd. | 2.0% |
| Bharti Airtel, Ltd. | 2.0% |
What were the fund costs during the last year ?
(Based on a hypothetical $10,000 investment)
| Fund (Class) | Costs of a $10,000 investment | Costs paid as a percentage of a $10,000 investment |
| International Growth Fund (Class 1/GOIOX) |
$104 | 0.94% |
Management’s Discussion of Fund Performance
SUMMARY OF RESULTS
International Growth Fund (Class 1/GOIOX) returned 21.27% for the year ended March 31, 2026. Global equities rose during the 12-month period, with gains earlier in the year supported by improving inflation trends, resilient U.S. growth, and strong performance in certain markets. However, stock market returns became more varied and volatile as geopolitical conflict drove a sharp rise in oil and gas prices, reigniting inflation concerns and pushing up global interest rates. International markets, particularly in Europe and more energy-dependent economies, underperformed toward period end as higher energy costs, tighter financial conditions, and a stronger U.S. dollar weighed on growth expectations.
TOP PERFORMANCE CONTRIBUTORS
Information technology | Performance in this sector was led by semiconductor foundry Taiwan Semiconductor Manufacturing Company, Ltd. and Delta Electronics, Inc., a Taiwanese electronics manufacturer.
Financials | In the financials sector, Itau Unibanco Holding SA, a Brazilian financial services company, was a standout.
Industrials | Within the industrials sector, the fund’s top contributor on an absolute basis was Siemens Energy AG, a German energy company.
TOP PERFORMANCE DETRACTORS
Energy | The energy sector detracted from the fund’s absolute performance.
Consumer discretionary | The consumer discretionary sector hampered results on an absolute basis, most notably due to the fund’s position in Trip.com Group, Ltd., a China-based online travel services company.
Adyen NV | Shares of this company fell sharply during the period, particularly in February 2026 after the company reported weaker-than-expected financial results.
The views expressed in this report are those of the portfolio management team and are subject to change. They are not meant as investment advice.
Fund Performance
The following graph compares the initial and subsequent account values at the end of each of the most recently completed 10 fiscal years of the fund (or for the life of the fund, if shorter). It assumes a $10,000 initial investment in the fund and in an appropriate, broad-based securities market index for the same period.
GROWTH OF $10,000
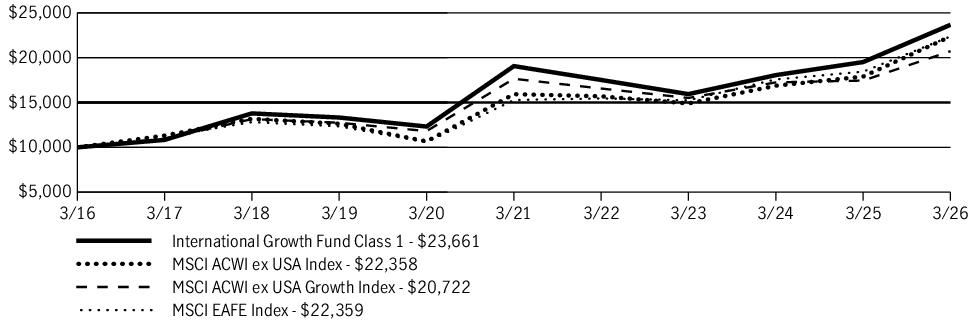
| AVERAGE ANNUAL TOTAL RETURN | 1 Year | 5 Years | 10 Years |
| International Growth Fund (Class 1/GOIOX) | 21.27% | 4.42% | 8.99% |
| MSCI ACWI ex USA Index | 24.91% | 7.02% | 8.38% |
| MSCI ACWI ex USA Growth Index | 18.77% | 3.26% | 7.56% |
| MSCI EAFE Index | 21.27% | 7.91% | 8.38% |
Fund Statistics
| Fund net assets | $5,554,156,440 |
| Total number of portfolio holdings | 64 |
| Total advisory fees paid (net) | $43,901,284 |
| Portfolio turnover rate | 72% |
Graphical Representation of Holdings
The tables below show the investment makeup of the fund, representing a percentage of the total net assets of the fund.
Top Ten Holdings
| Taiwan Semiconductor Manufacturing Company, Ltd. | 8.5% |
| ASML Holding NV | 4.2% |
| Tencent Holdings, Ltd. | 3.9% |
| Safran SA | 2.6% |
| Hitachi, Ltd. | 2.5% |
| SK Hynix, Inc. | 2.3% |
| UBS Group AG | 2.2% |
| DSV A/S | 2.0% |
| Tokyo Electron, Ltd. | 2.0% |
| Bharti Airtel, Ltd. | 2.0% |
Sector Composition
| Information technology | 23.7% |
| Industrials | 23.1% |
| Financials | 15.4% |
| Communication services | 10.7% |
| Materials | 6.4% |
| Consumer discretionary | 6.2% |
| Health care | 5.6% |
| Consumer staples | 5.3% |
| Utilities | 1.4% |
| Real estate | 1.1% |
| Short-term investments and other | 1.1% |
Country Composition
Holdings may not have been held by the fund for the entire period and are subject to change without notice. Portfolio composition is subject to review in accordance with the fund’s investment strategy and may vary in the future. Current and future portfolio holdings are subject to risk and may change at any time.
Top Ten Holdings
| Taiwan Semiconductor Manufacturing Company, Ltd. | 8.5% |
| ASML Holding NV | 4.2% |
| Tencent Holdings, Ltd. | 3.9% |
| Safran SA | 2.6% |
| Hitachi, Ltd. | 2.5% |
| SK Hynix, Inc. | 2.3% |
| UBS Group AG | 2.2% |
| DSV A/S | 2.0% |
| Tokyo Electron, Ltd. | 2.0% |
| Bharti Airtel, Ltd. | 2.0% |
What were the fund costs during the last year ?
(Based on a hypothetical $10,000 investment)
| Fund (Class) | Costs of a $10,000 investment | Costs paid as a percentage of a $10,000 investment |
| Global Shareholder Yield Fund (Class A/JGYAX) |
$122 | 1.09% |
Management’s Discussion of Fund Performance
SUMMARY OF RESULTS
Global Shareholder Yield Fund (Class A/JGYAX) returned 23.86% (excluding sales charges) for the year ended March 31, 2026. Global equities shook off fears of U.S. tariffs on its trading partners to move higher, supported by enthusiasm for artificial intelligence (AI) and easier monetary policy while global economic growth remained moderate. Gains were tempered late in the reporting period as the outbreak of conflict in Iran disrupted global energy supplies and raised inflation risks.
TOP PERFORMANCE CONTRIBUTORS
Information technology | Led by Broadcom, Inc., Samsung Electronics Company, Ltd. and Taiwan Semiconductor Manufacturing Company, Ltd., semiconductor stocks supporting the buildout of AI, and Dell Technologies, Inc., a maker of servers for AI workloads, information technology contributed significantly to the fund’s absolute performance.
BAWAG Group AG | The Austria-based bank serving consumers and small businesses in its home country as well as Germany, Switzerland and the Netherlands saw its shares rise due to strong earnings results, solid shareholder returns via dividends and share buybacks as well as its successful acquisition track record.
Astellas Pharma, Inc. | The Japanese biopharmaceutical company specializing in cancer and women’s health treatments was supported by strong sales momentum and positive clinical trials among its cancer drugs that led to improved earnings results.
TOP PERFORMANCE DETRACTORS
LyondellBasell Industries NV | The Netherlands-based chemicals company was hurt by weak global demand and higher input costs for chemicals in 2025 that weighed on the company’s margins and profitability. The fund exited the position over concern of a potential dividend cut as the oil-based chemical market fundamentals became weak and remained challenged.
Infrastructure Wireless Italiane SpA | The Italian owner and operator of wireless telecom towers saw its stock decline due to two large customers opting out of their contracts, delays in 5G rollouts, increasing debt levels and generally negative sentiment across the European telecom industry.
Paychex, Inc. | The outsourced payroll and human resources provider saw its shares underperform as investors grew concerned that AI could disrupt its business.
The views expressed in this report are those of the portfolio management team and are subject to change. They are not meant as investment advice.
Fund Performance
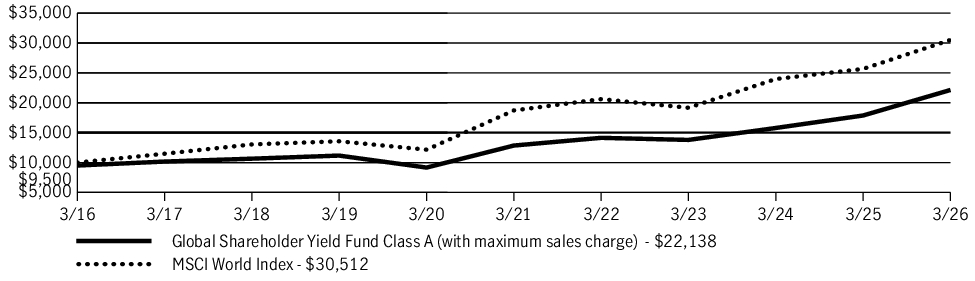
The following graph compares the initial and subsequent account values at the end of each of the most recently completed 10 fiscal years of the fund (or for the life of the fund, if shorter). It assumes a $10,000 initial investment in the fund and in an appropriate, broad-based securities market index for the same period.
GROWTH OF $10,000
| AVERAGE ANNUAL TOTAL RETURN | 1 Year | 5 Years | 10 Years |
| Global Shareholder Yield Fund (Class A/JGYAX) | 17.65% | 10.36% | 8.27% |
| Global Shareholder Yield Fund (Class A/JGYAX)—excluding sales charge | 23.86% | 11.50% | 8.83% |
| MSCI World Index | 18.90% | 10.27% | 11.80% |
Fund Statistics
| Fund net assets | $1,324,464,258 |
| Total number of portfolio holdings | 110 |
| Total advisory fees paid (net) | $8,234,168 |
| Portfolio turnover rate | 24% |
Graphical Representation of Holdings
The tables below show the investment makeup of the fund, representing a percentage of the total net assets of the fund.
Top Ten Holdings
| Dell Technologies, Inc., Class C | 2.0% |
| Cisco Systems, Inc. | 1.9% |
| Taiwan Semiconductor Manufacturing Company, Ltd., ADR | 1.9% |
| Broadcom, Inc. | 1.9% |
| TotalEnergies SE | 1.8% |
| Hewlett Packard Enterprise Company | 1.7% |
| Orange SA | 1.6% |
| Snam SpA | 1.6% |
| Microsoft Corp. | 1.6% |
| AbbVie, Inc. | 1.6% |
Sector Composition
| Information technology | 19.0% |
| Financials | 13.5% |
| Health care | 11.2% |
| Consumer staples | 9.5% |
| Communication services | 9.3% |
| Energy | 9.1% |
| Utilities | 8.6% |
| Industrials | 7.5% |
| Consumer discretionary | 5.8% |
| Real estate | 3.5% |
| Materials | 2.1% |
| Short-term investments and other | 0.9% |
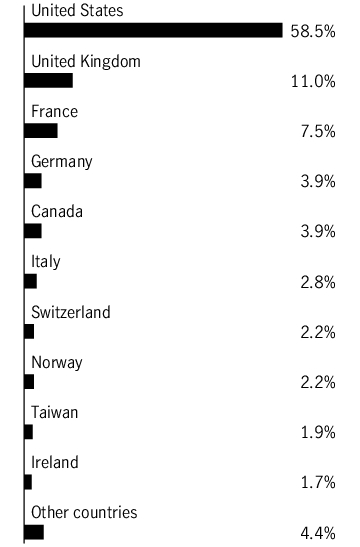
Country Composition

Holdings may not have been held by the fund for the entire period and are subject to change without notice. Portfolio composition is subject to review in accordance with the fund’s investment strategy and may vary in the future. Current and future portfolio holdings are subject to risk and may change at any time.
Top Ten Holdings
| Dell Technologies, Inc., Class C | 2.0% |
| Cisco Systems, Inc. | 1.9% |
| Taiwan Semiconductor Manufacturing Company, Ltd., ADR | 1.9% |
| Broadcom, Inc. | 1.9% |
| TotalEnergies SE | 1.8% |
| Hewlett Packard Enterprise Company | 1.7% |
| Orange SA | 1.6% |
| Snam SpA | 1.6% |
| Microsoft Corp. | 1.6% |
| AbbVie, Inc. | 1.6% |
What were the fund costs during the last year ?
(Based on a hypothetical $10,000 investment)
| Fund (Class) | Costs of a $10,000 investment | Costs paid as a percentage of a $10,000 investment |
| Global Shareholder Yield Fund (Class C/JGYCX) |
$205 | 1.84% |
Management’s Discussion of Fund Performance
SUMMARY OF RESULTS
Global Shareholder Yield Fund (Class C/JGYCX) returned 22.86% (excluding sales charges) for the year ended March 31, 2026. Global equities shook off fears of U.S. tariffs on its trading partners to move higher, supported by enthusiasm for artificial intelligence (AI) and easier monetary policy while global economic growth remained moderate. Gains were tempered late in the reporting period as the outbreak of conflict in Iran disrupted global energy supplies and raised inflation risks.
TOP PERFORMANCE CONTRIBUTORS
Information technology | Led by Broadcom, Inc., Samsung Electronics Company, Ltd. and Taiwan Semiconductor Manufacturing Company, Ltd., semiconductor stocks supporting the buildout of AI, and Dell Technologies, Inc., a maker of servers for AI workloads, information technology contributed significantly to the fund’s absolute performance.
BAWAG Group AG | The Austria-based bank serving consumers and small businesses in its home country as well as Germany, Switzerland and the Netherlands saw its shares rise due to strong earnings results, solid shareholder returns via dividends and share buybacks as well as its successful acquisition track record.
Astellas Pharma, Inc. | The Japanese biopharmaceutical company specializing in cancer and women’s health treatments was supported by strong sales momentum and positive clinical trials among its cancer drugs that led to improved earnings results.
TOP PERFORMANCE DETRACTORS
LyondellBasell Industries NV | The Netherlands-based chemicals company was hurt by weak global demand and higher input costs for chemicals in 2025 that weighed on the company’s margins and profitability. The fund exited the position over concern of a potential dividend cut as the oil-based chemical market fundamentals became weak and remained challenged.
Infrastructure Wireless Italiane SpA | The Italian owner and operator of wireless telecom towers saw its stock decline due to two large customers opting out of their contracts, delays in 5G rollouts, increasing debt levels and generally negative sentiment across the European telecom industry.
Paychex, Inc. | The outsourced payroll and human resources provider saw its shares underperform as investors grew concerned that AI could disrupt its business.
The views expressed in this report are those of the portfolio management team and are subject to change. They are not meant as investment advice.
Fund Performance
The following graph compares the initial and subsequent account values at the end of each of the most recently completed 10 fiscal years of the fund (or for the life of the fund, if shorter). It assumes a $10,000 initial investment in the fund and in an appropriate, broad-based securities market index for the same period.
GROWTH OF $10,000

| AVERAGE ANNUAL TOTAL RETURN | 1 Year | 5 Years | 10 Years |
| Global Shareholder Yield Fund (Class C/JGYCX) | 21.86% | 10.65% | 8.01% |
| Global Shareholder Yield Fund (Class C/JGYCX)—excluding sales charge | 22.86% | 10.65% | 8.01% |
| MSCI World Index | 18.90% | 10.27% | 11.80% |
Fund Statistics
| Fund net assets | $1,324,464,258 |
| Total number of portfolio holdings | 110 |
| Total advisory fees paid (net) | $8,234,168 |
| Portfolio turnover rate | 24% |
Graphical Representation of Holdings
The tables below show the investment makeup of the fund, representing a percentage of the total net assets of the fund.
Top Ten Holdings
| Dell Technologies, Inc., Class C | 2.0% |
| Cisco Systems, Inc. | 1.9% |
| Taiwan Semiconductor Manufacturing Company, Ltd., ADR | 1.9% |
| Broadcom, Inc. | 1.9% |
| TotalEnergies SE | 1.8% |
| Hewlett Packard Enterprise Company | 1.7% |
| Orange SA | 1.6% |
| Snam SpA | 1.6% |
| Microsoft Corp. | 1.6% |
| AbbVie, Inc. | 1.6% |
Sector Composition
| Information technology | 19.0% |
| Financials | 13.5% |
| Health care | 11.2% |
| Consumer staples | 9.5% |
| Communication services | 9.3% |
| Energy | 9.1% |
| Utilities | 8.6% |
| Industrials | 7.5% |
| Consumer discretionary | 5.8% |
| Real estate | 3.5% |
| Materials | 2.1% |
| Short-term investments and other | 0.9% |
Country Composition
Holdings may not have been held by the fund for the entire period and are subject to change without notice. Portfolio composition is subject to review in accordance with the fund’s investment strategy and may vary in the future. Current and future portfolio holdings are subject to risk and may change at any time.
Top Ten Holdings
| Dell Technologies, Inc., Class C | 2.0% |
| Cisco Systems, Inc. | 1.9% |
| Taiwan Semiconductor Manufacturing Company, Ltd., ADR | 1.9% |
| Broadcom, Inc. | 1.9% |
| TotalEnergies SE | 1.8% |
| Hewlett Packard Enterprise Company | 1.7% |
| Orange SA | 1.6% |
| Snam SpA | 1.6% |
| Microsoft Corp. | 1.6% |
| AbbVie, Inc. | 1.6% |
What were the fund costs during the last year ?
(Based on a hypothetical $10,000 investment)
| Fund (Class) | Costs of a $10,000 investment | Costs paid as a percentage of a $10,000 investment |
| Global Shareholder Yield Fund (Class I/JGYIX) |
$94 | 0.84% |
Management’s Discussion of Fund Performance
SUMMARY OF RESULTS
Global Shareholder Yield Fund (Class I/JGYIX) returned 24.11% for the year ended March 31, 2026. Global equities shook off fears of U.S. tariffs on its trading partners to move higher, supported by enthusiasm for artificial intelligence (AI) and easier monetary policy while global economic growth remained moderate. Gains were tempered late in the reporting period as the outbreak of conflict in Iran disrupted global energy supplies and raised inflation risks.
TOP PERFORMANCE CONTRIBUTORS
Information technology | Led by Broadcom, Inc., Samsung Electronics Company, Ltd. and Taiwan Semiconductor Manufacturing Company, Ltd., semiconductor stocks supporting the buildout of AI, and Dell Technologies, Inc., a maker of servers for AI workloads, information technology contributed significantly to the fund’s absolute performance.
BAWAG Group AG | The Austria-based bank serving consumers and small businesses in its home country as well as Germany, Switzerland and the Netherlands saw its shares rise due to strong earnings results, solid shareholder returns via dividends and share buybacks as well as its successful acquisition track record.
Astellas Pharma, Inc. | The Japanese biopharmaceutical company specializing in cancer and women’s health treatments was supported by strong sales momentum and positive clinical trials among its cancer drugs that led to improved earnings results.
TOP PERFORMANCE DETRACTORS
LyondellBasell Industries NV | The Netherlands-based chemicals company was hurt by weak global demand and higher input costs for chemicals in 2025 that weighed on the company’s margins and profitability. The fund exited the position over concern of a potential dividend cut as the oil-based chemical market fundamentals became weak and remained challenged.
Infrastructure Wireless Italiane SpA | The Italian owner and operator of wireless telecom towers saw its stock decline due to two large customers opting out of their contracts, delays in 5G rollouts, increasing debt levels and generally negative sentiment across the European telecom industry.
Paychex, Inc. | The outsourced payroll and human resources provider saw its shares underperform as investors grew concerned that AI could disrupt its business.
The views expressed in this report are those of the portfolio management team and are subject to change. They are not meant as investment advice.
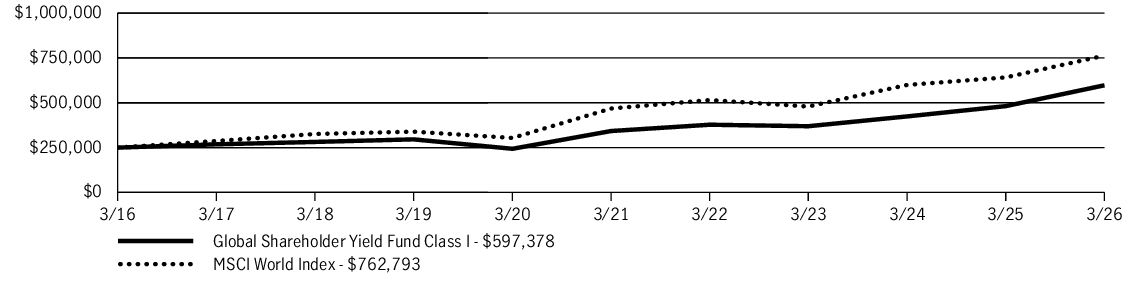
Fund Performance
The following graph compares the initial and subsequent account values at the end of each of the most recently completed 10 fiscal years of the fund (or for the life of the fund, if shorter). It assumes a $250,000 initial investment in the fund and in an appropriate, broad-based securities market index for the same period.
GROWTH OF $250,000
| AVERAGE ANNUAL TOTAL RETURN | 1 Year | 5 Years | 10 Years |
| Global Shareholder Yield Fund (Class I/JGYIX) | 24.11% | 11.77% | 9.10% |
| MSCI World Index | 18.90% | 10.27% | 11.80% |
Fund Statistics
| Fund net assets | $1,324,464,258 |
| Total number of portfolio holdings | 110 |
| Total advisory fees paid (net) | $8,234,168 |
| Portfolio turnover rate | 24% |
Graphical Representation of Holdings
The tables below show the investment makeup of the fund, representing a percentage of the total net assets of the fund.
Top Ten Holdings
| Dell Technologies, Inc., Class C | 2.0% |
| Cisco Systems, Inc. | 1.9% |
| Taiwan Semiconductor Manufacturing Company, Ltd., ADR | 1.9% |
| Broadcom, Inc. | 1.9% |
| TotalEnergies SE | 1.8% |
| Hewlett Packard Enterprise Company | 1.7% |
| Orange SA | 1.6% |
| Snam SpA | 1.6% |
| Microsoft Corp. | 1.6% |
| AbbVie, Inc. | 1.6% |
Sector Composition
| Information technology | 19.0% |
| Financials | 13.5% |
| Health care | 11.2% |
| Consumer staples | 9.5% |
| Communication services | 9.3% |
| Energy | 9.1% |
| Utilities | 8.6% |
| Industrials | 7.5% |
| Consumer discretionary | 5.8% |
| Real estate | 3.5% |
| Materials | 2.1% |
| Short-term investments and other | 0.9% |
Country Composition

Holdings may not have been held by the fund for the entire period and are subject to change without notice. Portfolio composition is subject to review in accordance with the fund’s investment strategy and may vary in the future. Current and future portfolio holdings are subject to risk and may change at any time.
Top Ten Holdings
| Dell Technologies, Inc., Class C | 2.0% |
| Cisco Systems, Inc. | 1.9% |
| Taiwan Semiconductor Manufacturing Company, Ltd., ADR | 1.9% |
| Broadcom, Inc. | 1.9% |
| TotalEnergies SE | 1.8% |
| Hewlett Packard Enterprise Company | 1.7% |
| Orange SA | 1.6% |
| Snam SpA | 1.6% |
| Microsoft Corp. | 1.6% |
| AbbVie, Inc. | 1.6% |
What were the fund costs during the last year ?
(Based on a hypothetical $10,000 investment)
| Fund (Class) | Costs of a $10,000 investment | Costs paid as a percentage of a $10,000 investment |
| Global Shareholder Yield Fund (Class R2/JGSRX) |
$136 | 1.22% |
Management’s Discussion of Fund Performance
SUMMARY OF RESULTS
Global Shareholder Yield Fund (Class R2/JGSRX) returned 23.64% for the year ended March 31, 2026. Global equities shook off fears of U.S. tariffs on its trading partners to move higher, supported by enthusiasm for artificial intelligence (AI) and easier monetary policy while global economic growth remained moderate. Gains were tempered late in the reporting period as the outbreak of conflict in Iran disrupted global energy supplies and raised inflation risks.
TOP PERFORMANCE CONTRIBUTORS
Information technology | Led by Broadcom, Inc., Samsung Electronics Company, Ltd. and Taiwan Semiconductor Manufacturing Company, Ltd., semiconductor stocks supporting the buildout of AI, and Dell Technologies, Inc., a maker of servers for AI workloads, information technology contributed significantly to the fund’s absolute performance.
BAWAG Group AG | The Austria-based bank serving consumers and small businesses in its home country as well as Germany, Switzerland and the Netherlands saw its shares rise due to strong earnings results, solid shareholder returns via dividends and share buybacks as well as its successful acquisition track record.
Astellas Pharma, Inc. | The Japanese biopharmaceutical company specializing in cancer and women’s health treatments was supported by strong sales momentum and positive clinical trials among its cancer drugs that led to improved earnings results.
TOP PERFORMANCE DETRACTORS
LyondellBasell Industries NV | The Netherlands-based chemicals company was hurt by weak global demand and higher input costs for chemicals in 2025 that weighed on the company’s margins and profitability. The fund exited the position over concern of a potential dividend cut as the oil-based chemical market fundamentals became weak and remained challenged.
Infrastructure Wireless Italiane SpA | The Italian owner and operator of wireless telecom towers saw its stock decline due to two large customers opting out of their contracts, delays in 5G rollouts, increasing debt levels and generally negative sentiment across the European telecom industry.
Paychex, Inc. | The outsourced payroll and human resources provider saw its shares underperform as investors grew concerned that AI could disrupt its business.
The views expressed in this report are those of the portfolio management team and are subject to change. They are not meant as investment advice.
Fund Performance
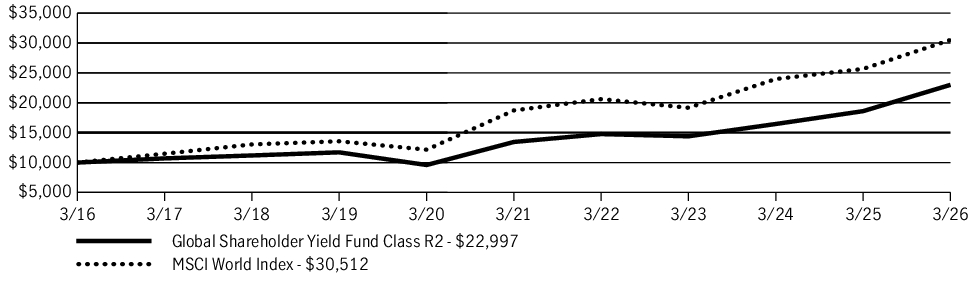
The following graph compares the initial and subsequent account values at the end of each of the most recently completed 10 fiscal years of the fund (or for the life of the fund, if shorter). It assumes a $10,000 initial investment in the fund and in an appropriate, broad-based securities market index for the same period.
GROWTH OF $10,000
| AVERAGE ANNUAL TOTAL RETURN | 1 Year | 5 Years | 10 Years |
| Global Shareholder Yield Fund (Class R2/JGSRX) | 23.64% | 11.34% | 8.68% |
| MSCI World Index | 18.90% | 10.27% | 11.80% |
Fund Statistics
| Fund net assets | $1,324,464,258 |
| Total number of portfolio holdings | 110 |
| Total advisory fees paid (net) | $8,234,168 |
| Portfolio turnover rate | 24% |
Graphical Representation of Holdings
The tables below show the investment makeup of the fund, representing a percentage of the total net assets of the fund.
Top Ten Holdings
| Dell Technologies, Inc., Class C | 2.0% |
| Cisco Systems, Inc. | 1.9% |
| Taiwan Semiconductor Manufacturing Company, Ltd., ADR | 1.9% |
| Broadcom, Inc. | 1.9% |
| TotalEnergies SE | 1.8% |
| Hewlett Packard Enterprise Company | 1.7% |
| Orange SA | 1.6% |
| Snam SpA | 1.6% |
| Microsoft Corp. | 1.6% |
| AbbVie, Inc. | 1.6% |
Sector Composition
| Information technology | 19.0% |
| Financials | 13.5% |
| Health care | 11.2% |
| Consumer staples | 9.5% |
| Communication services | 9.3% |
| Energy | 9.1% |
| Utilities | 8.6% |
| Industrials | 7.5% |
| Consumer discretionary | 5.8% |
| Real estate | 3.5% |
| Materials | 2.1% |
| Short-term investments and other | 0.9% |
Country Composition

Holdings may not have been held by the fund for the entire period and are subject to change without notice. Portfolio composition is subject to review in accordance with the fund’s investment strategy and may vary in the future. Current and future portfolio holdings are subject to risk and may change at any time.
Top Ten Holdings
| Dell Technologies, Inc., Class C | 2.0% |
| Cisco Systems, Inc. | 1.9% |
| Taiwan Semiconductor Manufacturing Company, Ltd., ADR | 1.9% |
| Broadcom, Inc. | 1.9% |
| TotalEnergies SE | 1.8% |
| Hewlett Packard Enterprise Company | 1.7% |
| Orange SA | 1.6% |
| Snam SpA | 1.6% |
| Microsoft Corp. | 1.6% |
| AbbVie, Inc. | 1.6% |
What were the fund costs during the last year ?
(Based on a hypothetical $10,000 investment)
| Fund (Class) | Costs of a $10,000 investment | Costs paid as a percentage of a $10,000 investment |
| Global Shareholder Yield Fund (Class R6/JGRSX) |
$83 | 0.74% |
Management’s Discussion of Fund Performance
SUMMARY OF RESULTS
Global Shareholder Yield Fund (Class R6/JGRSX) returned 24.20% for the year ended March 31, 2026. Global equities shook off fears of U.S. tariffs on its trading partners to move higher, supported by enthusiasm for artificial intelligence (AI) and easier monetary policy while global economic growth remained moderate. Gains were tempered late in the reporting period as the outbreak of conflict in Iran disrupted global energy supplies and raised inflation risks.
TOP PERFORMANCE CONTRIBUTORS
Information technology | Led by Broadcom, Inc., Samsung Electronics Company, Ltd. and Taiwan Semiconductor Manufacturing Company, Ltd., semiconductor stocks supporting the buildout of AI, and Dell Technologies, Inc., a maker of servers for AI workloads, information technology contributed significantly to the fund’s absolute performance.
BAWAG Group AG | The Austria-based bank serving consumers and small businesses in its home country as well as Germany, Switzerland and the Netherlands saw its shares rise due to strong earnings results, solid shareholder returns via dividends and share buybacks as well as its successful acquisition track record.
Astellas Pharma, Inc. | The Japanese biopharmaceutical company specializing in cancer and women’s health treatments was supported by strong sales momentum and positive clinical trials among its cancer drugs that led to improved earnings results.
TOP PERFORMANCE DETRACTORS
LyondellBasell Industries NV | The Netherlands-based chemicals company was hurt by weak global demand and higher input costs for chemicals in 2025 that weighed on the company’s margins and profitability. The fund exited the position over concern of a potential dividend cut as the oil-based chemical market fundamentals became weak and remained challenged.
Infrastructure Wireless Italiane SpA | The Italian owner and operator of wireless telecom towers saw its stock decline due to two large customers opting out of their contracts, delays in 5G rollouts, increasing debt levels and generally negative sentiment across the European telecom industry.
Paychex, Inc. | The outsourced payroll and human resources provider saw its shares underperform as investors grew concerned that AI could disrupt its business.
The views expressed in this report are those of the portfolio management team and are subject to change. They are not meant as investment advice.
Fund Performance
The following graph compares the initial and subsequent account values at the end of each of the most recently completed 10 fiscal years of the fund (or for the life of the fund, if shorter). It assumes a $1,000,000 initial investment in the fund and in an appropriate, broad-based securities market index for the same period.
GROWTH OF $1,000,000
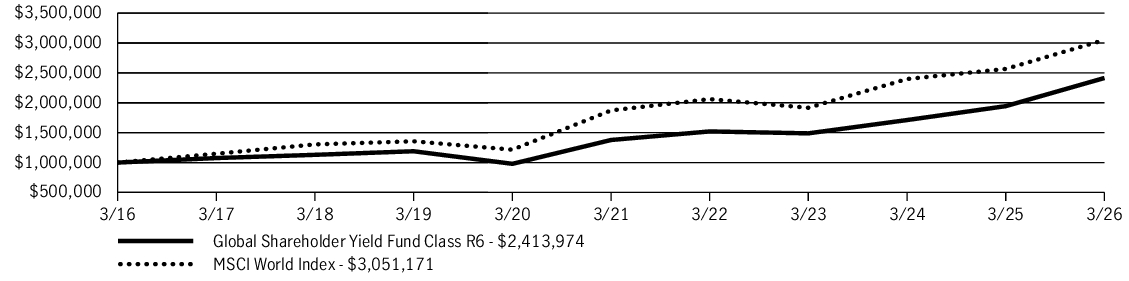
| AVERAGE ANNUAL TOTAL RETURN | 1 Year | 5 Years | 10 Years |
| Global Shareholder Yield Fund (Class R6/JGRSX) | 24.20% | 11.88% | 9.21% |
| MSCI World Index | 18.90% | 10.27% | 11.80% |
Fund Statistics
| Fund net assets | $1,324,464,258 |
| Total number of portfolio holdings | 110 |
| Total advisory fees paid (net) | $8,234,168 |
| Portfolio turnover rate | 24% |
Graphical Representation of Holdings
The tables below show the investment makeup of the fund, representing a percentage of the total net assets of the fund.
Top Ten Holdings
| Dell Technologies, Inc., Class C | 2.0% |
| Cisco Systems, Inc. | 1.9% |
| Taiwan Semiconductor Manufacturing Company, Ltd., ADR | 1.9% |
| Broadcom, Inc. | 1.9% |
| TotalEnergies SE | 1.8% |
| Hewlett Packard Enterprise Company | 1.7% |
| Orange SA | 1.6% |
| Snam SpA | 1.6% |
| Microsoft Corp. | 1.6% |
| AbbVie, Inc. | 1.6% |
Sector Composition
| Information technology | 19.0% |
| Financials | 13.5% |
| Health care | 11.2% |
| Consumer staples | 9.5% |
| Communication services | 9.3% |
| Energy | 9.1% |
| Utilities | 8.6% |
| Industrials | 7.5% |
| Consumer discretionary | 5.8% |
| Real estate | 3.5% |
| Materials | 2.1% |
| Short-term investments and other | 0.9% |
Country Composition

Holdings may not have been held by the fund for the entire period and are subject to change without notice. Portfolio composition is subject to review in accordance with the fund’s investment strategy and may vary in the future. Current and future portfolio holdings are subject to risk and may change at any time.
Top Ten Holdings
| Dell Technologies, Inc., Class C | 2.0% |
| Cisco Systems, Inc. | 1.9% |
| Taiwan Semiconductor Manufacturing Company, Ltd., ADR | 1.9% |
| Broadcom, Inc. | 1.9% |
| TotalEnergies SE | 1.8% |
| Hewlett Packard Enterprise Company | 1.7% |
| Orange SA | 1.6% |
| Snam SpA | 1.6% |
| Microsoft Corp. | 1.6% |
| AbbVie, Inc. | 1.6% |
What were the fund costs during the last year ?
(Based on a hypothetical $10,000 investment)
| Fund (Class) | Costs of a $10,000 investment | Costs paid as a percentage of a $10,000 investment |
| Disciplined Value Fund (Class R6/JDVWX) |
$66 | 0.60% |
Management’s Discussion of Fund Performance
SUMMARY OF RESULTS
Disciplined Value Fund (Class R6/JDVWX) returned 19.61% for the year ended March 31, 2026. Despite a sell-off in March 2026 caused by the start of the war in Iran, U.S. equities registered strong returns in the annual period. The combination of steady economic growth, robust corporate earnings, and accommodative U.S. Federal Reserve policy all helped support investors’ appetite for risk. Value stocks, while outperforming in the first quarter of 2026, lagged the broader market over the full 12 months.
TOP PERFORMANCE CONTRIBUTORS
Information technology | The semiconductor stocks Micron Technology, Inc. and Applied Materials, Inc., which benefited from expectations for rising demand fueled by the artificial intelligence (AI) infrastructure buildout, were the leading contributors to absolute returns in the sector. Flex, Ltd. and Oracle Corp. also produced strong gains.
Industrials | Positions in aerospace/defense stocks were key contributors, led by L3Harris Technologies, Inc. The trucking companies C.H. Robinson Worldwide, Inc. and Old Dominion Freight Line, Inc. also performed well, as did FedEx Corp.
Other areas of strength | Holdings in materials, energy, and financials made meaningful contributions, as well. Kinross Gold Corp., Marathon Petroleum Corp., and JPMorgan Chase & Co. were the leading contributors in the three sectors, respectively.
TOP PERFORMANCE DETRACTORS
Health care | UnitedHealth Group, Inc., which was hurt by questions about its billing practices, a management change, and weaker profit margins, accounted for the majority of the shortfall.
Consumer discretionary | This was the only other sector in which the fund’s holdings posted a negative absolute return. Amazon.com, Inc., and lululemon athletica, Inc., both of which were added during the course of the period, were the primary detractors.
The views expressed in this report are those of the portfolio management team and are subject to change. They are not meant as investment advice.
Fund Performance
The following graph compares the initial and subsequent account values at the end of each of the most recently completed 10 fiscal years of the fund (or for the life of the fund, if shorter). It assumes a $1,000,000 initial investment in the fund and in an appropriate, broad-based securities market index for the same period.
GROWTH OF $1,000,000
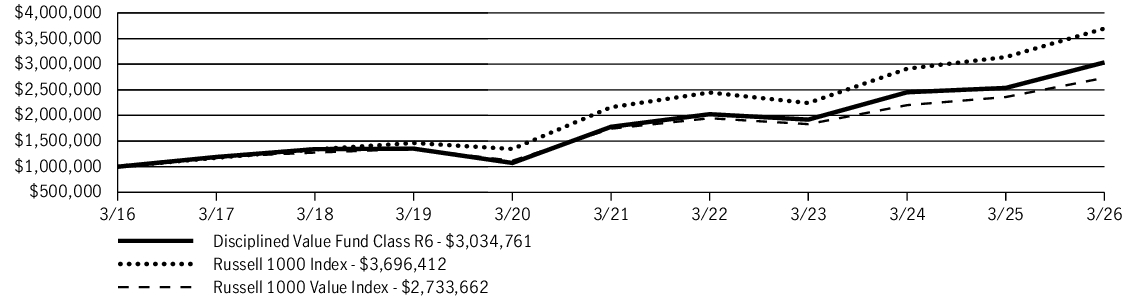
| AVERAGE ANNUAL TOTAL RETURN | 1 Year | 5 Years | 10 Years |
| Disciplined Value Fund (Class R6/JDVWX) | 19.61% | 11.28% | 11.74% |
| Russell 1000 Index | 17.74% | 11.34% | 13.97% |
| Russell 1000 Value Index | 15.87% | 9.43% | 10.58% |
Fund Statistics
| Fund net assets | $16,992,910,855 |
| Total number of portfolio holdings | 81 |
| Total advisory fees paid (net) | $99,503,860 |
| Portfolio turnover rate | 42% |
Graphical Representation of Holdings
The tables below show the investment makeup of the fund, representing a percentage of the total net assets of the fund.
Top Ten Holdings
| JPMorgan Chase & Co. | 4.1% |
| Amazon.com, Inc. | 2.7% |
| Philip Morris International, Inc. | 2.3% |
| Kinross Gold Corp. | 2.2% |
| Marathon Petroleum Corp. | 2.1% |
| U.S. Foods Holding Corp. | 2.0% |
| Micron Technology, Inc. | 2.0% |
| Applied Materials, Inc. | 2.0% |
| CRH PLC | 2.0% |
| Cencora, Inc. | 1.9% |
Sector Composition
| Financials | 20.6% |
| Industrials | 16.2% |
| Information technology | 12.7% |
| Health care | 10.3% |
| Energy | 8.0% |
| Materials | 7.9% |
| Consumer staples | 7.1% |
| Utilities | 5.4% |
| Consumer discretionary | 4.9% |
| Communication services | 3.7% |
| Short-term investments and other | 3.2% |
Holdings may not have been held by the fund for the entire period and are subject to change without notice. Portfolio composition is subject to review in accordance with the fund’s investment strategy and may vary in the future. Current and future portfolio holdings are subject to risk and may change at any time.
Top Ten Holdings
| JPMorgan Chase & Co. | 4.1% |
| Amazon.com, Inc. | 2.7% |
| Philip Morris International, Inc. | 2.3% |
| Kinross Gold Corp. | 2.2% |
| Marathon Petroleum Corp. | 2.1% |
| U.S. Foods Holding Corp. | 2.0% |
| Micron Technology, Inc. | 2.0% |
| Applied Materials, Inc. | 2.0% |
| CRH PLC | 2.0% |
| Cencora, Inc. | 1.9% |
What were the fund costs during the last year ?
(Based on a hypothetical $10,000 investment)
| Fund (Class) | Costs of a $10,000 investment | Costs paid as a percentage of a $10,000 investment |
| Disciplined Value Fund (Class R5/JDVVX) |
$71 | 0.65% |
Management’s Discussion of Fund Performance
SUMMARY OF RESULTS
Disciplined Value Fund (Class R5/JDVVX) returned 19.60% for the year ended March 31, 2026. Despite a sell-off in March 2026 caused by the start of the war in Iran, U.S. equities registered strong returns in the annual period. The combination of steady economic growth, robust corporate earnings, and accommodative U.S. Federal Reserve policy all helped support investors’ appetite for risk. Value stocks, while outperforming in the first quarter of 2026, lagged the broader market over the full 12 months.
TOP PERFORMANCE CONTRIBUTORS
Information technology | The semiconductor stocks Micron Technology, Inc. and Applied Materials, Inc., which benefited from expectations for rising demand fueled by the artificial intelligence (AI) infrastructure buildout, were the leading contributors to absolute returns in the sector. Flex, Ltd. and Oracle Corp. also produced strong gains.
Industrials | Positions in aerospace/defense stocks were key contributors, led by L3Harris Technologies, Inc. The trucking companies C.H. Robinson Worldwide, Inc. and Old Dominion Freight Line, Inc. also performed well, as did FedEx Corp.
Other areas of strength | Holdings in materials, energy, and financials made meaningful contributions, as well. Kinross Gold Corp., Marathon Petroleum Corp., and JPMorgan Chase & Co. were the leading contributors in the three sectors, respectively.
TOP PERFORMANCE DETRACTORS
Health care | UnitedHealth Group, Inc., which was hurt by questions about its billing practices, a management change, and weaker profit margins, accounted for the majority of the shortfall.
Consumer discretionary | This was the only other sector in which the fund’s holdings posted a negative absolute return. Amazon.com, Inc., and lululemon athletica, Inc., both of which were added during the course of the period, were the primary detractors.
The views expressed in this report are those of the portfolio management team and are subject to change. They are not meant as investment advice.
Fund Performance
The following graph compares the initial and subsequent account values at the end of each of the most recently completed 10 fiscal years of the fund (or for the life of the fund, if shorter). It assumes a $10,000 initial investment in the fund and in an appropriate, broad-based securities market index for the same period.
GROWTH OF $10,000
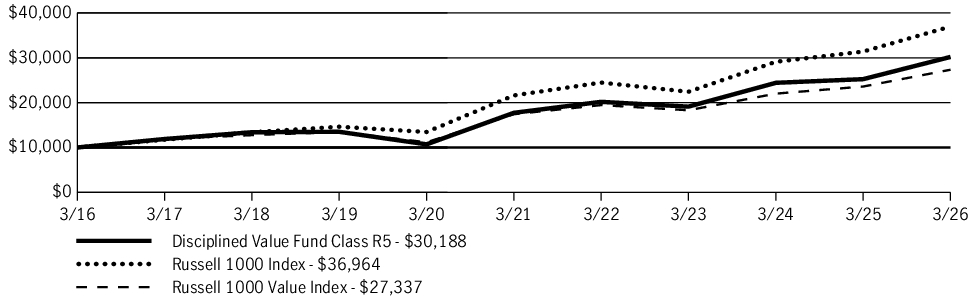
| AVERAGE ANNUAL TOTAL RETURN | 1 Year | 5 Years | 10 Years |
| Disciplined Value Fund (Class R5/JDVVX) | 19.60% | 11.23% | 11.68% |
| Russell 1000 Index | 17.74% | 11.34% | 13.97% |
| Russell 1000 Value Index | 15.87% | 9.43% | 10.58% |
Fund Statistics
| Fund net assets | $16,992,910,855 |
| Total number of portfolio holdings | 81 |
| Total advisory fees paid (net) | $99,503,860 |
| Portfolio turnover rate | 42% |
Graphical Representation of Holdings
The tables below show the investment makeup of the fund, representing a percentage of the total net assets of the fund.
Top Ten Holdings
| JPMorgan Chase & Co. | 4.1% |
| Amazon.com, Inc. | 2.7% |
| Philip Morris International, Inc. | 2.3% |
| Kinross Gold Corp. | 2.2% |
| Marathon Petroleum Corp. | 2.1% |
| U.S. Foods Holding Corp. | 2.0% |
| Micron Technology, Inc. | 2.0% |
| Applied Materials, Inc. | 2.0% |
| CRH PLC | 2.0% |
| Cencora, Inc. | 1.9% |
Sector Composition
| Financials | 20.6% |
| Industrials | 16.2% |
| Information technology | 12.7% |
| Health care | 10.3% |
| Energy | 8.0% |
| Materials | 7.9% |
| Consumer staples | 7.1% |
| Utilities | 5.4% |
| Consumer discretionary | 4.9% |
| Communication services | 3.7% |
| Short-term investments and other | 3.2% |
Holdings may not have been held by the fund for the entire period and are subject to change without notice. Portfolio composition is subject to review in accordance with the fund’s investment strategy and may vary in the future. Current and future portfolio holdings are subject to risk and may change at any time.
Top Ten Holdings
| JPMorgan Chase & Co. | 4.1% |
| Amazon.com, Inc. | 2.7% |
| Philip Morris International, Inc. | 2.3% |
| Kinross Gold Corp. | 2.2% |
| Marathon Petroleum Corp. | 2.1% |
| U.S. Foods Holding Corp. | 2.0% |
| Micron Technology, Inc. | 2.0% |
| Applied Materials, Inc. | 2.0% |
| CRH PLC | 2.0% |
| Cencora, Inc. | 1.9% |
What were the fund costs during the last year ?
(Based on a hypothetical $10,000 investment)
| Fund (Class) | Costs of a $10,000 investment | Costs paid as a percentage of a $10,000 investment |
| Disciplined Value Fund (Class R4/JDVFX) |
$93 | 0.85% |
Management’s Discussion of Fund Performance
SUMMARY OF RESULTS
Disciplined Value Fund (Class R4/JDVFX) returned 19.35% for the year ended March 31, 2026. Despite a sell-off in March 2026 caused by the start of the war in Iran, U.S. equities registered strong returns in the annual period. The combination of steady economic growth, robust corporate earnings, and accommodative U.S. Federal Reserve policy all helped support investors’ appetite for risk. Value stocks, while outperforming in the first quarter of 2026, lagged the broader market over the full 12 months.
TOP PERFORMANCE CONTRIBUTORS
Information technology | The semiconductor stocks Micron Technology, Inc. and Applied Materials, Inc., which benefited from expectations for rising demand fueled by the artificial intelligence (AI) infrastructure buildout, were the leading contributors to absolute returns in the sector. Flex, Ltd. and Oracle Corp. also produced strong gains.
Industrials | Positions in aerospace/defense stocks were key contributors, led by L3Harris Technologies, Inc. The trucking companies C.H. Robinson Worldwide, Inc. and Old Dominion Freight Line, Inc. also performed well, as did FedEx Corp.
Other areas of strength | Holdings in materials, energy, and financials made meaningful contributions, as well. Kinross Gold Corp., Marathon Petroleum Corp., and JPMorgan Chase & Co. were the leading contributors in the three sectors, respectively.
TOP PERFORMANCE DETRACTORS
Health care | UnitedHealth Group, Inc., which was hurt by questions about its billing practices, a management change, and weaker profit margins, accounted for the majority of the shortfall.
Consumer discretionary | This was the only other sector in which the fund’s holdings posted a negative absolute return. Amazon.com, Inc., and lululemon athletica, Inc., both of which were added during the course of the period, were the primary detractors.
The views expressed in this report are those of the portfolio management team and are subject to change. They are not meant as investment advice.
Fund Performance
The following graph compares the initial and subsequent account values at the end of each of the most recently completed 10 fiscal years of the fund (or for the life of the fund, if shorter). It assumes a $10,000 initial investment in the fund and in an appropriate, broad-based securities market index for the same period.
GROWTH OF $10,000
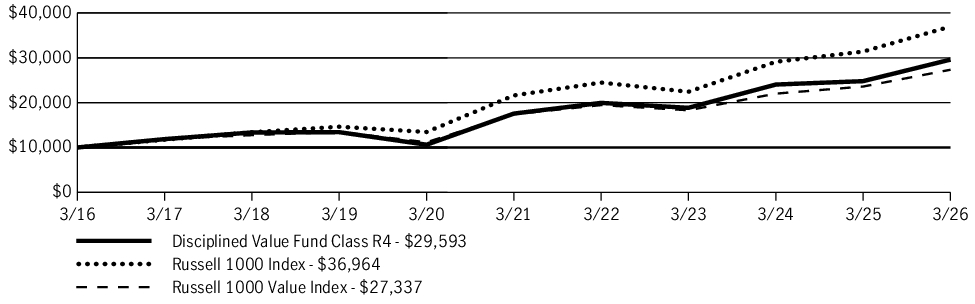
| AVERAGE ANNUAL TOTAL RETURN | 1 Year | 5 Years | 10 Years |
| Disciplined Value Fund (Class R4/JDVFX) | 19.35% | 11.00% | 11.46% |
| Russell 1000 Index | 17.74% | 11.34% | 13.97% |
| Russell 1000 Value Index | 15.87% | 9.43% | 10.58% |
Fund Statistics
| Fund net assets | $16,992,910,855 |
| Total number of portfolio holdings | 81 |
| Total advisory fees paid (net) | $99,503,860 |
| Portfolio turnover rate | 42% |
Graphical Representation of Holdings
The tables below show the investment makeup of the fund, representing a percentage of the total net assets of the fund.
Top Ten Holdings
| JPMorgan Chase & Co. | 4.1% |
| Amazon.com, Inc. | 2.7% |
| Philip Morris International, Inc. | 2.3% |
| Kinross Gold Corp. | 2.2% |
| Marathon Petroleum Corp. | 2.1% |
| U.S. Foods Holding Corp. | 2.0% |
| Micron Technology, Inc. | 2.0% |
| Applied Materials, Inc. | 2.0% |
| CRH PLC | 2.0% |
| Cencora, Inc. | 1.9% |
Sector Composition
| Financials | 20.6% |
| Industrials | 16.2% |
| Information technology | 12.7% |
| Health care | 10.3% |
| Energy | 8.0% |
| Materials | 7.9% |
| Consumer staples | 7.1% |
| Utilities | 5.4% |
| Consumer discretionary | 4.9% |
| Communication services | 3.7% |
| Short-term investments and other | 3.2% |
Holdings may not have been held by the fund for the entire period and are subject to change without notice. Portfolio composition is subject to review in accordance with the fund’s investment strategy and may vary in the future. Current and future portfolio holdings are subject to risk and may change at any time.
Top Ten Holdings
| JPMorgan Chase & Co. | 4.1% |
| Amazon.com, Inc. | 2.7% |
| Philip Morris International, Inc. | 2.3% |
| Kinross Gold Corp. | 2.2% |
| Marathon Petroleum Corp. | 2.1% |
| U.S. Foods Holding Corp. | 2.0% |
| Micron Technology, Inc. | 2.0% |
| Applied Materials, Inc. | 2.0% |
| CRH PLC | 2.0% |
| Cencora, Inc. | 1.9% |
What were the fund costs during the last year ?
(Based on a hypothetical $10,000 investment)
| Fund (Class) | Costs of a $10,000 investment | Costs paid as a percentage of a $10,000 investment |
| Disciplined Value Fund (Class R2/JDVPX) |
$120 | 1.10% |
Management’s Discussion of Fund Performance
SUMMARY OF RESULTS
Disciplined Value Fund (Class R2/JDVPX) returned 19.04% for the year ended March 31, 2026. Despite a sell-off in March 2026 caused by the start of the war in Iran, U.S. equities registered strong returns in the annual period. The combination of steady economic growth, robust corporate earnings, and accommodative U.S. Federal Reserve policy all helped support investors’ appetite for risk. Value stocks, while outperforming in the first quarter of 2026, lagged the broader market over the full 12 months.
TOP PERFORMANCE CONTRIBUTORS
Information technology | The semiconductor stocks Micron Technology, Inc. and Applied Materials, Inc., which benefited from expectations for rising demand fueled by the artificial intelligence (AI) infrastructure buildout, were the leading contributors to absolute returns in the sector. Flex, Ltd. and Oracle Corp. also produced strong gains.
Industrials | Positions in aerospace/defense stocks were key contributors, led by L3Harris Technologies, Inc. The trucking companies C.H. Robinson Worldwide, Inc. and Old Dominion Freight Line, Inc. also performed well, as did FedEx Corp.
Other areas of strength | Holdings in materials, energy, and financials made meaningful contributions, as well. Kinross Gold Corp., Marathon Petroleum Corp., and JPMorgan Chase & Co. were the leading contributors in the three sectors, respectively.
TOP PERFORMANCE DETRACTORS
Health care | UnitedHealth Group, Inc., which was hurt by questions about its billing practices, a management change, and weaker profit margins, accounted for the majority of the shortfall.
Consumer discretionary | This was the only other sector in which the fund’s holdings posted a negative absolute return. Amazon.com, Inc., and lululemon athletica, Inc., both of which were added during the course of the period, were the primary detractors.
The views expressed in this report are those of the portfolio management team and are subject to change. They are not meant as investment advice.
Fund Performance
The following graph compares the initial and subsequent account values at the end of each of the most recently completed 10 fiscal years of the fund (or for the life of the fund, if shorter). It assumes a $10,000 initial investment in the fund and in an appropriate, broad-based securities market index for the same period.
GROWTH OF $10,000
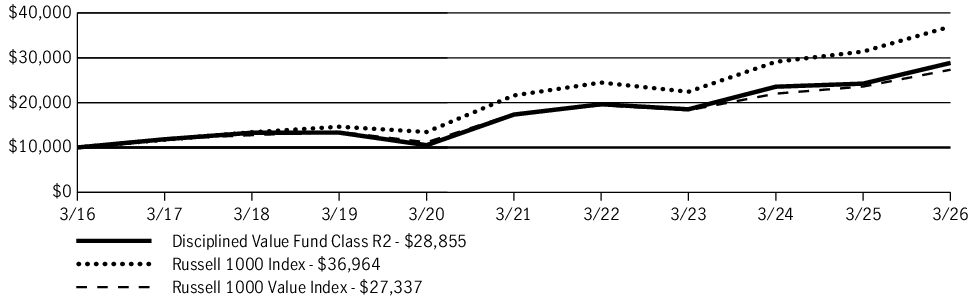
| AVERAGE ANNUAL TOTAL RETURN | 1 Year | 5 Years | 10 Years |
| Disciplined Value Fund (Class R2/JDVPX) | 19.04% | 10.72% | 11.18% |
| Russell 1000 Index | 17.74% | 11.34% | 13.97% |
| Russell 1000 Value Index | 15.87% | 9.43% | 10.58% |
Fund Statistics
| Fund net assets | $16,992,910,855 |
| Total number of portfolio holdings | 81 |
| Total advisory fees paid (net) | $99,503,860 |
| Portfolio turnover rate | 42% |
Graphical Representation of Holdings
The tables below show the investment makeup of the fund, representing a percentage of the total net assets of the fund.
Top Ten Holdings
| JPMorgan Chase & Co. | 4.1% |
| Amazon.com, Inc. | 2.7% |
| Philip Morris International, Inc. | 2.3% |
| Kinross Gold Corp. | 2.2% |
| Marathon Petroleum Corp. | 2.1% |
| U.S. Foods Holding Corp. | 2.0% |
| Micron Technology, Inc. | 2.0% |
| Applied Materials, Inc. | 2.0% |
| CRH PLC | 2.0% |
| Cencora, Inc. | 1.9% |
Sector Composition
| Financials | 20.6% |
| Industrials | 16.2% |
| Information technology | 12.7% |
| Health care | 10.3% |
| Energy | 8.0% |
| Materials | 7.9% |
| Consumer staples | 7.1% |
| Utilities | 5.4% |
| Consumer discretionary | 4.9% |
| Communication services | 3.7% |
| Short-term investments and other | 3.2% |
Holdings may not have been held by the fund for the entire period and are subject to change without notice. Portfolio composition is subject to review in accordance with the fund’s investment strategy and may vary in the future. Current and future portfolio holdings are subject to risk and may change at any time.
Top Ten Holdings
| JPMorgan Chase & Co. | 4.1% |
| Amazon.com, Inc. | 2.7% |
| Philip Morris International, Inc. | 2.3% |
| Kinross Gold Corp. | 2.2% |
| Marathon Petroleum Corp. | 2.1% |
| U.S. Foods Holding Corp. | 2.0% |
| Micron Technology, Inc. | 2.0% |
| Applied Materials, Inc. | 2.0% |
| CRH PLC | 2.0% |
| Cencora, Inc. | 1.9% |
What were the fund costs during the last year ?
(Based on a hypothetical $10,000 investment)
| Fund (Class) | Costs of a $10,000 investment | Costs paid as a percentage of a $10,000 investment |
| Disciplined Value Fund (Class NAV/JDVNX) |
$65 | 0.59% |
Management’s Discussion of Fund Performance
SUMMARY OF RESULTS
Disciplined Value Fund (Class NAV/JDVNX) returned 19.65% for the year ended March 31, 2026. Despite a sell-off in March 2026 caused by the start of the war in Iran, U.S. equities registered strong returns in the annual period. The combination of steady economic growth, robust corporate earnings, and accommodative U.S. Federal Reserve policy all helped support investors’ appetite for risk. Value stocks, while outperforming in the first quarter of 2026, lagged the broader market over the full 12 months.
TOP PERFORMANCE CONTRIBUTORS
Information technology | The semiconductor stocks Micron Technology, Inc. and Applied Materials, Inc., which benefited from expectations for rising demand fueled by the artificial intelligence (AI) infrastructure buildout, were the leading contributors to absolute returns in the sector. Flex, Ltd. and Oracle Corp. also produced strong gains.
Industrials | Positions in aerospace/defense stocks were key contributors, led by L3Harris Technologies, Inc. The trucking companies C.H. Robinson Worldwide, Inc. and Old Dominion Freight Line, Inc. also performed well, as did FedEx Corp.
Other areas of strength | Holdings in materials, energy, and financials made meaningful contributions, as well. Kinross Gold Corp., Marathon Petroleum Corp., and JPMorgan Chase & Co. were the leading contributors in the three sectors, respectively.
TOP PERFORMANCE DETRACTORS
Health care | UnitedHealth Group, Inc., which was hurt by questions about its billing practices, a management change, and weaker profit margins, accounted for the majority of the shortfall.
Consumer discretionary | This was the only other sector in which the fund’s holdings posted a negative absolute return. Amazon.com, Inc., and lululemon athletica, Inc., both of which were added during the course of the period, were the primary detractors.
The views expressed in this report are those of the portfolio management team and are subject to change. They are not meant as investment advice.
Fund Performance
The following graph compares the initial and subsequent account values at the end of each of the most recently completed 10 fiscal years of the fund (or for the life of the fund, if shorter). It assumes a $10,000 initial investment in the fund and in an appropriate, broad-based securities market index for the same period.
GROWTH OF $10,000
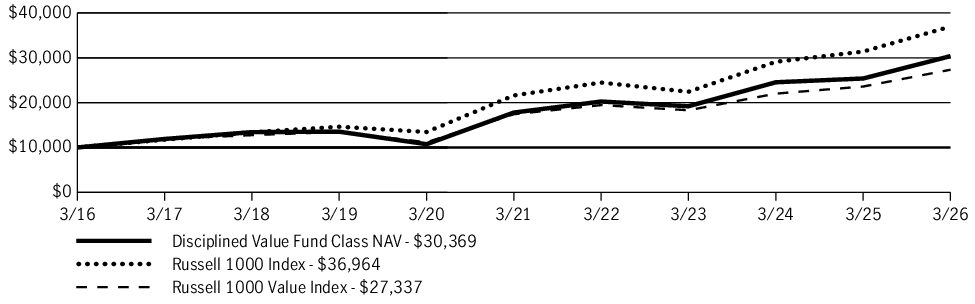
| AVERAGE ANNUAL TOTAL RETURN | 1 Year | 5 Years | 10 Years |
| Disciplined Value Fund (Class NAV/JDVNX) | 19.65% | 11.29% | 11.75% |
| Russell 1000 Index | 17.74% | 11.34% | 13.97% |
| Russell 1000 Value Index | 15.87% | 9.43% | 10.58% |
Fund Statistics
| Fund net assets | $16,992,910,855 |
| Total number of portfolio holdings | 81 |
| Total advisory fees paid (net) | $99,503,860 |
| Portfolio turnover rate | 42% |
Graphical Representation of Holdings
The tables below show the investment makeup of the fund, representing a percentage of the total net assets of the fund.
Top Ten Holdings
| JPMorgan Chase & Co. | 4.1% |
| Amazon.com, Inc. | 2.7% |
| Philip Morris International, Inc. | 2.3% |
| Kinross Gold Corp. | 2.2% |
| Marathon Petroleum Corp. | 2.1% |
| U.S. Foods Holding Corp. | 2.0% |
| Micron Technology, Inc. | 2.0% |
| Applied Materials, Inc. | 2.0% |
| CRH PLC | 2.0% |
| Cencora, Inc. | 1.9% |
Sector Composition
| Financials | 20.6% |
| Industrials | 16.2% |
| Information technology | 12.7% |
| Health care | 10.3% |
| Energy | 8.0% |
| Materials | 7.9% |
| Consumer staples | 7.1% |
| Utilities | 5.4% |
| Consumer discretionary | 4.9% |
| Communication services | 3.7% |
| Short-term investments and other | 3.2% |
Holdings may not have been held by the fund for the entire period and are subject to change without notice. Portfolio composition is subject to review in accordance with the fund’s investment strategy and may vary in the future. Current and future portfolio holdings are subject to risk and may change at any time.
Top Ten Holdings
| JPMorgan Chase & Co. | 4.1% |
| Amazon.com, Inc. | 2.7% |
| Philip Morris International, Inc. | 2.3% |
| Kinross Gold Corp. | 2.2% |
| Marathon Petroleum Corp. | 2.1% |
| U.S. Foods Holding Corp. | 2.0% |
| Micron Technology, Inc. | 2.0% |
| Applied Materials, Inc. | 2.0% |
| CRH PLC | 2.0% |
| Cencora, Inc. | 1.9% |
What were the fund costs during the last year ?
(Based on a hypothetical $10,000 investment)
| Fund (Class) | Costs of a $10,000 investment | Costs paid as a percentage of a $10,000 investment |
| Disciplined Value Fund (Class I/JVLIX) |
$77 | 0.70% |
Management’s Discussion of Fund Performance
SUMMARY OF RESULTS
Disciplined Value Fund (Class I/JVLIX) returned 19.51% for the year ended March 31, 2026. Despite a sell-off in March 2026 caused by the start of the war in Iran, U.S. equities registered strong returns in the annual period. The combination of steady economic growth, robust corporate earnings, and accommodative U.S. Federal Reserve policy all helped support investors’ appetite for risk. Value stocks, while outperforming in the first quarter of 2026, lagged the broader market over the full 12 months.
TOP PERFORMANCE CONTRIBUTORS
Information technology | The semiconductor stocks Micron Technology, Inc. and Applied Materials, Inc., which benefited from expectations for rising demand fueled by the artificial intelligence (AI) infrastructure buildout, were the leading contributors to absolute returns in the sector. Flex, Ltd. and Oracle Corp. also produced strong gains.
Industrials | Positions in aerospace/defense stocks were key contributors, led by L3Harris Technologies, Inc. The trucking companies C.H. Robinson Worldwide, Inc. and Old Dominion Freight Line, Inc. also performed well, as did FedEx Corp.
Other areas of strength | Holdings in materials, energy, and financials made meaningful contributions, as well. Kinross Gold Corp., Marathon Petroleum Corp., and JPMorgan Chase & Co. were the leading contributors in the three sectors, respectively.
TOP PERFORMANCE DETRACTORS
Health care | UnitedHealth Group, Inc., which was hurt by questions about its billing practices, a management change, and weaker profit margins, accounted for the majority of the shortfall.
Consumer discretionary | This was the only other sector in which the fund’s holdings posted a negative absolute return. Amazon.com, Inc., and lululemon athletica, Inc., both of which were added during the course of the period, were the primary detractors.
The views expressed in this report are those of the portfolio management team and are subject to change. They are not meant as investment advice.
Fund Performance
The following graph compares the initial and subsequent account values at the end of each of the most recently completed 10 fiscal years of the fund (or for the life of the fund, if shorter). It assumes a $250,000 initial investment in the fund and in an appropriate, broad-based securities market index for the same period.
GROWTH OF $250,000
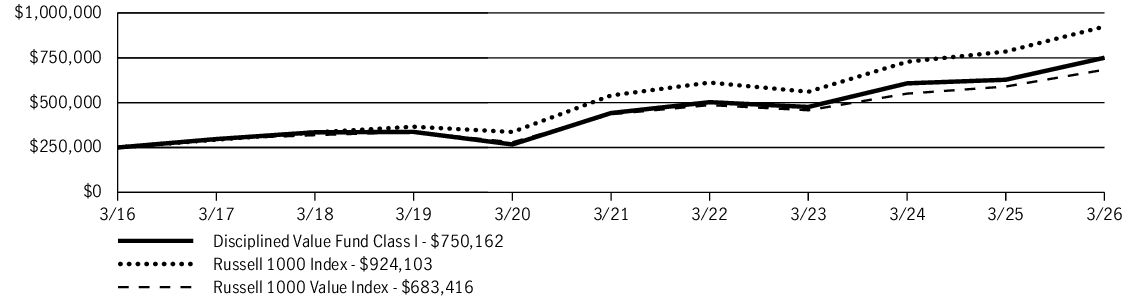
| AVERAGE ANNUAL TOTAL RETURN | 1 Year | 5 Years | 10 Years |
| Disciplined Value Fund (Class I/JVLIX) | 19.51% | 11.16% | 11.61% |
| Russell 1000 Index | 17.74% | 11.34% | 13.97% |
| Russell 1000 Value Index | 15.87% | 9.43% | 10.58% |
Fund Statistics
| Fund net assets | $16,992,910,855 |
| Total number of portfolio holdings | 81 |
| Total advisory fees paid (net) | $99,503,860 |
| Portfolio turnover rate | 42% |
Graphical Representation of Holdings
The tables below show the investment makeup of the fund, representing a percentage of the total net assets of the fund.
Top Ten Holdings
| JPMorgan Chase & Co. | 4.1% |
| Amazon.com, Inc. | 2.7% |
| Philip Morris International, Inc. | 2.3% |
| Kinross Gold Corp. | 2.2% |
| Marathon Petroleum Corp. | 2.1% |
| U.S. Foods Holding Corp. | 2.0% |
| Micron Technology, Inc. | 2.0% |
| Applied Materials, Inc. | 2.0% |
| CRH PLC | 2.0% |
| Cencora, Inc. | 1.9% |
Sector Composition
| Financials | 20.6% |
| Industrials | 16.2% |
| Information technology | 12.7% |
| Health care | 10.3% |
| Energy | 8.0% |
| Materials | 7.9% |
| Consumer staples | 7.1% |
| Utilities | 5.4% |
| Consumer discretionary | 4.9% |
| Communication services | 3.7% |
| Short-term investments and other | 3.2% |
Holdings may not have been held by the fund for the entire period and are subject to change without notice. Portfolio composition is subject to review in accordance with the fund’s investment strategy and may vary in the future. Current and future portfolio holdings are subject to risk and may change at any time.
Top Ten Holdings
| JPMorgan Chase & Co. | 4.1% |
| Amazon.com, Inc. | 2.7% |
| Philip Morris International, Inc. | 2.3% |
| Kinross Gold Corp. | 2.2% |
| Marathon Petroleum Corp. | 2.1% |
| U.S. Foods Holding Corp. | 2.0% |
| Micron Technology, Inc. | 2.0% |
| Applied Materials, Inc. | 2.0% |
| CRH PLC | 2.0% |
| Cencora, Inc. | 1.9% |
What were the fund costs during the last year ?
(Based on a hypothetical $10,000 investment)
| Fund (Class) | Costs of a $10,000 investment | Costs paid as a percentage of a $10,000 investment |
| Disciplined Value Fund (Class C/JVLCX) |
$186 | 1.70% |
Management’s Discussion of Fund Performance
SUMMARY OF RESULTS
Disciplined Value Fund (Class C/JVLCX) returned 18.32% (excluding sales charges) for the year ended March 31, 2026. Despite a sell-off in March 2026 caused by the start of the war in Iran, U.S. equities registered strong returns in the annual period. The combination of steady economic growth, robust corporate earnings, and accommodative U.S. Federal Reserve policy all helped support investors’ appetite for risk. Value stocks, while outperforming in the first quarter of 2026, lagged the broader market over the full 12 months.
TOP PERFORMANCE CONTRIBUTORS
Information technology | The semiconductor stocks Micron Technology, Inc. and Applied Materials, Inc., which benefited from expectations for rising demand fueled by the artificial intelligence (AI) infrastructure buildout, were the leading contributors to absolute returns in the sector. Flex, Ltd. and Oracle Corp. also produced strong gains.
Industrials | Positions in aerospace/defense stocks were key contributors, led by L3Harris Technologies, Inc. The trucking companies C.H. Robinson Worldwide, Inc. and Old Dominion Freight Line, Inc. also performed well, as did FedEx Corp.
Other areas of strength | Holdings in materials, energy, and financials made meaningful contributions, as well. Kinross Gold Corp., Marathon Petroleum Corp., and JPMorgan Chase & Co. were the leading contributors in the three sectors, respectively.
TOP PERFORMANCE DETRACTORS
Health care | UnitedHealth Group, Inc., which was hurt by questions about its billing practices, a management change, and weaker profit margins, accounted for the majority of the shortfall.
Consumer discretionary | This was the only other sector in which the fund’s holdings posted a negative absolute return. Amazon.com, Inc., and lululemon athletica, Inc., both of which were added during the course of the period, were the primary detractors.
The views expressed in this report are those of the portfolio management team and are subject to change. They are not meant as investment advice.
Fund Performance
The following graph compares the initial and subsequent account values at the end of each of the most recently completed 10 fiscal years of the fund (or for the life of the fund, if shorter). It assumes a $10,000 initial investment in the fund and in an appropriate, broad-based securities market index for the same period.
GROWTH OF $10,000
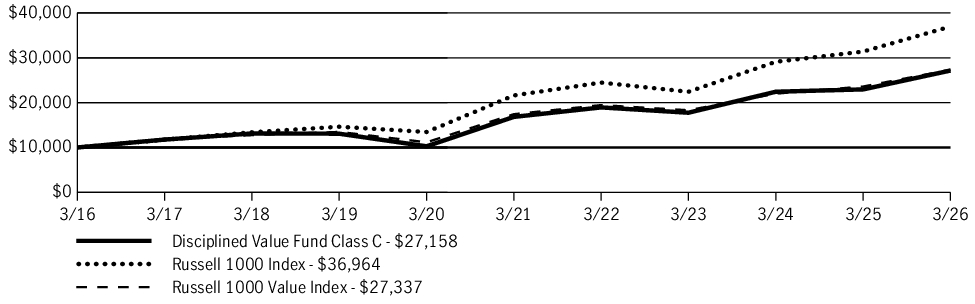
| AVERAGE ANNUAL TOTAL RETURN | 1 Year | 5 Years | 10 Years |
| Disciplined Value Fund (Class C/JVLCX) | 17.32% | 10.05% | 10.51% |
| Disciplined Value Fund (Class C/JVLCX)—excluding sales charge | 18.32% | 10.05% | 10.51% |
| Russell 1000 Index | 17.74% | 11.34% | 13.97% |
| Russell 1000 Value Index | 15.87% | 9.43% | 10.58% |
Fund Statistics
| Fund net assets | $16,992,910,855 |
| Total number of portfolio holdings | 81 |
| Total advisory fees paid (net) | $99,503,860 |
| Portfolio turnover rate | 42% |
Graphical Representation of Holdings
The tables below show the investment makeup of the fund, representing a percentage of the total net assets of the fund.
Top Ten Holdings
| JPMorgan Chase & Co. | 4.1% |
| Amazon.com, Inc. | 2.7% |
| Philip Morris International, Inc. | 2.3% |
| Kinross Gold Corp. | 2.2% |
| Marathon Petroleum Corp. | 2.1% |
| U.S. Foods Holding Corp. | 2.0% |
| Micron Technology, Inc. | 2.0% |
| Applied Materials, Inc. | 2.0% |
| CRH PLC | 2.0% |
| Cencora, Inc. | 1.9% |
Sector Composition
| Financials | 20.6% |
| Industrials | 16.2% |
| Information technology | 12.7% |
| Health care | 10.3% |
| Energy | 8.0% |
| Materials | 7.9% |
| Consumer staples | 7.1% |
| Utilities | 5.4% |
| Consumer discretionary | 4.9% |
| Communication services | 3.7% |
| Short-term investments and other | 3.2% |
Holdings may not have been held by the fund for the entire period and are subject to change without notice. Portfolio composition is subject to review in accordance with the fund’s investment strategy and may vary in the future. Current and future portfolio holdings are subject to risk and may change at any time.
Top Ten Holdings
| JPMorgan Chase & Co. | 4.1% |
| Amazon.com, Inc. | 2.7% |
| Philip Morris International, Inc. | 2.3% |
| Kinross Gold Corp. | 2.2% |
| Marathon Petroleum Corp. | 2.1% |
| U.S. Foods Holding Corp. | 2.0% |
| Micron Technology, Inc. | 2.0% |
| Applied Materials, Inc. | 2.0% |
| CRH PLC | 2.0% |
| Cencora, Inc. | 1.9% |
What were the fund costs during the last year ?
(Based on a hypothetical $10,000 investment)
| Fund (Class) | Costs of a $10,000 investment | Costs paid as a percentage of a $10,000 investment |
| Disciplined Value Fund (Class A/JVLAX) |
$104 | 0.95% |
Management’s Discussion of Fund Performance
SUMMARY OF RESULTS
Disciplined Value Fund (Class A/JVLAX) returned 19.22% (excluding sales charges) for the year ended March 31, 2026. Despite a sell-off in March 2026 caused by the start of the war in Iran, U.S. equities registered strong returns in the annual period. The combination of steady economic growth, robust corporate earnings, and accommodative U.S. Federal Reserve policy all helped support investors’ appetite for risk. Value stocks, while outperforming in the first quarter of 2026, lagged the broader market over the full 12 months.
TOP PERFORMANCE CONTRIBUTORS
Information technology | The semiconductor stocks Micron Technology, Inc. and Applied Materials, Inc., which benefited from expectations for rising demand fueled by the artificial intelligence (AI) infrastructure buildout, were the leading contributors to absolute returns in the sector. Flex, Ltd. and Oracle Corp. also produced strong gains.
Industrials | Positions in aerospace/defense stocks were key contributors, led by L3Harris Technologies, Inc. The trucking companies C.H. Robinson Worldwide, Inc. and Old Dominion Freight Line, Inc. also performed well, as did FedEx Corp.
Other areas of strength | Holdings in materials, energy, and financials made meaningful contributions, as well. Kinross Gold Corp., Marathon Petroleum Corp., and JPMorgan Chase & Co. were the leading contributors in the three sectors, respectively.
TOP PERFORMANCE DETRACTORS
Health care | UnitedHealth Group, Inc., which was hurt by questions about its billing practices, a management change, and weaker profit margins, accounted for the majority of the shortfall.
Consumer discretionary | This was the only other sector in which the fund’s holdings posted a negative absolute return. Amazon.com, Inc., and lululemon athletica, Inc., both of which were added during the course of the period, were the primary detractors.
The views expressed in this report are those of the portfolio management team and are subject to change. They are not meant as investment advice.
Fund Performance
The following graph compares the initial and subsequent account values at the end of each of the most recently completed 10 fiscal years of the fund (or for the life of the fund, if shorter). It assumes a $10,000 initial investment in the fund and in an appropriate, broad-based securities market index for the same period.
GROWTH OF $10,000
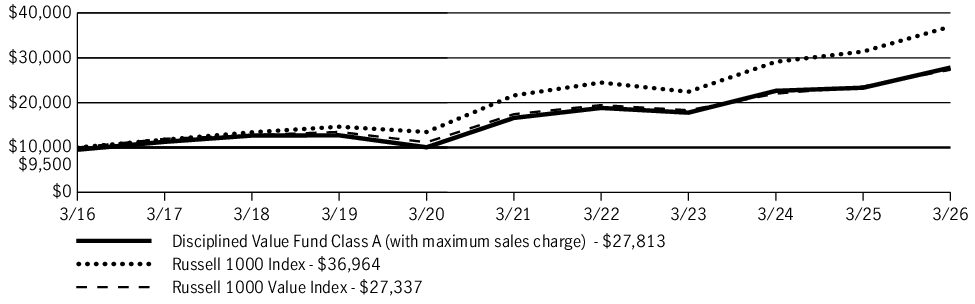
| AVERAGE ANNUAL TOTAL RETURN | 1 Year | 5 Years | 10 Years |
| Disciplined Value Fund (Class A/JVLAX) | 13.24% | 9.75% | 10.77% |
| Disciplined Value Fund (Class A/JVLAX)—excluding sales charge | 19.22% | 10.89% | 11.34% |
| Russell 1000 Index | 17.74% | 11.34% | 13.97% |
| Russell 1000 Value Index | 15.87% | 9.43% | 10.58% |
Fund Statistics
| Fund net assets | $16,992,910,855 |
| Total number of portfolio holdings | 81 |
| Total advisory fees paid (net) | $99,503,860 |
| Portfolio turnover rate | 42% |
Graphical Representation of Holdings
The tables below show the investment makeup of the fund, representing a percentage of the total net assets of the fund.
Top Ten Holdings
| JPMorgan Chase & Co. | 4.1% |
| Amazon.com, Inc. | 2.7% |
| Philip Morris International, Inc. | 2.3% |
| Kinross Gold Corp. | 2.2% |
| Marathon Petroleum Corp. | 2.1% |
| U.S. Foods Holding Corp. | 2.0% |
| Micron Technology, Inc. | 2.0% |
| Applied Materials, Inc. | 2.0% |
| CRH PLC | 2.0% |
| Cencora, Inc. | 1.9% |
Sector Composition
| Financials | 20.6% |
| Industrials | 16.2% |
| Information technology | 12.7% |
| Health care | 10.3% |
| Energy | 8.0% |
| Materials | 7.9% |
| Consumer staples | 7.1% |
| Utilities | 5.4% |
| Consumer discretionary | 4.9% |
| Communication services | 3.7% |
| Short-term investments and other | 3.2% |
Holdings may not have been held by the fund for the entire period and are subject to change without notice. Portfolio composition is subject to review in accordance with the fund’s investment strategy and may vary in the future. Current and future portfolio holdings are subject to risk and may change at any time.
Top Ten Holdings
| JPMorgan Chase & Co. | 4.1% |
| Amazon.com, Inc. | 2.7% |
| Philip Morris International, Inc. | 2.3% |
| Kinross Gold Corp. | 2.2% |
| Marathon Petroleum Corp. | 2.1% |
| U.S. Foods Holding Corp. | 2.0% |
| Micron Technology, Inc. | 2.0% |
| Applied Materials, Inc. | 2.0% |
| CRH PLC | 2.0% |
| Cencora, Inc. | 1.9% |
What were the fund costs during the last year ?
(Based on a hypothetical $10,000 investment)
| Fund (Class) | Costs of a $10,000 investment | Costs paid as a percentage of a $10,000 investment |
| Disciplined Value Mid Cap Fund (Class A/JVMAX) |
$118 | 1.10% |
Management’s Discussion of Fund Performance
SUMMARY OF RESULTS
Disciplined Value Mid Cap Fund (Class A/JVMAX) returned 14.19% (excluding sales charges) for the year ended March 31, 2026. Despite a sell-off in March 2026 caused by the start of the war in Iran, U.S. equities registered strong returns in the annual period. The combination of steady economic growth, robust corporate earnings, and accommodative U.S. Federal Reserve policy all helped support investors’ appetite for risk. Mid-cap stocks performed well in this environment, and mid-cap value stocks outpaced the broader asset class.
TOP PERFORMANCE CONTRIBUTORS
Industrials | The engine parts producer Howmet Aerospace, Inc. and the defense firm L3Harris Technologies, Inc. were the most notable individual contributors, followed by Generac Holdings, Inc.
Information technology | The electronic design and test solutions provider Keysight Technologies, Inc., which was seen as a beneficiary of the artificial intelligence infrastructure buildout, was the top contributor. Seagate Technology Holdings PLC, Jabil, Inc., and Flex, Ltd. also delivered robust performance.
Other areas of strength | Holdings in energy, financials, and materials also made meaningful contributions to absolute performance. TechnipFMC PLC, Evercore, Inc., and CF Industries Holdings, Inc. were the leading contributors in the three sectors, respectively.
TOP PERFORMANCE DETRACTORS
Certain individual stocks | A few specific positions detracted from results. Check Point Software Technologies, Ltd.—which experienced weaker-than-expected growth—hurt performance, as did the beverage company Primo Brands Corp. and the IT services provider CDW Corp.
The views expressed in this report are those of the portfolio management team and are subject to change. They are not meant as investment advice.
Fund Performance
The following graph compares the initial and subsequent account values at the end of each of the most recently completed 10 fiscal years of the fund (or for the life of the fund, if shorter). It assumes a $10,000 initial investment in the fund and in an appropriate, broad-based securities market index for the same period.
GROWTH OF $10,000
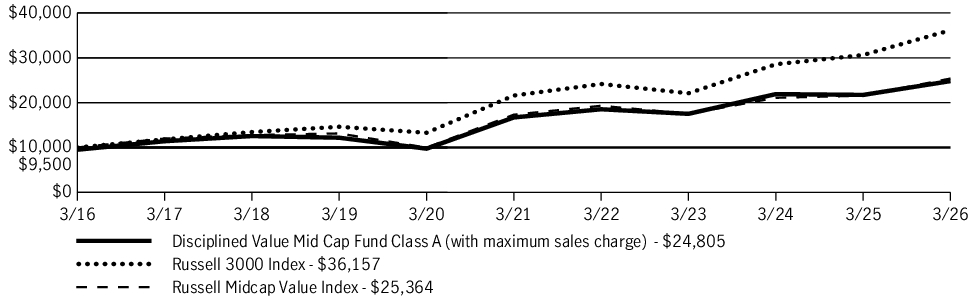
| AVERAGE ANNUAL TOTAL RETURN | 1 Year | 5 Years | 10 Years |
| Disciplined Value Mid Cap Fund (Class A/JVMAX) | 8.50% | 7.13% | 9.51% |
| Disciplined Value Mid Cap Fund (Class A/JVMAX)—excluding sales charge | 14.19% | 8.23% | 10.07% |
| Russell 3000 Index | 18.09% | 10.87% | 13.72% |
| Russell Midcap Value Index | 17.62% | 7.94% | 9.75% |
Fund Statistics
| Fund net assets | $21,871,908,635 |
| Total number of portfolio holdings | 139 |
| Total advisory fees paid (net) | $161,631,654 |
| Portfolio turnover rate | 48% |
Graphical Representation of Holdings
The tables below show the investment makeup of the fund, representing a percentage of the total net assets of the fund.
Top Ten Holdings
| TechnipFMC PLC | 1.8% |
| U.S. Foods Holding Corp. | 1.7% |
| Ameriprise Financial, Inc. | 1.6% |
| LPL Financial Holdings, Inc. | 1.6% |
| AutoZone, Inc. | 1.5% |
| Cencora, Inc. | 1.4% |
| Simon Property Group, Inc. | 1.4% |
| Marathon Petroleum Corp. | 1.3% |
| Keysight Technologies, Inc. | 1.2% |
| Old Dominion Freight Line, Inc. | 1.2% |
Sector Composition
| Industrials | 18.1% |
| Consumer discretionary | 15.2% |
| Financials | 15.1% |
| Information technology | 9.9% |
| Health care | 9.8% |
| Energy | 8.3% |
| Real estate | 6.1% |
| Materials | 5.2% |
| Consumer staples | 5.2% |
| Utilities | 4.7% |
| Short-term investments and other | 2.4% |
Holdings may not have been held by the fund for the entire period and are subject to change without notice. Portfolio composition is subject to review in accordance with the fund’s investment strategy and may vary in the future. Current and future portfolio holdings are subject to risk and may change at any time.
Top Ten Holdings
| TechnipFMC PLC | 1.8% |
| U.S. Foods Holding Corp. | 1.7% |
| Ameriprise Financial, Inc. | 1.6% |
| LPL Financial Holdings, Inc. | 1.6% |
| AutoZone, Inc. | 1.5% |
| Cencora, Inc. | 1.4% |
| Simon Property Group, Inc. | 1.4% |
| Marathon Petroleum Corp. | 1.3% |
| Keysight Technologies, Inc. | 1.2% |
| Old Dominion Freight Line, Inc. | 1.2% |
What were the fund costs during the last year ?
(Based on a hypothetical $10,000 investment)
| Fund (Class) | Costs of a $10,000 investment | Costs paid as a percentage of a $10,000 investment |
| Disciplined Value Mid Cap Fund (Class C/JVMCX) |
$197 | 1.85% |
Management’s Discussion of Fund Performance
SUMMARY OF RESULTS
Disciplined Value Mid Cap Fund (Class C/JVMCX) returned 13.32% (excluding sales charges) for the year ended March 31, 2026. Despite a sell-off in March 2026 caused by the start of the war in Iran, U.S. equities registered strong returns in the annual period. The combination of steady economic growth, robust corporate earnings, and accommodative U.S. Federal Reserve policy all helped support investors’ appetite for risk. Mid-cap stocks performed well in this environment, and mid-cap value stocks outpaced the broader asset class.
TOP PERFORMANCE CONTRIBUTORS
Industrials | The engine parts producer Howmet Aerospace, Inc. and the defense firm L3Harris Technologies, Inc. were the most notable individual contributors, followed by Generac Holdings, Inc.
Information technology | The electronic design and test solutions provider Keysight Technologies, Inc., which was seen as a beneficiary of the artificial intelligence infrastructure buildout, was the top contributor. Seagate Technology Holdings PLC, Jabil, Inc., and Flex, Ltd. also delivered robust performance.
Other areas of strength | Holdings in energy, financials, and materials also made meaningful contributions to absolute performance. TechnipFMC PLC, Evercore, Inc., and CF Industries Holdings, Inc. were the leading contributors in the three sectors, respectively.
TOP PERFORMANCE DETRACTORS
Certain individual stocks | A few specific positions detracted from results. Check Point Software Technologies, Ltd.—which experienced weaker-than-expected growth—hurt performance, as did the beverage company Primo Brands Corp. and the IT services provider CDW Corp.
The views expressed in this report are those of the portfolio management team and are subject to change. They are not meant as investment advice.
Fund Performance
The following graph compares the initial and subsequent account values at the end of each of the most recently completed 10 fiscal years of the fund (or for the life of the fund, if shorter). It assumes a $10,000 initial investment in the fund and in an appropriate, broad-based securities market index for the same period.
GROWTH OF $10,000
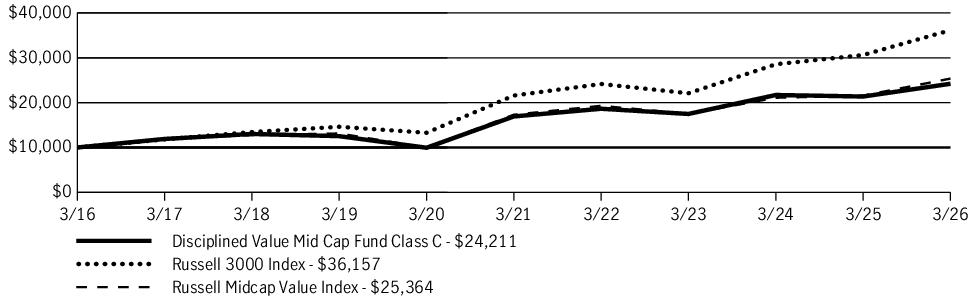
| AVERAGE ANNUAL TOTAL RETURN | 1 Year | 5 Years | 10 Years |
| Disciplined Value Mid Cap Fund (Class C/JVMCX) | 12.32% | 7.42% | 9.25% |
| Disciplined Value Mid Cap Fund (Class C/JVMCX)—excluding sales charge | 13.32% | 7.42% | 9.25% |
| Russell 3000 Index | 18.09% | 10.87% | 13.72% |
| Russell Midcap Value Index | 17.62% | 7.94% | 9.75% |
Fund Statistics
| Fund net assets | $21,871,908,635 |
| Total number of portfolio holdings | 139 |
| Total advisory fees paid (net) | $161,631,654 |
| Portfolio turnover rate | 48% |
Graphical Representation of Holdings
The tables below show the investment makeup of the fund, representing a percentage of the total net assets of the fund.
Top Ten Holdings
| TechnipFMC PLC | 1.8% |
| U.S. Foods Holding Corp. | 1.7% |
| Ameriprise Financial, Inc. | 1.6% |
| LPL Financial Holdings, Inc. | 1.6% |
| AutoZone, Inc. | 1.5% |
| Cencora, Inc. | 1.4% |
| Simon Property Group, Inc. | 1.4% |
| Marathon Petroleum Corp. | 1.3% |
| Keysight Technologies, Inc. | 1.2% |
| Old Dominion Freight Line, Inc. | 1.2% |
Sector Composition
| Industrials | 18.1% |
| Consumer discretionary | 15.2% |
| Financials | 15.1% |
| Information technology | 9.9% |
| Health care | 9.8% |
| Energy | 8.3% |
| Real estate | 6.1% |
| Materials | 5.2% |
| Consumer staples | 5.2% |
| Utilities | 4.7% |
| Short-term investments and other | 2.4% |
Holdings may not have been held by the fund for the entire period and are subject to change without notice. Portfolio composition is subject to review in accordance with the fund’s investment strategy and may vary in the future. Current and future portfolio holdings are subject to risk and may change at any time.
Top Ten Holdings
| TechnipFMC PLC | 1.8% |
| U.S. Foods Holding Corp. | 1.7% |
| Ameriprise Financial, Inc. | 1.6% |
| LPL Financial Holdings, Inc. | 1.6% |
| AutoZone, Inc. | 1.5% |
| Cencora, Inc. | 1.4% |
| Simon Property Group, Inc. | 1.4% |
| Marathon Petroleum Corp. | 1.3% |
| Keysight Technologies, Inc. | 1.2% |
| Old Dominion Freight Line, Inc. | 1.2% |
What were the fund costs during the last year ?
(Based on a hypothetical $10,000 investment)
| Fund (Class) | Costs of a $10,000 investment | Costs paid as a percentage of a $10,000 investment |
| Disciplined Value Mid Cap Fund (Class I/JVMIX) |
$91 | 0.85% |
Management’s Discussion of Fund Performance
SUMMARY OF RESULTS
Disciplined Value Mid Cap Fund (Class I/JVMIX) returned 14.48% for the year ended March 31, 2026. Despite a sell-off in March 2026 caused by the start of the war in Iran, U.S. equities registered strong returns in the annual period. The combination of steady economic growth, robust corporate earnings, and accommodative U.S. Federal Reserve policy all helped support investors’ appetite for risk. Mid-cap stocks performed well in this environment, and mid-cap value stocks outpaced the broader asset class.
TOP PERFORMANCE CONTRIBUTORS
Industrials | The engine parts producer Howmet Aerospace, Inc. and the defense firm L3Harris Technologies, Inc. were the most notable individual contributors, followed by Generac Holdings, Inc.
Information technology | The electronic design and test solutions provider Keysight Technologies, Inc., which was seen as a beneficiary of the artificial intelligence infrastructure buildout, was the top contributor. Seagate Technology Holdings PLC, Jabil, Inc., and Flex, Ltd. also delivered robust performance.
Other areas of strength | Holdings in energy, financials, and materials also made meaningful contributions to absolute performance. TechnipFMC PLC, Evercore, Inc., and CF Industries Holdings, Inc. were the leading contributors in the three sectors, respectively.
TOP PERFORMANCE DETRACTORS
Certain individual stocks | A few specific positions detracted from results. Check Point Software Technologies, Ltd.—which experienced weaker-than-expected growth—hurt performance, as did the beverage company Primo Brands Corp. and the IT services provider CDW Corp.
The views expressed in this report are those of the portfolio management team and are subject to change. They are not meant as investment advice.
Fund Performance
The following graph compares the initial and subsequent account values at the end of each of the most recently completed 10 fiscal years of the fund (or for the life of the fund, if shorter). It assumes a $250,000 initial investment in the fund and in an appropriate, broad-based securities market index for the same period.
GROWTH OF $250,000
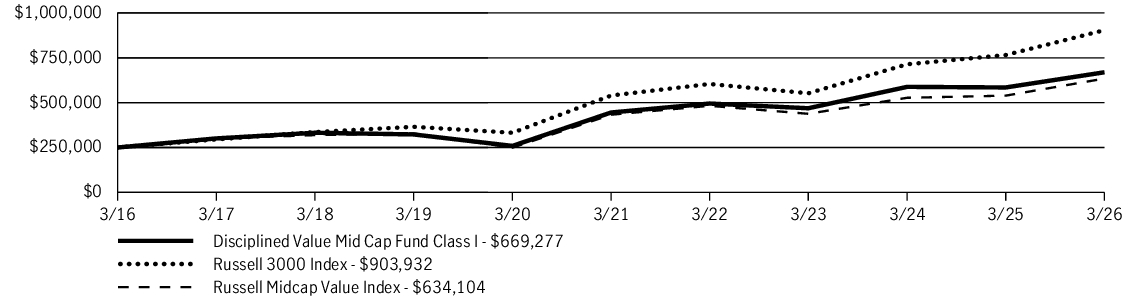
| AVERAGE ANNUAL TOTAL RETURN | 1 Year | 5 Years | 10 Years |
| Disciplined Value Mid Cap Fund (Class I/JVMIX) | 14.48% | 8.51% | 10.35% |
| Russell 3000 Index | 18.09% | 10.87% | 13.72% |
| Russell Midcap Value Index | 17.62% | 7.94% | 9.75% |
Fund Statistics
| Fund net assets | $21,871,908,635 |
| Total number of portfolio holdings | 139 |
| Total advisory fees paid (net) | $161,631,654 |
| Portfolio turnover rate | 48% |
Graphical Representation of Holdings
The tables below show the investment makeup of the fund, representing a percentage of the total net assets of the fund.
Top Ten Holdings
| TechnipFMC PLC | 1.8% |
| U.S. Foods Holding Corp. | 1.7% |
| Ameriprise Financial, Inc. | 1.6% |
| LPL Financial Holdings, Inc. | 1.6% |
| AutoZone, Inc. | 1.5% |
| Cencora, Inc. | 1.4% |
| Simon Property Group, Inc. | 1.4% |
| Marathon Petroleum Corp. | 1.3% |
| Keysight Technologies, Inc. | 1.2% |
| Old Dominion Freight Line, Inc. | 1.2% |
Sector Composition
| Industrials | 18.1% |
| Consumer discretionary | 15.2% |
| Financials | 15.1% |
| Information technology | 9.9% |
| Health care | 9.8% |
| Energy | 8.3% |
| Real estate | 6.1% |
| Materials | 5.2% |
| Consumer staples | 5.2% |
| Utilities | 4.7% |
| Short-term investments and other | 2.4% |
Holdings may not have been held by the fund for the entire period and are subject to change without notice. Portfolio composition is subject to review in accordance with the fund’s investment strategy and may vary in the future. Current and future portfolio holdings are subject to risk and may change at any time.
Top Ten Holdings
| TechnipFMC PLC | 1.8% |
| U.S. Foods Holding Corp. | 1.7% |
| Ameriprise Financial, Inc. | 1.6% |
| LPL Financial Holdings, Inc. | 1.6% |
| AutoZone, Inc. | 1.5% |
| Cencora, Inc. | 1.4% |
| Simon Property Group, Inc. | 1.4% |
| Marathon Petroleum Corp. | 1.3% |
| Keysight Technologies, Inc. | 1.2% |
| Old Dominion Freight Line, Inc. | 1.2% |
What were the fund costs during the last year ?
(Based on a hypothetical $10,000 investment)
| Fund (Class) | Costs of a $10,000 investment | Costs paid as a percentage of a $10,000 investment |
| Disciplined Value Mid Cap Fund (Class R2/JVMSX) |
$133 | 1.24% |
Management’s Discussion of Fund Performance
SUMMARY OF RESULTS
Disciplined Value Mid Cap Fund (Class R2/JVMSX) returned 14.07% for the year ended March 31, 2026. Despite a sell-off in March 2026 caused by the start of the war in Iran, U.S. equities registered strong returns in the annual period. The combination of steady economic growth, robust corporate earnings, and accommodative U.S. Federal Reserve policy all helped support investors’ appetite for risk. Mid-cap stocks performed well in this environment, and mid-cap value stocks outpaced the broader asset class.
TOP PERFORMANCE CONTRIBUTORS
Industrials | The engine parts producer Howmet Aerospace, Inc. and the defense firm L3Harris Technologies, Inc. were the most notable individual contributors, followed by Generac Holdings, Inc.
Information technology | The electronic design and test solutions provider Keysight Technologies, Inc., which was seen as a beneficiary of the artificial intelligence infrastructure buildout, was the top contributor. Seagate Technology Holdings PLC, Jabil, Inc., and Flex, Ltd. also delivered robust performance.
Other areas of strength | Holdings in energy, financials, and materials also made meaningful contributions to absolute performance. TechnipFMC PLC, Evercore, Inc., and CF Industries Holdings, Inc. were the leading contributors in the three sectors, respectively.
TOP PERFORMANCE DETRACTORS
Certain individual stocks | A few specific positions detracted from results. Check Point Software Technologies, Ltd.—which experienced weaker-than-expected growth—hurt performance, as did the beverage company Primo Brands Corp. and the IT services provider CDW Corp.
The views expressed in this report are those of the portfolio management team and are subject to change. They are not meant as investment advice.
Fund Performance
The following graph compares the initial and subsequent account values at the end of each of the most recently completed 10 fiscal years of the fund (or for the life of the fund, if shorter). It assumes a $10,000 initial investment in the fund and in an appropriate, broad-based securities market index for the same period.
GROWTH OF $10,000

| AVERAGE ANNUAL TOTAL RETURN | 1 Year | 5 Years | 10 Years |
| Disciplined Value Mid Cap Fund (Class R2/JVMSX) | 14.07% | 8.09% | 9.92% |
| Russell 3000 Index | 18.09% | 10.87% | 13.72% |
| Russell Midcap Value Index | 17.62% | 7.94% | 9.75% |
Fund Statistics
| Fund net assets | $21,871,908,635 |
| Total number of portfolio holdings | 139 |
| Total advisory fees paid (net) | $161,631,654 |
| Portfolio turnover rate | 48% |
Graphical Representation of Holdings
The tables below show the investment makeup of the fund, representing a percentage of the total net assets of the fund.
Top Ten Holdings
| TechnipFMC PLC | 1.8% |
| U.S. Foods Holding Corp. | 1.7% |
| Ameriprise Financial, Inc. | 1.6% |
| LPL Financial Holdings, Inc. | 1.6% |
| AutoZone, Inc. | 1.5% |
| Cencora, Inc. | 1.4% |
| Simon Property Group, Inc. | 1.4% |
| Marathon Petroleum Corp. | 1.3% |
| Keysight Technologies, Inc. | 1.2% |
| Old Dominion Freight Line, Inc. | 1.2% |
Sector Composition
| Industrials | 18.1% |
| Consumer discretionary | 15.2% |
| Financials | 15.1% |
| Information technology | 9.9% |
| Health care | 9.8% |
| Energy | 8.3% |
| Real estate | 6.1% |
| Materials | 5.2% |
| Consumer staples | 5.2% |
| Utilities | 4.7% |
| Short-term investments and other | 2.4% |
Holdings may not have been held by the fund for the entire period and are subject to change without notice. Portfolio composition is subject to review in accordance with the fund’s investment strategy and may vary in the future. Current and future portfolio holdings are subject to risk and may change at any time.
Top Ten Holdings
| TechnipFMC PLC | 1.8% |
| U.S. Foods Holding Corp. | 1.7% |
| Ameriprise Financial, Inc. | 1.6% |
| LPL Financial Holdings, Inc. | 1.6% |
| AutoZone, Inc. | 1.5% |
| Cencora, Inc. | 1.4% |
| Simon Property Group, Inc. | 1.4% |
| Marathon Petroleum Corp. | 1.3% |
| Keysight Technologies, Inc. | 1.2% |
| Old Dominion Freight Line, Inc. | 1.2% |
What were the fund costs during the last year ?
(Based on a hypothetical $10,000 investment)
| Fund (Class) | Costs of a $10,000 investment | Costs paid as a percentage of a $10,000 investment |
| Disciplined Value Mid Cap Fund (Class R4/JVMTX) |
$106 | 0.99% |
Management’s Discussion of Fund Performance
SUMMARY OF RESULTS
Disciplined Value Mid Cap Fund (Class R4/JVMTX) returned 14.35% for the year ended March 31, 2026. Despite a sell-off in March 2026 caused by the start of the war in Iran, U.S. equities registered strong returns in the annual period. The combination of steady economic growth, robust corporate earnings, and accommodative U.S. Federal Reserve policy all helped support investors’ appetite for risk. Mid-cap stocks performed well in this environment, and mid-cap value stocks outpaced the broader asset class.
TOP PERFORMANCE CONTRIBUTORS
Industrials | The engine parts producer Howmet Aerospace, Inc. and the defense firm L3Harris Technologies, Inc. were the most notable individual contributors, followed by Generac Holdings, Inc.
Information technology | The electronic design and test solutions provider Keysight Technologies, Inc., which was seen as a beneficiary of the artificial intelligence infrastructure buildout, was the top contributor. Seagate Technology Holdings PLC, Jabil, Inc., and Flex, Ltd. also delivered robust performance.
Other areas of strength | Holdings in energy, financials, and materials also made meaningful contributions to absolute performance. TechnipFMC PLC, Evercore, Inc., and CF Industries Holdings, Inc. were the leading contributors in the three sectors, respectively.
TOP PERFORMANCE DETRACTORS
Certain individual stocks | A few specific positions detracted from results. Check Point Software Technologies, Ltd.—which experienced weaker-than-expected growth—hurt performance, as did the beverage company Primo Brands Corp. and the IT services provider CDW Corp.
The views expressed in this report are those of the portfolio management team and are subject to change. They are not meant as investment advice.
Fund Performance
The following graph compares the initial and subsequent account values at the end of each of the most recently completed 10 fiscal years of the fund (or for the life of the fund, if shorter). It assumes a $10,000 initial investment in the fund and in an appropriate, broad-based securities market index for the same period.
GROWTH OF $10,000
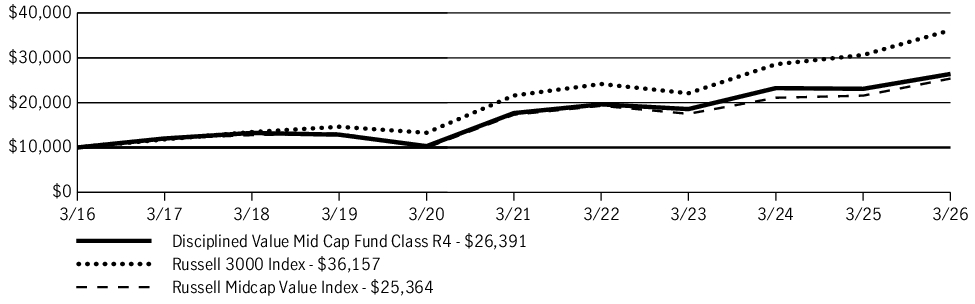
| AVERAGE ANNUAL TOTAL RETURN | 1 Year | 5 Years | 10 Years |
| Disciplined Value Mid Cap Fund (Class R4/JVMTX) | 14.35% | 8.36% | 10.19% |
| Russell 3000 Index | 18.09% | 10.87% | 13.72% |
| Russell Midcap Value Index | 17.62% | 7.94% | 9.75% |
Fund Statistics
| Fund net assets | $21,871,908,635 |
| Total number of portfolio holdings | 139 |
| Total advisory fees paid (net) | $161,631,654 |
| Portfolio turnover rate | 48% |
Graphical Representation of Holdings
The tables below show the investment makeup of the fund, representing a percentage of the total net assets of the fund.
Top Ten Holdings
| TechnipFMC PLC | 1.8% |
| U.S. Foods Holding Corp. | 1.7% |
| Ameriprise Financial, Inc. | 1.6% |
| LPL Financial Holdings, Inc. | 1.6% |
| AutoZone, Inc. | 1.5% |
| Cencora, Inc. | 1.4% |
| Simon Property Group, Inc. | 1.4% |
| Marathon Petroleum Corp. | 1.3% |
| Keysight Technologies, Inc. | 1.2% |
| Old Dominion Freight Line, Inc. | 1.2% |
Sector Composition
| Industrials | 18.1% |
| Consumer discretionary | 15.2% |
| Financials | 15.1% |
| Information technology | 9.9% |
| Health care | 9.8% |
| Energy | 8.3% |
| Real estate | 6.1% |
| Materials | 5.2% |
| Consumer staples | 5.2% |
| Utilities | 4.7% |
| Short-term investments and other | 2.4% |
Holdings may not have been held by the fund for the entire period and are subject to change without notice. Portfolio composition is subject to review in accordance with the fund’s investment strategy and may vary in the future. Current and future portfolio holdings are subject to risk and may change at any time.
Top Ten Holdings
| TechnipFMC PLC | 1.8% |
| U.S. Foods Holding Corp. | 1.7% |
| Ameriprise Financial, Inc. | 1.6% |
| LPL Financial Holdings, Inc. | 1.6% |
| AutoZone, Inc. | 1.5% |
| Cencora, Inc. | 1.4% |
| Simon Property Group, Inc. | 1.4% |
| Marathon Petroleum Corp. | 1.3% |
| Keysight Technologies, Inc. | 1.2% |
| Old Dominion Freight Line, Inc. | 1.2% |
What were the fund costs during the last year ?
(Based on a hypothetical $10,000 investment)
| Fund (Class) | Costs of a $10,000 investment | Costs paid as a percentage of a $10,000 investment |
| Disciplined Value Mid Cap Fund (Class R6/JVMRX) |
$79 | 0.74% |
Management’s Discussion of Fund Performance
SUMMARY OF RESULTS
Disciplined Value Mid Cap Fund (Class R6/JVMRX) returned 14.64% for the year ended March 31, 2026. Despite a sell-off in March 2026 caused by the start of the war in Iran, U.S. equities registered strong returns in the annual period. The combination of steady economic growth, robust corporate earnings, and accommodative U.S. Federal Reserve policy all helped support investors’ appetite for risk. Mid-cap stocks performed well in this environment, and mid-cap value stocks outpaced the broader asset class.
TOP PERFORMANCE CONTRIBUTORS
Industrials | The engine parts producer Howmet Aerospace, Inc. and the defense firm L3Harris Technologies, Inc. were the most notable individual contributors, followed by Generac Holdings, Inc.
Information technology | The electronic design and test solutions provider Keysight Technologies, Inc., which was seen as a beneficiary of the artificial intelligence infrastructure buildout, was the top contributor. Seagate Technology Holdings PLC, Jabil, Inc., and Flex, Ltd. also delivered robust performance.
Other areas of strength | Holdings in energy, financials, and materials also made meaningful contributions to absolute performance. TechnipFMC PLC, Evercore, Inc., and CF Industries Holdings, Inc. were the leading contributors in the three sectors, respectively.
TOP PERFORMANCE DETRACTORS
Certain individual stocks | A few specific positions detracted from results. Check Point Software Technologies, Ltd.—which experienced weaker-than-expected growth—hurt performance, as did the beverage company Primo Brands Corp. and the IT services provider CDW Corp.
The views expressed in this report are those of the portfolio management team and are subject to change. They are not meant as investment advice.
Fund Performance
The following graph compares the initial and subsequent account values at the end of each of the most recently completed 10 fiscal years of the fund (or for the life of the fund, if shorter). It assumes a $1,000,000 initial investment in the fund and in an appropriate, broad-based securities market index for the same period.
GROWTH OF $1,000,000
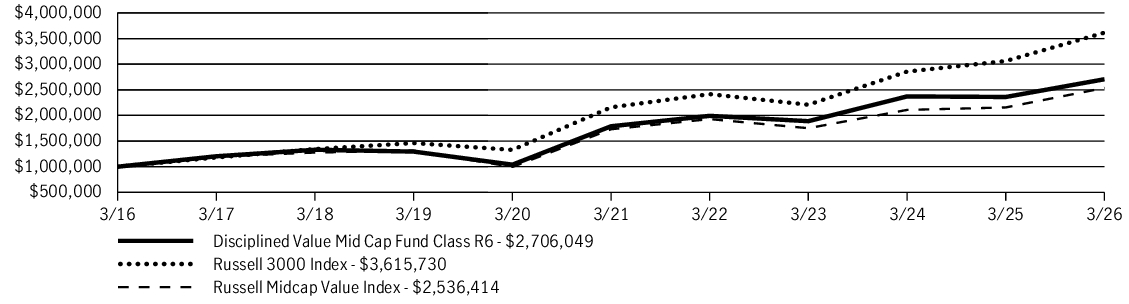
| AVERAGE ANNUAL TOTAL RETURN | 1 Year | 5 Years | 10 Years |
| Disciplined Value Mid Cap Fund (Class R6/JVMRX) | 14.64% | 8.63% | 10.47% |
| Russell 3000 Index | 18.09% | 10.87% | 13.72% |
| Russell Midcap Value Index | 17.62% | 7.94% | 9.75% |
Fund Statistics
| Fund net assets | $21,871,908,635 |
| Total number of portfolio holdings | 139 |
| Total advisory fees paid (net) | $161,631,654 |
| Portfolio turnover rate | 48% |
Graphical Representation of Holdings
The tables below show the investment makeup of the fund, representing a percentage of the total net assets of the fund.
Top Ten Holdings
| TechnipFMC PLC | 1.8% |
| U.S. Foods Holding Corp. | 1.7% |
| Ameriprise Financial, Inc. | 1.6% |
| LPL Financial Holdings, Inc. | 1.6% |
| AutoZone, Inc. | 1.5% |
| Cencora, Inc. | 1.4% |
| Simon Property Group, Inc. | 1.4% |
| Marathon Petroleum Corp. | 1.3% |
| Keysight Technologies, Inc. | 1.2% |
| Old Dominion Freight Line, Inc. | 1.2% |
Sector Composition
| Industrials | 18.1% |
| Consumer discretionary | 15.2% |
| Financials | 15.1% |
| Information technology | 9.9% |
| Health care | 9.8% |
| Energy | 8.3% |
| Real estate | 6.1% |
| Materials | 5.2% |
| Consumer staples | 5.2% |
| Utilities | 4.7% |
| Short-term investments and other | 2.4% |
Holdings may not have been held by the fund for the entire period and are subject to change without notice. Portfolio composition is subject to review in accordance with the fund’s investment strategy and may vary in the future. Current and future portfolio holdings are subject to risk and may change at any time.
Top Ten Holdings
| TechnipFMC PLC | 1.8% |
| U.S. Foods Holding Corp. | 1.7% |
| Ameriprise Financial, Inc. | 1.6% |
| LPL Financial Holdings, Inc. | 1.6% |
| AutoZone, Inc. | 1.5% |
| Cencora, Inc. | 1.4% |
| Simon Property Group, Inc. | 1.4% |
| Marathon Petroleum Corp. | 1.3% |
| Keysight Technologies, Inc. | 1.2% |
| Old Dominion Freight Line, Inc. | 1.2% |
This report describes changes to the fund that occurred during the reporting period.
What were the fund costs during the last year ?
(Based on a hypothetical $10,000 investment)
| Fund (Class) | Costs of a $10,000 investment | Costs paid as a percentage of a $10,000 investment |
| U.S. Growth Fund (Class R6/JSGTX) |
$64 | 0.59% |
Management’s Discussion of Fund Performance
SUMMARY OF RESULTS
U.S. Growth Fund (Class R6/JSGTX) returned 17.80% for the year ended March 31, 2026. Although U.S. equities rose during the 12-month period, they experienced increased volatility driven by shifting macroeconomic and geopolitical forces. The early gains reflected resilient economic growth, solid corporate earnings, moderate inflation, strong performance from large-cap and artificial intelligence–related stocks, and U.S. Federal Reserve interest-rate cuts. Later in the period, though, markets pulled back as interest rates remained higher for longer than previously anticipated, inflation risks resurfaced, and geopolitical conflict raised concern about higher oil prices and reduced economic growth, which led to a broad equity-market sell-off.
TOP PERFORMANCE CONTRIBUTORS
Information technology | The information technology sector, a contributor to the fund’s absolute performance, was led by artificial intelligence-chip developer NVIDIA Corp., semiconductor company Broadcom, Inc. and consumer electronics company Apple, Inc.
Communication services | In the communication services sector, which added to the fund’s absolute return, Alphabet, Inc., parent company of Google, was a standout.
Industrials | Within the industrials sector, the fund’s top contributor on an absolute basis was General Electric Company, a maker of aircraft engines and other components. This stock was sold before period end.
TOP PERFORMANCE DETRACTORS
Health care | In the health care sector, UnitedHealth Group, Inc., a managed-care company, meaningfully detracted in absolute terms. This stock was sold during the period.
Consumer discretionary | The consumer discretionary sector hampered results on an absolute basis, most notably due to the fund’s position in Pool Corp., a distributor of swimming pool supplies and equipment.
Utilities | The utilities sector was a modest detractor from the fund’s absolute performance.
The views expressed in this report are those of the portfolio management team and are subject to change. They are not meant as investment advice.
Fund Performance
The following graph compares the initial and subsequent account values at the end of each of the most recently completed 10 fiscal years of the fund (or for the life of the fund, if shorter). It assumes a $1,000,000 initial investment in the fund and in an appropriate, broad-based securities market index for the same period.
GROWTH OF $1,000,000
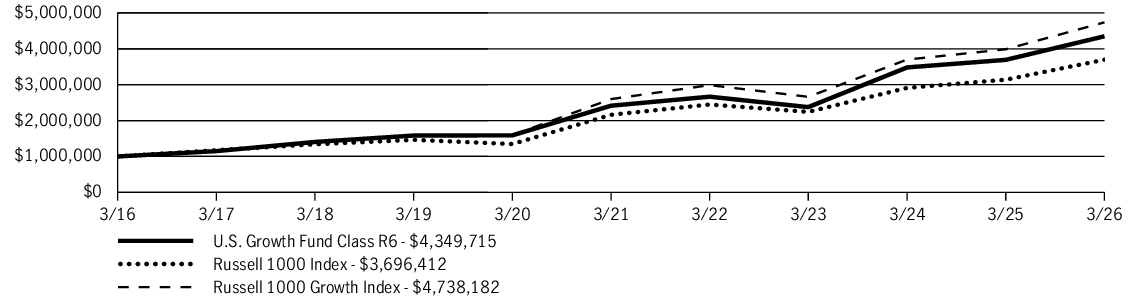
| AVERAGE ANNUAL TOTAL RETURN | 1 Year | 5 Years | 10 Years |
| U.S. Growth Fund (Class R6/JSGTX) | 17.80% | 12.50% | 15.84% |
| Russell 1000 Index | 17.74% | 11.34% | 13.97% |
| Russell 1000 Growth Index | 18.81% | 12.76% | 16.83% |
Fund Statistics
| Fund net assets | $2,860,674,628 |
| Total number of portfolio holdings | 48 |
| Total advisory fees paid (net) | $13,800,937 |
| Portfolio turnover rate | 94% |
Graphical Representation of Holdings
The tables below show the investment makeup of the fund, representing a percentage of the total net assets of the fund.
Top Ten Holdings
| NVIDIA Corp. | 14.0% |
| Apple, Inc. | 9.8% |
| Microsoft Corp. | 9.4% |
| Alphabet, Inc., Class A | 7.0% |
| Broadcom, Inc. | 5.6% |
| Amazon.com, Inc. | 4.8% |
| Eli Lilly & Company | 3.7% |
| Mastercard, Inc., Class A | 3.1% |
| Meta Platforms, Inc., Class A | 2.7% |
| Tesla, Inc. | 2.4% |
Sector Composition
| Information technology | 47.1% |
| Communication services | 13.0% |
| Consumer discretionary | 10.2% |
| Health care | 10.2% |
| Industrials | 5.0% |
| Financials | 4.8% |
| Real estate | 2.4% |
| Energy | 2.0% |
| Consumer staples | 1.8% |
| Utilities | 0.8% |
| Materials | 0.7% |
| Short-term investments and other | 2.0% |
Holdings may not have been held by the fund for the entire period and are subject to change without notice. Portfolio composition is subject to review in accordance with the fund’s investment strategy and may vary in the future. Current and future portfolio holdings are subject to risk and may change at any time.
Top Ten Holdings
| NVIDIA Corp. | 14.0% |
| Apple, Inc. | 9.8% |
| Microsoft Corp. | 9.4% |
| Alphabet, Inc., Class A | 7.0% |
| Broadcom, Inc. | 5.6% |
| Amazon.com, Inc. | 4.8% |
| Eli Lilly & Company | 3.7% |
| Mastercard, Inc., Class A | 3.1% |
| Meta Platforms, Inc., Class A | 2.7% |
| Tesla, Inc. | 2.4% |
Material Fund Changes
On July 9, 2025, the shareholders of John Hancock Funds II Capital Appreciation Fund (the Acquired Fund) voted to approve an Agreement and Plan of Reorganization pursuant to which the Acquired Fund transferred all of its assets to the fund (the Acquiring Fund) in exchange for corresponding shares of the Acquiring Fund. The effective time of the reorganization occurred immediately after the close of regularly scheduled trading on the New York Stock Exchange on July 18, 2025.
This is a summary of certain changes to the fund since 4-1-25 . For more complete information, please refer to the fund’s prospectus. The currently effective prospectus is available at jhinvestments.com/documents or by calling 800-225-5291 .
This is a summary of certain changes to the fund since 4-1-25 . For more complete information, please refer to the fund’s prospectus. The currently effective prospectus is available at jhinvestments.com/documents or by calling 800-225-5291 .
This report describes changes to the fund that occurred during the reporting period.
What were the fund costs during the last year ?
(Based on a hypothetical $10,000 investment)
| Fund (Class) | Costs of a $10,000 investment | Costs paid as a percentage of a $10,000 investment |
| U.S. Growth Fund (Class R4/JHSGX) |
$91 | 0.84% |
Management’s Discussion of Fund Performance
SUMMARY OF RESULTS
U.S. Growth Fund (Class R4/JHSGX) returned 17.52% for the year ended March 31, 2026. Although U.S. equities rose during the 12-month period, they experienced increased volatility driven by shifting macroeconomic and geopolitical forces. The early gains reflected resilient economic growth, solid corporate earnings, moderate inflation, strong performance from large-cap and artificial intelligence–related stocks, and U.S. Federal Reserve interest-rate cuts. Later in the period, though, markets pulled back as interest rates remained higher for longer than previously anticipated, inflation risks resurfaced, and geopolitical conflict raised concern about higher oil prices and reduced economic growth, which led to a broad equity-market sell-off.
TOP PERFORMANCE CONTRIBUTORS
Information technology | The information technology sector, a contributor to the fund’s absolute performance, was led by artificial intelligence-chip developer NVIDIA Corp., semiconductor company Broadcom, Inc. and consumer electronics company Apple, Inc.
Communication services | In the communication services sector, which added to the fund’s absolute return, Alphabet, Inc., parent company of Google, was a standout.
Industrials | Within the industrials sector, the fund’s top contributor on an absolute basis was General Electric Company, a maker of aircraft engines and other components. This stock was sold before period end.
TOP PERFORMANCE DETRACTORS
Health care | In the health care sector, UnitedHealth Group, Inc., a managed-care company, meaningfully detracted in absolute terms. This stock was sold during the period.
Consumer discretionary | The consumer discretionary sector hampered results on an absolute basis, most notably due to the fund’s position in Pool Corp., a distributor of swimming pool supplies and equipment.
Utilities | The utilities sector was a modest detractor from the fund’s absolute performance.
The views expressed in this report are those of the portfolio management team and are subject to change. They are not meant as investment advice.
Fund Performance
The following graph compares the initial and subsequent account values at the end of each of the most recently completed 10 fiscal years of the fund (or for the life of the fund, if shorter). It assumes a $10,000 initial investment in the fund and in an appropriate, broad-based securities market index for the same period.
GROWTH OF $10,000

| AVERAGE ANNUAL TOTAL RETURN | 1 Year | 5 Years | 10 Years |
| U.S. Growth Fund (Class R4/JHSGX) | 17.52% | 12.26% | 15.58% |
| Russell 1000 Index | 17.74% | 11.34% | 13.97% |
| Russell 1000 Growth Index | 18.81% | 12.76% | 16.83% |
Fund Statistics
| Fund net assets | $2,860,674,628 |
| Total number of portfolio holdings | 48 |
| Total advisory fees paid (net) | $13,800,937 |
| Portfolio turnover rate | 94% |
Graphical Representation of Holdings
The tables below show the investment makeup of the fund, representing a percentage of the total net assets of the fund.
Top Ten Holdings
| NVIDIA Corp. | 14.0% |
| Apple, Inc. | 9.8% |
| Microsoft Corp. | 9.4% |
| Alphabet, Inc., Class A | 7.0% |
| Broadcom, Inc. | 5.6% |
| Amazon.com, Inc. | 4.8% |
| Eli Lilly & Company | 3.7% |
| Mastercard, Inc., Class A | 3.1% |
| Meta Platforms, Inc., Class A | 2.7% |
| Tesla, Inc. | 2.4% |
Sector Composition
| Information technology | 47.1% |
| Communication services | 13.0% |
| Consumer discretionary | 10.2% |
| Health care | 10.2% |
| Industrials | 5.0% |
| Financials | 4.8% |
| Real estate | 2.4% |
| Energy | 2.0% |
| Consumer staples | 1.8% |
| Utilities | 0.8% |
| Materials | 0.7% |
| Short-term investments and other | 2.0% |
Holdings may not have been held by the fund for the entire period and are subject to change without notice. Portfolio composition is subject to review in accordance with the fund’s investment strategy and may vary in the future. Current and future portfolio holdings are subject to risk and may change at any time.
Top Ten Holdings
| NVIDIA Corp. | 14.0% |
| Apple, Inc. | 9.8% |
| Microsoft Corp. | 9.4% |
| Alphabet, Inc., Class A | 7.0% |
| Broadcom, Inc. | 5.6% |
| Amazon.com, Inc. | 4.8% |
| Eli Lilly & Company | 3.7% |
| Mastercard, Inc., Class A | 3.1% |
| Meta Platforms, Inc., Class A | 2.7% |
| Tesla, Inc. | 2.4% |
Material Fund Changes
On July 9, 2025, the shareholders of John Hancock Funds II Capital Appreciation Fund (the Acquired Fund) voted to approve an Agreement and Plan of Reorganization pursuant to which the Acquired Fund transferred all of its assets to the fund (the Acquiring Fund) in exchange for corresponding shares of the Acquiring Fund. The effective time of the reorganization occurred immediately after the close of regularly scheduled trading on the New York Stock Exchange on July 18, 2025.
This is a summary of certain changes to the fund since 4-1-25 . For more complete information, please refer to the fund’s prospectus. The currently effective prospectus is available at jhinvestments.com/documents or by calling 800-225-5291 .
This is a summary of certain changes to the fund since 4-1-25 . For more complete information, please refer to the fund’s prospectus. The currently effective prospectus is available at jhinvestments.com/documents or by calling 800-225-5291 .
This report describes changes to the fund that occurred during the reporting period.
What were the fund costs during the last year ?
(Based on a hypothetical $10,000 investment)
| Fund (Class) | Costs of a $10,000 investment | Costs paid as a percentage of a $10,000 investment |
| U.S. Growth Fund (Class R2/JSGRX) |
$116 | 1.07% |
Management’s Discussion of Fund Performance
SUMMARY OF RESULTS
U.S. Growth Fund (Class R2/JSGRX) returned 17.26% for the year ended March 31, 2026. Although U.S. equities rose during the 12-month period, they experienced increased volatility driven by shifting macroeconomic and geopolitical forces. The early gains reflected resilient economic growth, solid corporate earnings, moderate inflation, strong performance from large-cap and artificial intelligence–related stocks, and U.S. Federal Reserve interest-rate cuts. Later in the period, though, markets pulled back as interest rates remained higher for longer than previously anticipated, inflation risks resurfaced, and geopolitical conflict raised concern about higher oil prices and reduced economic growth, which led to a broad equity-market sell-off.
TOP PERFORMANCE CONTRIBUTORS
Information technology | The information technology sector, a contributor to the fund’s absolute performance, was led by artificial intelligence-chip developer NVIDIA Corp., semiconductor company Broadcom, Inc. and consumer electronics company Apple, Inc.
Communication services | In the communication services sector, which added to the fund’s absolute return, Alphabet, Inc., parent company of Google, was a standout.
Industrials | Within the industrials sector, the fund’s top contributor on an absolute basis was General Electric Company, a maker of aircraft engines and other components. This stock was sold before period end.
TOP PERFORMANCE DETRACTORS
Health care | In the health care sector, UnitedHealth Group, Inc., a managed-care company, meaningfully detracted in absolute terms. This stock was sold during the period.
Consumer discretionary | The consumer discretionary sector hampered results on an absolute basis, most notably due to the fund’s position in Pool Corp., a distributor of swimming pool supplies and equipment.
Utilities | The utilities sector was a modest detractor from the fund’s absolute performance.
The views expressed in this report are those of the portfolio management team and are subject to change. They are not meant as investment advice.
Fund Performance
The following graph compares the initial and subsequent account values at the end of each of the most recently completed 10 fiscal years of the fund (or for the life of the fund, if shorter). It assumes a $10,000 initial investment in the fund and in an appropriate, broad-based securities market index for the same period.
GROWTH OF $10,000

| AVERAGE ANNUAL TOTAL RETURN | 1 Year | 5 Years | 10 Years |
| U.S. Growth Fund (Class R2/JSGRX) | 17.26% | 11.94% | 15.27% |
| Russell 1000 Index | 17.74% | 11.34% | 13.97% |
| Russell 1000 Growth Index | 18.81% | 12.76% | 16.83% |
Fund Statistics
| Fund net assets | $2,860,674,628 |
| Total number of portfolio holdings | 48 |
| Total advisory fees paid (net) | $13,800,937 |
| Portfolio turnover rate | 94% |
Graphical Representation of Holdings
The tables below show the investment makeup of the fund, representing a percentage of the total net assets of the fund.
Top Ten Holdings
| NVIDIA Corp. | 14.0% |
| Apple, Inc. | 9.8% |
| Microsoft Corp. | 9.4% |
| Alphabet, Inc., Class A | 7.0% |
| Broadcom, Inc. | 5.6% |
| Amazon.com, Inc. | 4.8% |
| Eli Lilly & Company | 3.7% |
| Mastercard, Inc., Class A | 3.1% |
| Meta Platforms, Inc., Class A | 2.7% |
| Tesla, Inc. | 2.4% |
Sector Composition
| Information technology | 47.1% |
| Communication services | 13.0% |
| Consumer discretionary | 10.2% |
| Health care | 10.2% |
| Industrials | 5.0% |
| Financials | 4.8% |
| Real estate | 2.4% |
| Energy | 2.0% |
| Consumer staples | 1.8% |
| Utilities | 0.8% |
| Materials | 0.7% |
| Short-term investments and other | 2.0% |
Holdings may not have been held by the fund for the entire period and are subject to change without notice. Portfolio composition is subject to review in accordance with the fund’s investment strategy and may vary in the future. Current and future portfolio holdings are subject to risk and may change at any time.
Top Ten Holdings
| NVIDIA Corp. | 14.0% |
| Apple, Inc. | 9.8% |
| Microsoft Corp. | 9.4% |
| Alphabet, Inc., Class A | 7.0% |
| Broadcom, Inc. | 5.6% |
| Amazon.com, Inc. | 4.8% |
| Eli Lilly & Company | 3.7% |
| Mastercard, Inc., Class A | 3.1% |
| Meta Platforms, Inc., Class A | 2.7% |
| Tesla, Inc. | 2.4% |
Material Fund Changes
On July 9, 2025, the shareholders of John Hancock Funds II Capital Appreciation Fund (the Acquired Fund) voted to approve an Agreement and Plan of Reorganization pursuant to which the Acquired Fund transferred all of its assets to the fund (the Acquiring Fund) in exchange for corresponding shares of the Acquiring Fund. The effective time of the reorganization occurred immediately after the close of regularly scheduled trading on the New York Stock Exchange on July 18, 2025.
This is a summary of certain changes to the fund since 4-1-25 . For more complete information, please refer to the fund’s prospectus. The currently effective prospectus is available at jhinvestments.com/documents or by calling 800-225-5291 .
This is a summary of certain changes to the fund since 4-1-25 . For more complete information, please refer to the fund’s prospectus. The currently effective prospectus is available at jhinvestments.com/documents or by calling 800-225-5291 .
This report describes changes to the fund that occurred during the reporting period.
What were the fund costs during the last year ?
(Based on a hypothetical $10,000 investment)
| Fund (Class) | Costs of a $10,000 investment | Costs paid as a percentage of a $10,000 investment |
| U.S. Growth Fund (Class NAV/JSGBX) |
$63 | 0.58% |
Management’s Discussion of Fund Performance
SUMMARY OF RESULTS
U.S. Growth Fund (Class NAV/JSGBX) returned 17.85% for the year ended March 31, 2026. Although U.S. equities rose during the 12-month period, they experienced increased volatility driven by shifting macroeconomic and geopolitical forces. The early gains reflected resilient economic growth, solid corporate earnings, moderate inflation, strong performance from large-cap and artificial intelligence–related stocks, and U.S. Federal Reserve interest-rate cuts. Later in the period, though, markets pulled back as interest rates remained higher for longer than previously anticipated, inflation risks resurfaced, and geopolitical conflict raised concern about higher oil prices and reduced economic growth, which led to a broad equity-market sell-off.
TOP PERFORMANCE CONTRIBUTORS
Information technology | The information technology sector, a contributor to the fund’s absolute performance, was led by artificial intelligence-chip developer NVIDIA Corp., semiconductor company Broadcom, Inc. and consumer electronics company Apple, Inc.
Communication services | In the communication services sector, which added to the fund’s absolute return, Alphabet, Inc., parent company of Google, was a standout.
Industrials | Within the industrials sector, the fund’s top contributor on an absolute basis was General Electric Company, a maker of aircraft engines and other components. This stock was sold before period end.
TOP PERFORMANCE DETRACTORS
Health care | In the health care sector, UnitedHealth Group, Inc., a managed-care company, meaningfully detracted in absolute terms. This stock was sold during the period.
Consumer discretionary | The consumer discretionary sector hampered results on an absolute basis, most notably due to the fund’s position in Pool Corp., a distributor of swimming pool supplies and equipment.
Utilities | The utilities sector was a modest detractor from the fund’s absolute performance.
The views expressed in this report are those of the portfolio management team and are subject to change. They are not meant as investment advice.
Fund Performance
The following graph compares the initial and subsequent account values at the end of each of the most recently completed 10 fiscal years of the fund (or for the life of the fund, if shorter). It assumes a $10,000 initial investment in the fund and in an appropriate, broad-based securities market index for the same period.
GROWTH OF $10,000
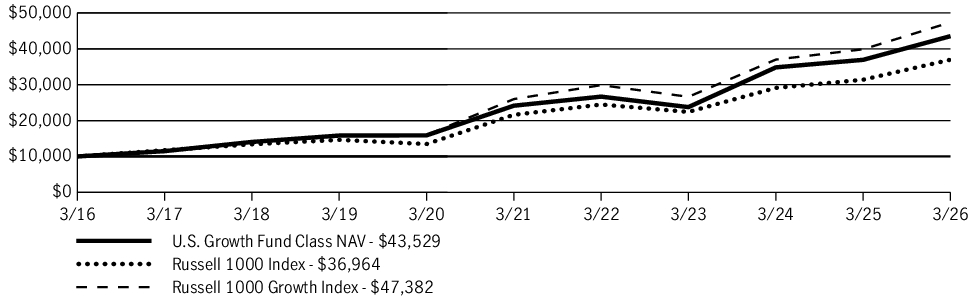
| AVERAGE ANNUAL TOTAL RETURN | 1 Year | 5 Years | 10 Years |
| U.S. Growth Fund (Class NAV/JSGBX) | 17.85% | 12.51% | 15.85% |
| Russell 1000 Index | 17.74% | 11.34% | 13.97% |
| Russell 1000 Growth Index | 18.81% | 12.76% | 16.83% |
Fund Statistics
| Fund net assets | $2,860,674,628 |
| Total number of portfolio holdings | 48 |
| Total advisory fees paid (net) | $13,800,937 |
| Portfolio turnover rate | 94% |
Graphical Representation of Holdings
The tables below show the investment makeup of the fund, representing a percentage of the total net assets of the fund.
Top Ten Holdings
| NVIDIA Corp. | 14.0% |
| Apple, Inc. | 9.8% |
| Microsoft Corp. | 9.4% |
| Alphabet, Inc., Class A | 7.0% |
| Broadcom, Inc. | 5.6% |
| Amazon.com, Inc. | 4.8% |
| Eli Lilly & Company | 3.7% |
| Mastercard, Inc., Class A | 3.1% |
| Meta Platforms, Inc., Class A | 2.7% |
| Tesla, Inc. | 2.4% |
Sector Composition
| Information technology | 47.1% |
| Communication services | 13.0% |
| Consumer discretionary | 10.2% |
| Health care | 10.2% |
| Industrials | 5.0% |
| Financials | 4.8% |
| Real estate | 2.4% |
| Energy | 2.0% |
| Consumer staples | 1.8% |
| Utilities | 0.8% |
| Materials | 0.7% |
| Short-term investments and other | 2.0% |
Holdings may not have been held by the fund for the entire period and are subject to change without notice. Portfolio composition is subject to review in accordance with the fund’s investment strategy and may vary in the future. Current and future portfolio holdings are subject to risk and may change at any time.
Top Ten Holdings
| NVIDIA Corp. | 14.0% |
| Apple, Inc. | 9.8% |
| Microsoft Corp. | 9.4% |
| Alphabet, Inc., Class A | 7.0% |
| Broadcom, Inc. | 5.6% |
| Amazon.com, Inc. | 4.8% |
| Eli Lilly & Company | 3.7% |
| Mastercard, Inc., Class A | 3.1% |
| Meta Platforms, Inc., Class A | 2.7% |
| Tesla, Inc. | 2.4% |
Material Fund Changes
On July 9, 2025, the shareholders of John Hancock Funds II Capital Appreciation Fund (the Acquired Fund) voted to approve an Agreement and Plan of Reorganization pursuant to which the Acquired Fund transferred all of its assets to the fund (the Acquiring Fund) in exchange for corresponding shares of the Acquiring Fund. The effective time of the reorganization occurred immediately after the close of regularly scheduled trading on the New York Stock Exchange on July 18, 2025.
This is a summary of certain changes to the fund since 4-1-25 . For more complete information, please refer to the fund’s prospectus. The currently effective prospectus is available at jhinvestments.com/documents or by calling 800-225-5291 .
This is a summary of certain changes to the fund since 4-1-25 . For more complete information, please refer to the fund’s prospectus. The currently effective prospectus is available at jhinvestments.com/documents or by calling 800-225-5291 .
This report describes changes to the fund that occurred during the reporting period.
What were the fund costs during the last year ?
(Based on a hypothetical $10,000 investment)
| Fund (Class) | Costs of a $10,000 investment | Costs paid as a percentage of a $10,000 investment |
| U.S. Growth Fund (Class I/JSGIX) |
$75 | 0.69% |
Management’s Discussion of Fund Performance
SUMMARY OF RESULTS
U.S. Growth Fund (Class I/JSGIX) returned 17.68% for the year ended March 31, 2026. Although U.S. equities rose during the 12-month period, they experienced increased volatility driven by shifting macroeconomic and geopolitical forces. The early gains reflected resilient economic growth, solid corporate earnings, moderate inflation, strong performance from large-cap and artificial intelligence–related stocks, and U.S. Federal Reserve interest-rate cuts. Later in the period, though, markets pulled back as interest rates remained higher for longer than previously anticipated, inflation risks resurfaced, and geopolitical conflict raised concern about higher oil prices and reduced economic growth, which led to a broad equity-market sell-off.
TOP PERFORMANCE CONTRIBUTORS
Information technology | The information technology sector, a contributor to the fund’s absolute performance, was led by artificial intelligence-chip developer NVIDIA Corp., semiconductor company Broadcom, Inc. and consumer electronics company Apple, Inc.
Communication services | In the communication services sector, which added to the fund’s absolute return, Alphabet, Inc., parent company of Google, was a standout.
Industrials | Within the industrials sector, the fund’s top contributor on an absolute basis was General Electric Company, a maker of aircraft engines and other components. This stock was sold before period end.
TOP PERFORMANCE DETRACTORS
Health care | In the health care sector, UnitedHealth Group, Inc., a managed-care company, meaningfully detracted in absolute terms. This stock was sold during the period.
Consumer discretionary | The consumer discretionary sector hampered results on an absolute basis, most notably due to the fund’s position in Pool Corp., a distributor of swimming pool supplies and equipment.
Utilities | The utilities sector was a modest detractor from the fund’s absolute performance.
The views expressed in this report are those of the portfolio management team and are subject to change. They are not meant as investment advice.
Fund Performance
The following graph compares the initial and subsequent account values at the end of each of the most recently completed 10 fiscal years of the fund (or for the life of the fund, if shorter). It assumes a $250,000 initial investment in the fund and in an appropriate, broad-based securities market index for the same period.
GROWTH OF $250,000
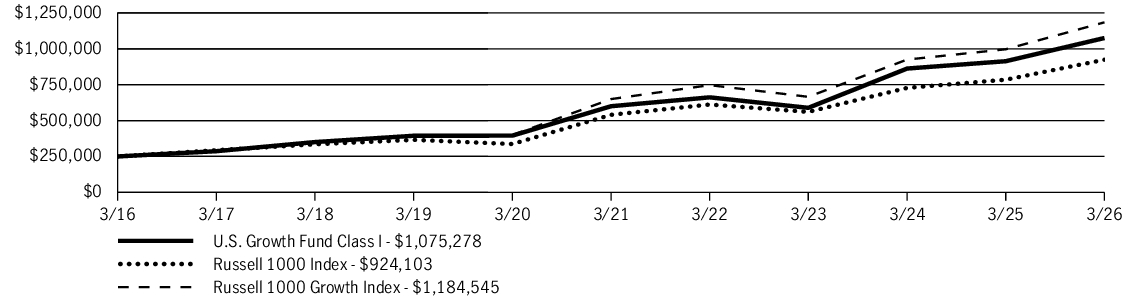
| AVERAGE ANNUAL TOTAL RETURN | 1 Year | 5 Years | 10 Years |
| U.S. Growth Fund (Class I/JSGIX) | 17.68% | 12.38% | 15.71% |
| Russell 1000 Index | 17.74% | 11.34% | 13.97% |
| Russell 1000 Growth Index | 18.81% | 12.76% | 16.83% |
Fund Statistics
| Fund net assets | $2,860,674,628 |
| Total number of portfolio holdings | 48 |
| Total advisory fees paid (net) | $13,800,937 |
| Portfolio turnover rate | 94% |
Graphical Representation of Holdings
The tables below show the investment makeup of the fund, representing a percentage of the total net assets of the fund.
Top Ten Holdings
| NVIDIA Corp. | 14.0% |
| Apple, Inc. | 9.8% |
| Microsoft Corp. | 9.4% |
| Alphabet, Inc., Class A | 7.0% |
| Broadcom, Inc. | 5.6% |
| Amazon.com, Inc. | 4.8% |
| Eli Lilly & Company | 3.7% |
| Mastercard, Inc., Class A | 3.1% |
| Meta Platforms, Inc., Class A | 2.7% |
| Tesla, Inc. | 2.4% |
Sector Composition
| Information technology | 47.1% |
| Communication services | 13.0% |
| Consumer discretionary | 10.2% |
| Health care | 10.2% |
| Industrials | 5.0% |
| Financials | 4.8% |
| Real estate | 2.4% |
| Energy | 2.0% |
| Consumer staples | 1.8% |
| Utilities | 0.8% |
| Materials | 0.7% |
| Short-term investments and other | 2.0% |
Holdings may not have been held by the fund for the entire period and are subject to change without notice. Portfolio composition is subject to review in accordance with the fund’s investment strategy and may vary in the future. Current and future portfolio holdings are subject to risk and may change at any time.
Top Ten Holdings
| NVIDIA Corp. | 14.0% |
| Apple, Inc. | 9.8% |
| Microsoft Corp. | 9.4% |
| Alphabet, Inc., Class A | 7.0% |
| Broadcom, Inc. | 5.6% |
| Amazon.com, Inc. | 4.8% |
| Eli Lilly & Company | 3.7% |
| Mastercard, Inc., Class A | 3.1% |
| Meta Platforms, Inc., Class A | 2.7% |
| Tesla, Inc. | 2.4% |
Material Fund Changes
On July 9, 2025, the shareholders of John Hancock Funds II Capital Appreciation Fund (the Acquired Fund) voted to approve an Agreement and Plan of Reorganization pursuant to which the Acquired Fund transferred all of its assets to the fund (the Acquiring Fund) in exchange for corresponding shares of the Acquiring Fund. The effective time of the reorganization occurred immediately after the close of regularly scheduled trading on the New York Stock Exchange on July 18, 2025.
This is a summary of certain changes to the fund since 4-1-25 . For more complete information, please refer to the fund’s prospectus. The currently effective prospectus is available at jhinvestments.com/documents or by calling 800-225-5291 .
This is a summary of certain changes to the fund since 4-1-25 . For more complete information, please refer to the fund’s prospectus. The currently effective prospectus is available at jhinvestments.com/documents or by calling 800-225-5291 .
This report describes changes to the fund that occurred during the reporting period.
What were the fund costs during the last year ?
(Based on a hypothetical $10,000 investment)
| Fund (Class) | Costs of a $10,000 investment | Costs paid as a percentage of a $10,000 investment |
| U.S. Growth Fund (Class C/JSGCX) |
$183 | 1.69% |
Management’s Discussion of Fund Performance
SUMMARY OF RESULTS
U.S. Growth Fund (Class C/JSGCX) returned 16.50% (excluding sales charges) for the year ended March 31, 2026. Although U.S. equities rose during the 12-month period, they experienced increased volatility driven by shifting macroeconomic and geopolitical forces. The early gains reflected resilient economic growth, solid corporate earnings, moderate inflation, strong performance from large-cap and artificial intelligence–related stocks, and U.S. Federal Reserve interest-rate cuts. Later in the period, though, markets pulled back as interest rates remained higher for longer than previously anticipated, inflation risks resurfaced, and geopolitical conflict raised concern about higher oil prices and reduced economic growth, which led to a broad equity-market sell-off.
TOP PERFORMANCE CONTRIBUTORS
Information technology | The information technology sector, a contributor to the fund’s absolute performance, was led by artificial intelligence-chip developer NVIDIA Corp., semiconductor company Broadcom, Inc. and consumer electronics company Apple, Inc.
Communication services | In the communication services sector, which added to the fund’s absolute return, Alphabet, Inc., parent company of Google, was a standout.
Industrials | Within the industrials sector, the fund’s top contributor on an absolute basis was General Electric Company, a maker of aircraft engines and other components. This stock was sold before period end.
TOP PERFORMANCE DETRACTORS
Health care | In the health care sector, UnitedHealth Group, Inc., a managed-care company, meaningfully detracted in absolute terms. This stock was sold during the period.
Consumer discretionary | The consumer discretionary sector hampered results on an absolute basis, most notably due to the fund’s position in Pool Corp., a distributor of swimming pool supplies and equipment.
Utilities | The utilities sector was a modest detractor from the fund’s absolute performance.
The views expressed in this report are those of the portfolio management team and are subject to change. They are not meant as investment advice.
Fund Performance
The following graph compares the initial and subsequent account values at the end of each of the most recently completed 10 fiscal years of the fund (or for the life of the fund, if shorter). It assumes a $10,000 initial investment in the fund and in an appropriate, broad-based securities market index for the same period.
GROWTH OF $10,000
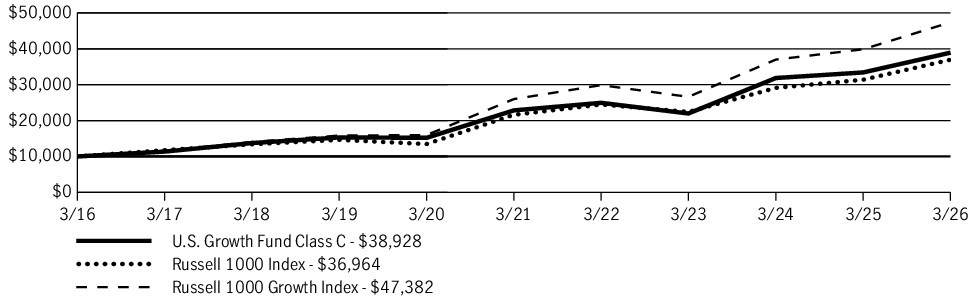
| AVERAGE ANNUAL TOTAL RETURN | 1 Year | 5 Years | 10 Years |
| U.S. Growth Fund (Class C/JSGCX) | 15.50% | 11.26% | 14.56% |
| U.S. Growth Fund (Class C/JSGCX)—excluding sales charge | 16.50% | 11.26% | 14.56% |
| Russell 1000 Index | 17.74% | 11.34% | 13.97% |
| Russell 1000 Growth Index | 18.81% | 12.76% | 16.83% |
Fund Statistics
| Fund net assets | $2,860,674,628 |
| Total number of portfolio holdings | 48 |
| Total advisory fees paid (net) | $13,800,937 |
| Portfolio turnover rate | 94% |
Graphical Representation of Holdings
The tables below show the investment makeup of the fund, representing a percentage of the total net assets of the fund.
Top Ten Holdings
| NVIDIA Corp. | 14.0% |
| Apple, Inc. | 9.8% |
| Microsoft Corp. | 9.4% |
| Alphabet, Inc., Class A | 7.0% |
| Broadcom, Inc. | 5.6% |
| Amazon.com, Inc. | 4.8% |
| Eli Lilly & Company | 3.7% |
| Mastercard, Inc., Class A | 3.1% |
| Meta Platforms, Inc., Class A | 2.7% |
| Tesla, Inc. | 2.4% |
Sector Composition
| Information technology | 47.1% |
| Communication services | 13.0% |
| Consumer discretionary | 10.2% |
| Health care | 10.2% |
| Industrials | 5.0% |
| Financials | 4.8% |
| Real estate | 2.4% |
| Energy | 2.0% |
| Consumer staples | 1.8% |
| Utilities | 0.8% |
| Materials | 0.7% |
| Short-term investments and other | 2.0% |
Holdings may not have been held by the fund for the entire period and are subject to change without notice. Portfolio composition is subject to review in accordance with the fund’s investment strategy and may vary in the future. Current and future portfolio holdings are subject to risk and may change at any time.
Top Ten Holdings
| NVIDIA Corp. | 14.0% |
| Apple, Inc. | 9.8% |
| Microsoft Corp. | 9.4% |
| Alphabet, Inc., Class A | 7.0% |
| Broadcom, Inc. | 5.6% |
| Amazon.com, Inc. | 4.8% |
| Eli Lilly & Company | 3.7% |
| Mastercard, Inc., Class A | 3.1% |
| Meta Platforms, Inc., Class A | 2.7% |
| Tesla, Inc. | 2.4% |
Material Fund Changes
On July 9, 2025, the shareholders of John Hancock Funds II Capital Appreciation Fund (the Acquired Fund) voted to approve an Agreement and Plan of Reorganization pursuant to which the Acquired Fund transferred all of its assets to the fund (the Acquiring Fund) in exchange for corresponding shares of the Acquiring Fund. The effective time of the reorganization occurred immediately after the close of regularly scheduled trading on the New York Stock Exchange on July 18, 2025.
This is a summary of certain changes to the fund since 4-1-25 . For more complete information, please refer to the fund’s prospectus. The currently effective prospectus is available at jhinvestments.com/documents or by calling 800-225-5291 .
This is a summary of certain changes to the fund since 4-1-25 . For more complete information, please refer to the fund’s prospectus. The currently effective prospectus is available at jhinvestments.com/documents or by calling 800-225-5291 .
This report describes changes to the fund that occurred during the reporting period.
What were the fund costs during the last year ?
(Based on a hypothetical $10,000 investment)
| Fund (Class) | Costs of a $10,000 investment | Costs paid as a percentage of a $10,000 investment |
| U.S. Growth Fund (Class A/JSGAX) |
$102 | 0.94% |
Management’s Discussion of Fund Performance
SUMMARY OF RESULTS
U.S. Growth Fund (Class A/JSGAX) returned 17.38% (excluding sales charges) for the year ended March 31, 2026. Although U.S. equities rose during the 12-month period, they experienced increased volatility driven by shifting macroeconomic and geopolitical forces. The early gains reflected resilient economic growth, solid corporate earnings, moderate inflation, strong performance from large-cap and artificial intelligence–related stocks, and U.S. Federal Reserve interest-rate cuts. Later in the period, though, markets pulled back as interest rates remained higher for longer than previously anticipated, inflation risks resurfaced, and geopolitical conflict raised concern about higher oil prices and reduced economic growth, which led to a broad equity-market sell-off.
TOP PERFORMANCE CONTRIBUTORS
Information technology | The information technology sector, a contributor to the fund’s absolute performance, was led by artificial intelligence-chip developer NVIDIA Corp., semiconductor company Broadcom, Inc. and consumer electronics company Apple, Inc.
Communication services | In the communication services sector, which added to the fund’s absolute return, Alphabet, Inc., parent company of Google, was a standout.
Industrials | Within the industrials sector, the fund’s top contributor on an absolute basis was General Electric Company, a maker of aircraft engines and other components. This stock was sold before period end.
TOP PERFORMANCE DETRACTORS
Health care | In the health care sector, UnitedHealth Group, Inc., a managed-care company, meaningfully detracted in absolute terms. This stock was sold during the period.
Consumer discretionary | The consumer discretionary sector hampered results on an absolute basis, most notably due to the fund’s position in Pool Corp., a distributor of swimming pool supplies and equipment.
Utilities | The utilities sector was a modest detractor from the fund’s absolute performance.
The views expressed in this report are those of the portfolio management team and are subject to change. They are not meant as investment advice.
Fund Performance
The following graph compares the initial and subsequent account values at the end of each of the most recently completed 10 fiscal years of the fund (or for the life of the fund, if shorter). It assumes a $10,000 initial investment in the fund and in an appropriate, broad-based securities market index for the same period.
GROWTH OF $10,000
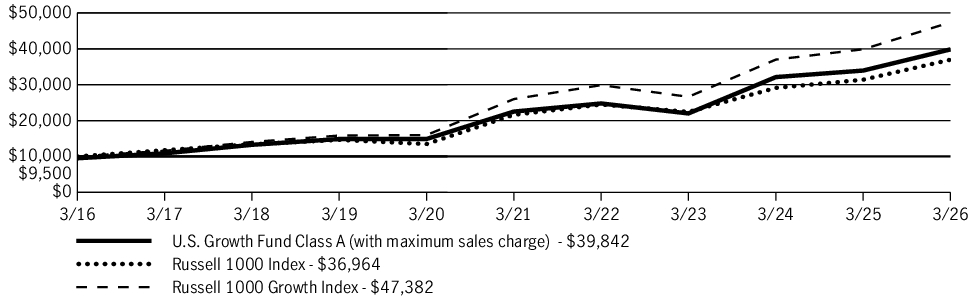
| AVERAGE ANNUAL TOTAL RETURN | 1 Year | 5 Years | 10 Years |
| U.S. Growth Fund (Class A/JSGAX) | 11.51% | 10.96% | 14.82% |
| U.S. Growth Fund (Class A/JSGAX)—excluding sales charge | 17.38% | 12.10% | 15.41% |
| Russell 1000 Index | 17.74% | 11.34% | 13.97% |
| Russell 1000 Growth Index | 18.81% | 12.76% | 16.83% |
Fund Statistics
| Fund net assets | $2,860,674,628 |
| Total number of portfolio holdings | 48 |
| Total advisory fees paid (net) | $13,800,937 |
| Portfolio turnover rate | 94% |
Graphical Representation of Holdings
The tables below show the investment makeup of the fund, representing a percentage of the total net assets of the fund.
Top Ten Holdings
| NVIDIA Corp. | 14.0% |
| Apple, Inc. | 9.8% |
| Microsoft Corp. | 9.4% |
| Alphabet, Inc., Class A | 7.0% |
| Broadcom, Inc. | 5.6% |
| Amazon.com, Inc. | 4.8% |
| Eli Lilly & Company | 3.7% |
| Mastercard, Inc., Class A | 3.1% |
| Meta Platforms, Inc., Class A | 2.7% |
| Tesla, Inc. | 2.4% |
Sector Composition
| Information technology | 47.1% |
| Communication services | 13.0% |
| Consumer discretionary | 10.2% |
| Health care | 10.2% |
| Industrials | 5.0% |
| Financials | 4.8% |
| Real estate | 2.4% |
| Energy | 2.0% |
| Consumer staples | 1.8% |
| Utilities | 0.8% |
| Materials | 0.7% |
| Short-term investments and other | 2.0% |
Holdings may not have been held by the fund for the entire period and are subject to change without notice. Portfolio composition is subject to review in accordance with the fund’s investment strategy and may vary in the future. Current and future portfolio holdings are subject to risk and may change at any time.
Top Ten Holdings
| NVIDIA Corp. | 14.0% |
| Apple, Inc. | 9.8% |
| Microsoft Corp. | 9.4% |
| Alphabet, Inc., Class A | 7.0% |
| Broadcom, Inc. | 5.6% |
| Amazon.com, Inc. | 4.8% |
| Eli Lilly & Company | 3.7% |
| Mastercard, Inc., Class A | 3.1% |
| Meta Platforms, Inc., Class A | 2.7% |
| Tesla, Inc. | 2.4% |
Material Fund Changes
On July 9, 2025, the shareholders of John Hancock Funds II Capital Appreciation Fund (the Acquired Fund) voted to approve an Agreement and Plan of Reorganization pursuant to which the Acquired Fund transferred all of its assets to the fund (the Acquiring Fund) in exchange for corresponding shares of the Acquiring Fund. The effective time of the reorganization occurred immediately after the close of regularly scheduled trading on the New York Stock Exchange on July 18, 2025.
This is a summary of certain changes to the fund since 4-1-25 . For more complete information, please refer to the fund’s prospectus. The currently effective prospectus is available at jhinvestments.com/documents or by calling 800-225-5291 .
This is a summary of certain changes to the fund since 4-1-25 . For more complete information, please refer to the fund’s prospectus. The currently effective prospectus is available at jhinvestments.com/documents or by calling 800-225-5291 .