
Exhibit 99.2
2026 Earnings FIRST QUARTER
This presentation by Webull Corporation ("Webull") includes "forward-looking statements" within the meaning of the "safe harbor" provisions of the U.S. Private Securities Litigation Reform Act of 1995. Among other things, statements other than statements of historical fact, including statements about Webull's beliefs and expectations, Webull's business strategy and operational plans, planned products and services, financial and market outlook, and projections, are forward-looking statements. These forward-looking statements can be identified by terminology such as "may," "could," "will," "expect," "anticipate," "aim," "future," "intend," "plan," "believe," "estimate," "likely to," "potential," "confident," "guidance," and similar terminology, although not all forward-looking statements contain such terminology. All forward-looking statements are based upon current estimates and forecasts and reflect the reasonable views, assumptions, expectations, and opinions of Webull and its management as of the date of this presentation, and are therefore subject to a number of factors, risks and uncertainties, some of which are not currently known to Webull and its management and could cause actual results to differ materially from those expressed or implied by such forward-looking statements. Some of these factors include, but are not limited to, the risks and uncertainties that are more fully described in filings made, or to be made, by Webull with the U.S. Securities and Exchange Commission (the "SEC"), including in the sections entitled "Risk Factors" and "Cautionary Note Regarding Forward-Looking Statements" in those filings. There may be additional risks that Webull and its management presently do not know or that Webull and its management currently believe are immaterial that could also cause actual results to differ materially from those contained in the forward-looking statements. In light of these factors, risks and uncertainties, the forward-looking events and circumstances discussed in this presentation may not occur, and any estimates, assumptions, expectations, forecasts, views or opinions set forth in this presentation should be regarded as preliminary and for illustrative purposes only and accordingly, undue reliance should not be placed upon the forward-looking statements. All information provided in this presentation is as of the date hereof, and Webull undertakes no obligation to update any forward-looking statement, except as required under applicable law. This presentation contains certain financial measures that are not recognized under generally accepted accounting principles in the U.S. ("GAAP"), including adjusted operating profit, adjusted net income, and adjusted operating expenses. Adjusted operating profit represents income from continuing operations, before income taxes, excluding share-based compensation expenses, one-time transactions, and other expense (income), net. Adjusted net income represents net income attributable to the Company, excluding share-based compensation expenses, foreign currency transaction gains and losses and one-time transactions. Adjusted operating expenses represent total operating expenses, excluding share-based compensation expenses and one-time transactions. Webull believes that adjusted operating profit, adjusted net income, and adjusted operating expenses help identify underlying trends in our business that could otherwise be distorted by the effect of certain expenses that we include in income from continuing operations, before income taxes, and total operating expenses. Such measures also provide useful information about Webull's operating results, enhances the overall understanding of Webull's past performance and future prospects and allows for greater visibility with respect to key metrics used by Webull's management in its financial and operational decision-making. The reconciliation of those measures to the most comparable GAAP measures is presented in the Appendix at the end of this presentation. These non-GAAP measures have limitations as an analytical tool and you should not consider them in isolation or as a substitute for an analysis of Webull's financial results under GAAP. Adjusted operating profit, adjusted net income and adjusted operating expenses presented here may not be comparable to similarly titled measures presented by other companies. This presentation does not constitute investment, tax or legal advice, and does not contain all relevant information relating to Webull or its securities, particularly with respect to the risks and special considerations involved with an investment in the securities of Webull. This presentation does not constitute (i) an offer or invitation for the sale or purchase of our securities or a commitment of Webull, or (ii) a solicitation of proxy, consent or authorization with respect to any securities. This presentation shall not form the basis of any contract, commitment or investment decision and does not constitute either advice or recommendation regarding any securities. Nothing contained in this presentation shall be relied upon as a promise or representation as to the past or future performance or results of Webull. We own or have rights to various trademarks, trade names or service marks that we use in connection with our business, including, among others, "Webull" and our other registered and common law trade names, trademarks and service marks, including our corporate logo. Solely for convenience, some of the trademarks, service marks and trade names referred to in this prospectus are listed without the TM and ® symbols, but we will assert, to the fullest extent under applicable law, rights to such trademarks, service marks and trade names. The unaudited financial and operational information included in this presentation is subject to potential adjustments and is based on the information available to management at this time. Potential adjustments to operational and consolidated financial information may be identified from work performed during Webull's preparation of financial statements subsequently hereto or its year-end audit. Information may also be presented differently from the information included herein in the future. This could result in significant differences from the unaudited or other historical operational and financial information included herein. Disclaimers webullcorp.com/investor-relations/ 1
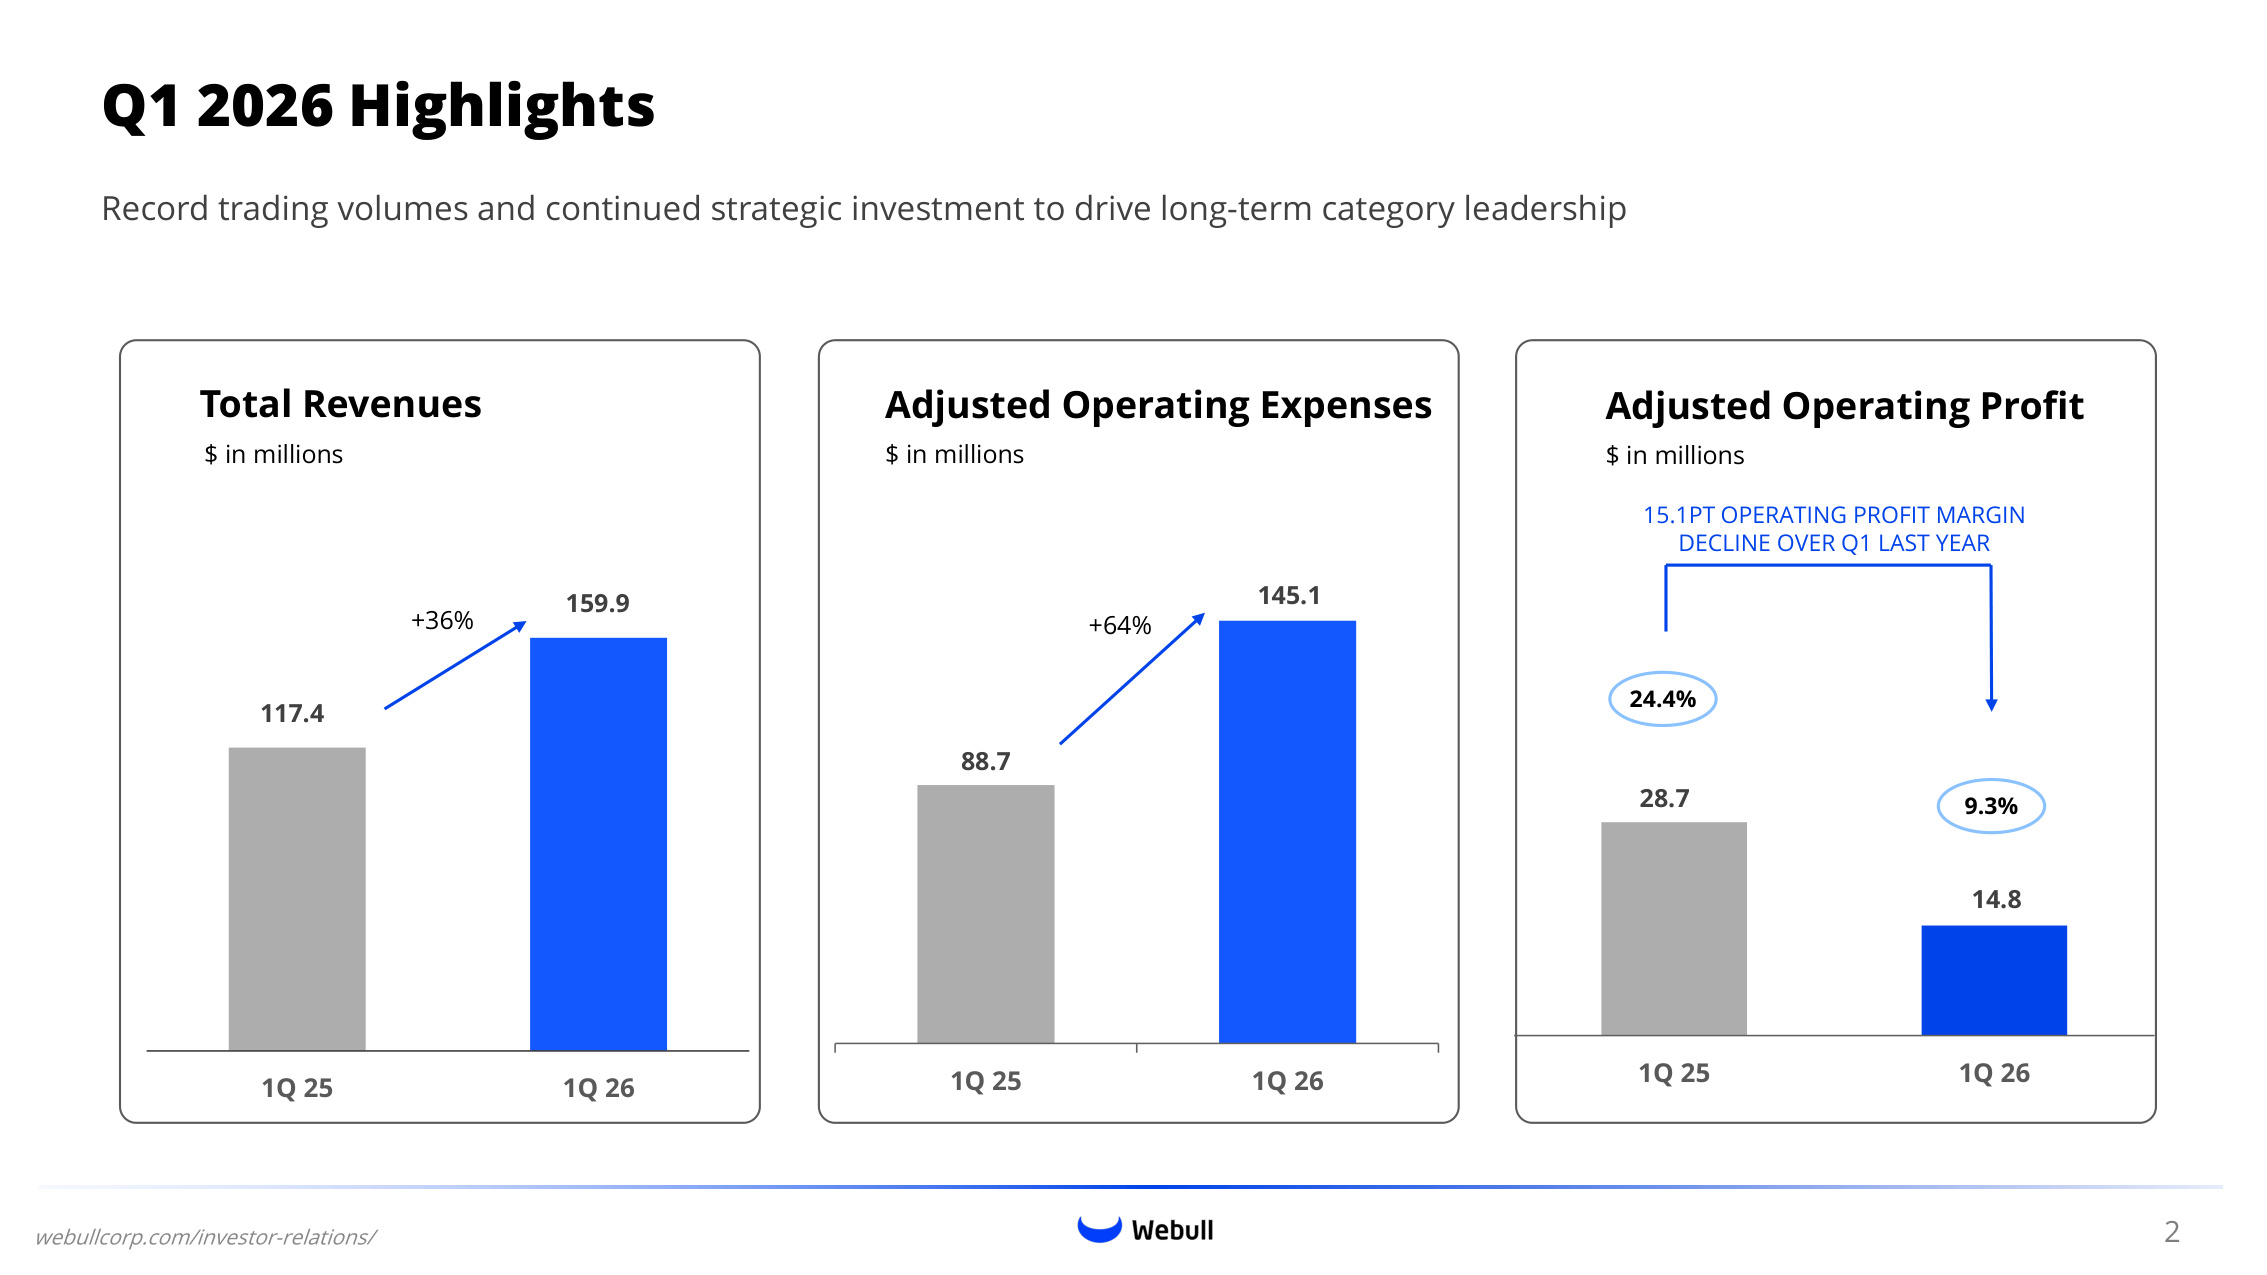
Total Revenues $ in millions Q1 2026 Highlights Record trading volumes and continued strategic investment to drive long-term category leadership Adjusted Operating Expenses $ in millions webullcorp.com/investor-relations/ 117.4 159.9 1Q 25 1Q 26 88.7 145.1 1Q 25 1Q 26 +36% +64% 2 Adjusted Operating Profit $ in millions 15.1PT OPERATING PROFIT MARGIN DECLINE OVER Q1 LAST YEAR 28.7 14.8 1Q 25 1Q 26 9.3% 24.4%
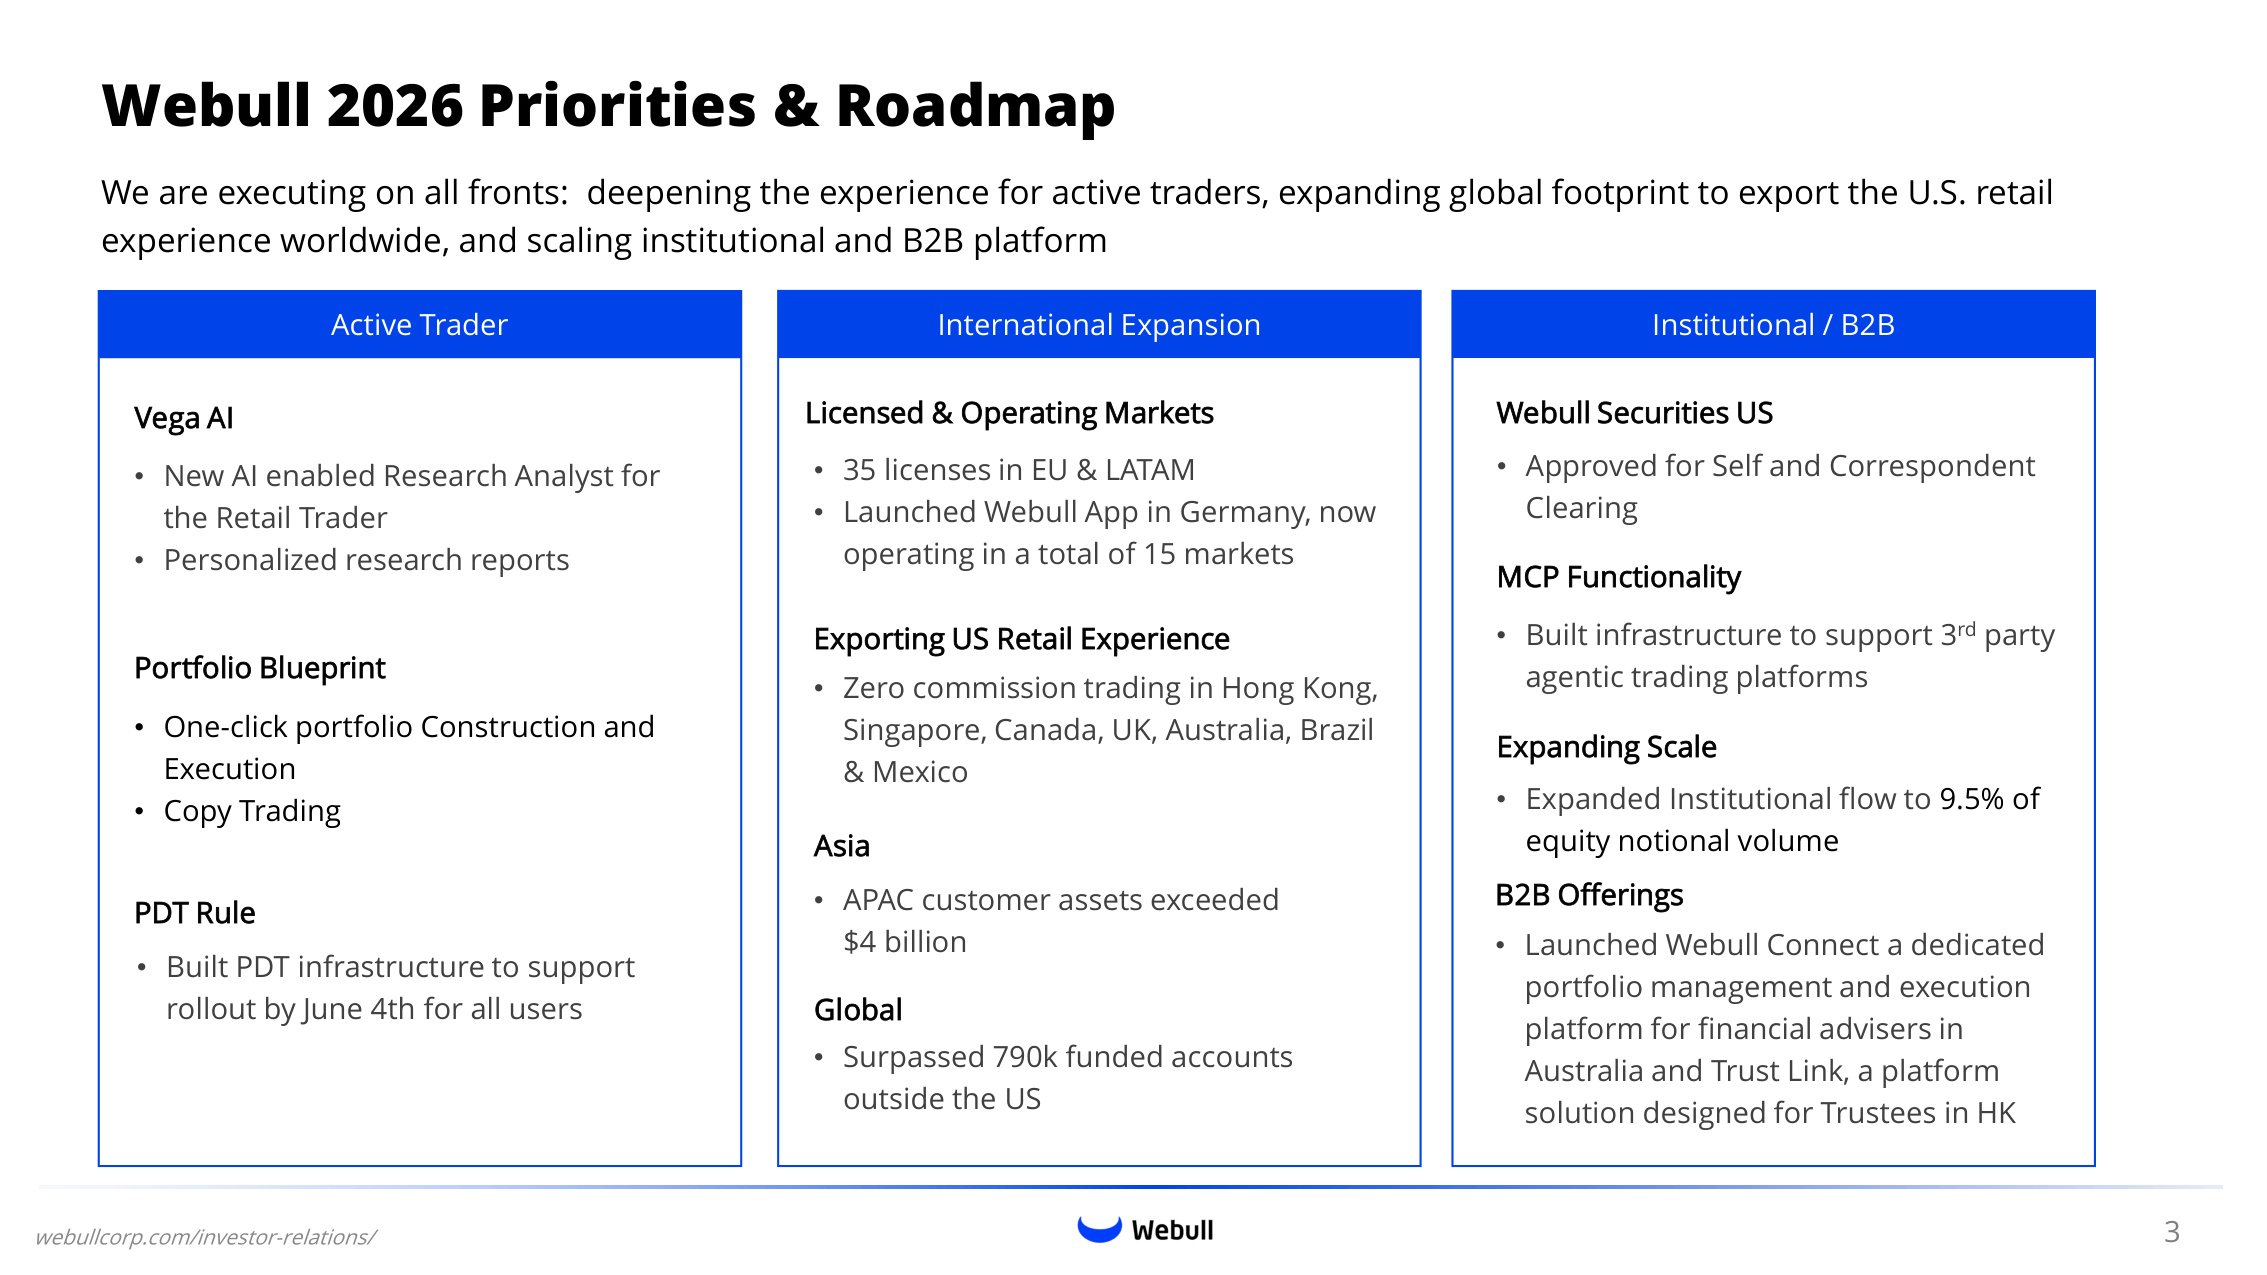
Webull 2026 Priorities & Roadmap Active Trader International Expansion Institutional / B2B • New AI enabled Research Analyst for the Retail Trader • Personalized research reports • 35 licenses in EU & LATAM • Launched Webull App in Germany, now operating in a total of 15 markets Vega AI PDT Rule • Built PDT infrastructure to support rollout by June 4th for all users Licensed & Operating Markets • APAC customer assets exceeded $4 billion Expanding Scale • Expanded Institutional flow to 9.5% of equity notional volume MCP Functionality • Built infrastructure to support 3rd party agentic trading platforms webullcorp.com/investor-relations/ Webull Securities US • Approved for Self and Correspondent Clearing Asia Exporting US Retail Experience • Zero commission trading in Hong Kong, Singapore, Canada, UK, Australia, Brazil & Mexico 3 • Surpassed 790k funded accounts outside the US Global • Launched Webull Connect a dedicated portfolio management and execution platform for financial advisers in Australia and Trust Link, a platform solution designed for Trustees in HK Portfolio Blueprint • One-click portfolio Construction and Execution • Copy Trading B2B Offerings We are executing on all fronts: deepening the experience for active traders, expanding global footprint to export the U.S. retail experience worldwide, and scaling institutional and B2B platform
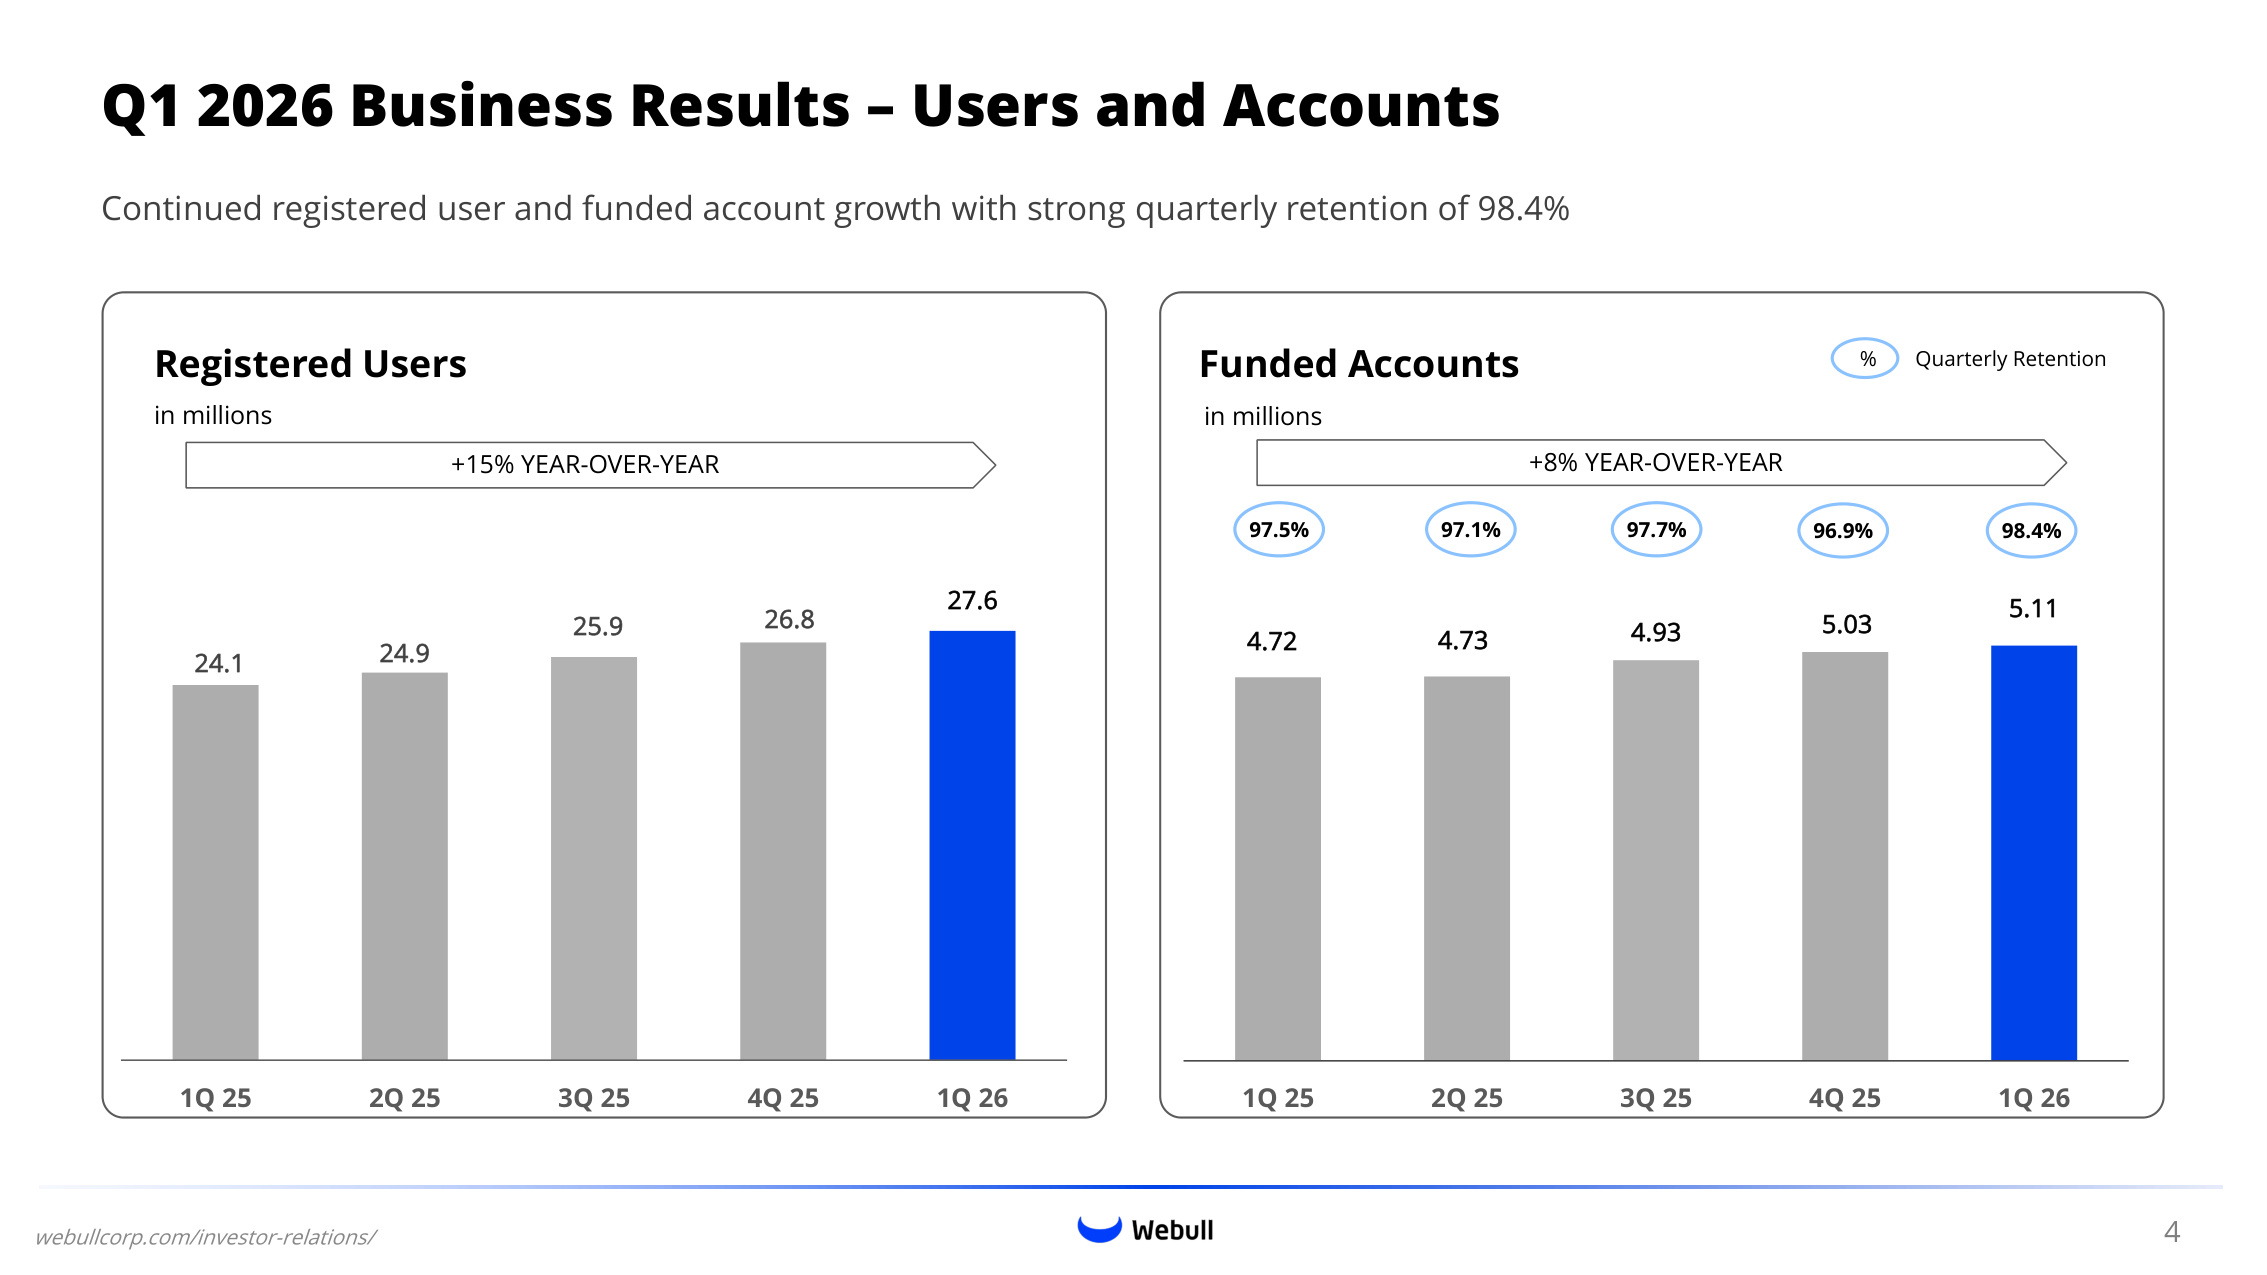
Funded Accounts in millions Q1 2026 Business Results – Users and Accounts Continued registered user and funded account growth with strong quarterly retention of 98.4% Registered Users in millions webullcorp.com/investor-relations/ 4.72 4.73 4.93 5.03 5.11 1Q 25 2Q 25 3Q 25 4Q 25 1Q 26 24.1 24.9 25.9 26.8 27.6 1Q 25 2Q 25 3Q 25 4Q 25 1Q 26 4 +15% YEAR-OVER-YEAR +8% YEAR-OVER-YEAR % Quarterly Retention 97.5% 97.1% 97.7% 96.9% 98.4%
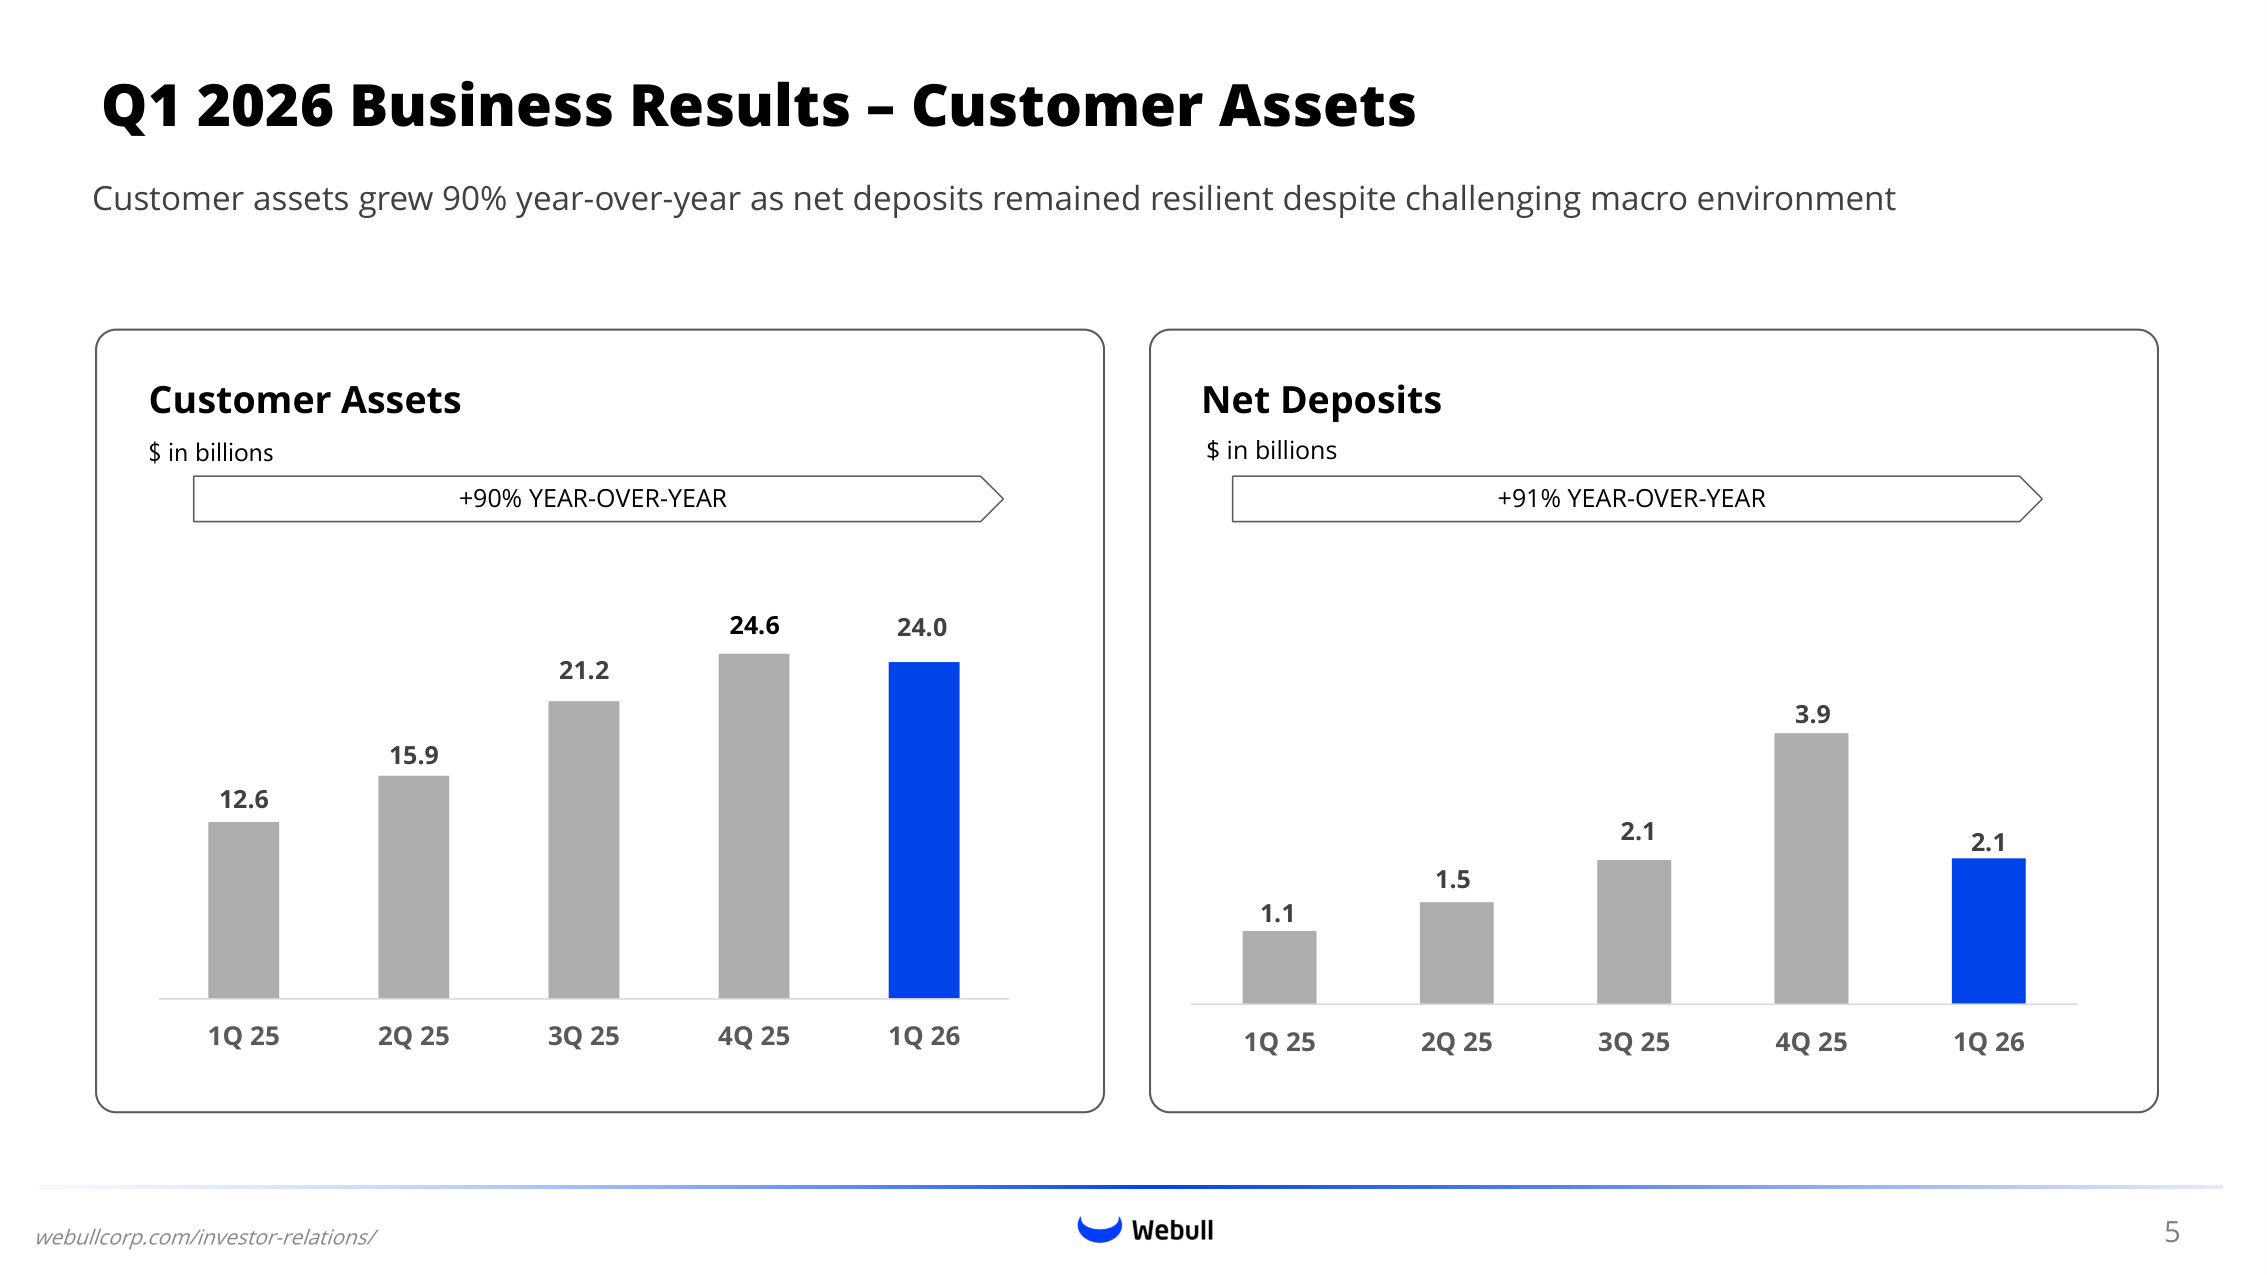
Q1 2026 Business Results – Customer Assets Net Deposits $ in billions webullcorp.com/investor-relations/ 3.9 1.1 1.5 2.1 2.1 1Q 25 2Q 25 3Q 25 4Q 25 1Q 26 12.6 15.9 21.2 24.0 1Q 25 2Q 25 3Q 25 4Q 25 1Q 26 24.6 Customer Assets $ in billions +90% YEAR-OVER-YEAR +91% YEAR-OVER-YEAR 5 Customer assets grew 90% year-over-year as net deposits remained resilient despite challenging macro environment
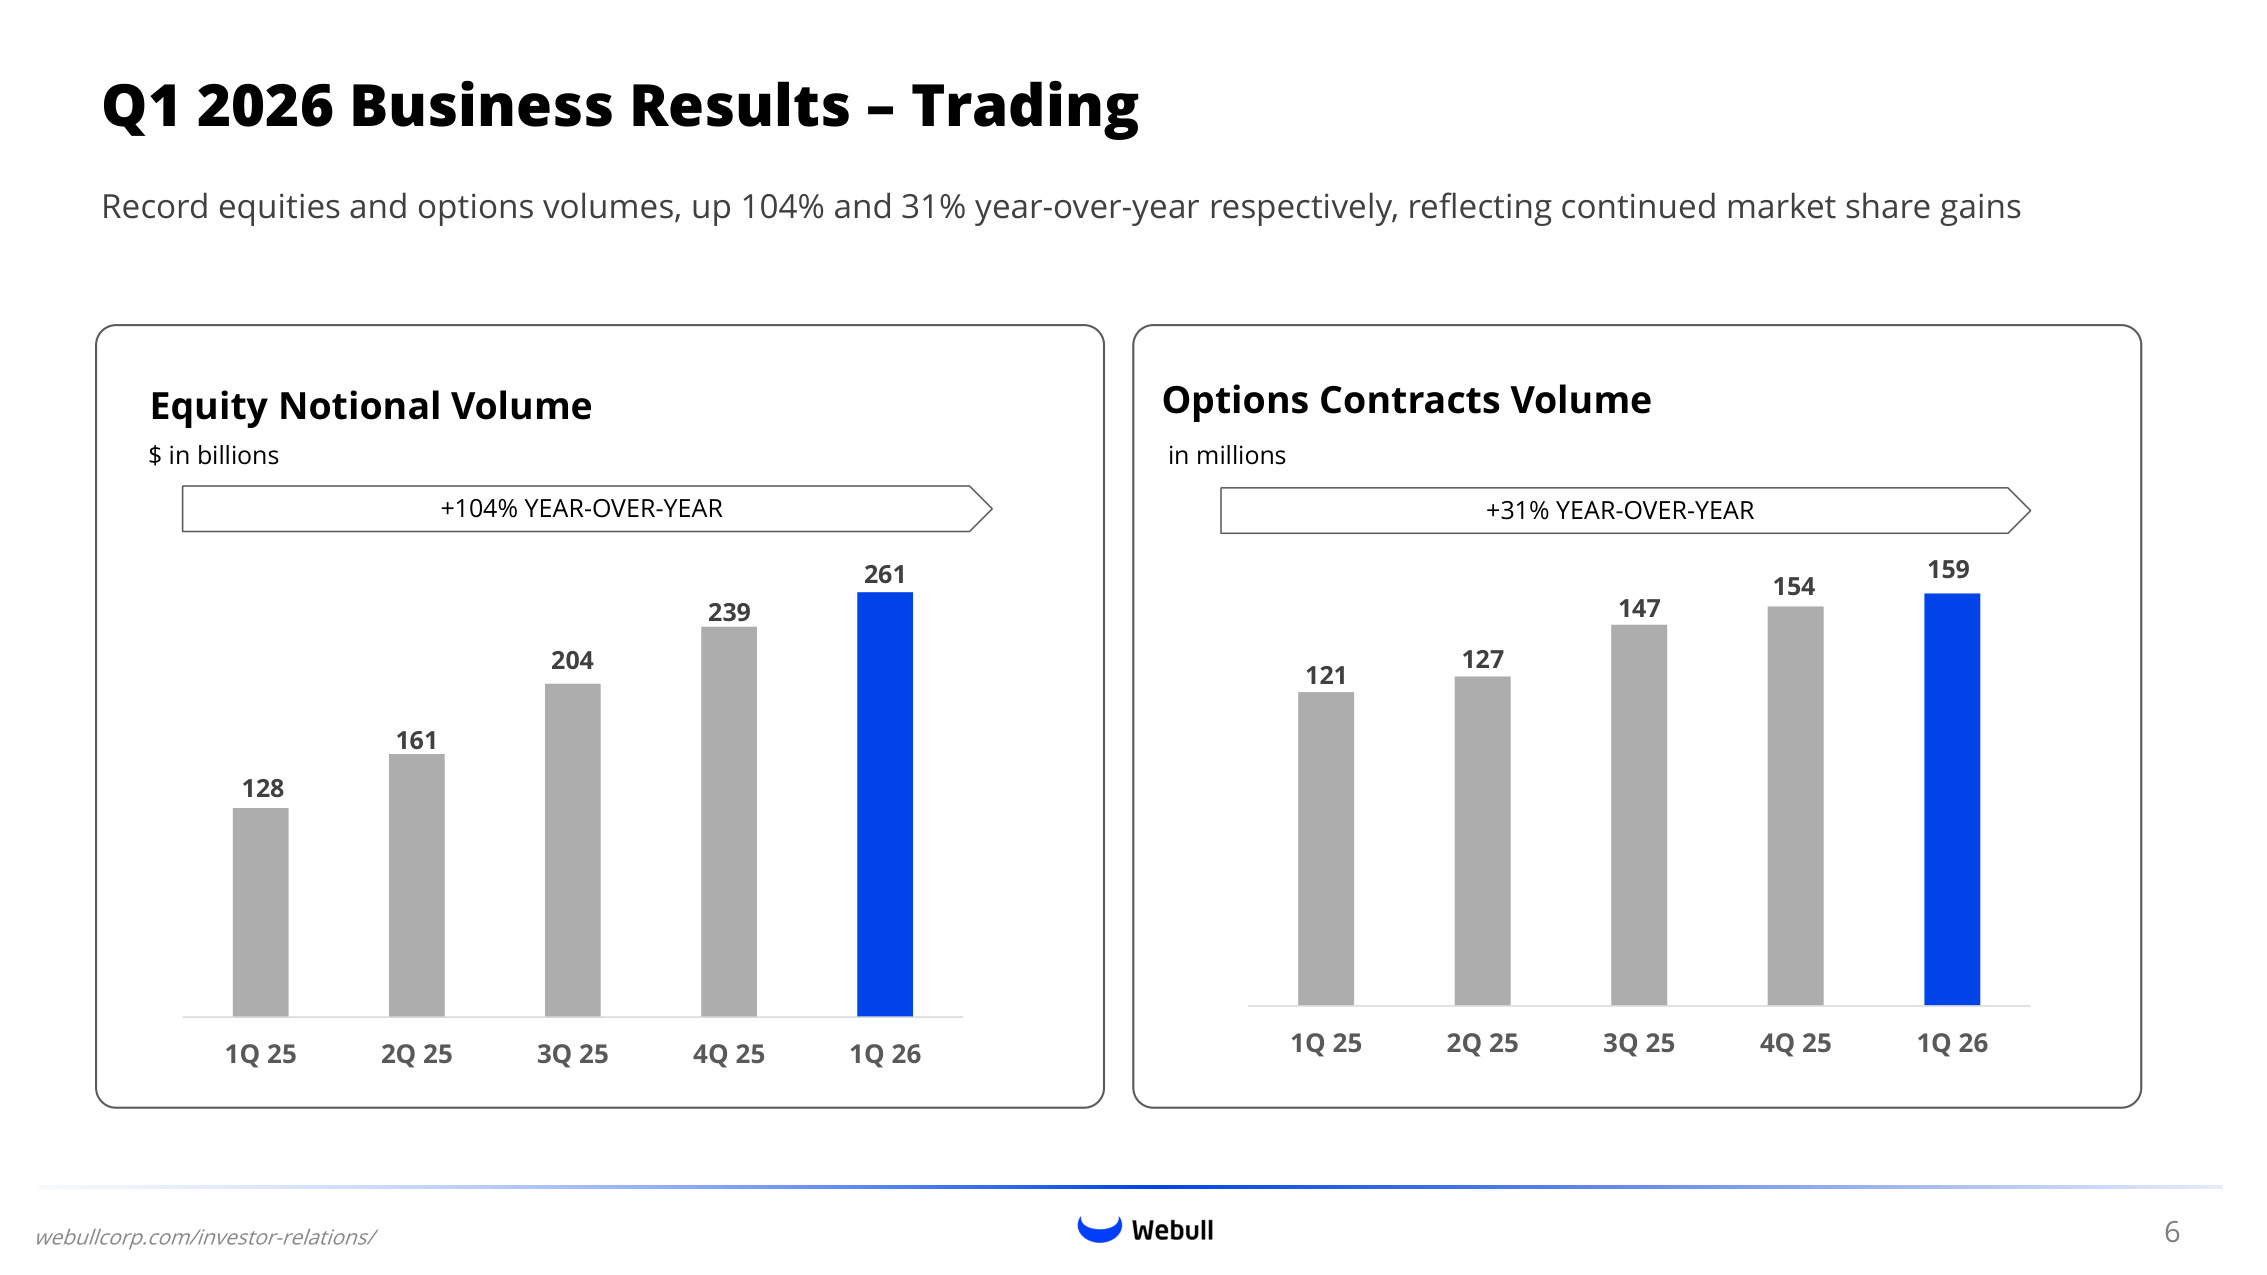
Equity Notional Volume $ in billions Q1 2026 Business Results – Trading Record equities and options volumes, up 104% and 31% year-over-year respectively, reflecting continued market share gains Options Contracts Volume in millions webullcorp.com/investor-relations/ 128 161 204 239 261 1Q 25 2Q 25 3Q 25 4Q 25 1Q 26 121 127 147 154 159 1Q 25 2Q 25 3Q 25 4Q 25 1Q 26 +104% YEAR-OVER-YEAR +31% YEAR-OVER-YEAR 6
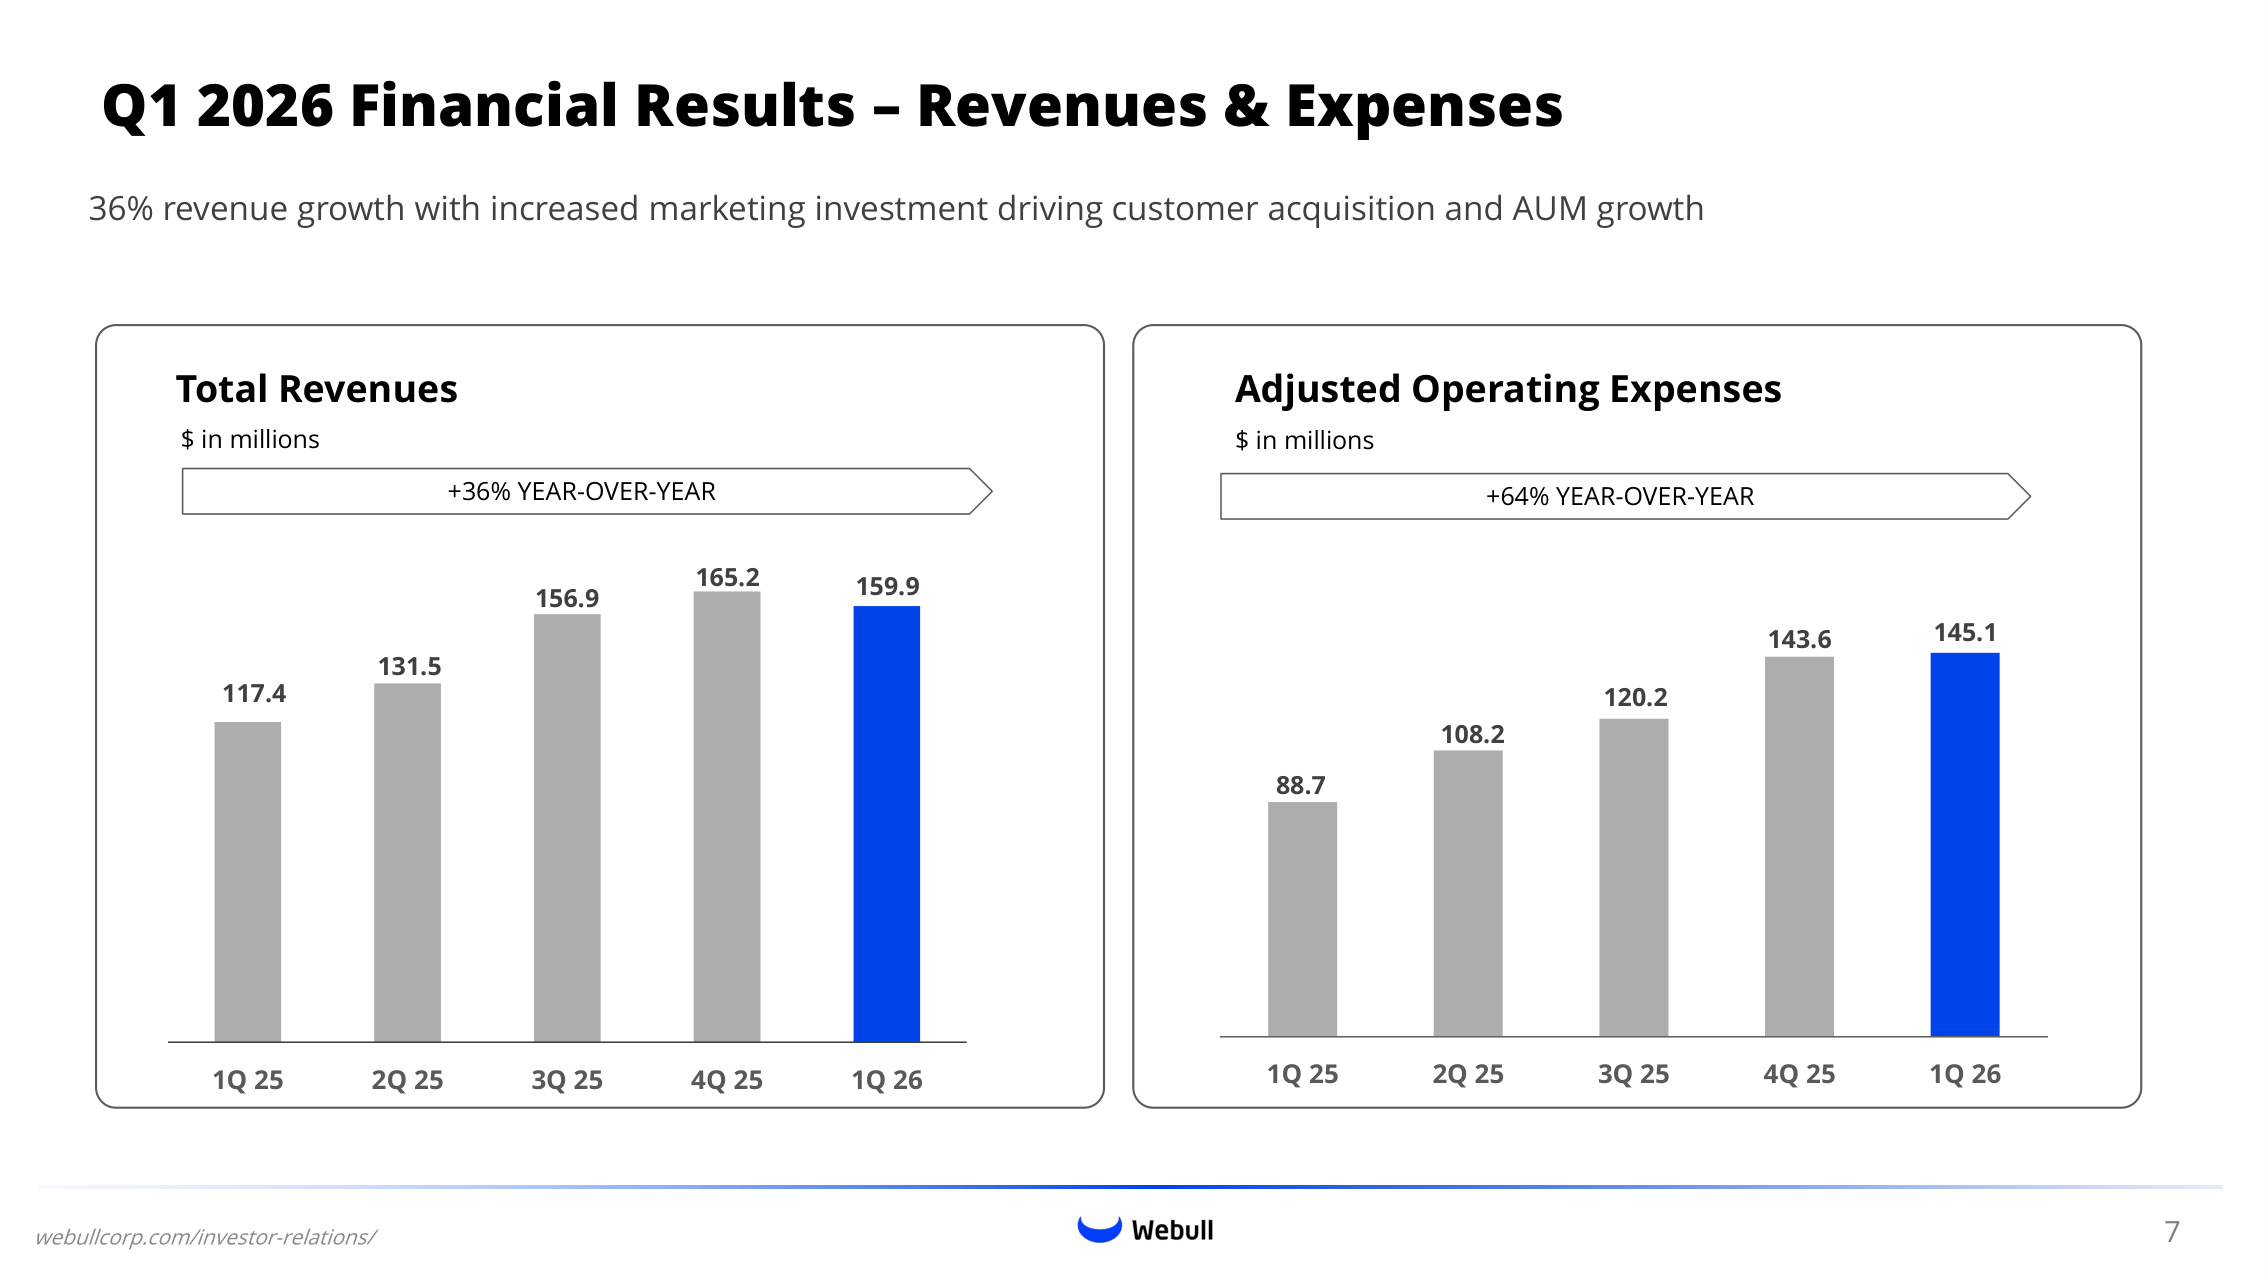
Total Revenues $ in millions Q1 2026 Financial Results – Revenues & Expenses 36% revenue growth with increased marketing investment driving customer acquisition and AUM growth Adjusted Operating Expenses $ in millions webullcorp.com/investor-relations/ 117.4 131.5 156.9 165.2 159.9 1Q 25 2Q 25 3Q 25 4Q 25 1Q 26 88.7 108.2 120.2 143.6 145.1 1Q 25 2Q 25 3Q 25 4Q 25 1Q 26 +36% YEAR-OVER-YEAR +64% YEAR-OVER-YEAR 7
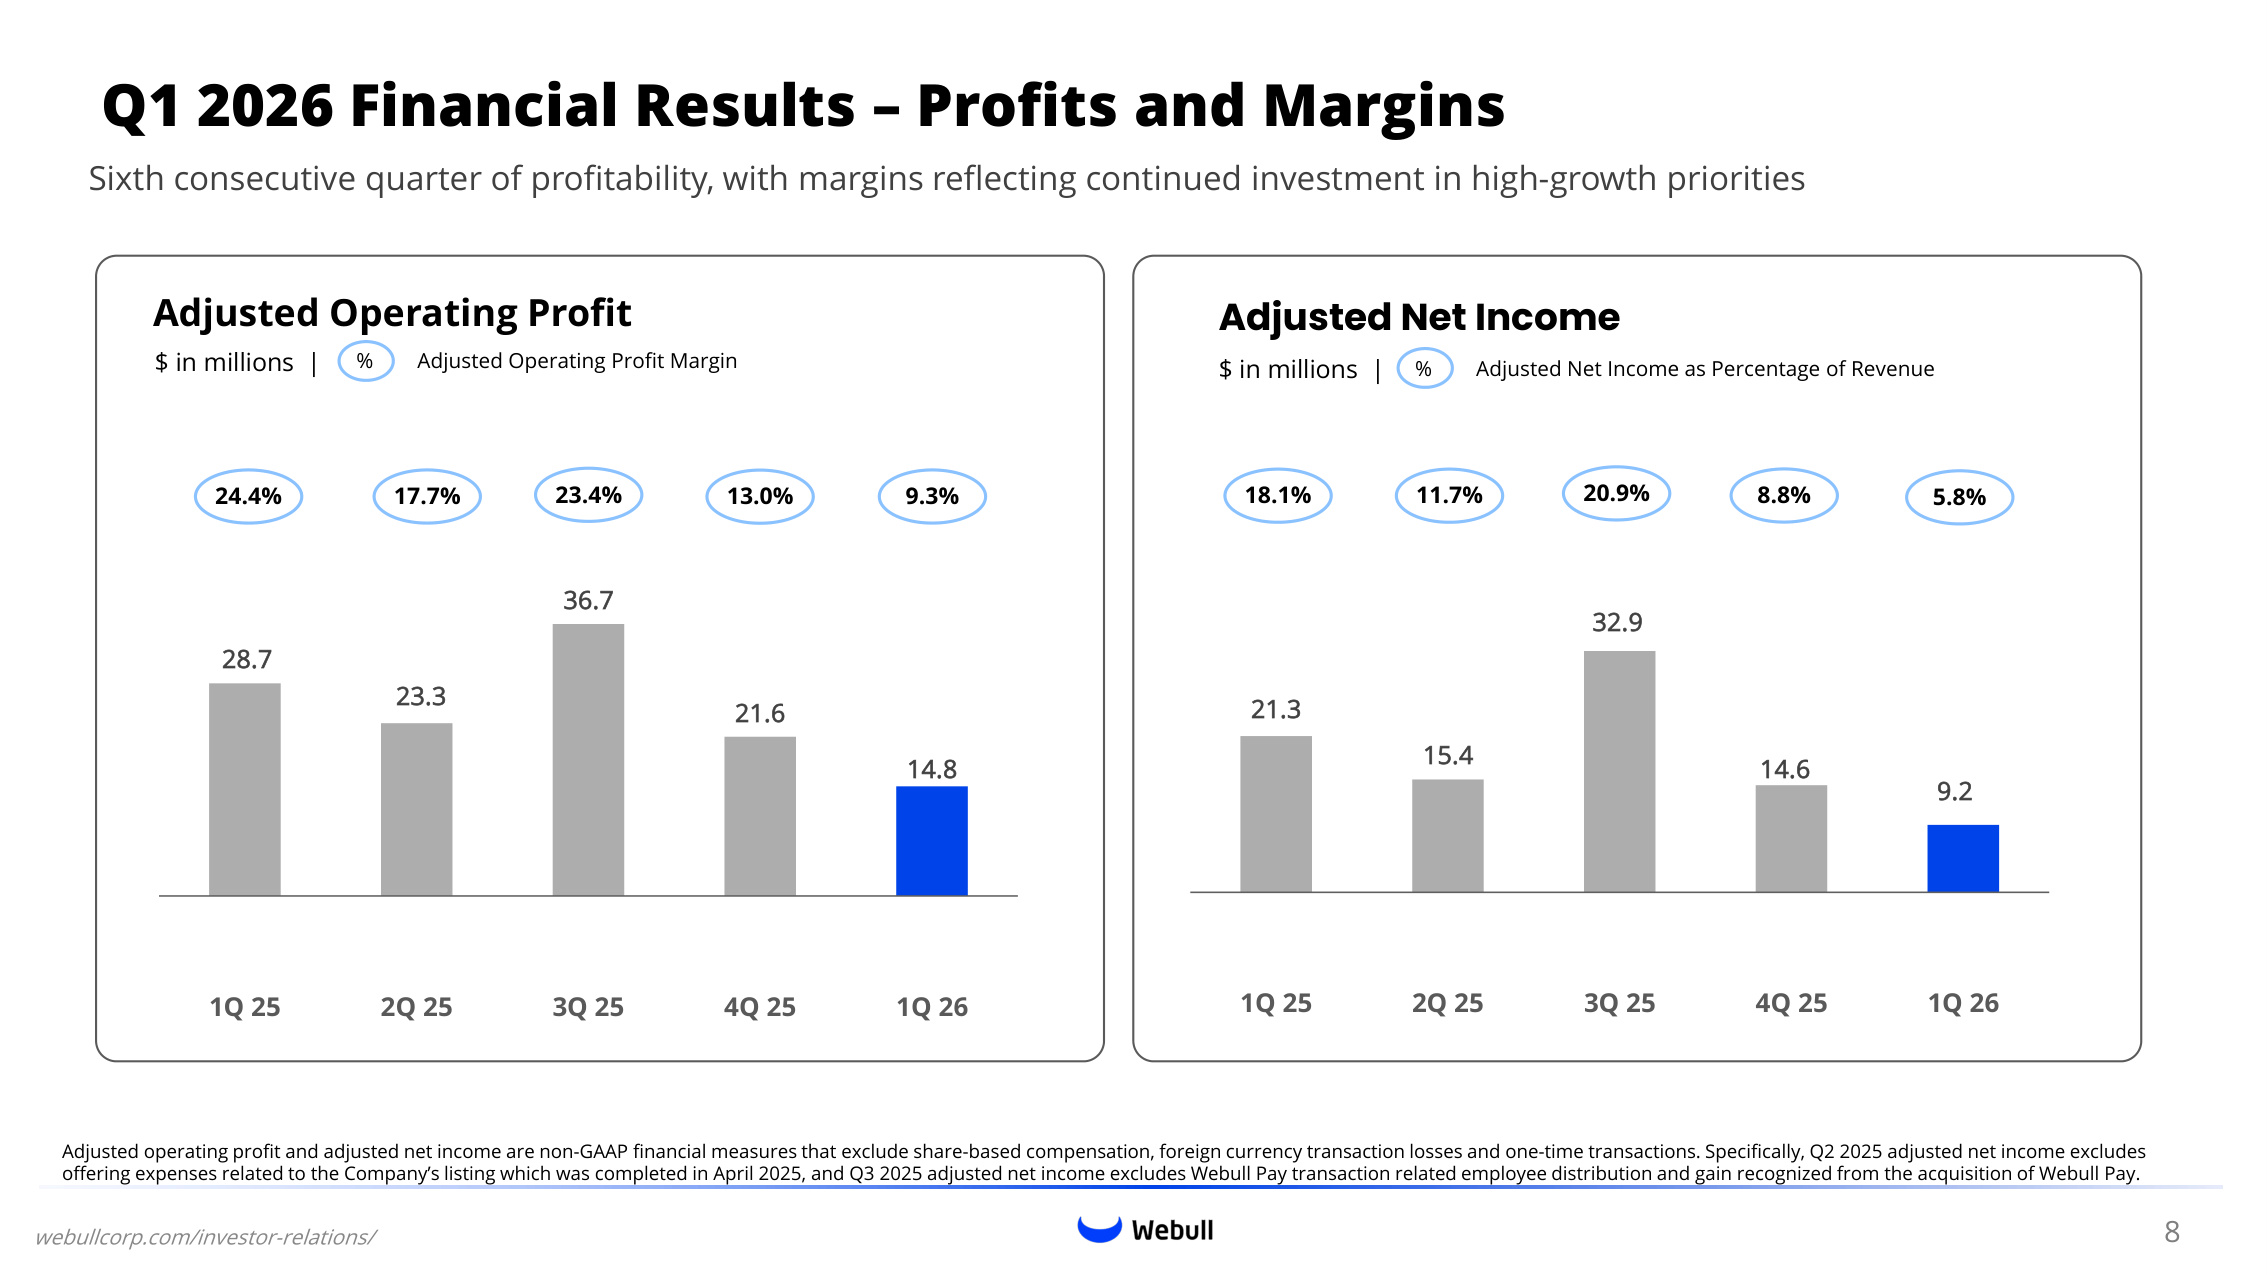
Adjusted Operating Profit $ in millions | Q1 2026 Financial Results – Profits and Margins Adjusted Net Income $ in millions | webullcorp.com/investor-relations/ 24.4% 17.7% % Adjusted Operating Profit Margin 28.7 23.3 36.7 21.6 14.8 1Q 25 2Q 25 3Q 25 4Q 25 1Q 26 % Adjusted Net Income as Percentage of Revenue 21.3 15.4 32.9 14.6 9.2 1Q 25 2Q 25 3Q 25 4Q 25 1Q 26 18.1% 11.7% Adjusted operating profit and adjusted net income are non-GAAP financial measures that exclude share-based compensation, foreign currency transaction losses and one-time transactions. Specifically, Q2 2025 adjusted net income excludes offering expenses related to the Company's listing which was completed in April 2025, and Q3 2025 adjusted net income excludes Webull Pay transaction related employee distribution and gain recognized from the acquisition of Webull Pay. 23.4% 20.9% 13.0% 8.8% 8 9.3% 5.8% Sixth consecutive quarter of profitability, with margins reflecting continued investment in high-growth priorities
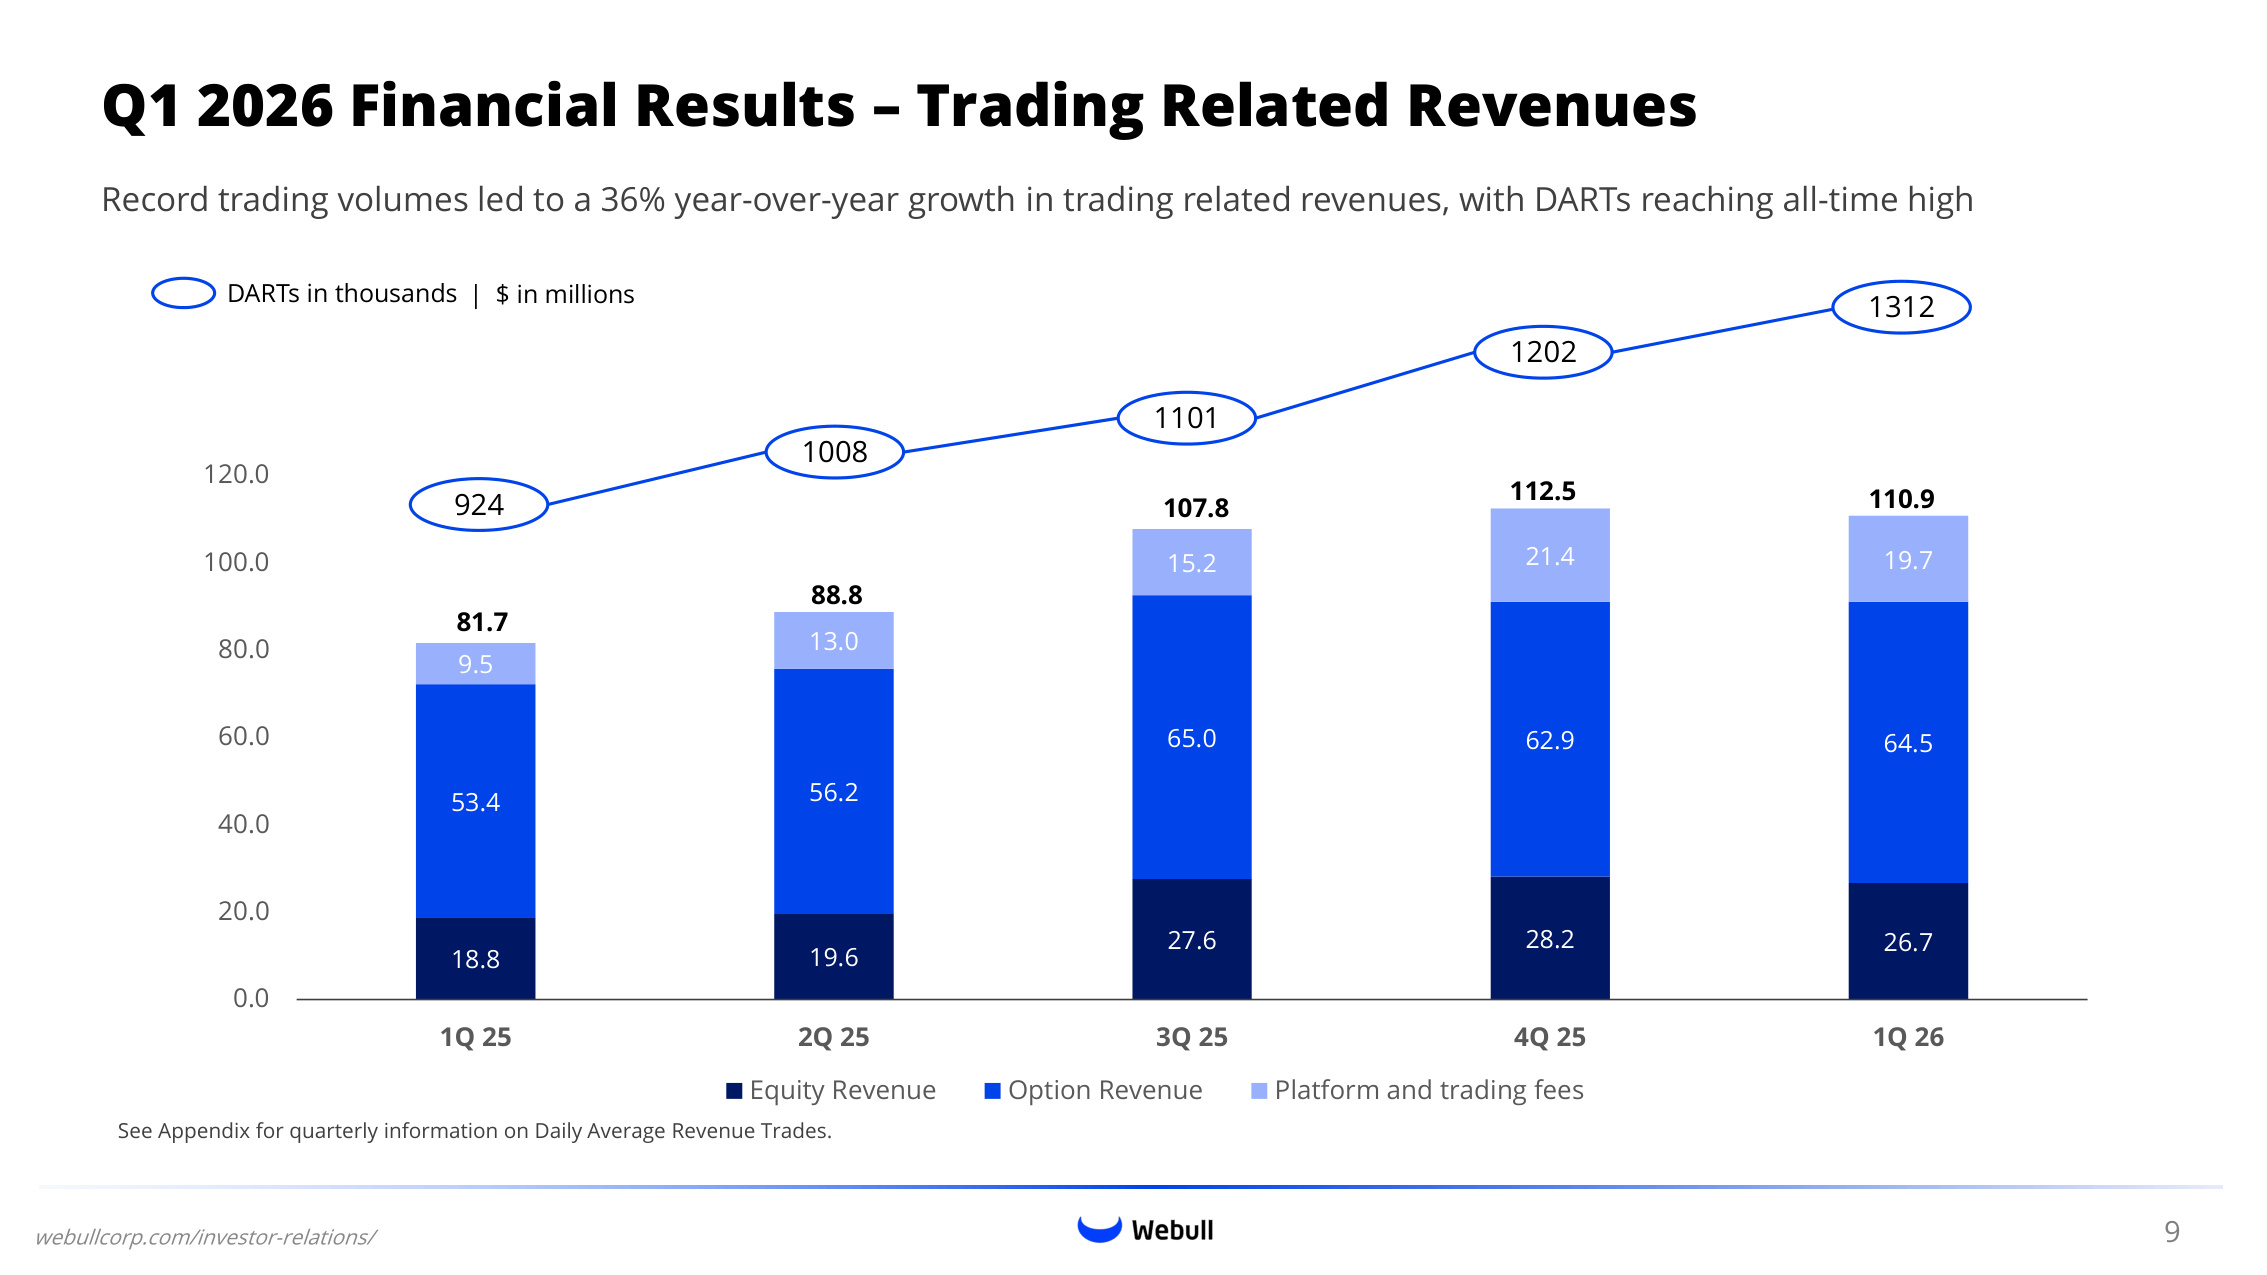
Q1 2026 Financial Results – Trading Related Revenues Record trading volumes led to a 36% year-over-year growth in trading related revenues, with DARTs reaching all-time high webullcorp.com/investor-relations/ 18.8 19.6 27.6 28.2 26.7 53.4 56.2 65.0 62.9 64.5 9.5 13.0 15.2 21.4 19.7 0.0 20.0 40.0 60.0 80.0 100.0 120.0 1Q 25 2Q 25 3Q 25 4Q 25 1Q 26 Equity Revenue Option Revenue Platform and trading fees 112.5 110.9 81.7 88.8 107.8 9 See Appendix for quarterly information on Daily Average Revenue Trades. | $ in millions 924 1008 1101 1202 DARTs in thousands 1312
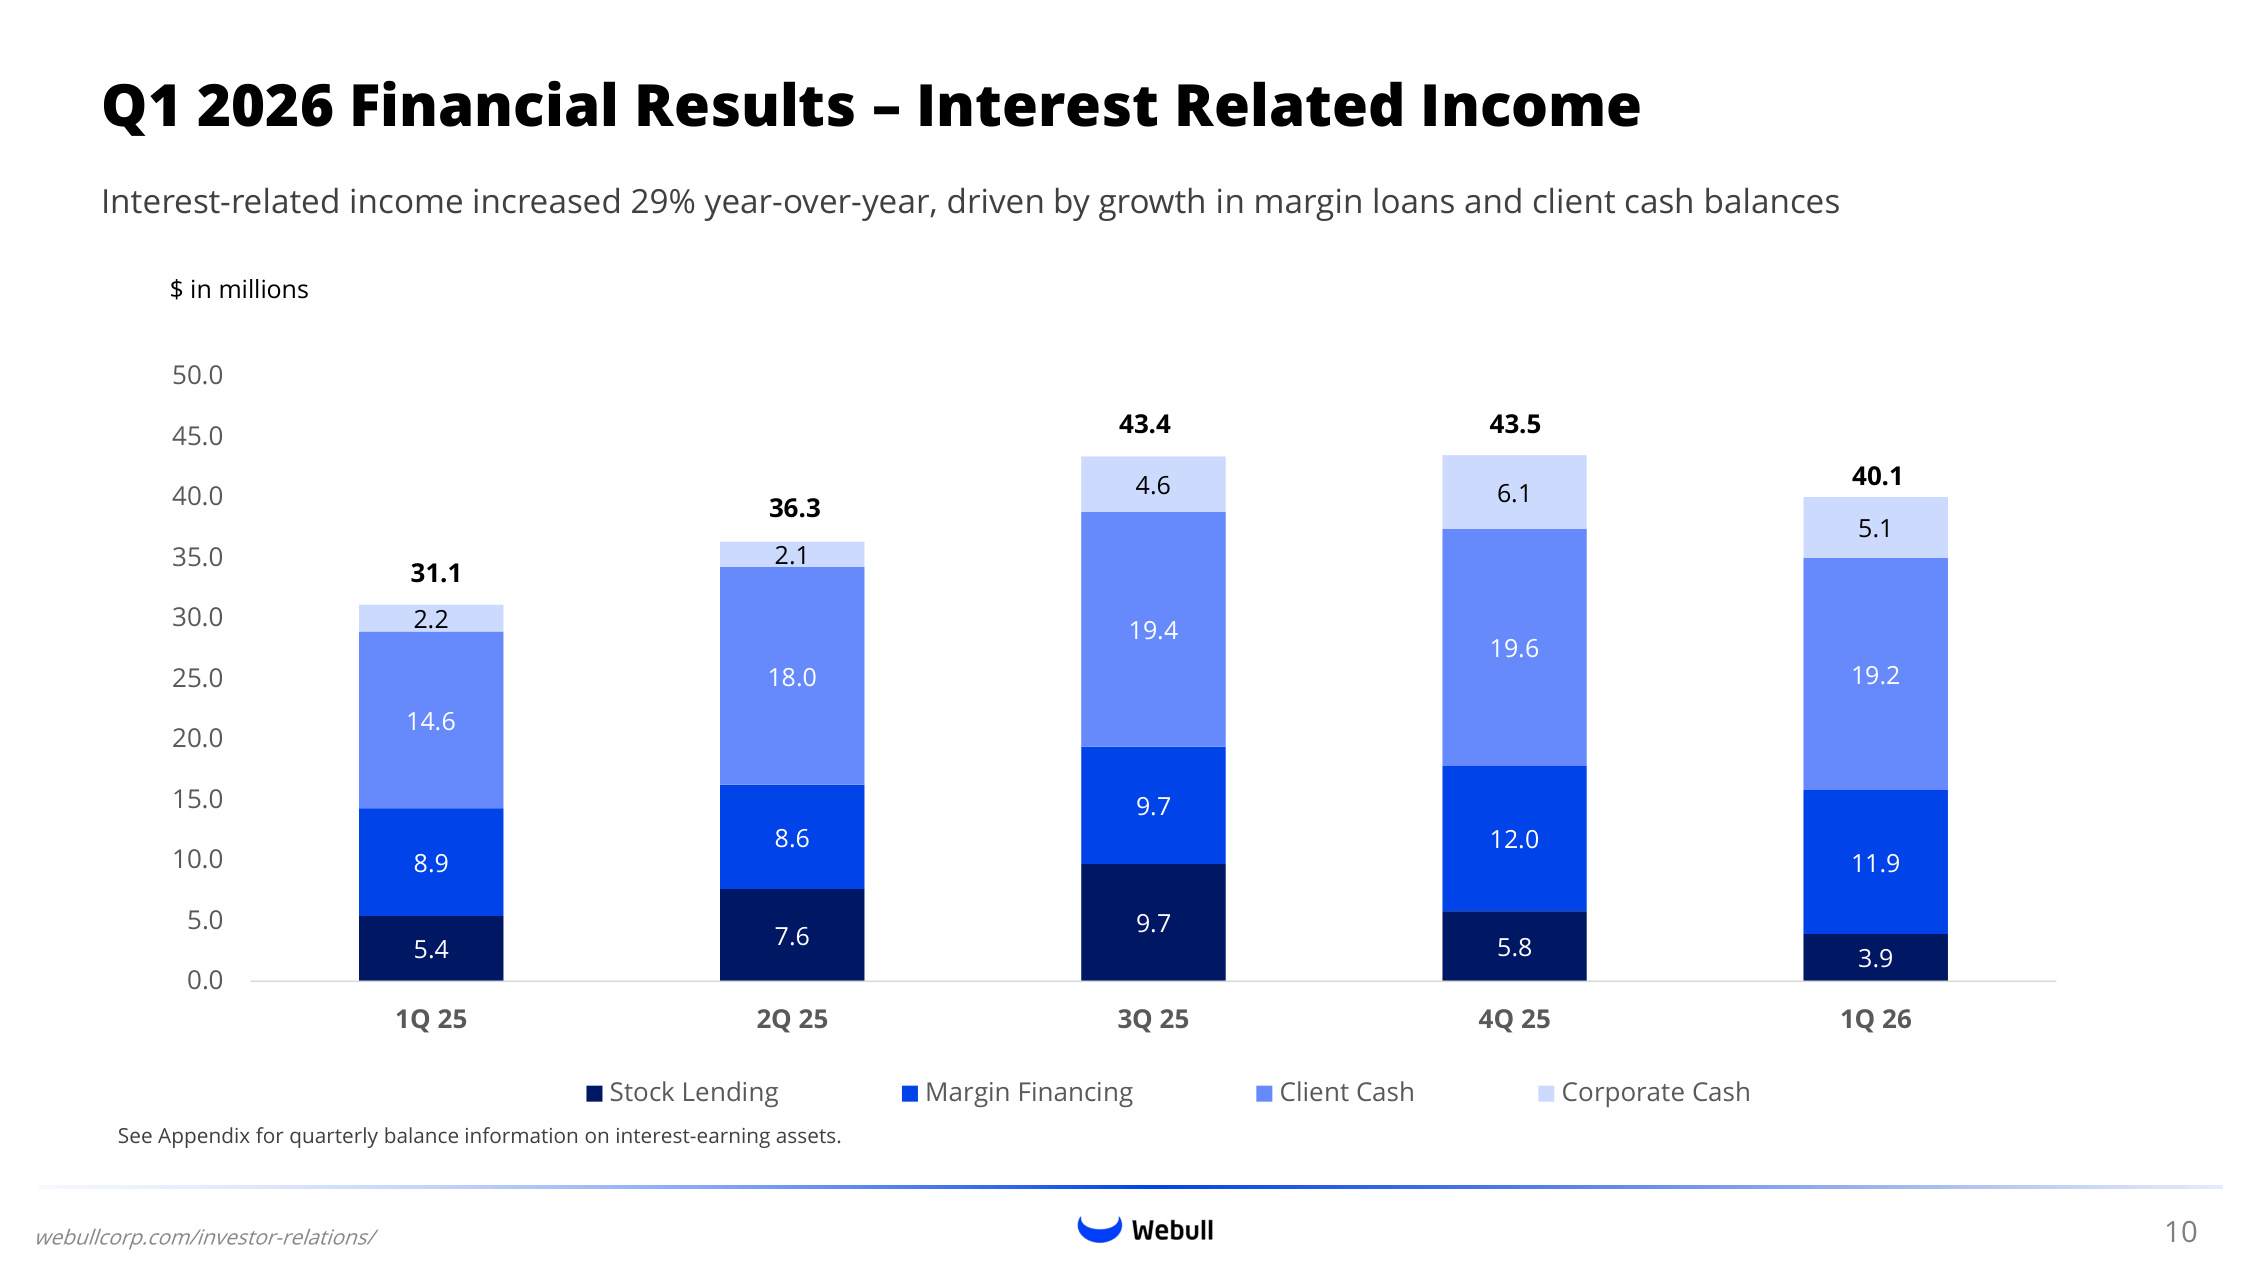
Q1 2026 Financial Results – Interest Related Income Interest-related income increased 29% year-over-year, driven by growth in margin loans and client cash balances webullcorp.com/investor-relations/ 5.4 7.6 9.7 5.8 3.9 8.9 8.6 9.7 12.0 11.9 14.6 18.0 19.4 19.6 19.2 2.2 2.1 4.6 6.1 5.1 0.0 5.0 10.0 15.0 20.0 25.0 30.0 35.0 40.0 45.0 50.0 1Q 25 2Q 25 3Q 25 4Q 25 1Q 26 Stock Lending Margin Financing Client Cash Corporate Cash 43.5 40.1 $ in millions 31.1 36.3 43.4 10 See Appendix for quarterly balance information on interest-earning assets.
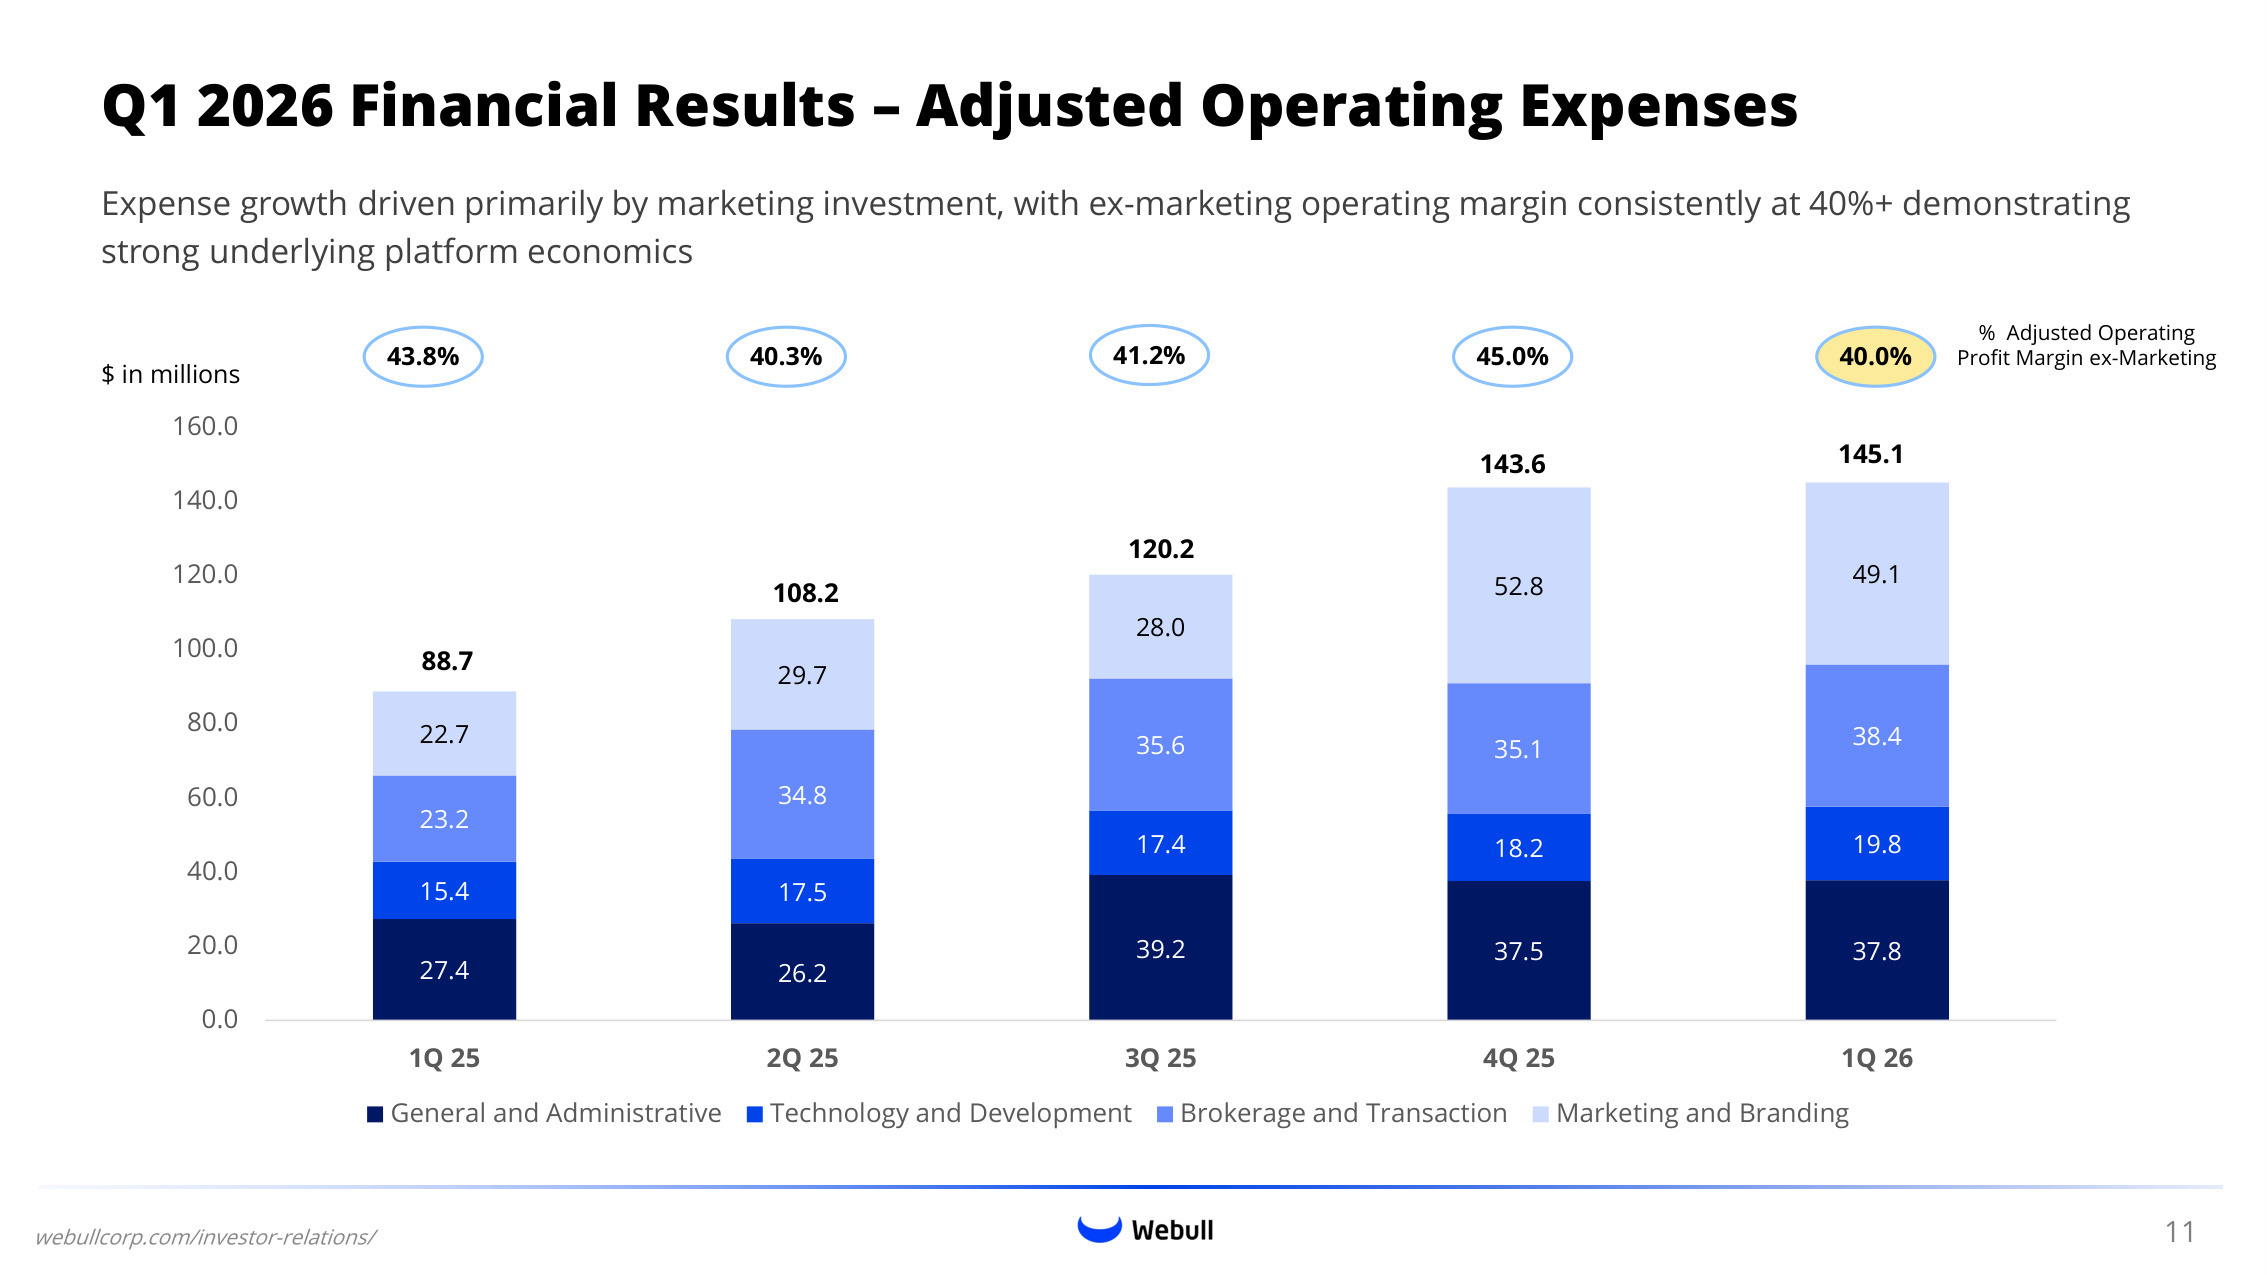
Q1 2026 Financial Results – Adjusted Operating Expenses Expense growth driven primarily by marketing investment, with ex-marketing operating margin consistently at 40%+ demonstrating strong underlying platform economics webullcorp.com/investor-relations/ 27.4 26.2 39.2 37.5 37.8 15.4 17.5 17.4 18.2 19.8 23.2 34.8 35.6 35.1 38.4 22.7 29.7 28.0 52.8 49.1 0.0 20.0 40.0 60.0 80.0 100.0 120.0 140.0 160.0 1Q 25 2Q 25 3Q 25 4Q 25 1Q 26 General and Administrative Technology and Development Brokerage and Transaction Marketing and Branding 143.6 145.1 $ in millions 88.7 120.2 108.2 43.8% 40.3% 41.2% 45.0% % Adjusted Operating Profit Margin ex-Marketing 11 40.0%

Appendix
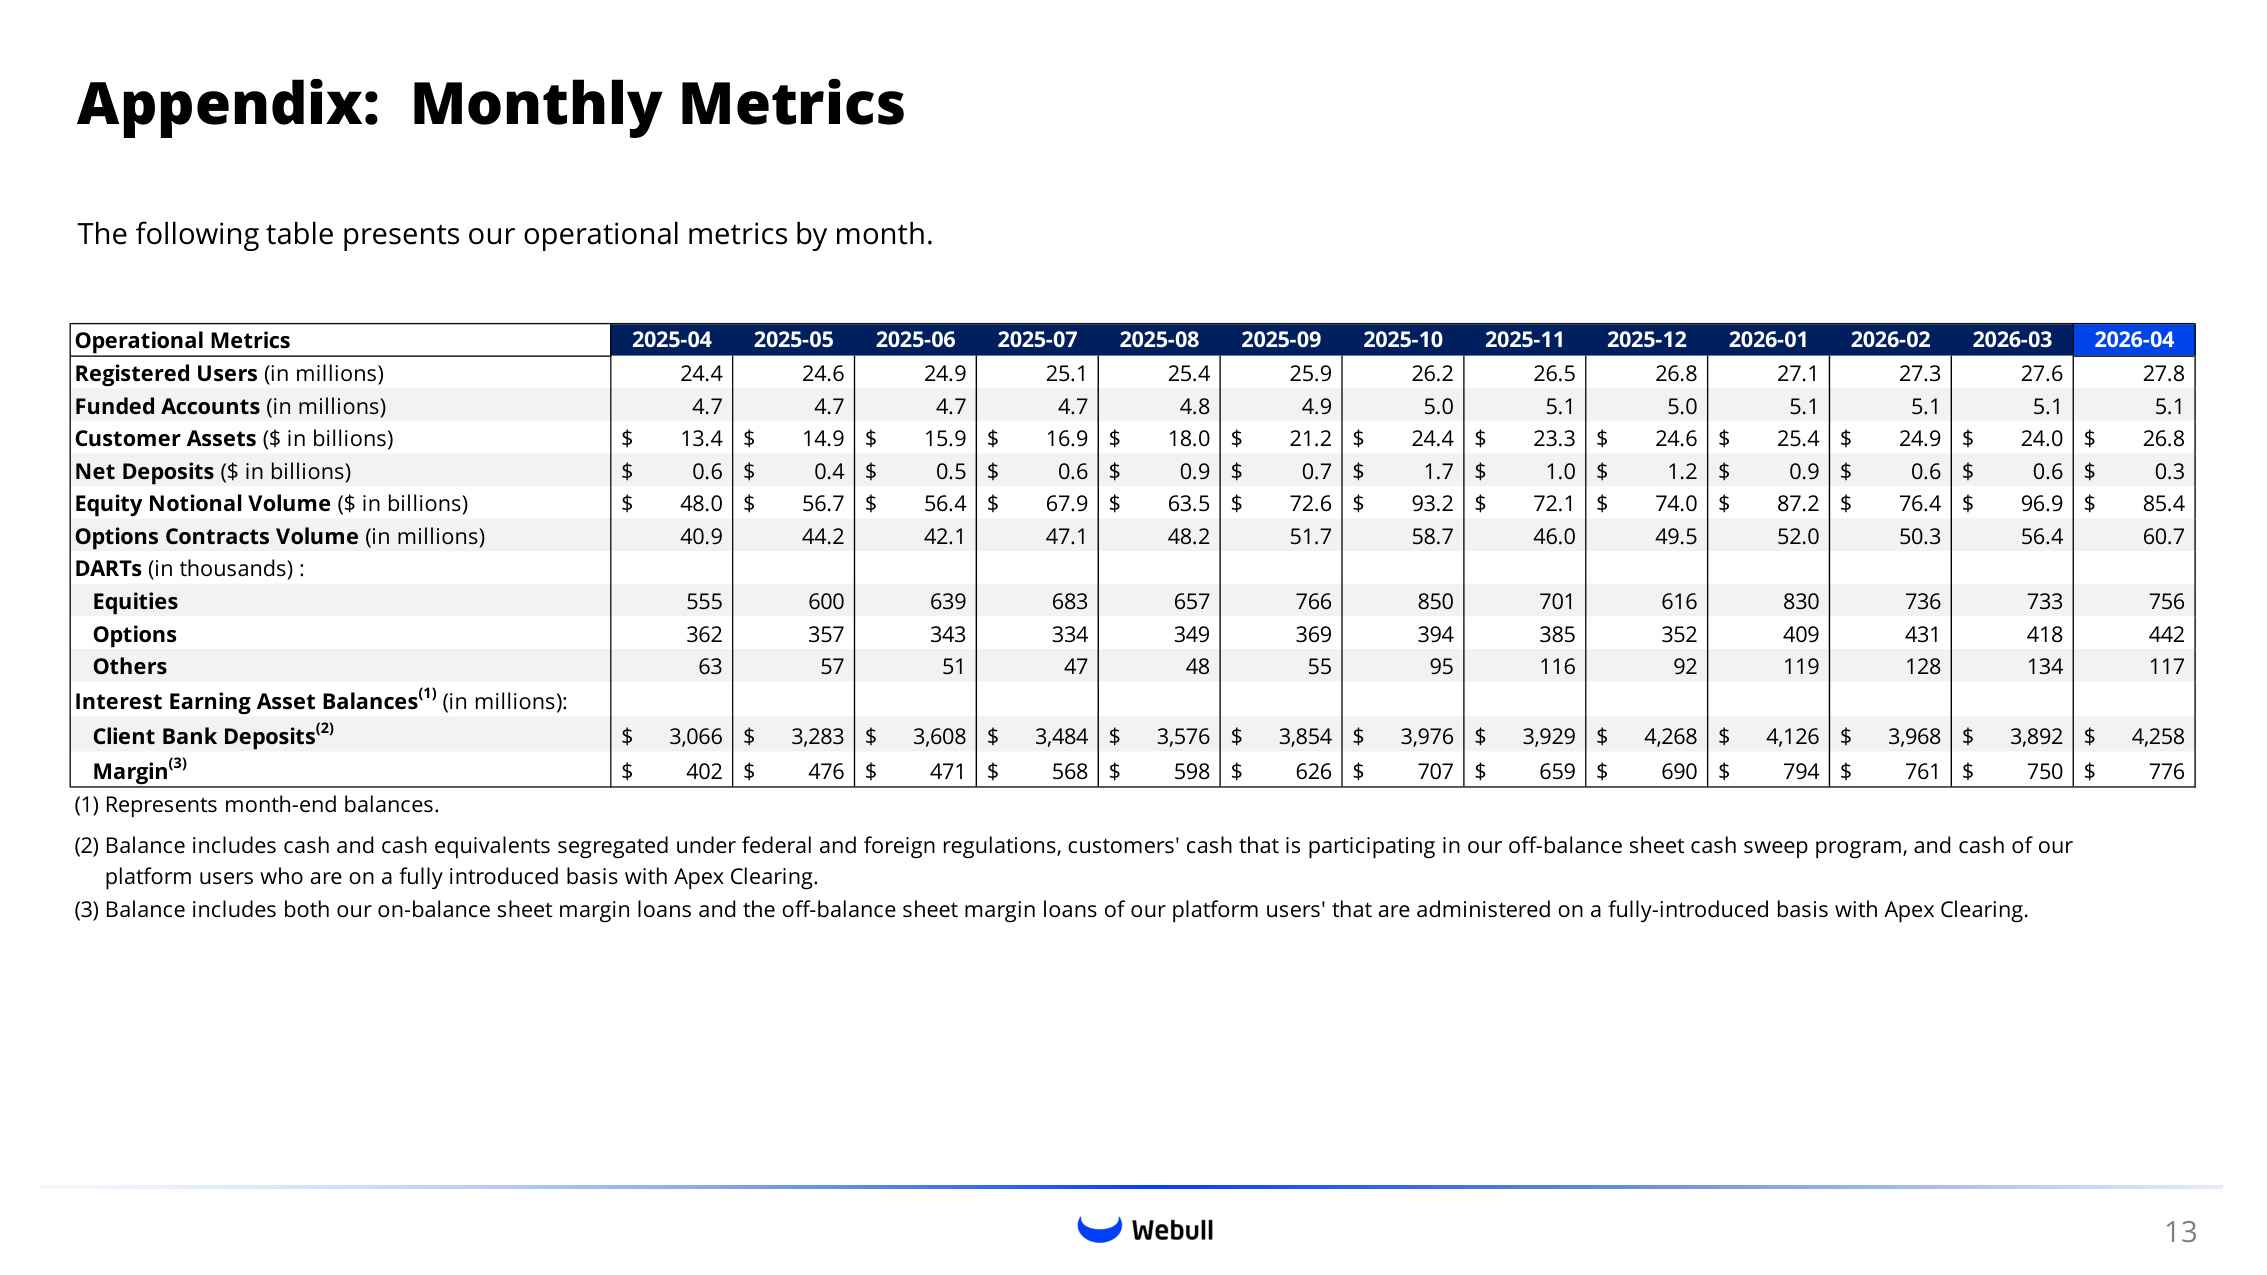
Appendix: Monthly Metrics 13 The following table presents our operational metrics by month. Operational Metrics 2025-04 2025-05 2025-06 2025-07 2025-08 2025-09 2025-10 2025-11 2025-12 2026-01 2026-02 2026-03 2026-04 Registered Users (in millions) 24.4 24.6 24.9 25.1 25.4 25.9 26.2 26.5 26.8 27.1 27.3 27.6 27.8 Funded Accounts (in millions) 4.7 4.7 4.7 4.7 4.8 4.9 5.0 5.1 5.0 5.1 5.1 5.1 5.1 Customer Assets ($ in billions) 13.4 $ 14.9 $ 15.9 $ 16.9 $ 18.0 $ 21.2 $ 24.4 $ 23.3 $ 24.6 $ 25.4 $ 24.9 $ 24.0 $ 26.8 $ Net Deposits ($ in billions) 0.6 $ 0.4 $ 0.5 $ 0.6 $ 0.9 $ 0.7 $ 1.7 $ 1.0 $ 1.2 $ 0.9 $ 0.6 $ 0.6 $ 0.3 $ Equity Notional Volume ($ in billions) 48.0 $ 56.7 $ 56.4 $ 67.9 $ 63.5 $ 72.6 $ 93.2 $ 72.1 $ 74.0 $ 87.2 $ 76.4 $ 96.9 $ 85.4 $ Options Contracts Volume (in millions) 40.9 44.2 42.1 47.1 48.2 51.7 58.7 46.0 49.5 52.0 50.3 56.4 60.7 DARTs (in thousands) : Equities 555 600 639 683 657 766 850 701 616 830 736 733 756 Options 362 357 343 334 349 369 394 385 352 409 431 418 442 Others 63 57 51 47 48 55 95 116 92 119 128 134 117 Interest Earning Asset Balances(1) (in millions): Client Bank Deposits(2) 3,066 $ 3,283 $ 3,608 $ 3,484 $ 3,576 $ 3,854 $ 3,976 $ 3,929 $ 4,268 $ 4,126 $ 3,968 $ 3,892 $ 4,258 $ Margin(3) 402 $ 476 $ 471 $ 568 $ 598 $ 626 $ 707 $ 659 $ 690 $ 794 $ 761 $ 750 $ 776 $ (1) Represents month-end balances. (2) Balance includes cash and cash equivalents segregated under federal and foreign regulations, customers' cash that is participating in our off-balance sheet cash sweep program, and cash of our platform users who are on a fully introduced basis with Apex Clearing. (3) Balance includes both our on-balance sheet margin loans and the off-balance sheet margin loans of our platform users' that are administered on a fully-introduced basis with Apex Clearing.
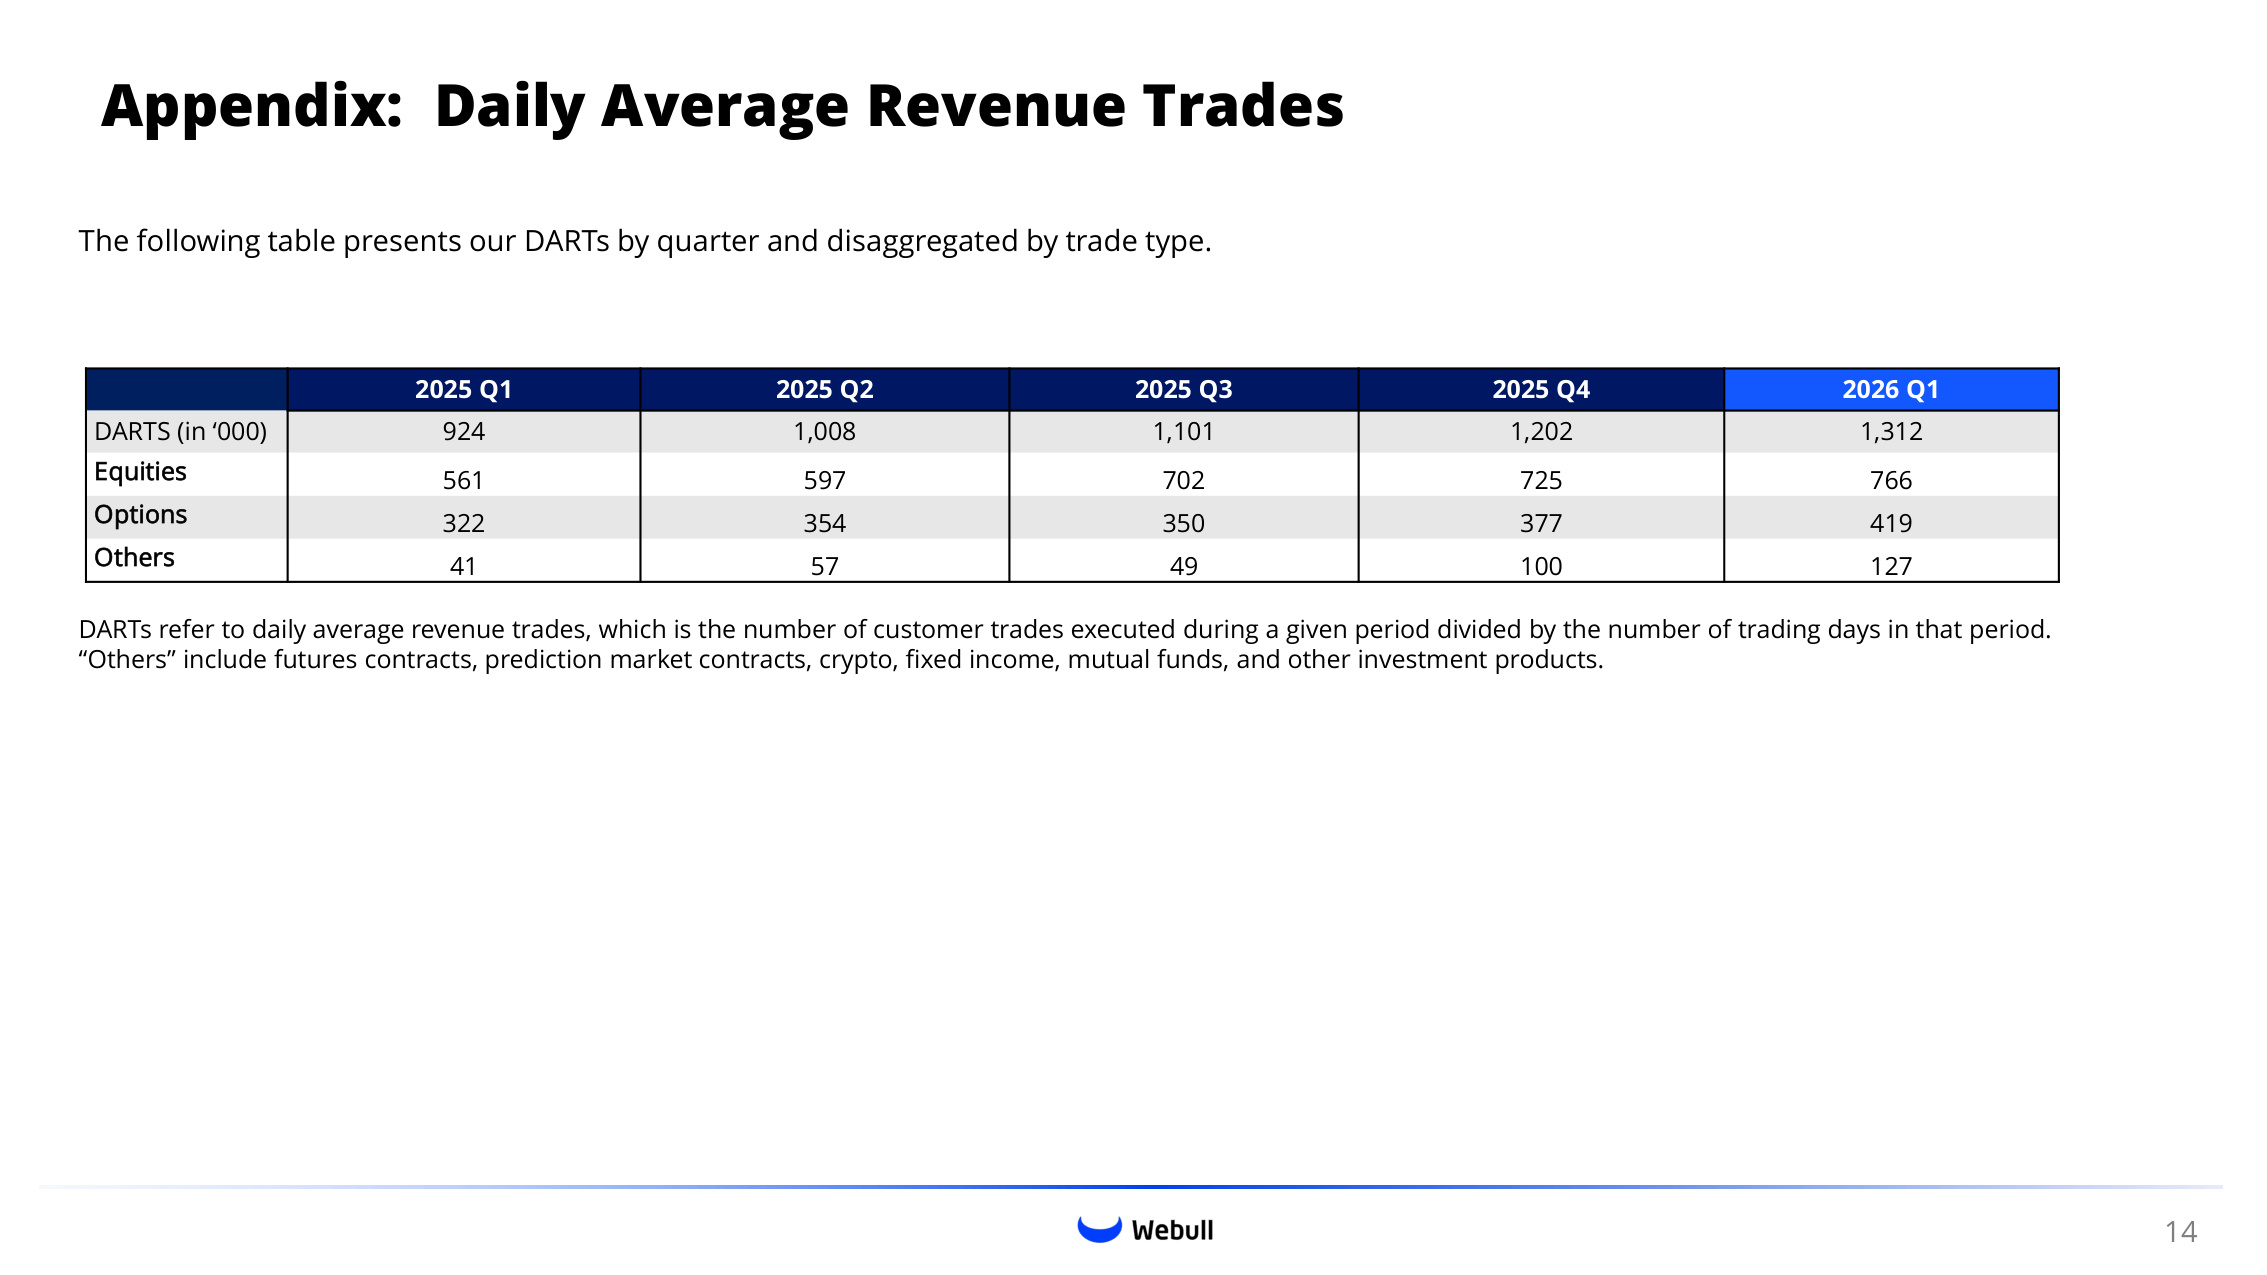
Appendix: Daily Average Revenue Trades 14 2025 Q1 2025 Q2 2025 Q3 2025 Q4 2026 Q1 DARTS (in '000) 924 1,008 1,101 1,202 1,312 Equities 561 597 702 725 766 Options 322 354 350 377 419 Others 41 57 49 100 127 DARTs refer to daily average revenue trades, which is the number of customer trades executed during a given period divided by the number of trading days in that period. "Others" include futures contracts, prediction market contracts, crypto, fixed income, mutual funds, and other investment products. The following table presents our DARTs by quarter and disaggregated by trade type.
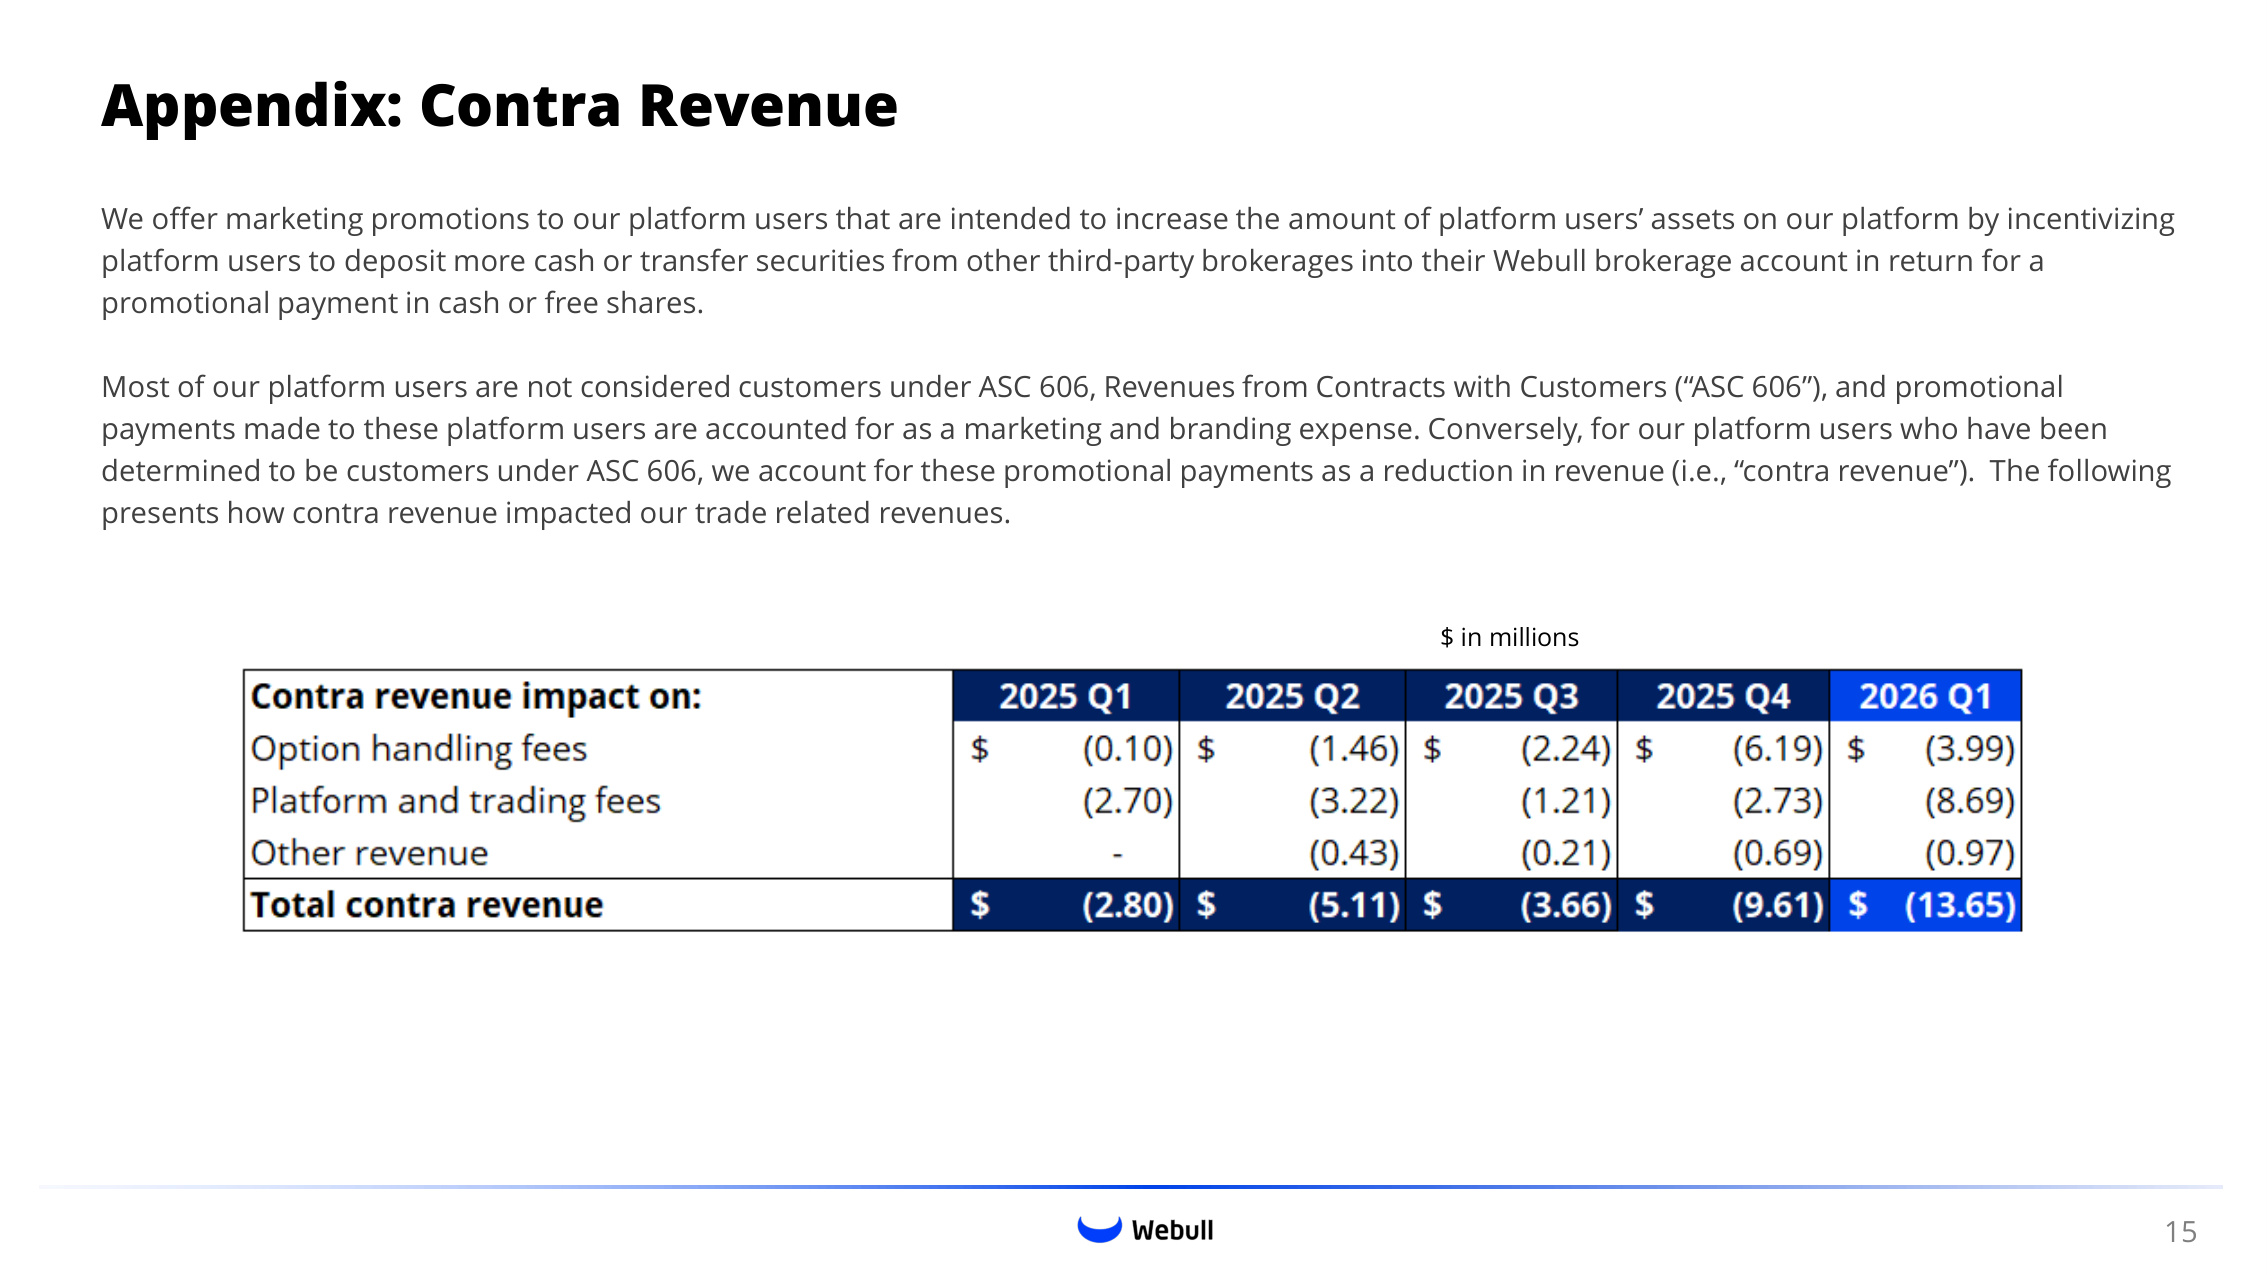
Appendix: Contra Revenue 15 We offer marketing promotions to our platform users that are intended to increase the amount of platform users' assets on our platform by incentivizing platform users to deposit more cash or transfer securities from other third-party brokerages into their Webull brokerage account in return for a promotional payment in cash or free shares. Most of our platform users are not considered customers under ASC 606, Revenues from Contracts with Customers ("ASC 606"), and promotional payments made to these platform users are accounted for as a marketing and branding expense. Conversely, for our platform users who have been determined to be customers under ASC 606, we account for these promotional payments as a reduction in revenue (i.e., "contra revenue"). The following presents how contra revenue impacted our trade related revenues. $ in millions
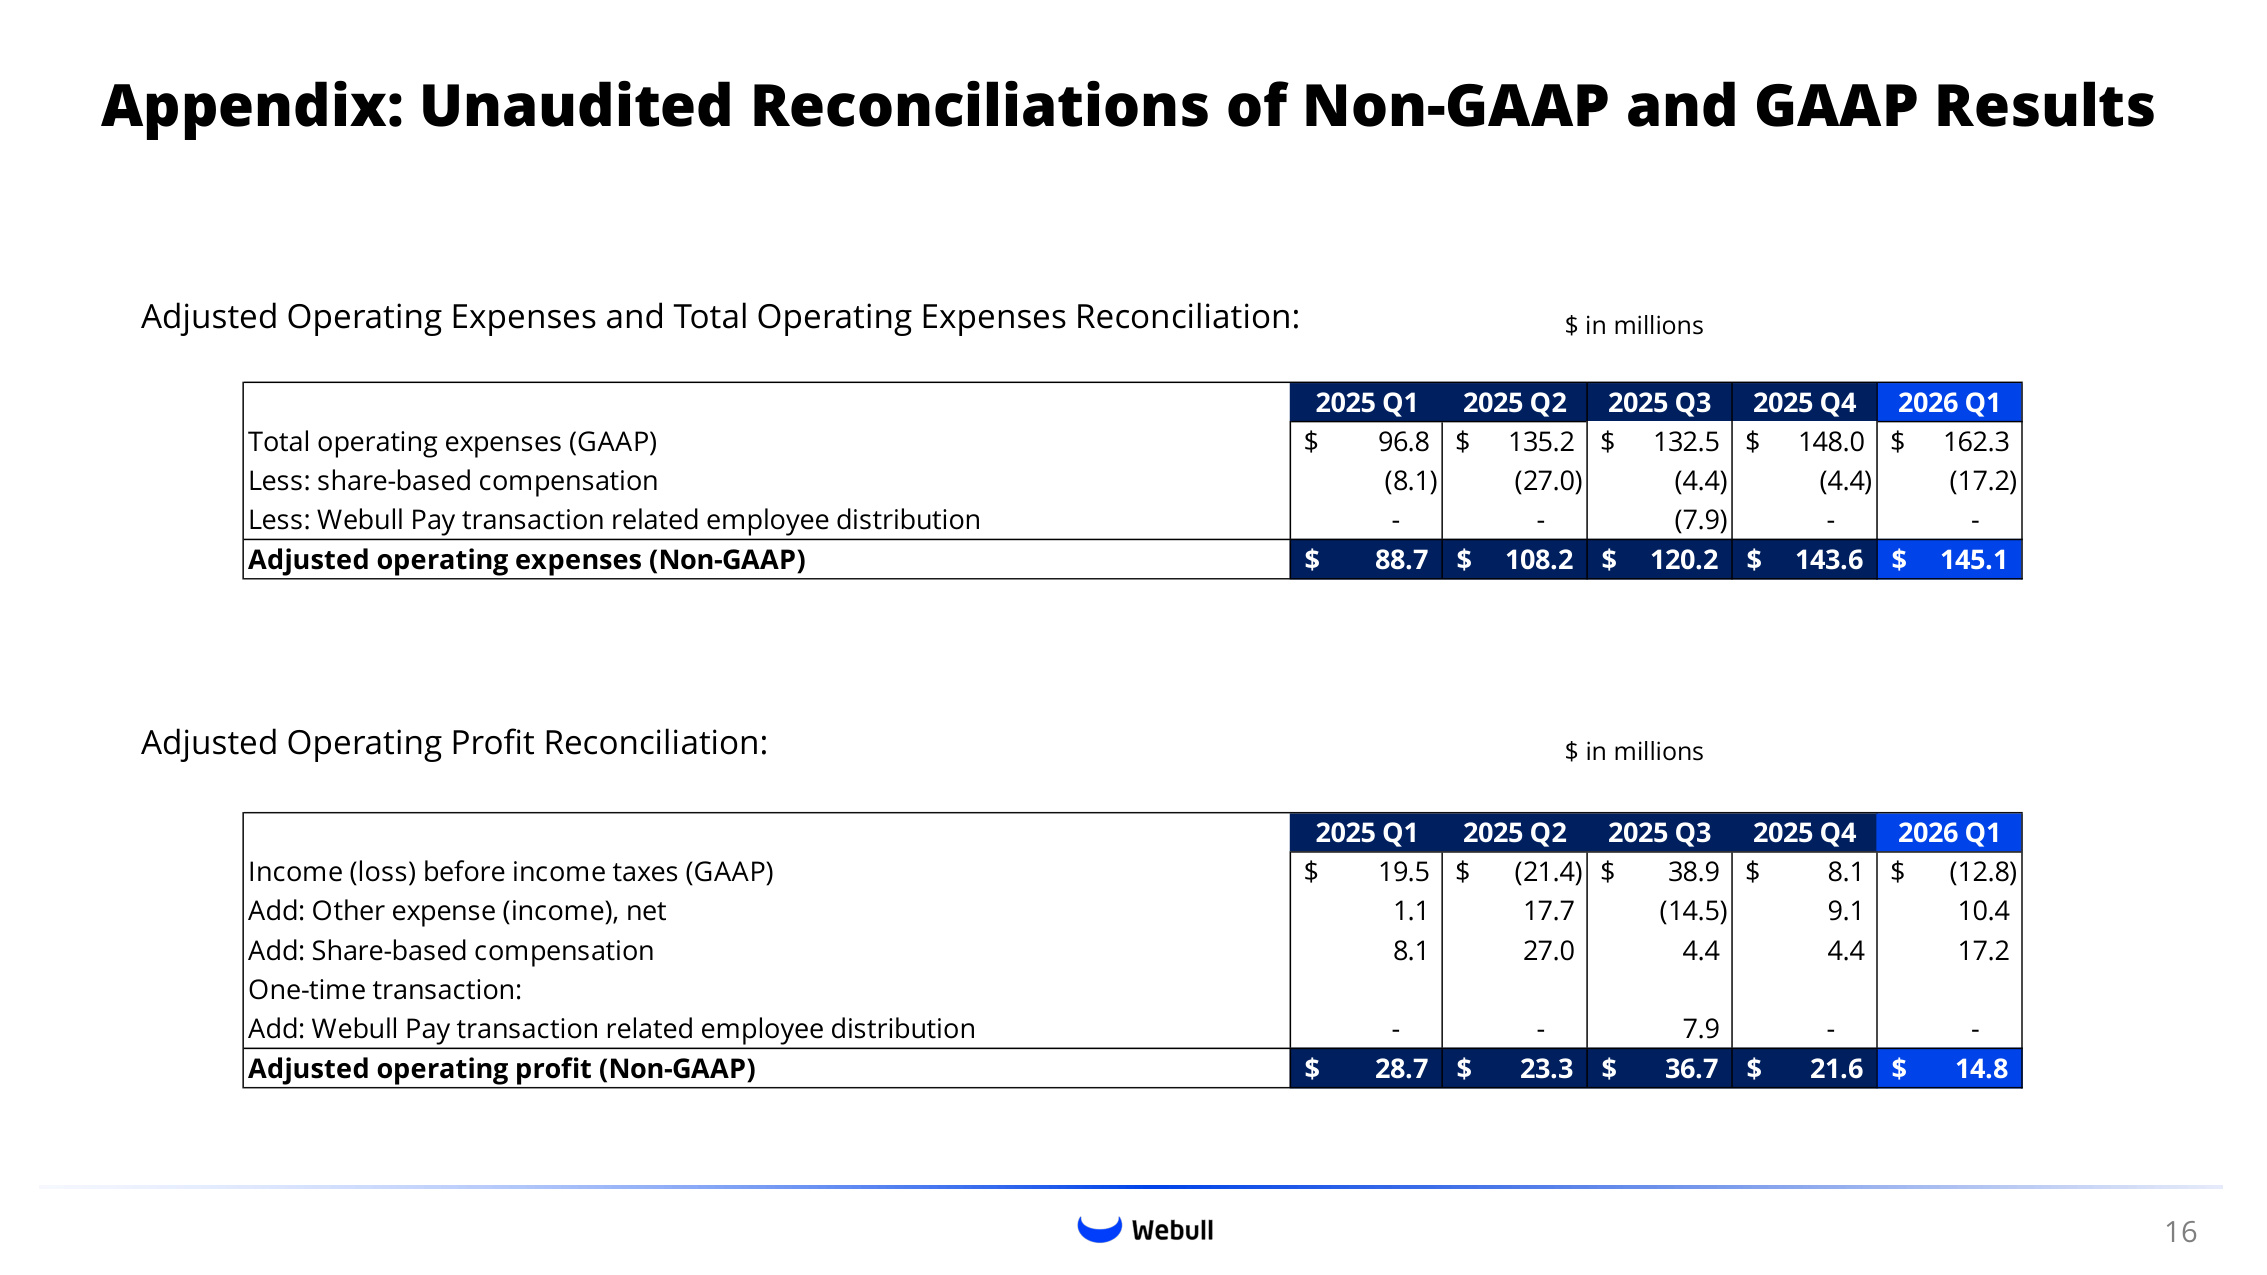
Appendix: Unaudited Reconciliations of Non-GAAP and GAAP Results Adjusted Operating Expenses and Total Operating Expenses Reconciliation: Adjusted Operating Profit Reconciliation: $ in millions $ in millions 16 2025 Q1 2025 Q2 2025 Q3 2025 Q4 2026 Q1 Total operating expenses (GAAP) 96.8 $ 135.2 $ 132.5 $ 148.0 $ 162.3 $ Less: share-based compensation (8.1) (27.0) (4.4) (4.4) (17.2) Less: Webull Pay transaction related employee distribution - - (7.9) - - Adjusted operating expenses (Non-GAAP) 88.7 $ 108.2 $ 120.2 $ 143.6 $ 145.1 $ 2025 Q1 2025 Q2 2025 Q3 2025 Q4 2026 Q1 Income (loss) before income taxes (GAAP) 19.5 $ (21.4) $ 38.9 $ 8.1 $ (12.8) $ Add: Other expense (income), net 1.1 17.7 (14.5) 9.1 10.4 Add: Share-based compensation 8.1 27.0 4.4 4.4 17.2 One-time transaction: Add: Webull Pay transaction related employee distribution - - 7.9 - - Adjusted operating profit (Non-GAAP) 28.7 $ 23.3 $ 36.7 $ 21.6 $ 14.8 $
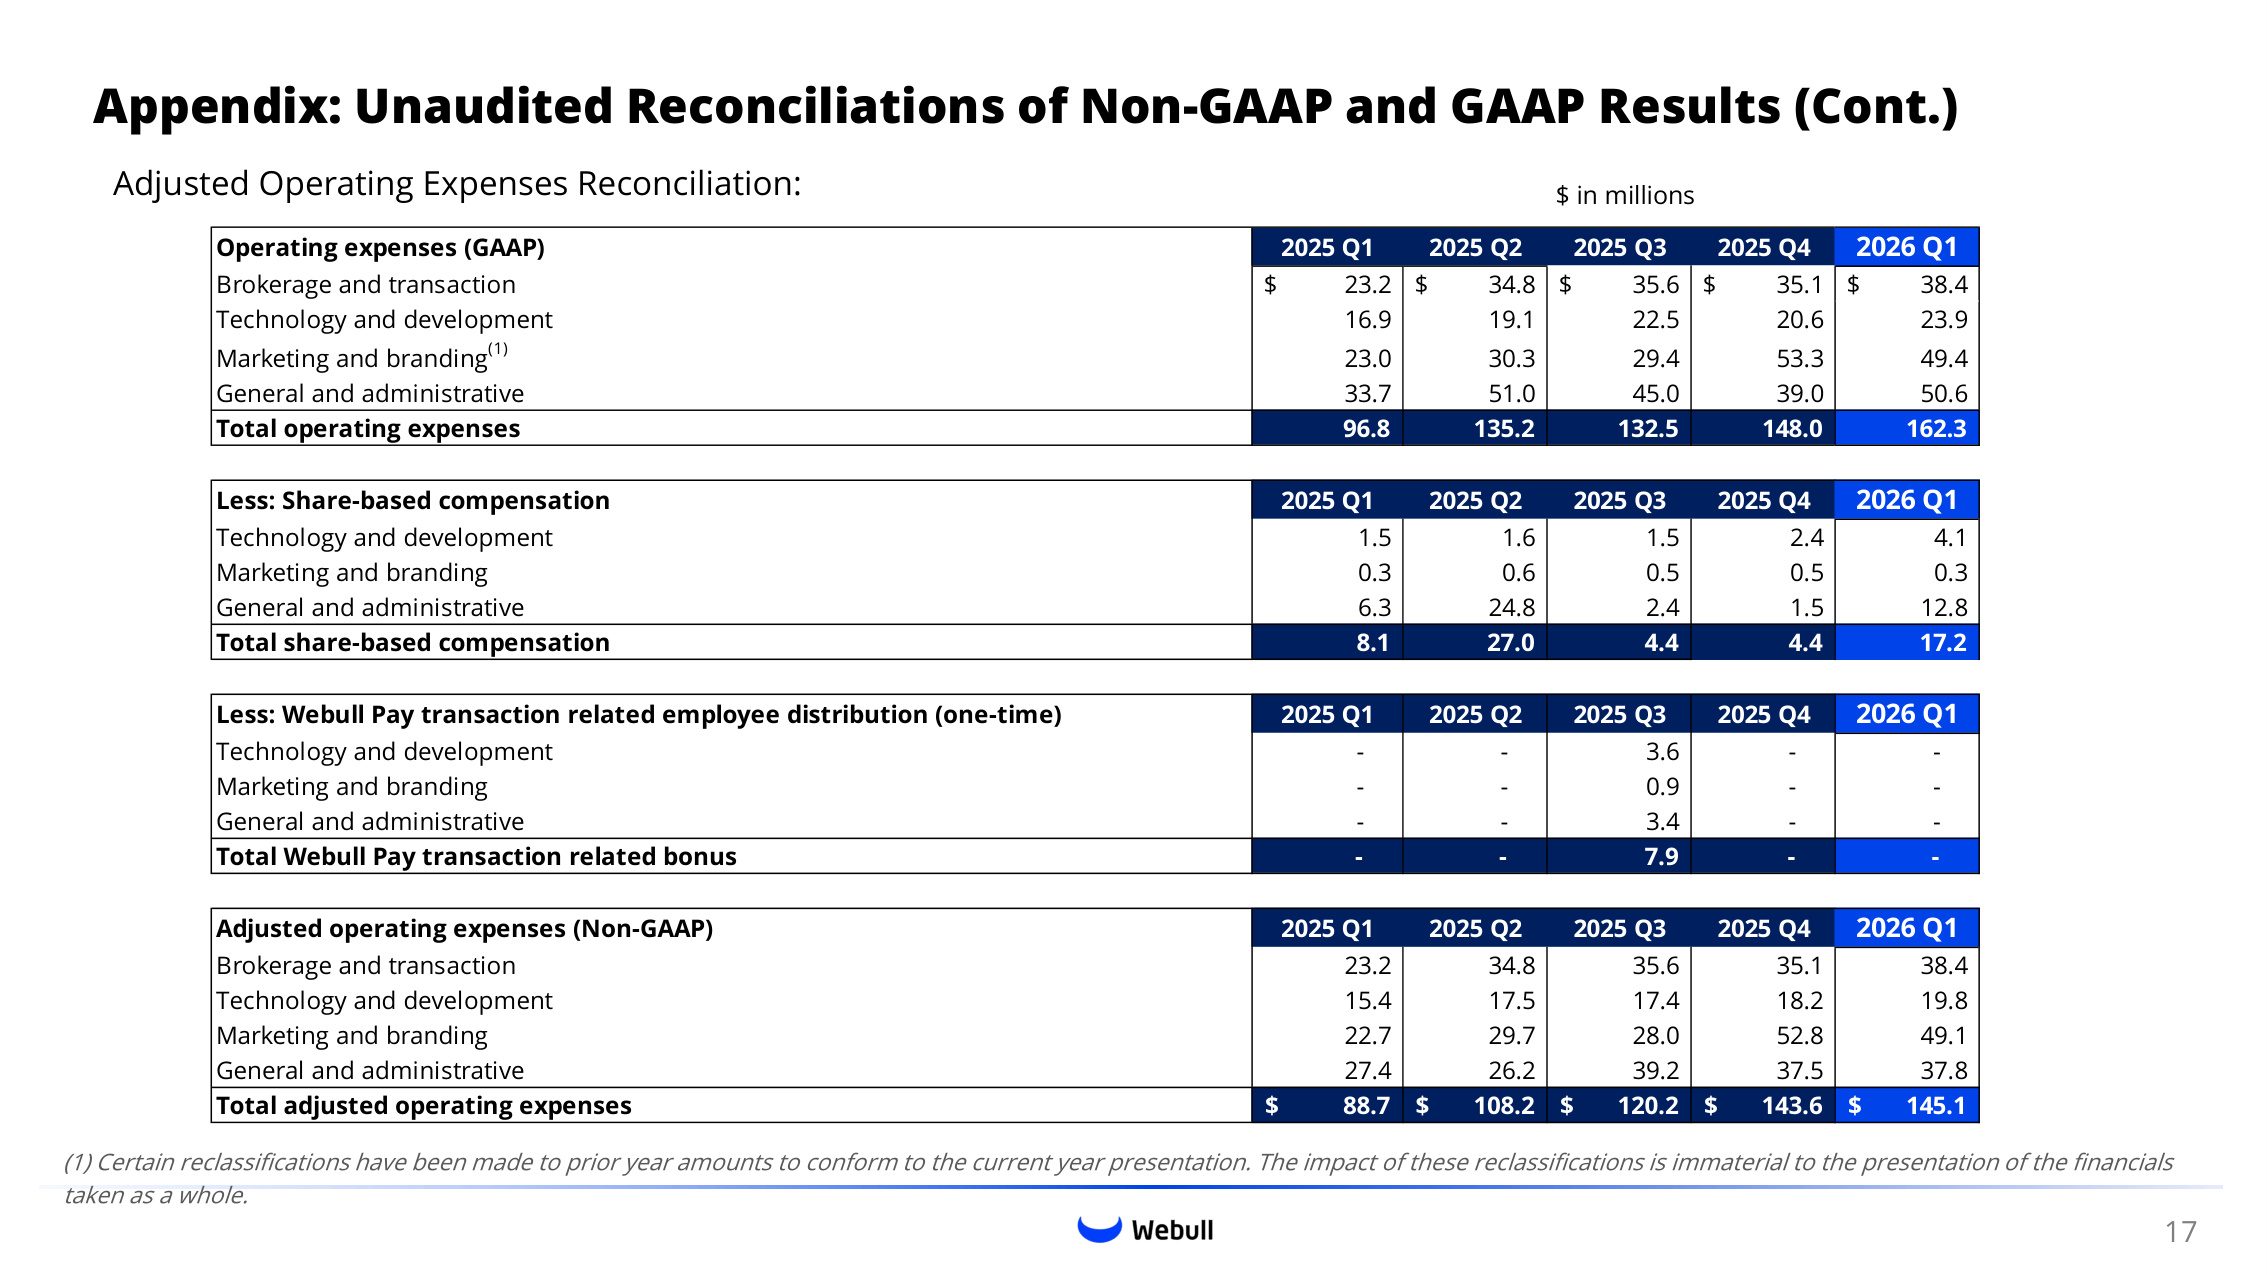
Appendix: Unaudited Reconciliations of Non-GAAP and GAAP Results (Cont.) Adjusted Operating Expenses Reconciliation: (1) Certain reclassifications have been made to prior year amounts to conform to the current year presentation. The impact of these reclassifications is immaterial to the presentation of the financials taken as a whole. $ in millions 17 Operating expenses (GAAP) 2025 Q1 2025 Q2 2025 Q3 2025 Q4 2026 Q1 Brokerage and transaction 23.2 $ 34.8 $ 35.6 $ 35.1 $ 38.4 $ Technology and development 16.9 19.1 22.5 20.6 23.9 Marketing and branding(1) 23.0 30.3 29.4 53.3 49.4 General and administrative 33.7 51.0 45.0 39.0 50.6 Total operating expenses 96.8 135.2 132.5 148.0 162.3 Less: Share-based compensation 2025 Q1 2025 Q2 2025 Q3 2025 Q4 2026 Q1 Technology and development 1.5 1.6 1.5 2.4 4.1 Marketing and branding 0.3 0.6 0.5 0.5 0.3 General and administrative 6.3 24.8 2.4 1.5 12.8 Total share-based compensation 8.1 27.0 4.4 4.4 17.2 Less: Webull Pay transaction related employee distribution (one-time) 2025 Q1 2025 Q2 2025 Q3 2025 Q4 2026 Q1 Technology and development - - 3.6 - - Marketing and branding - - 0.9 - - General and administrative - - 3.4 - - Total Webull Pay transaction related bonus - - 7.9 - - Adjusted operating expenses (Non-GAAP) 2025 Q1 2025 Q2 2025 Q3 2025 Q4 2026 Q1 Brokerage and transaction 23.2 34.8 35.6 35.1 38.4 Technology and development 15.4 17.5 17.4 18.2 19.8 Marketing and branding 22.7 29.7 28.0 52.8 49.1 General and administrative 27.4 26.2 39.2 37.5 37.8 Total adjusted operating expenses 88.7 $ 108.2 $ 120.2 $ 143.6 $ 145.1 $
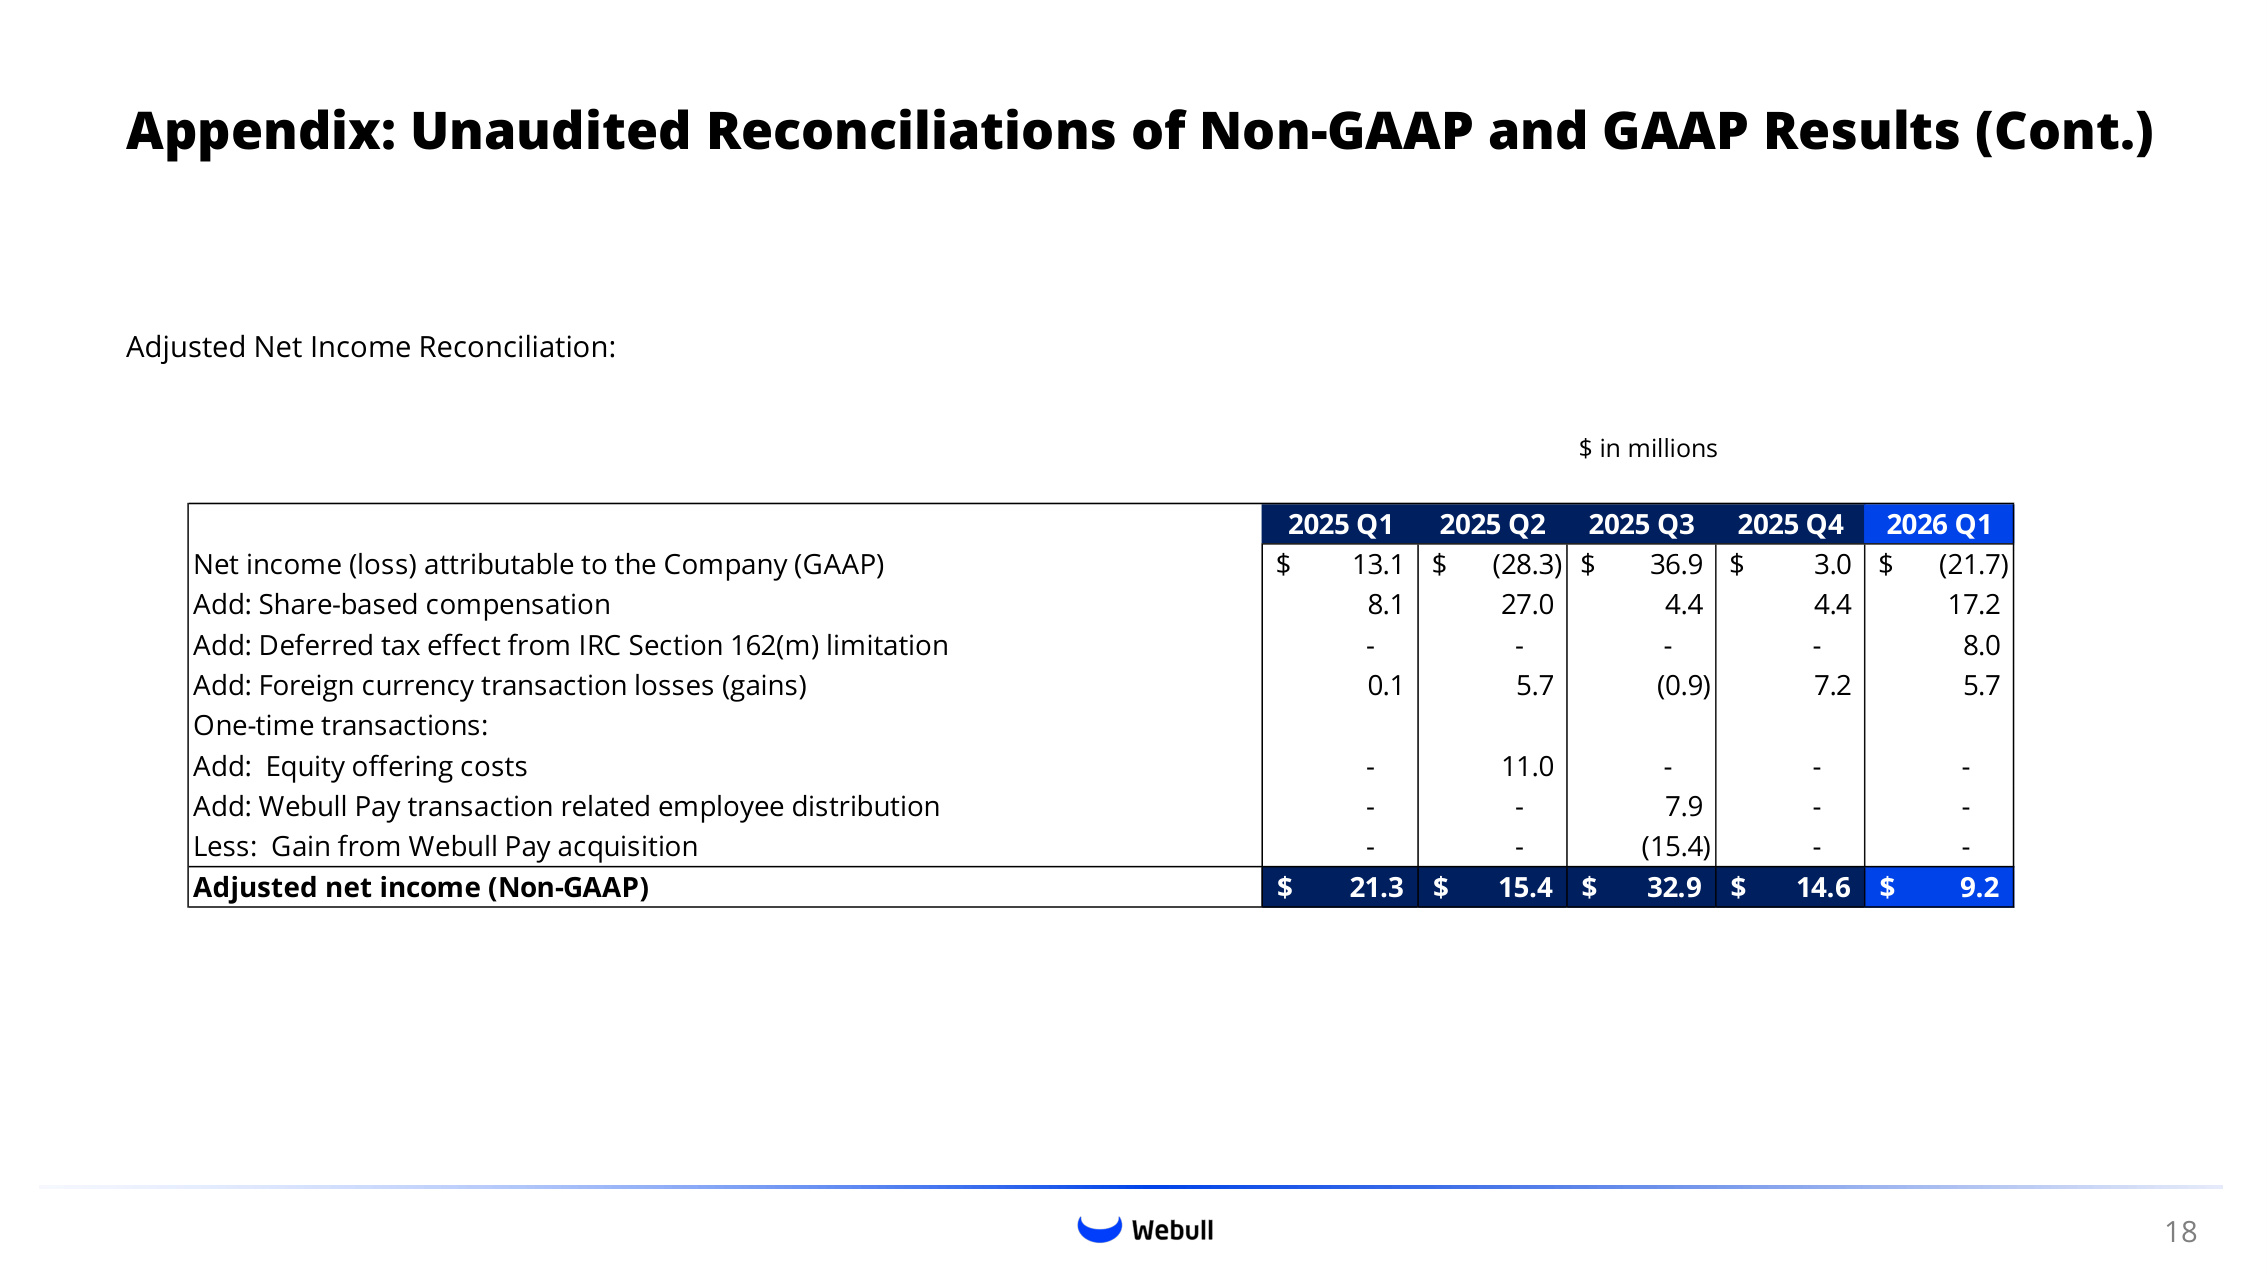
Appendix: Unaudited Reconciliations of Non-GAAP and GAAP Results (Cont.) Adjusted Net Income Reconciliation: $ in millions 18 2025 Q1 2025 Q2 2025 Q3 2025 Q4 2026 Q1 Net income (loss) attributable to the Company (GAAP) 13.1 $ (28.3) $ 36.9 $ 3.0 $ (21.7) $ Add: Share-based compensation 8.1 27.0 4.4 4.4 17.2 Add: Deferred tax effect from IRC Section 162(m) limitation - - - - 8.0 Add: Foreign currency transaction losses (gains) 0.1 5.7 (0.9) 7.2 5.7 One-time transactions: Add: Equity offering costs - 11.0 - - - Add: Webull Pay transaction related employee distribution - - 7.9 - - Less: Gain from Webull Pay acquisition - - (15.4) - - Adjusted net income (Non-GAAP) 21.3 $ 15.4 $ 32.9 $ 14.6 $ 9.2 $