Shareholder Report
Sep. 30, 2025
USD ($)
Holding
Shareholder Report |
12 Months Ended | ||||||||||||||||||||||||||||||||||||||||||||
|---|---|---|---|---|---|---|---|---|---|---|---|---|---|---|---|---|---|---|---|---|---|---|---|---|---|---|---|---|---|---|---|---|---|---|---|---|---|---|---|---|---|---|---|---|---|
|
Sep. 30, 2025
USD ($)
Holding
| |||||||||||||||||||||||||||||||||||||||||||||
| Shareholder Report [Line Items] | |||||||||||||||||||||||||||||||||||||||||||||
| Document Type | N-CSR | ||||||||||||||||||||||||||||||||||||||||||||
| Amendment Flag | false | ||||||||||||||||||||||||||||||||||||||||||||
| Registrant Name | Advisors' Inner Circle Fund III | ||||||||||||||||||||||||||||||||||||||||||||
| Entity Central Index Key | 0001593547 | ||||||||||||||||||||||||||||||||||||||||||||
| Entity Investment Company Type | N-1A | ||||||||||||||||||||||||||||||||||||||||||||
| Document Period End Date | Sep. 30, 2025 | ||||||||||||||||||||||||||||||||||||||||||||
| C000208376 | |||||||||||||||||||||||||||||||||||||||||||||
| Shareholder Report [Line Items] | |||||||||||||||||||||||||||||||||||||||||||||
| Fund Name | Nicholas Partners Small Cap Growth Fund | ||||||||||||||||||||||||||||||||||||||||||||
| Class Name | Institutional Shares | ||||||||||||||||||||||||||||||||||||||||||||
| Trading Symbol | NPSGX | ||||||||||||||||||||||||||||||||||||||||||||
| Annual or Semi-Annual Statement [Text Block] | This annual shareholder report contains important information about Institutional Shares of the Nicholas Partners Small Cap Growth Fund (the "Fund") for the period from October 1, 2024 to September 30, 2025. | ||||||||||||||||||||||||||||||||||||||||||||
| Additional Information [Text Block] | You can find additional information about the Fund at https://www.nicfunds.com/. You can also request this information by contacting us at 1-833-810-7345. | ||||||||||||||||||||||||||||||||||||||||||||
| Additional Information Phone Number | 1-833-810-7345 | ||||||||||||||||||||||||||||||||||||||||||||
| Additional Information Website | https://www.nicfunds.com/ | ||||||||||||||||||||||||||||||||||||||||||||
| Expenses [Text Block] | What were the Fund costs for the last year?(based on a hypothetical $10,000 investment)
|
||||||||||||||||||||||||||||||||||||||||||||
| Expenses Paid, Amount | $ 106 | ||||||||||||||||||||||||||||||||||||||||||||
| Expense Ratio, Percent | 0.99% | ||||||||||||||||||||||||||||||||||||||||||||
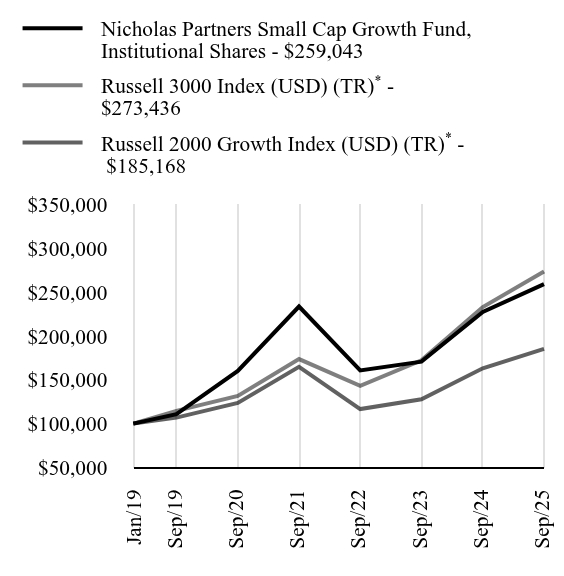
| Factors Affecting Performance [Text Block] | How did the Fund perform in the last year?Market Summary: : The twelve months ended September 30, 2025, reflected a constructive environment for small-cap equities. After a volatile start to the year—driven by renewed tariff concerns and mixed economic data—markets strengthened as inflation moderated and monetary policy turned more supportive. The Federal Reserve lowered rates by 50 basis points in 3Q24, followed by a 25-basis-point cut in December and another in 3Q25 after pausing earlier in the year. These moves, combined with steady employment and resilient consumer spending, created what many described as a “Goldilocks” backdrop—growth that was positive but not inflationary.The Russell 2000 Growth Index gained +13.6%, as participation broadened beyond large-cap technology into cyclical sectors such as Industrials and Financials. While sentiment improved, investors remained attentive to potential headwinds from rising input costs and tariff-related pressures that could weigh on margins in coming quarters. Fund Performance: For the fiscal year, the Nicholas Partners Small Cap Growth Fund returned +14.0% (net) versus +13.6% for the benchmark. Industrials contributed most, supported by holdings aligned with reindustrialization, automation, and defense modernization, while Healthcare benefited from biotechnology and MedTech companies with identifiable catalysts. Energy added through exposure to nuclear-related and alternative-power opportunities. Technology advanced in absolute terms but modestly trailed the benchmark as speculative software and early-stage AI names outperformed the Fund’s emphasis on quality, profitable businesses. Overall, results were driven primarily by stock selection in Industrials and Healthcare, with incremental contribution from Technology exposure tied to AI infrastructure and data connectivity, while Consumer and Real Estate holdings modestly detracted. Positioning and Outlook: Throughout the fiscal year, the Fund’s positioning evolved to capture multi-year growth themes shaped by AI infrastructure buildout, grid modernization, and rising digital-era power demand—areas the team views as durable, secular opportunities.
Industrials increased to roughly 30%, emphasizing automation, defense, and power-grid modernization; Healthcare remained near 20%, focused on biotechnology and MedTech innovators; Technology held close to 20%, anchored in semiconductors, electrical components, and AI-infrastructure enablers; and Energy modestly increased through exposure to nuclear fuel and power-reliability investments. The Fund remained fully invested, maintaining meaningful off-benchmark exposure consistent with its benchmark-aware but not benchmark-constrained approach.
The team believes the environment for small-cap equities remains favorable as inflation pressures ease and monetary policy turns more supportive. Credit spreads near decade lows indicate market confidence in the economic outlook and corporate balance-sheet strength, while fundamentals are regaining influence amid accelerating small-cap earnings growth and valuations that remain near historical lows. Against this backdrop, the team continues to see opportunities in:
The Fund continues to apply Nicholas Partners’ bottom-up, research-driven process, focusing on companies undergoing positive change, with attention to valuation, liquidity, and risk management. |
||||||||||||||||||||||||||||||||||||||||||||
| Performance Past Does Not Indicate Future [Text] | Past performance is not indicative of future performance. | ||||||||||||||||||||||||||||||||||||||||||||
| Line Graph [Table Text Block] |
|
||||||||||||||||||||||||||||||||||||||||||||
| Average Annual Return [Table Text Block] |
|
||||||||||||||||||||||||||||||||||||||||||||
| No Deduction of Taxes [Text Block] | The table and graph presented above do not reflect the deduction of taxes a shareholder would pay on Fund distributions or the redemption of Fund shares. | ||||||||||||||||||||||||||||||||||||||||||||
| AssetsNet | $ 133,159,729 | ||||||||||||||||||||||||||||||||||||||||||||
| Holdings Count | Holding | 83 | ||||||||||||||||||||||||||||||||||||||||||||
| Advisory Fees Paid, Amount | $ 806,366 | ||||||||||||||||||||||||||||||||||||||||||||
| InvestmentCompanyPortfolioTurnover | 147.00% | ||||||||||||||||||||||||||||||||||||||||||||
| Additional Fund Statistics [Text Block] | Key Fund Statistics as of September 30, 2025
|
||||||||||||||||||||||||||||||||||||||||||||
| Holdings [Text Block] | Asset/Sector WeightingsFootnote Reference*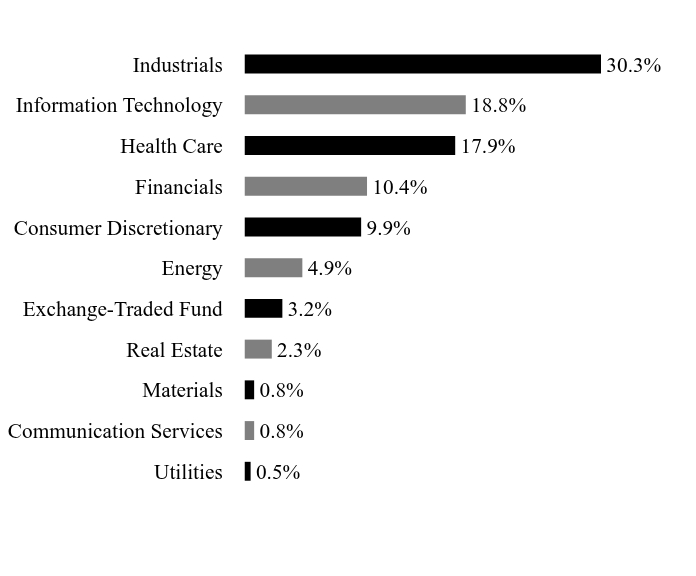
|
||||||||||||||||||||||||||||||||||||||||||||
| Largest Holdings [Text Block] | Top Ten Holdings
|
||||||||||||||||||||||||||||||||||||||||||||
| Material Fund Change [Text Block] | Material Fund ChangesThere were no material changes during the reporting period. |
||||||||||||||||||||||||||||||||||||||||||||
| Updated Prospectus Phone Number | 1-833-810-7345 | ||||||||||||||||||||||||||||||||||||||||||||
| Updated Prospectus Web Address | https://www.nicfunds.com/ |
| X | ||||||||||
- Definition Boolean flag that is true when the XBRL content amends previously-filed or accepted submission. No definition available.
|
| X | ||||||||||
- Definition For the EDGAR submission types of Form 8-K: the date of the report, the date of the earliest event reported; for the EDGAR submission types of Form N-1A: the filing date; for all other submission types: the end of the reporting or transition period. The format of the date is YYYY-MM-DD. No definition available.
|
| X | ||||||||||
- Definition The type of document being provided (such as 10-K, 10-Q, 485BPOS, etc). The document type is limited to the same value as the supporting SEC submission type, or the word 'Other'. No definition available.
|
| X | ||||||||||
- Definition A unique 10-digit SEC-issued value to identify entities that have filed disclosures with the SEC. It is commonly abbreviated as CIK. Reference 1: http://www.xbrl.org/2003/role/presentationRef
|
| X | ||||||||||
- Definition One of: N-1A (Mutual Fund), N-1 (Open-End Separate Account with No Variable Annuities), N-2 (Closed-End Investment Company), N-3 (Separate Account Registered as Open-End Management Investment Company), N-4 (Variable Annuity UIT Separate Account), N-5 (Small Business Investment Company), N-6 (Variable Life UIT Separate Account), S-1 or S-3 (Face Amount Certificate Company), S-6 (UIT, Non-Insurance Product). Reference 1: http://www.xbrl.org/2003/role/presentationRef
|
| X | ||||||||||
- Definition The exact name of the entity filing the report as specified in its charter, which is required by forms filed with the SEC. Reference 1: http://www.xbrl.org/2003/role/presentationRef
|
| X | ||||||||||
- Definition Trading symbol of an instrument as listed on an exchange. No definition available.
|
| X | ||||||||||
- References Reference 1: http://www.xbrl.org/2003/role/presentationRef
|
| X | ||||||||||
- References Reference 1: http://www.xbrl.org/2003/role/presentationRef
|
| X | ||||||||||
- References Reference 1: http://www.xbrl.org/2003/role/presentationRef
|
| X | ||||||||||
- References Reference 1: http://www.xbrl.org/2003/role/presentationRef
|
| X | ||||||||||
- References Reference 1: http://www.xbrl.org/2003/role/presentationRef
|
| X | ||||||||||
- References Reference 1: http://www.xbrl.org/2003/role/presentationRef
|
| X | ||||||||||
- References Reference 1: http://www.xbrl.org/2003/role/presentationRef
|
| X | ||||||||||
- References Reference 1: http://www.xbrl.org/2003/role/presentationRef
|
| X | ||||||||||
- References Reference 1: http://www.xbrl.org/2003/role/presentationRef
|
| X | ||||||||||
- References Reference 1: http://www.xbrl.org/2003/role/presentationRef
|
| X | ||||||||||
- References Reference 1: http://www.xbrl.org/2003/role/presentationRef
|
| X | ||||||||||
- References Reference 1: http://www.xbrl.org/2003/role/presentationRef
|
| X | ||||||||||
- References Reference 1: http://www.xbrl.org/2003/role/presentationRef
|
| X | ||||||||||
- References Reference 1: http://www.xbrl.org/2003/role/presentationRef
|
| X | ||||||||||
- References Reference 1: http://www.xbrl.org/2003/role/presentationRef
|
| X | ||||||||||
- References Reference 1: http://www.xbrl.org/2003/role/presentationRef
|
| X | ||||||||||
- References Reference 1: http://www.xbrl.org/2003/role/presentationRef
|
| X | ||||||||||
- References Reference 1: http://www.xbrl.org/2003/role/presentationRef
|
| X | ||||||||||
- References Reference 1: http://www.xbrl.org/2003/role/presentationRef
|
| X | ||||||||||
- References Reference 1: http://www.xbrl.org/2003/role/presentationRef
|
| X | ||||||||||
- References Reference 1: http://www.xbrl.org/2003/role/presentationRef
|
| X | ||||||||||
- References Reference 1: http://www.xbrl.org/2003/role/presentationRef
|
| X | ||||||||||
- References Reference 1: http://www.xbrl.org/2003/role/presentationRef
|
| X | ||||||||||
- Definition Amount of net assets (liabilities). Reference 1: http://fasb.org/us-gaap/role/ref/legacyRef
|
| X | ||||||||||
- Definition Percentage of lesser of purchase or sale of portfolio securities to average value of portfolio securities owned. Reference 1: http://www.xbrl.org/2009/role/commonPracticeRef
|
| X | ||||||||||
- Details
|