Shareholder Report
|
12 Months Ended |
|
Sep. 30, 2025
USD ($)
Holding
|
|---|
| Shareholder Report [Line Items] |
|
| Document Type |
N-CSR
|
| Amendment Flag |
false
|
| Registrant Name |
Advisors' Inner Circle Fund III
|
| Entity Central Index Key |
0001593547
|
| Entity Investment Company Type |
N-1A
|
| Document Period End Date |
Sep. 30, 2025
|
| C000254727 |
|
| Shareholder Report [Line Items] |
|
| Fund Name |
Brown Advisory Flexible Equity ETF
|
| Class Name |
Brown Advisory Flexible Equity ETF
|
| Trading Symbol |
BAFE
|
| Security Exchange Name |
NASDAQ
|
| Annual or Semi-Annual Statement [Text Block] |
This annual shareholder report contains important information about the Brown Advisory Flexible Equity ETF (the "Fund") for the period from November 15, 2024 (commencement of operations) to September 30, 2025.
|
| Additional Information [Text Block] |
You can find additional information about the Fund at https://brownadvisory.com/etf/flexible-equity-etf. You can also request this information by contacting us at 1-877-876-6383.
|
| Additional Information Phone Number |
1-877-876-6383
|
| Additional Information Website |
https://brownadvisory.com/etf/flexible-equity-etf
|
| Expenses [Text Block] |
What were the Fund costs for the period?(based on a hypothetical $10,000 investment) Fund Name | Costs of a $10,000 investmentFootnote Reference* | Costs paid as a percentage of a $10,000 investment |
|---|
Brown Advisory Flexible Equity ETF | $49 | 0.54% |
|---|
| Footnote | Description | Footnote* | Costs shown not annualized. If the Fund had been open for the full fiscal year, costs shown would have been higher for the period ended. |
|
| Expenses Paid, Amount |
$ 49
|
| Expense Ratio, Percent |
0.54%
|
| Performance Past Does Not Indicate Future [Text] |
Past performance is not indicative of future performance.
|
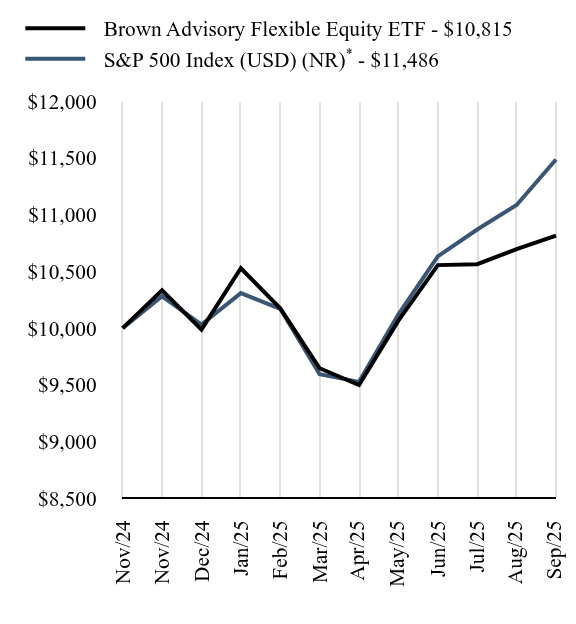
| Line Graph [Table Text Block] |
| Brown Advisory Flexible Equity ETF | S&P 500 Index (USD) (NR)Footnote Reference* |
|---|
Nov/24 | $10,000 | $10,000 |
|---|
Nov/24 | $10,332 | $10,280 |
|---|
Dec/24 | $9,986 | $10,031 |
|---|
Jan/25 | $10,527 | $10,308 |
|---|
Feb/25 | $10,174 | $10,170 |
|---|
Mar/25 | $9,646 | $9,593 |
|---|
Apr/25 | $9,498 | $9,526 |
|---|
May/25 | $10,066 | $10,121 |
|---|
Jun/25 | $10,555 | $10,632 |
|---|
Jul/25 | $10,563 | $10,869 |
|---|
Aug/25 | $10,695 | $11,085 |
|---|
Sep/25 | $10,815 | $11,486 |
|---|
|
| Average Annual Return [Table Text Block] |
Fund/Index Name | Cumulative
Since
Inception |
|---|
Brown Advisory Flexible Equity ETF | 8.15% |
|---|
S&P 500 Index (USD) (NR)Footnote Reference* | 14.86% |
|---|
|
| No Deduction of Taxes [Text Block] |
The table and graph presented above do not reflect the deduction of taxes a shareholder would pay on Fund distributions or the redemption of Fund shares.
|
| Material Change Description [Text Block] |
How did the Fund perform in the period?HOW DID THE FUND PERFORM LAST YEAR AND WHAT AFFECTED ITS PERFORMANCE? Since the ETF’s inception through September 30, 2025, the Fund lagged its benchmark, the S&P 500® Index. While the market delivered strong absolute returns over the period, the journey from start to finish was far from smooth. Notably, the S&P 500 experienced a sharp 19% drawdown from its February high to its April 8th low, driven largely by fears of an all-out trade war. The Index, however, recovered from its April low and finished the period near an alltime high. WHAT FACTORS INFLUENCED PERFORMANCE Stock selection was the primary driver of relative performance. The performance of the Fund was positively driven by the Consumer Discretionary, Communication Services and Energy sectors. Top individual contributors included: Microsoft Corporation, Taiwan Semiconductor Manufacturing, Meta Platforms, Amer Sports and Alphabet Inc. The Financials sector was the largest detractor, with Fiserv, Inc. and KKR & Co. contributing most negatively to returns within the sector. POSITIONING The Fund’s Energy sector exposure declined during the period following the sale of Baker Hughes. The Health Care weighting decreased due to both sector underperformance and the elimination of Agilent Technologies. In Real Estate, the elimination of SBA Communications reduced the sector allocation to zero. Information Technology exposure increased, driven by strong sector performance and the addition of KLA Corporation and Marvell Technology. |
| AssetsNet |
$ 1,444,706,000
|
| Holdings Count | Holding |
45
|
| Advisory Fees Paid, Amount |
$ 4,628
|
| InvestmentCompanyPortfolioTurnover |
14.00%
|
| Additional Fund Statistics [Text Block] |
Key Fund Statistics as of September 30, 2025 | Total Net Assets (000's) | Number of Holdings | Total Advisory Fees Paid (000's) | Portfolio Turnover Rate |
|---|
| $1,444,706 | 45 | $4,628 | 14% |
|---|
|
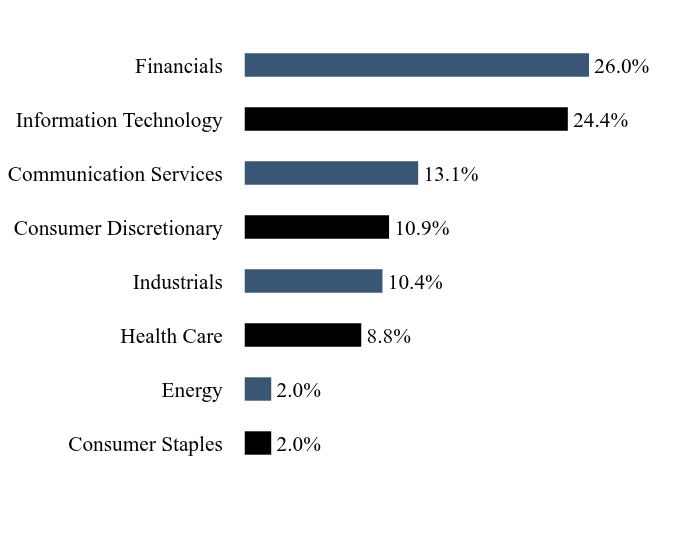
| Holdings [Text Block] |
Sector WeightingsFootnote Reference*Value | Value |
|---|
Consumer Staples | 2.0% | Energy | 2.0% | Health Care | 8.8% | Industrials | 10.4% | Consumer Discretionary | 10.9% | Communication Services | 13.1% | Information Technology | 24.4% | Financials | 26.0% |
| Footnote | Description | Footnote* | Percentages are calculated based on total net assets. |
|
| Largest Holdings [Text Block] |
Holding Name | | | Percentage of
Total Net Assets |
|---|
Microsoft | | | 8.0% | Meta Platforms, Cl A | | | 5.5% | Taiwan Semiconductor Manufacturing ADR | | | 4.9% | Visa, Cl A | | | 4.4% | Amazon.com | | | 4.3% | Mastercard, Cl A | | | 4.2% | KKR | | | 3.8% | Berkshire Hathaway, Cl B | | | 3.6% | Alphabet, Cl A | | | 3.3% | Alphabet, Cl C | | | 3.1% |
|
| Material Fund Change [Text Block] |
There were no material changes during the reporting period. |
| Updated Prospectus Phone Number |
1-877-876-6383
|
| Updated Prospectus Web Address |
https://brownadvisory.com/etf/flexible-equity-etf
|
| C000259983 |
|
| Shareholder Report [Line Items] |
|
| Fund Name |
Brown Advisory Sustainable Growth ETF
|
| Class Name |
Brown Advisory Sustainable Growth ETF
|
| Trading Symbol |
BASG
|
| Security Exchange Name |
NASDAQ
|
| Annual or Semi-Annual Statement [Text Block] |
This annual shareholder report contains important information about the Brown Advisory Sustainable Growth ETF (the "Fund") for the period from June 13, 2025 (commencement of operations) to September 30, 2025.
|
| Additional Information [Text Block] |
You can find additional information about the Fund at https://www.brownadvisory.com/etf/sustainable-growth-etf. You can also request this information by contacting us at 1-877-876-6383.
|
| Additional Information Phone Number |
1-877-876-6383
|
| Additional Information Website |
https://www.brownadvisory.com/etf/sustainable-growth-etf
|
| Expenses [Text Block] |
What were the Fund costs for the period?(based on a hypothetical $10,000 investment) Fund Name | Costs of a $10,000 investmentFootnote Reference* | Costs paid as a percentage of a $10,000 investment |
|---|
Brown Advisory Sustainable Growth ETF | $19 | 0.61% |
|---|
| Footnote | Description | Footnote* | Costs shown not annualized. If the Fund had been open for the full fiscal year, costs shown would have been higher for the period ended. |
|
| Expenses Paid, Amount |
$ 19
|
| Expense Ratio, Percent |
0.61%
|
| Performance Past Does Not Indicate Future [Text] |
Past performance is not indicative of future performance.
|
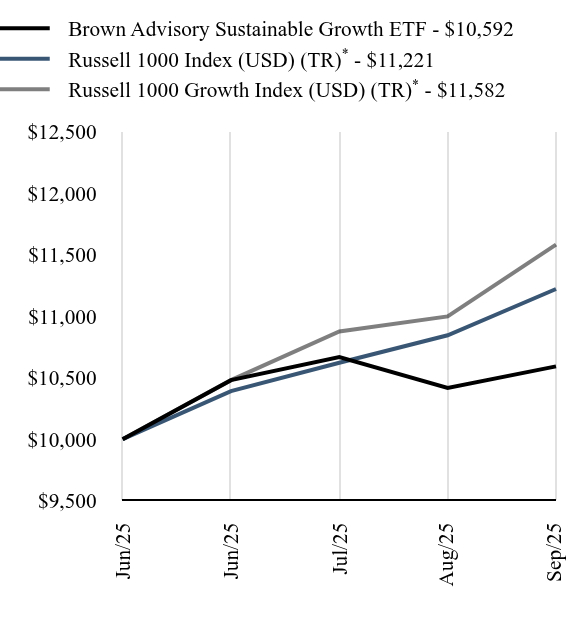
| Line Graph [Table Text Block] |
| Brown Advisory Sustainable Growth ETF | Russell 1000 Index (USD) (TR)Footnote Reference* | Russell 1000 Growth Index (USD) (TR)Footnote Reference* |
|---|
Jun/25 | $10,000 | $10,000 | $10,000 |
|---|
Jun/25 | $10,480 | $10,391 | $10,480 |
|---|
Jul/25 | $10,668 | $10,621 | $10,876 |
|---|
Aug/25 | $10,416 | $10,845 | $10,998 |
|---|
Sep/25 | $10,592 | $11,221 | $11,582 |
|---|
|
| Average Annual Return [Table Text Block] |
Fund/Index Name | Cumulative
Since
Inception |
|---|
Brown Advisory Sustainable Growth ETF | 5.92% |
|---|
Russell 1000 Index (USD) (TR)Footnote Reference* | 12.21% |
|---|
Russell 1000 Growth Index (USD) (TR)Footnote Reference* | 15.82% |
|---|
|
| No Deduction of Taxes [Text Block] |
The table and graph presented above do not reflect the deduction of taxes a shareholder would pay on Fund distributions or the redemption of Fund shares.
|
| Material Change Description [Text Block] |
How did the Fund perform in the period?HOW DID THE FUND PERFORM LAST YEAR AND WHAT AFFECTED ITS PERFORMANCE? For the period between the inception of the vehicle on 6/13/25 and 9/30/25, the Brown Advisory Large Cap Sustainable Growth ETF delivered positive returns but trailed its primary benchmark, the Russell 1000 Growth Index by a significant margin. WHAT FACTORS INFLUENCED PERFORMANCE During the period, the combined effects of a disadvantageous market environment and unfavorable stock selection led to significant underperformance for the strategy relative to the Russell 1000 Growth Index. Continuing the theme that has largely defined the market environment for the better part of the last three years, investors continued to crowd into the secular trend in artificial intelligence throughout the period, resulting in yet another extremely narrow, top-heavy, momentum-driven market. From an attribution perspective, sector positioning and stock selection had a negative effect on relative returns against the Russell 1000 Growth® Index. At the sector level, the strategy’s overweight to financials and underweight to information technology were the largest detractors, which was partially offset by positive effects of the strategy’s lack of exposure to consumer staples, real estate, and energy. Inclusive of stock selection and interaction, relative strength from our health care and semiconductor names was not enough to overcome the weakness from our consumer discretionary, financials, and software names. During the period, all six of the strategy’s semiconductor names outperformed on the strength of robust fundamental results, encouraging forward outlooks, and broader investor enthusiasm for the companies that provide the essential building blocks for the data center infrastructure needed support the growing demand for artificial intelligence solutions. Insurance was a notable area of weakness, as PGR, VRSK, and AJG all lagged during the period on concerns about rising claims costs in auto and property markets, consumer and regulatory scrutiny of increased premiums, and the impact of both dynamics on future top- and bottom-line growth. POSITIONING Consistent with the strategy’s long-standing portfolio construction philosophy, we continued to balance exposure between durable and rapid growth companies while ensuring diversification by business model, end market, and growth theme. Trading activity was also in line with our historical turnover range. In keeping with our one-in, one-out philosophy, we added three new names to the portfolio during the period – IOT, EFX, and SNOW – and exited positions in WDAY, GOOGL, and MSCI. We believe these trades represent upgrades to the portfolio that will better position the strategy for success in the quarters and years ahead. |
| AssetsNet |
$ 550,110,000
|
| Holdings Count | Holding |
35
|
| Advisory Fees Paid, Amount |
$ 754
|
| InvestmentCompanyPortfolioTurnover |
18.00%
|
| Additional Fund Statistics [Text Block] |
Key Fund Statistics as of September 30, 2025 | Total Net Assets (000's) | Number of Holdings | Total Advisory Fees Paid (000's) | Portfolio Turnover Rate |
|---|
| $550,110 | 35 | $754 | 18% |
|---|
|
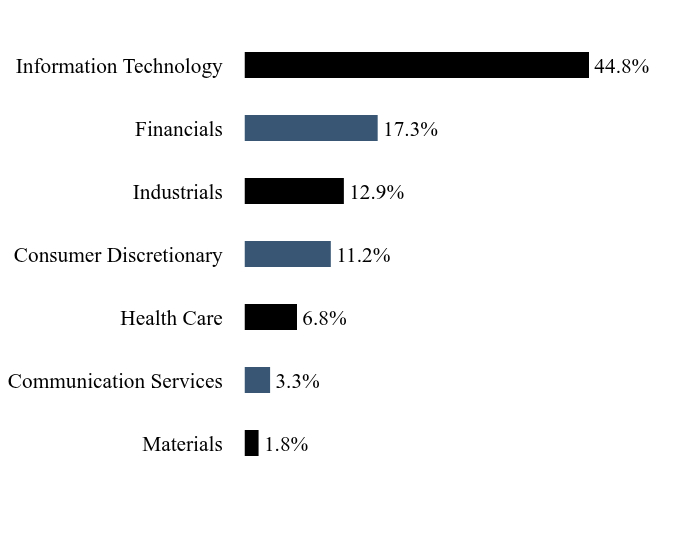
| Holdings [Text Block] |
Sector WeightingsFootnote Reference*Value | Value |
|---|
Materials | 1.8% | Communication Services | 3.3% | Health Care | 6.8% | Consumer Discretionary | 11.2% | Industrials | 12.9% | Financials | 17.3% | Information Technology | 44.8% |
| Footnote | Description | Footnote* | Percentages are calculated based on total net assets. |
|
| Largest Holdings [Text Block] |
Holding Name | | | Percentage of
Total Net Assets |
|---|
NVIDIA | | | 8.3% | Microsoft | | | 8.3% | Amazon.com | | | 7.2% | Intuit | | | 3.9% | Visa, Cl A | | | 3.8% | Taiwan Semiconductor Manufacturing ADR | | | 3.2% | Marvell Technology | | | 3.2% | Arthur J Gallagher | | | 3.2% | KKR | | | 3.0% | Monolithic Power Systems | | | 2.9% |
|
| Material Fund Change [Text Block] |
There were no material changes during the reporting period. |
| Updated Prospectus Phone Number |
1-877-876-6383
|
| Updated Prospectus Web Address |
https://www.brownadvisory.com/etf/sustainable-growth-etf
|
| C000259984 |
|
| Shareholder Report [Line Items] |
|
| Fund Name |
Brown Advisory Sustainable Value ETF
|
| Class Name |
Brown Advisory Sustainable Value ETF
|
| Trading Symbol |
BASV
|
| Security Exchange Name |
NASDAQ
|
| Annual or Semi-Annual Statement [Text Block] |
This annual shareholder report contains important information about the Brown Advisory Sustainable Value ETF (the "Fund") for the period from June 13, 2025 (commencement of operations) to September 30, 2025.
|
| Additional Information [Text Block] |
You can find additional information about the Fund at https://www.brownadvisory.com/etf/sustainable-value-etf. You can also request this information by contacting us at 1-877-876-6383.
|
| Additional Information Phone Number |
1-877-876-6383
|
| Additional Information Website |
https://www.brownadvisory.com/etf/sustainable-value-etf
|
| Expenses [Text Block] |
What were the Fund costs for the period?(based on a hypothetical $10,000 investment) Fund Name | Costs of a $10,000 investmentFootnote Reference* | Costs paid as a percentage of a $10,000 investment |
|---|
Brown Advisory Sustainable Value ETF | $22 | 0.71% |
|---|
| Footnote | Description | Footnote* | Costs shown not annualized. If the Fund had been open for the full fiscal year, costs shown would have been higher for the period ended. |
|
| Expenses Paid, Amount |
$ 22
|
| Expense Ratio, Percent |
0.71%
|
| Performance Past Does Not Indicate Future [Text] |
Past performance is not indicative of future performance.
|
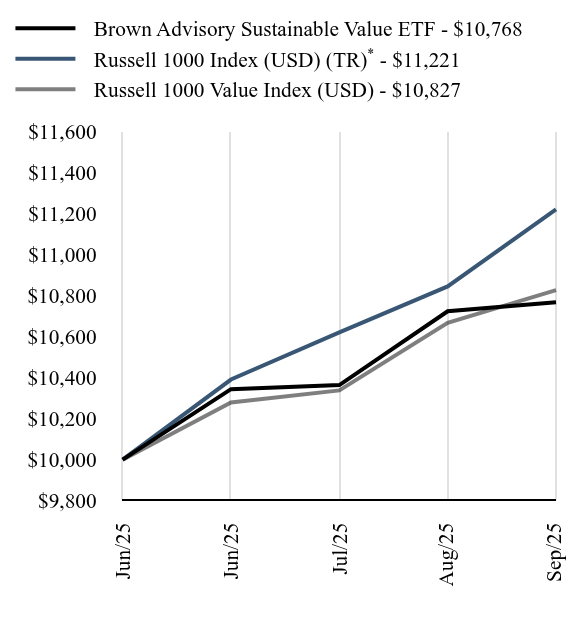
| Line Graph [Table Text Block] |
| Brown Advisory Sustainable Value ETF | Russell 1000 Index (USD) (TR)Footnote Reference* | Russell 1000 Value Index (USD) |
|---|
Jun/25 | $10,000 | $10,000 | $10,000 |
|---|
Jun/25 | $10,344 | $10,391 | $10,279 |
|---|
Jul/25 | $10,364 | $10,621 | $10,338 |
|---|
Aug/25 | $10,724 | $10,845 | $10,668 |
|---|
Sep/25 | $10,768 | $11,221 | $10,827 |
|---|
|
| Average Annual Return [Table Text Block] |
Fund/Index Name | Cumulative
Since
Inception |
|---|
Brown Advisory Sustainable Value ETF | 7.68% |
|---|
Russell 1000 Index (USD) (TR)Footnote Reference* | 12.21% |
|---|
Russell 1000 Value Index (USD) | 8.27% |
|---|
|
| No Deduction of Taxes [Text Block] |
The table and graph presented above do not reflect the deduction of taxes a shareholder would pay on Fund distributions or the redemption of Fund shares.
|
| Material Change Description [Text Block] |
How did the Fund perform in the period?HOW DID THE FUND PERFORM LAST YEAR AND WHAT AFFECTED ITS PERFORMANCE? For the period between the inception of the vehicle on 6/13/25 and 9/30/25, the Brown Advisory Large Cap Sustainable Value ETF delivered positive absolute returns but slightly trailed its primary benchmark, the Russell 1000 Value Index. WHAT FACTORS INFLUENCED PERFORMANCE Similar to what we have seen for most of 2025, the market continued its march higher during the period. This steady increase in equity markets saw a return of growth indexes outperforming their value counterparts. Information Technology and Communication Services were two of the best performing sectors as the market continues to focus on all things related to artificial intelligence and hyperscaler capex trends. It is our belief that this narrow focus by an increasingly large group of investors is creating a growing sense of apathy in other areas of the market, thus creating attractive new opportunities. From an attribution perspective, Health Care, Financial Services, and Communication Services were the leading sources of underperformance during the period. Within health care, Elevance (ELV) lowered it guidance for the remainder of 2025 as increased costs in its Medicaid and public health exchange businesses continue to weight on margin. Within Financial Services, Fidelity National Information Services (FIS) came under pressure as investors questioned management’s ability to hit its full year margin and free cash flow targets. Information Technology, Materials, and Real Estate were the leading contributors to performance during the period. Both Dell Technologies (DELL) and TD SYNNEX (SNX) posted strong quarterly results with strong capital returns to shareholders, and each is benefitting from the increase in global IT spending. In Materials, CRH plc (CRH) continues to execute at a high level and the company was able to post solid second quarter results despite investor concerns around inclement weather across the U.S. for most of the spring season. POSITIONING During the period we exited three investments and made two new investments. We sold our remaining positions in Best Buy (BBY) and Ameriprise (AMP), and our position in ChampionX (CHX) was converted into SLB shares upon the closing of their recently announced merger agreement. We used the proceeds from those sales to establish a new position in health care - Hologic (HOLX) and one in materials- Smurfit Westrock (SW). At our time of purchase each of these new positions were trading at attractive absolute valuations and sizable discounts to both their closest peers and their respective historical multiples. We continue to believe that a portfolio of companies that generate high levels of free cash flow, possess a Sustainable Cash Flow Advantage (SCFA), exhibit capital discipline, and trade at attractive valuations will lead to compelling risk adjusted returns over the long term while providing a margin of safety for our investors. |
| AssetsNet |
$ 194,168,000
|
| Holdings Count | Holding |
41
|
| Advisory Fees Paid, Amount |
$ 241
|
| InvestmentCompanyPortfolioTurnover |
13.00%
|
| Additional Fund Statistics [Text Block] |
Key Fund Statistics as of September 30, 2025 | Total Net Assets (000's) | Number of Holdings | Total Advisory Fees Paid (000's) | Portfolio Turnover Rate |
|---|
| $194,168 | 41 | $241 | 13% |
|---|
|
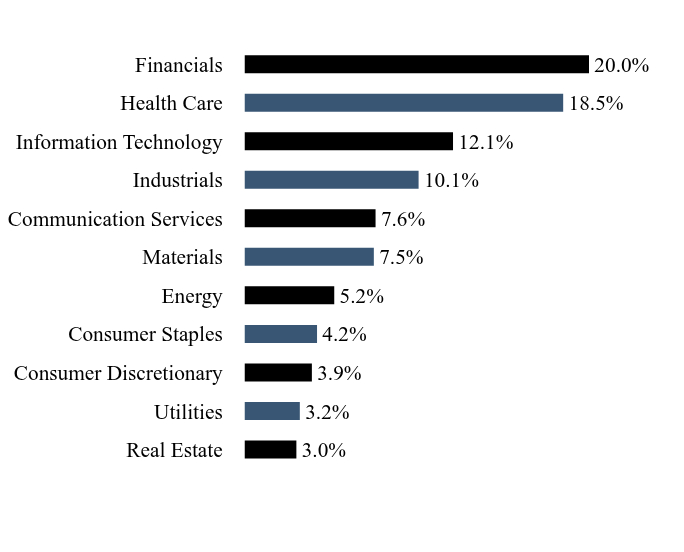
| Holdings [Text Block] |
Sector WeightingsFootnote Reference*Value | Value |
|---|
Real Estate | 3.0% | Utilities | 3.2% | Consumer Discretionary | 3.9% | Consumer Staples | 4.2% | Energy | 5.2% | Materials | 7.5% | Communication Services | 7.6% | Industrials | 10.1% | Information Technology | 12.1% | Health Care | 18.5% | Financials | 20.0% |
| Footnote | Description | Footnote* | Percentages are calculated based on total net assets. |
|
| Largest Holdings [Text Block] |
Holding Name | | | Percentage of
Total Net Assets |
|---|
CRH | | | 5.2% | Sanofi ADR | | | 4.1% | Bank of America | | | 3.8% | Willis Towers Watson | | | 3.7% | Cardinal Health | | | 3.6% | Unilever ADR | | | 3.5% | American International Group | | | 3.4% | Schlumberger | | | 3.3% | Constellation Energy | | | 3.2% | Ferguson Enterprises | | | 3.2% |
|
| Material Fund Change [Text Block] |
There were no material changes during the reporting period. |
| Updated Prospectus Phone Number |
1-877-876-6383
|
| Updated Prospectus Web Address |
https://www.brownadvisory.com/etf/sustainable-value-etf
|