Pay vs Performance Disclosure - USD ($)
Dec. 31, 2025
Dec. 15, 2025
Dec. 31, 2025
Dec. 31, 2024
Dec. 31, 2023
Pay Versus Performance
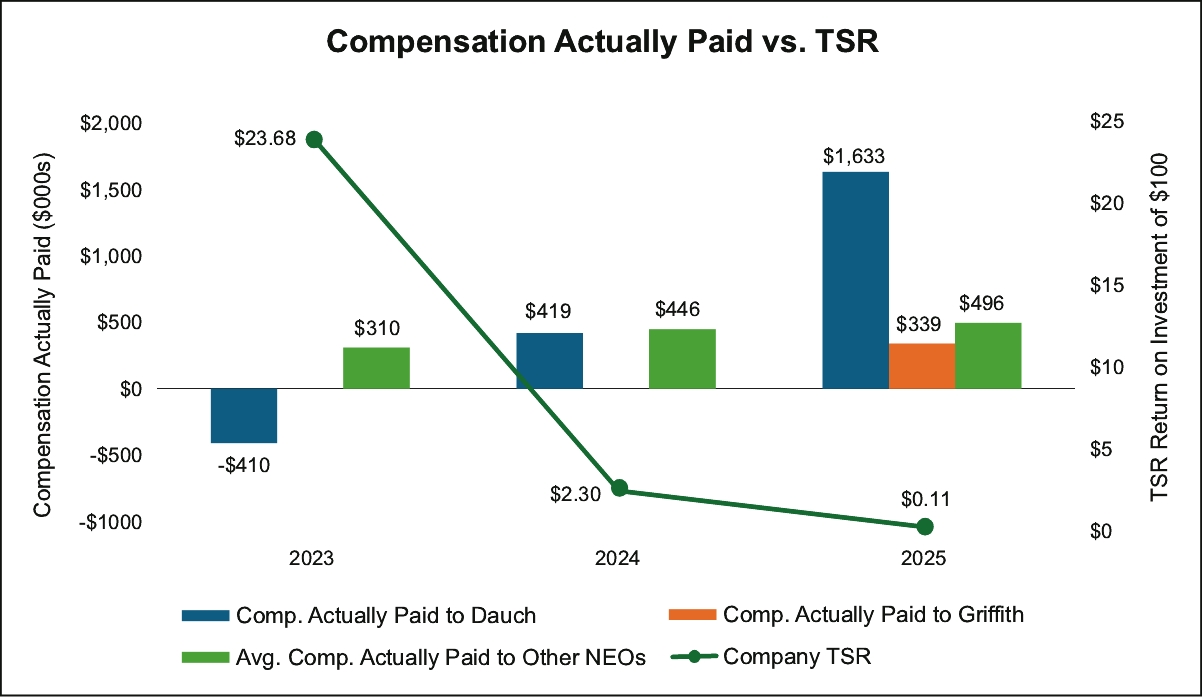
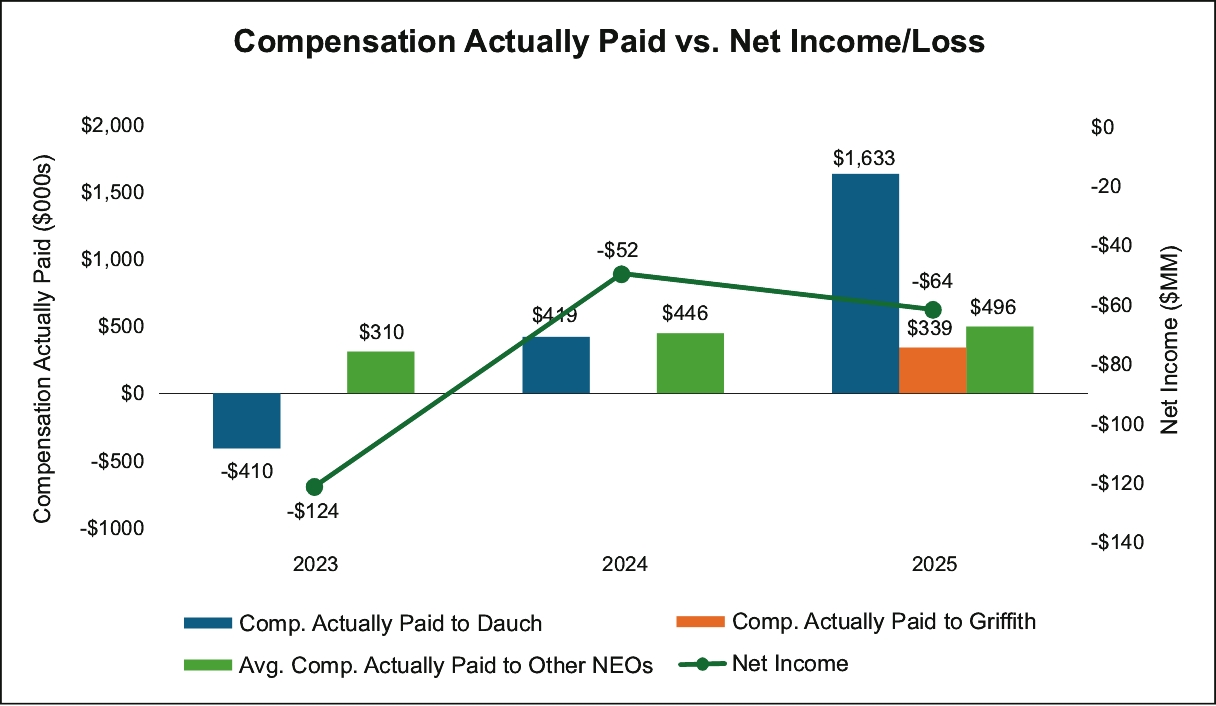
The following table sets forth compensation information for our Chief Executive Officer, referred to below as our PEO, and our other Named Executive Officers, referred to below as our non-PEO NEOs, for purposes of comparing their compensation to the value of our shareholders’ investments and our results of operations, calculated in accordance with SEC regulations, for fiscal years 2025, 2024 and 2023.
Year | (1) Summary Compensation Table Total For Former PEO Mr. Dauch | (1)(2) Compensation Actually Paid To Former PEO Mr. Dauch | (1) Summary Compensation Table Total For Current PEO Mr. Griffith | (1)(2) Compensation Actually Paid To Current PEO Mr. Griffith | (1) Average Summary Compensation Table Total For Non-PEO NEOs | (1)(2) Average Compensation Actually Paid To Non-PEO NEOs | (3) Value Of Initial Fixed $100 Investment Based On Total Shareholder Return | (4) Net Income/Loss (In Millions) | ||||||||||||||||
2025 | $1,884,396 | $1,633,326 | $338,542 | $338,542 | $515,569 | $495,523 | $0.11 | ($64.1) | ||||||||||||||||
2024 | $3,351,468 | $419,367 | — | — | $854,271 | $445,739 | $2.30 | ($51.6) | ||||||||||||||||
2023 | $3,388,174 | ($409,935) | — | — | $938,525 | $310,246 | $23.68 | ($123.9) | ||||||||||||||||
(1) | For each fiscal year, represents amount reported for our PEO and average amount reported for our non-PEO NEOs, in each case in the Total column of the Summary Compensation Table. Mr. Dauch served as the Former PEO from August 2nd, 2021 through December 15th, 2025. Mr. Griffith served as our “Current PEO” from December 15th, 2025 through December 31st, 2025. Our PEOs and NEOs for each of these fiscal years are shown below: |
Year | PEO | Non-PEO NEOs | ||||
2025 | Richard Dauch and Scott Griffith | Robert Ginnan, Josh Anderson, James D. Harrington, and Stan March | ||||
2024 | Richard Dauch | Robert Ginnan and James D. Harrington | ||||
2023 | Richard Dauch | Robert Ginnan and James D. Harrington | ||||
(2) | Amounts represent Compensation Actually Paid to our PEO and the average Compensation Actually Paid to our non-PEO NEOs for the relevant fiscal year. Compensation Actually Paid represents the amount reported in the Total column of the Summary Compensation Table for the applicable fiscal year, adjusted as shown below. Fair value or change in fair value, as applicable, of equity awards in the Compensation Actually Paid columns was determined as follows: (i) the fair value as of the end of the fiscal year of outstanding and unvested equity awards granted in that year; (ii) the change in fair value during the year of equity awards granted in prior years that remained outstanding and unvested at the end of the year; (iii) the fair value as of the vesting date of equity awards that were granted and vested in that year; and (iv) the change in fair value during the year through the vesting date of equity awards granted in prior years that vested during that year. Equity values are calculated in accordance with ASC Topic 718. |
Fiscal Year | Executives | SCT (a) | Grant Date Value of New Awards (b) | Year-End Fair Value of Equity Awards Granted During Year That Remained Unvested as of Last Day of Year (i) | Change in Fair Value from Last Day of Prior Year to Last Day of Year of Unvested Equity Awards (ii) | Change in Fair Value from Last Day of Prior Year to Vesting Date of Unvested Equity Awards that Vested During Year (iii) | Vesting- Date Fair Value of Equity Awards Granted During Year that Vested During Year (iv) | Fair Value at Last Day of Prior Year of Equity Awards Failed to Meet Vesting Conditions During Year (v) | Dollar Value of any Dividends or Other Earnings Paid on Stock or Option Awards During Year Prior to the Vesting Date that are not otherwise included in the Total Compensation During Year (vi) | Aggregate Equity Awards Adjustment (c) = (i) + (ii) + (iii) + (iv) - (v) + (vi) | Compensation Actually Paid (d) = (a) - (b) + (c) | ||||||||||||||||||||||
2025 | Former PEO | $1,884,396 | $100,000 | $0 | $0 | ($181,171) | $30,101 | $0 | $0 | ($151,070) | $1,633,326 | ||||||||||||||||||||||
Current PEO | $338,542 | $0 | $0 | $0 | $0 | $0 | $0 | $0 | $0 | $338,542 | |||||||||||||||||||||||
non-PEO NEOs | $515,569 | $0 | $0 | $0 | ($20,046) | $0 | $0 | $0 | ($20,046) | $495,523 | |||||||||||||||||||||||
(3) | Total Shareholder Return illustrates the value, as of the last day of the indicated fiscal year, of an investment of $100 in the Company’s common stock on December 31, 2022, the date on which the Company’s common stock commenced trading on the Nasdaq Global Market. Total Shareholder Return has been calculated using the pre-Merger stock price for periods before December 15, 2025, and the post-Merger stock price for periods after December 15, 2025. |
(4) | The dollar amounts reported represent the amount of net income (loss) reflected in the Company’s audited financial statements for the applicable fiscal year. |
(1) | For each fiscal year, represents amount reported for our PEO and average amount reported for our non-PEO NEOs, in each case in the Total column of the Summary Compensation Table. Mr. Dauch served as the Former PEO from August 2nd, 2021 through December 15th, 2025. Mr. Griffith served as our “Current PEO” from December 15th, 2025 through December 31st, 2025. Our PEOs and NEOs for each of these fiscal years are shown below: |
Year | PEO | Non-PEO NEOs | ||||
2025 | Richard Dauch and Scott Griffith | Robert Ginnan, Josh Anderson, James D. Harrington, and Stan March | ||||
2024 | Richard Dauch | Robert Ginnan and James D. Harrington | ||||
2023 | Richard Dauch | Robert Ginnan and James D. Harrington | ||||
(2) | Amounts represent Compensation Actually Paid to our PEO and the average Compensation Actually Paid to our non-PEO NEOs for the relevant fiscal year. Compensation Actually Paid represents the amount reported in the Total column of the Summary Compensation Table for the applicable fiscal year, adjusted as shown below. Fair value or change in fair value, as applicable, of equity awards in the Compensation Actually Paid columns was determined as follows: (i) the fair value as of the end of the fiscal year of outstanding and unvested equity awards granted in that year; (ii) the change in fair value during the year of equity awards granted in prior years that remained outstanding and unvested at the end of the year; (iii) the fair value as of the vesting date of equity awards that were granted and vested in that year; and (iv) the change in fair value during the year through the vesting date of equity awards granted in prior years that vested during that year. Equity values are calculated in accordance with ASC Topic 718. |
Fiscal Year | Executives | SCT (a) | Grant Date Value of New Awards (b) | Year-End Fair Value of Equity Awards Granted During Year That Remained Unvested as of Last Day of Year (i) | Change in Fair Value from Last Day of Prior Year to Last Day of Year of Unvested Equity Awards (ii) | Change in Fair Value from Last Day of Prior Year to Vesting Date of Unvested Equity Awards that Vested During Year (iii) | Vesting- Date Fair Value of Equity Awards Granted During Year that Vested During Year (iv) | Fair Value at Last Day of Prior Year of Equity Awards Failed to Meet Vesting Conditions During Year (v) | Dollar Value of any Dividends or Other Earnings Paid on Stock or Option Awards During Year Prior to the Vesting Date that are not otherwise included in the Total Compensation During Year (vi) | Aggregate Equity Awards Adjustment (c) = (i) + (ii) + (iii) + (iv) - (v) + (vi) | Compensation Actually Paid (d) = (a) - (b) + (c) | ||||||||||||||||||||||
2025 | Former PEO | $1,884,396 | $100,000 | $0 | $0 | ($181,171) | $30,101 | $0 | $0 | ($151,070) | $1,633,326 | ||||||||||||||||||||||
Current PEO | $338,542 | $0 | $0 | $0 | $0 | $0 | $0 | $0 | $0 | $338,542 | |||||||||||||||||||||||
non-PEO NEOs | $515,569 | $0 | $0 | $0 | ($20,046) | $0 | $0 | $0 | ($20,046) | $495,523 | |||||||||||||||||||||||