Pay vs Performance Disclosure - USD ($)
|
3 Months Ended |
9 Months Ended |
12 Months Ended |
Jan. 31, 2026 |
Nov. 09, 2025 |
Jan. 31, 2026 |
Jan. 31, 2025 |
Jan. 31, 2024 |
Jan. 31, 2023 |
Jan. 31, 2022 |
| Pay vs Performance Disclosure |
|
|
|
|
|
|
|
| Pay vs Performance Disclosure, Table |
|
|
| | | | | | | | | | | | | | | | | | | | | | | | | | | | | | | | | | | | | | | | Value of Initial Fixed $100 Investment Based on: | | | | Fiscal Year | SCT Total for Current CEO ($) | SCT Total for Former CEO ($) | Compensation Actually Paid to Current CEO ($)(1)(2) | Compensation Actually Paid to Former CEO ($)(1)(2) | SCT Average Total for Other NEOs ($)(3) | Average Compensation Actually Paid to Other NEOs ($)(2)(4) | Company Total Shareholder Return
($) | Peer Group Total Shareholder Return ($)(5) | Net (Loss) Income (thousands) ($)(6) | Revenue (thousands) ($)(7) | | 2026 | 52,830,661 | 16,273,947 | 52,241,394 | 40,896,851 | 7,606,548 | 15,037,801 | 227 | 375 | (71,151) | 2,463,797 | | 2025 | — | 15,843,345 | — | (1,260,121) | 7,544,277 | (2,113,422) | 167 | 289 | (129,072) | 2,006,443 | | 2024 | — | 15,291,447 | — | 44,853,129 | 7,487,213 | 10,599,236 | 244 | 220 | (176,600) | 1,683,011 | | 2023 | — | 13,229,190 | — | (1,158,813) | 6,426,612 | (140,152) | 131 | 142 | (345,398) | 1,284,040 | | 2022 | — | 10,566,757 | — | 17,742,233 | 5,346,033 | 7,074,336 | 247 | 183 | (306,866) | 873,782 |
|
|
|
|
|
| Company Selected Measure Name |
|
|
Revenue
|
|
|
|
|
| Named Executive Officers, Footnote |
|
|
The Other NEOs for the fiscal year ended January 31, 2026 were Michael Berry, Srdjan Tanjga and Cedric Pech. The Other NEOs for the fiscal year ended January 31, 2025 were Michael Gordon and Cedric Pech. The Other NEOs for the fiscal year ended January 31, 2024, January 31, 2023 and January 31, 2022 were Michael Gordon, Cedric Pech and Mark Porter.
|
|
|
|
|
| Peer Group Issuers, Footnote |
|
|
Total Shareholder Return shown in this table utilizes our cumulative total return to shareholders of our common stock relative to the Nasdaq Computer Index, which is the index included in the stock performance graph required by Item 201(e) of Regulation S-K in our Annual Report on Form 10-K for the fiscal year ended January 31, 2026. The comparison assumes $100 was invested in our common stock and in the Nasdaq Computer Index for the period commencing on January 31, 2021 and ending on January 31 of each Covered Year. All dollar values assume reinvestment of the gross dividends paid by companies included in the Nasdaq Computer Index. The stock price performance shown in the graph represents past performance and should not be considered an indication of future stock price performance.
|
|
|
|
|
| Adjustment To PEO Compensation, Footnote |
|
|
(1) The following table shows, for each Covered Year, the adjustments made to the total compensation shown for our current and former CEOs, Chirantan Desai and Dev Ittycheria, on the SCT to arrive at CAP as reflected on the table above:
| | | | | | | | | | | | | | | | | | | | | | | | Adjustments to Determine Current and Former CEO Compensation Actually Paid | Fiscal year ended January 31, 2026 (Current CEO) | Fiscal year ended January 31, 2026 (Former CEO) | Fiscal year ended January 31, 2025 | Fiscal year ended January 31, 2024 | Fiscal year ended January 31, 2023 | Fiscal year ended
January 31, 2022 | | SCT total amount | 52,830,661 | 16,273,947 | 15,843,345 | 15,291,447 | 13,229,190 | 10,566,757 | Subtract Amounts Reported under “Option Awards” and “Stock Awards” Columns in SCT for the Covered Year | 52,601,945 | 15,735,621 | 15,046,370 | 14,825,835 | 12,797,690 | 10,135,257 | Add Year-end Fair Value of Options Awards and Stock Awards Granted during Covered Year that Remain Unvested as of Year-end | 52,012,678 | 35,511,031 | 9,398,928 | 31,722,922 | 7,806,455 | 8,787,241 | Add Fair Value on Vesting of Option Awards and Stock Awards Granted during Covered Year that Vested during Covered Year | — | 2,674,347 | 1,072,206 | 2,670,818 | 889,080 | 2,388,178 | Add change (positive or negative) in Fair Value from Prior Year-end to Covered Year-end of Option Awards and Stock Awards Granted Prior to Covered Year that were Outstanding and Unvested as of Covered Year-end | — | 5,083,093 | (8,527,742) | 6,507,392 | (6,596,740) | 2,449,600 | Add change (positive or negative) in Fair Value from Prior Year-end to Vesting Date of Option Awards and Stock Awards Granted Prior to Covered Year that Vested during Covered Year | — | (2,909,945) | (4,000,488) | 3,486,384 | (3,689,107) | 3,752,557 | Subtract Fair Value of forfeited Stock Awards during Covered Year | — | — | — | — | — | 66,843 | | (8) | | TOTAL ADJUSTMENTS: | (589,267) | 24,622,904 | (17,103,466) | 29,561,682 | (14,388,003) | 7,175,476 | | TOTAL COMPENSATION ACTUALLY PAID: | 52,241,394 | 40,896,851 | (1,260,121) | 44,853,129 | (1,158,813) | 17,742,233 |
|
|
|
|
|
| Non-PEO NEO Average Total Compensation Amount |
|
|
$ 7,606,548
|
$ 7,544,277
|
$ 7,487,213
|
$ 6,426,612
|
$ 5,346,033
|
| Non-PEO NEO Average Compensation Actually Paid Amount |
|
|
$ 15,037,801
|
(2,113,422)
|
10,599,236
|
(140,152)
|
7,074,336
|
| Adjustment to Non-PEO NEO Compensation Footnote |
|
|
The following table shows, for each Covered Year, the adjustments made to the average of the total compensation shown for the Other NEOs on the SCT to arrive at CAP as reflected on the table above: | | | | | | | | | | | | | | | | | | | | | | | | | | | | | | | | | | | | | | | | | | | | | | Adjustments to Determine Average of Other NEOs' Compensation Actually Paid | | Fiscal year ended January 31, 2026 | | Fiscal year ended January 31, 2025 | | Fiscal year ended January 31, 2024 | | Fiscal year ended
January 31, 2023 | | Fiscal year ended
January 31, 2022 | | SCT total amount | | 7,606,548 | | 7,544,277 | | 7,487,213 | | 6,426,612 | | 5,346,033 | Subtract Amounts Reported under “Option Awards” and “Stock Awards” Columns in SCT for the Covered Year | | 7,011,482 | | 6,922,864 | | 6,912,855 | | 5,974,289 | | 4,694,131 | Add Year-end Fair Value of Options Awards and Stock Awards Granted during Covered Year that Remain Unvested as of Year-end | | 14,426,171 | | 3,626,273 | | 10,317,641 | | 3,642,784 | | 4,295,795 | Add Fair Value on Vesting of Option Awards and Stock Awards Granted during Covered Year that Vested during Covered Year | | 419,997 | | 482,817 | | 957,110 | | 416,788 | | 872,769 | Add change (positive or negative) in Fair Value from Prior Year-end to Covered Year-end of Option Awards and Stock Awards Granted Prior to Covered Year that were Outstanding and Unvested as of Covered Year-end | | 817,371 | | (3,696,618) | | 2,243,152 | | (3,143,169) | | 829,978 | Add change (positive or negative) in Fair Value from Prior Year-end to Vesting Date of Option Awards and Stock Awards Granted Prior to Covered Year that Vested during Covered Year | | (521,218) | | (1,997,051) | | 1,339,649 | | (1,508,880) | | 440,771 | Subtract Fair Value of forfeited Stock Awards during Covered Year | | 699,586 | (a) | | 1,150,256 | (b) | | 4,832,674 | (c) | | — | | 16,880 | (d) | | TOTAL ADJUSTMENTS: | | 7,431,253 | | (9,657,699) | | 3,112,023 | | (6,566,765) | | 1,728,303 | | TOTAL COMPENSATION ACTUALLY PAID: | | 15,037,801 | | (2,113,422) | | 10,599,236 | | (140,152) | | 7,074,336 |
(a) Reflects the forfeiture of equity awards by Mr. Tanjga upon his stepping down as our Interim Chief Financial Officer, effective May 8, 2025. (b) Reflects the forfeiture of equity awards by Mr. Gordon upon his stepping down as our Chief Operating Officer and Chief Financial Officer, effective January 31, 2025. (c) Reflects the forfeiture of equity awards by Mr. Porter upon his stepping down as our Chief Technology Officer, effective July 2023. (d) Reflects performance-based stock awards that were forfeited as a result of attainment of company performance targets at a level that resulted in less than full vesting.
|
|
|
|
|
| Compensation Actually Paid vs. Total Shareholder Return |
|
|
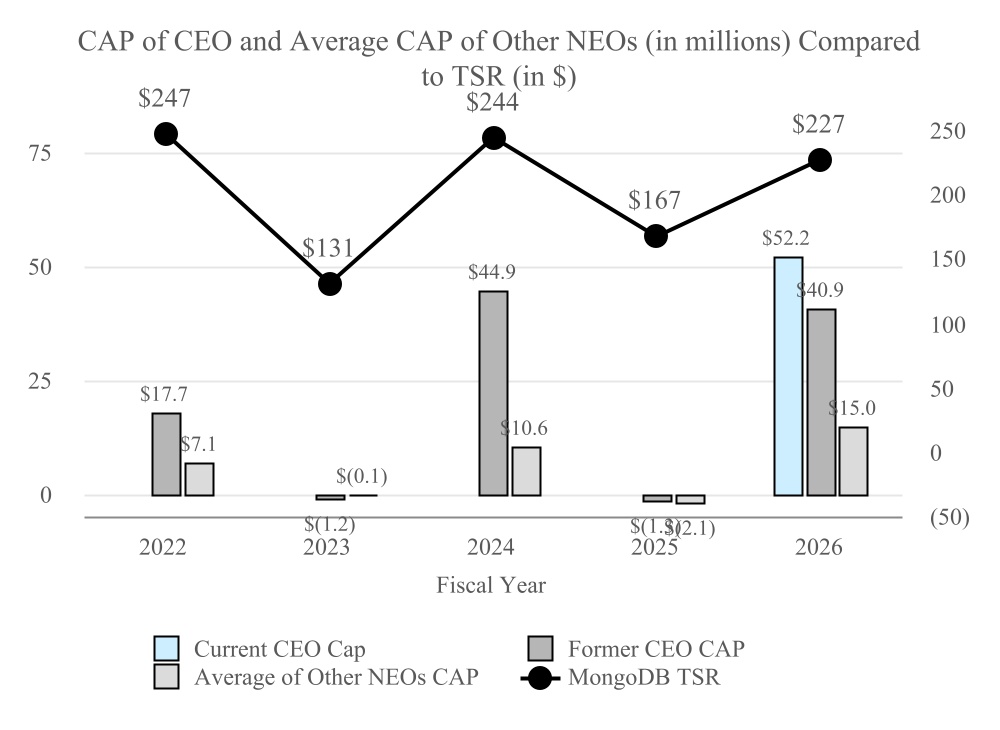
The following chart sets forth the relationship between (i) the CAP of our CEO and the average CAP of our Other NEOs against (ii) our cumulative TSR for each Covered Year.
|
|
|
|
|
| Compensation Actually Paid vs. Net Income |
|
|
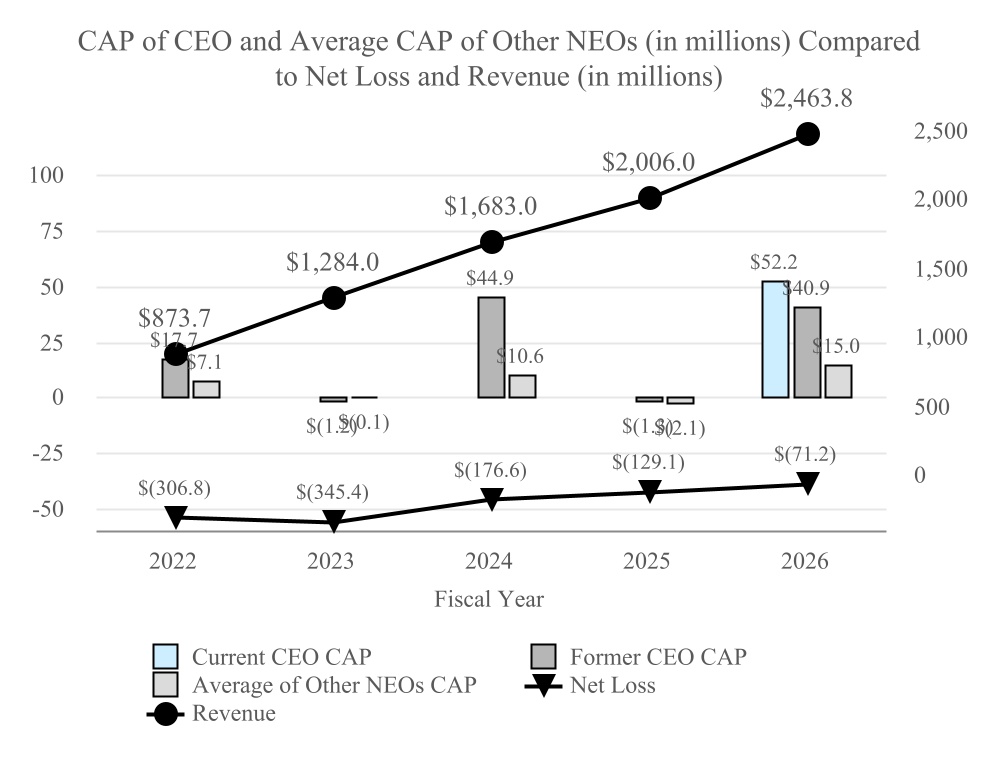
The following chart sets forth the relationship between (i) the CAP of our CEO and the average CAP of our Other NEOs (as shown in the left axis) against (ii) Revenue and (iii) Net Loss on the right axis, for each Covered Year.
|
|
|
|
|
| Compensation Actually Paid vs. Company Selected Measure |
|
|
The following chart sets forth the relationship between (i) the CAP of our CEO and the average CAP of our Other NEOs (as shown in the left axis) against (ii) Revenue and (iii) Net Loss on the right axis, for each Covered Year.
|
|
|
|
|
| Total Shareholder Return Vs Peer Group |
|
|
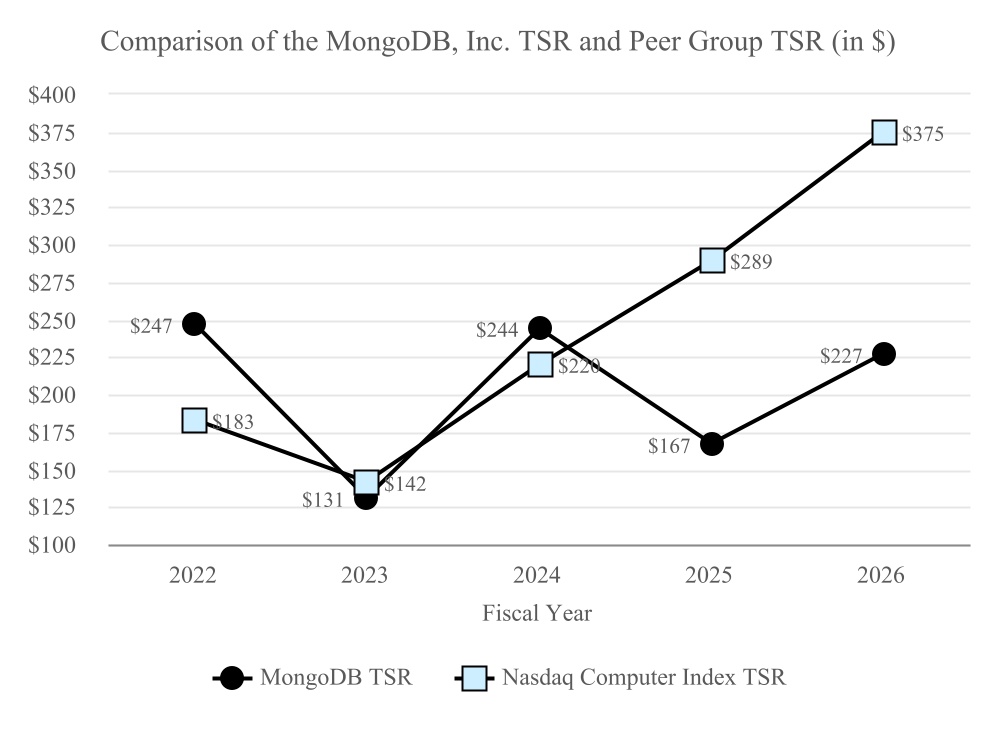
The graph below illustrates the TSR on a fixed $100 investment made as of January 31, 2021 in shares of our common stock and in the Nasdaq Computer Index. The stock price performance shown in the graph represents past performance and should not be considered an indication of future stock price performance.
|
|
|
|
|
| Tabular List, Table |
|
|
| | | | | | | | | | Performance Measure | | What it Measures | | ARR Growth (%) | | Percentage growth in ARR over a given time period | | Net New ARR ($) | | The net change in ARR over a given time period | | Non-GAAP Operating Income | | Earnings we generate adjusted for non-cash or irregular expenses | | Operating Cash Flow ($) | | Cash generated by our operating activities | | Revenue ($) | | Revenue we generate through our subscriptions and services offerings |
|
|
|
|
|
| Total Shareholder Return Amount |
|
|
$ 227
|
167
|
244
|
131
|
247
|
| Peer Group Total Shareholder Return Amount |
|
|
375
|
289
|
220
|
142
|
183
|
| Net Income (Loss) |
|
|
$ (71,151,000)
|
$ (129,072,000)
|
$ (176,600,000)
|
$ (345,398,000)
|
$ (306,866,000)
|
| Company Selected Measure Amount |
|
|
2,463,797,000
|
2,006,443,000
|
1,683,011,000
|
1,284,040,000
|
873,782,000
|
| PEO Name |
Chirantan Desai
|
Dev Ittycheria
|
|
|
|
|
|
| Additional 402(v) Disclosure |
|
|
For purposes of the adjustments to determine CAP, we computed the fair value of stock option awards and other stock awards in accordance with FASB ASC Topic 718 as of the end of the relevant fiscal year, other than the fair values of equity awards that vested in the Covered Year, which are valued as of the applicable vesting date. The valuation assumptions used in the calculation of such amounts are set forth in Note 11— Equity in our Annual Report on Form 10-K for the fiscal year ended January 31, 2026. Reflects “Net Loss” for each Covered Year as set forth in our Consolidated Statements of Operations included in our Annual Report on Form 10-K for each of the Covered Years. For the avoidance of doubt, “Net Loss” is a GAAP measure.Reflects “Revenue” for each Covered Year as set forth in our Consolidated Statements of Operations included in our Annual Report on Form 10-K for each of the Covered Years. For the avoidance of doubt, “Revenue” is a GAAP measure.
|
|
|
|
|
| Measure:: 1 |
|
|
|
|
|
|
|
| Pay vs Performance Disclosure |
|
|
|
|
|
|
|
| Name |
|
|
ARR Growth (%)
|
|
|
|
|
| Measure:: 2 |
|
|
|
|
|
|
|
| Pay vs Performance Disclosure |
|
|
|
|
|
|
|
| Name |
|
|
Net New ARR ($)
|
|
|
|
|
| Measure:: 3 |
|
|
|
|
|
|
|
| Pay vs Performance Disclosure |
|
|
|
|
|
|
|
| Name |
|
|
Non-GAAP Operating Income
|
|
|
|
|
| Measure:: 4 |
|
|
|
|
|
|
|
| Pay vs Performance Disclosure |
|
|
|
|
|
|
|
| Name |
|
|
Operating Cash Flow ($)
|
|
|
|
|
| Measure:: 5 |
|
|
|
|
|
|
|
| Pay vs Performance Disclosure |
|
|
|
|
|
|
|
| Name |
|
|
Revenue ($)
|
|
|
|
|
| Desai [Member] |
|
|
|
|
|
|
|
| Pay vs Performance Disclosure |
|
|
|
|
|
|
|
| PEO Total Compensation Amount |
|
|
$ 52,830,661
|
|
|
|
|
| PEO Actually Paid Compensation Amount |
|
|
52,241,394
|
|
|
|
|
| Ittycheria [Member] |
|
|
|
|
|
|
|
| Pay vs Performance Disclosure |
|
|
|
|
|
|
|
| PEO Total Compensation Amount |
|
|
16,273,947
|
$ 15,843,345
|
$ 15,291,447
|
$ 13,229,190
|
$ 10,566,757
|
| PEO Actually Paid Compensation Amount |
|
|
40,896,851
|
(1,260,121)
|
44,853,129
|
(1,158,813)
|
17,742,233
|
| PEO | Desai [Member] |
|
|
|
|
|
|
|
| Pay vs Performance Disclosure |
|
|
|
|
|
|
|
| Adjustment to Compensation, Amount |
|
|
(589,267)
|
|
|
|
|
| PEO | Desai [Member] | Aggregate Grant Date Fair Value of Equity Award Amounts Reported in Summary Compensation Table |
|
|
|
|
|
|
|
| Pay vs Performance Disclosure |
|
|
|
|
|
|
|
| Adjustment to Compensation, Amount |
|
|
(52,601,945)
|
|
|
|
|
| PEO | Desai [Member] | Year-end Fair Value of Equity Awards Granted in Covered Year that are Outstanding and Unvested |
|
|
|
|
|
|
|
| Pay vs Performance Disclosure |
|
|
|
|
|
|
|
| Adjustment to Compensation, Amount |
|
|
52,012,678
|
|
|
|
|
| PEO | Desai [Member] | Year-over-Year Change in Fair Value of Equity Awards Granted in Prior Years That are Outstanding and Unvested |
|
|
|
|
|
|
|
| Pay vs Performance Disclosure |
|
|
|
|
|
|
|
| Adjustment to Compensation, Amount |
|
|
0
|
|
|
|
|
| PEO | Desai [Member] | Vesting Date Fair Value of Equity Awards Granted and Vested in Covered Year |
|
|
|
|
|
|
|
| Pay vs Performance Disclosure |
|
|
|
|
|
|
|
| Adjustment to Compensation, Amount |
|
|
0
|
|
|
|
|
| PEO | Desai [Member] | Change in Fair Value as of Vesting Date of Prior Year Equity Awards Vested in Covered Year |
|
|
|
|
|
|
|
| Pay vs Performance Disclosure |
|
|
|
|
|
|
|
| Adjustment to Compensation, Amount |
|
|
0
|
|
|
|
|
| PEO | Desai [Member] | Prior Year End Fair Value of Equity Awards Granted in Any Prior Year that Fail to Meet Applicable Vesting Conditions During Covered Year |
|
|
|
|
|
|
|
| Pay vs Performance Disclosure |
|
|
|
|
|
|
|
| Adjustment to Compensation, Amount |
|
|
0
|
|
|
|
|
| PEO | Ittycheria [Member] |
|
|
|
|
|
|
|
| Pay vs Performance Disclosure |
|
|
|
|
|
|
|
| Adjustment to Compensation, Amount |
|
|
24,622,904
|
(17,103,466)
|
29,561,682
|
(14,388,003)
|
7,175,476
|
| PEO | Ittycheria [Member] | Aggregate Grant Date Fair Value of Equity Award Amounts Reported in Summary Compensation Table |
|
|
|
|
|
|
|
| Pay vs Performance Disclosure |
|
|
|
|
|
|
|
| Adjustment to Compensation, Amount |
|
|
(15,735,621)
|
(15,046,370)
|
(14,825,835)
|
(12,797,690)
|
(10,135,257)
|
| PEO | Ittycheria [Member] | Year-end Fair Value of Equity Awards Granted in Covered Year that are Outstanding and Unvested |
|
|
|
|
|
|
|
| Pay vs Performance Disclosure |
|
|
|
|
|
|
|
| Adjustment to Compensation, Amount |
|
|
35,511,031
|
9,398,928
|
31,722,922
|
7,806,455
|
8,787,241
|
| PEO | Ittycheria [Member] | Year-over-Year Change in Fair Value of Equity Awards Granted in Prior Years That are Outstanding and Unvested |
|
|
|
|
|
|
|
| Pay vs Performance Disclosure |
|
|
|
|
|
|
|
| Adjustment to Compensation, Amount |
|
|
5,083,093
|
(8,527,742)
|
6,507,392
|
(6,596,740)
|
2,449,600
|
| PEO | Ittycheria [Member] | Vesting Date Fair Value of Equity Awards Granted and Vested in Covered Year |
|
|
|
|
|
|
|
| Pay vs Performance Disclosure |
|
|
|
|
|
|
|
| Adjustment to Compensation, Amount |
|
|
2,674,347
|
1,072,206
|
2,670,818
|
889,080
|
2,388,178
|
| PEO | Ittycheria [Member] | Change in Fair Value as of Vesting Date of Prior Year Equity Awards Vested in Covered Year |
|
|
|
|
|
|
|
| Pay vs Performance Disclosure |
|
|
|
|
|
|
|
| Adjustment to Compensation, Amount |
|
|
(2,909,945)
|
(4,000,488)
|
3,486,384
|
(3,689,107)
|
3,752,557
|
| PEO | Ittycheria [Member] | Prior Year End Fair Value of Equity Awards Granted in Any Prior Year that Fail to Meet Applicable Vesting Conditions During Covered Year |
|
|
|
|
|
|
|
| Pay vs Performance Disclosure |
|
|
|
|
|
|
|
| Adjustment to Compensation, Amount |
|
|
0
|
0
|
0
|
0
|
(66,843)
|
| Non-PEO NEO |
|
|
|
|
|
|
|
| Pay vs Performance Disclosure |
|
|
|
|
|
|
|
| Adjustment to Compensation, Amount |
|
|
7,431,253
|
(9,657,699)
|
3,112,023
|
(6,566,765)
|
1,728,303
|
| Non-PEO NEO | Aggregate Grant Date Fair Value of Equity Award Amounts Reported in Summary Compensation Table |
|
|
|
|
|
|
|
| Pay vs Performance Disclosure |
|
|
|
|
|
|
|
| Adjustment to Compensation, Amount |
|
|
(7,011,482)
|
(6,922,864)
|
(6,912,855)
|
(5,974,289)
|
(4,694,131)
|
| Non-PEO NEO | Year-end Fair Value of Equity Awards Granted in Covered Year that are Outstanding and Unvested |
|
|
|
|
|
|
|
| Pay vs Performance Disclosure |
|
|
|
|
|
|
|
| Adjustment to Compensation, Amount |
|
|
14,426,171
|
3,626,273
|
10,317,641
|
3,642,784
|
4,295,795
|
| Non-PEO NEO | Year-over-Year Change in Fair Value of Equity Awards Granted in Prior Years That are Outstanding and Unvested |
|
|
|
|
|
|
|
| Pay vs Performance Disclosure |
|
|
|
|
|
|
|
| Adjustment to Compensation, Amount |
|
|
817,371
|
(3,696,618)
|
2,243,152
|
(3,143,169)
|
829,978
|
| Non-PEO NEO | Vesting Date Fair Value of Equity Awards Granted and Vested in Covered Year |
|
|
|
|
|
|
|
| Pay vs Performance Disclosure |
|
|
|
|
|
|
|
| Adjustment to Compensation, Amount |
|
|
419,997
|
482,817
|
957,110
|
416,788
|
872,769
|
| Non-PEO NEO | Change in Fair Value as of Vesting Date of Prior Year Equity Awards Vested in Covered Year |
|
|
|
|
|
|
|
| Pay vs Performance Disclosure |
|
|
|
|
|
|
|
| Adjustment to Compensation, Amount |
|
|
(521,218)
|
(1,997,051)
|
1,339,649
|
(1,508,880)
|
440,771
|
| Non-PEO NEO | Prior Year End Fair Value of Equity Awards Granted in Any Prior Year that Fail to Meet Applicable Vesting Conditions During Covered Year |
|
|
|
|
|
|
|
| Pay vs Performance Disclosure |
|
|
|
|
|
|
|
| Adjustment to Compensation, Amount |
|
|
$ (699,586)
|
$ (1,150,256)
|
$ (4,832,674)
|
$ 0
|
$ (16,880)
|