Pay Versus Performance
In accordance with rules adopted by the Securities and Exchange Commission pursuant to the Dodd-Frank Wall Street Reform and Consumer Protection Act of 2010, we provide the following disclosure regarding executive compensation for our principal executive officer (PEO) and our other named executive officers (our Non-PEO NEOs) and Company performance for the fiscal years listed below. The talent and compensation committee did not consider the pay versus performance disclosure below in making its pay decisions for any of the years shown.
Year |
|
|
Summary Compensation Table Total for PEO ($)(1) |
|
|
|
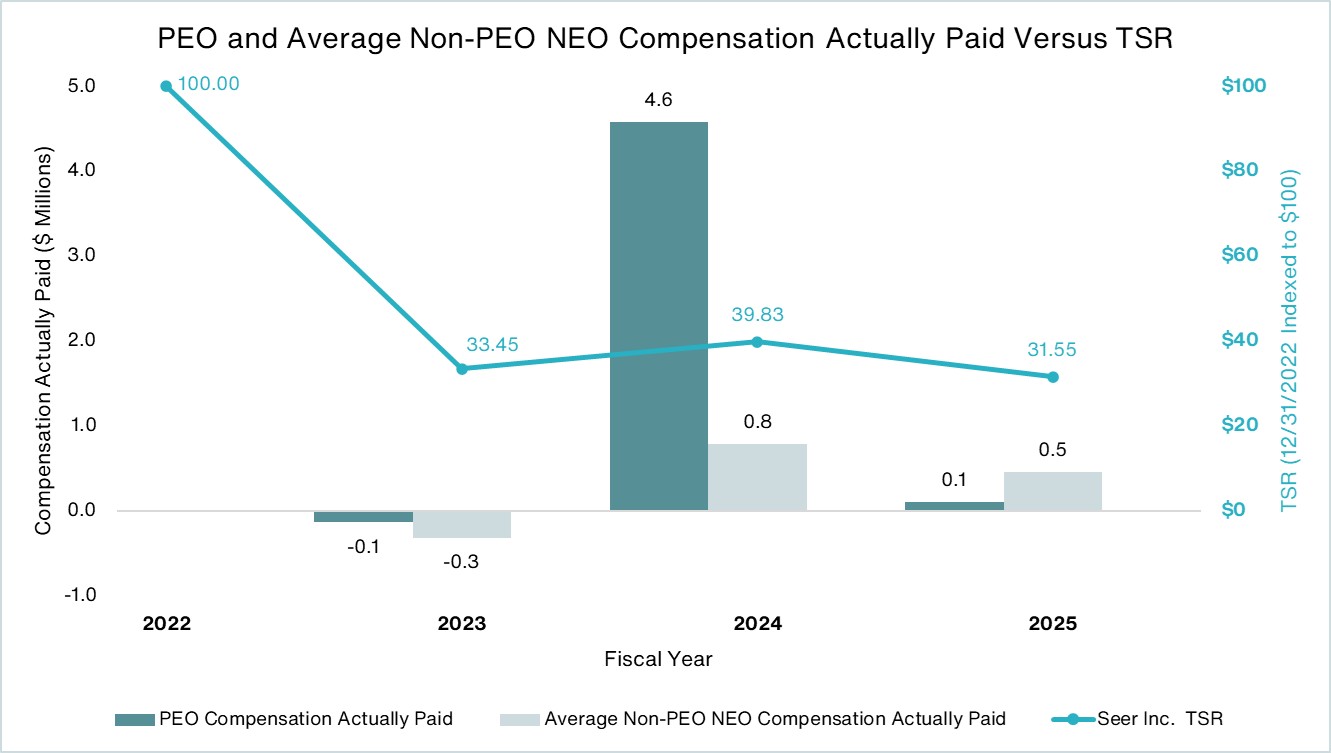
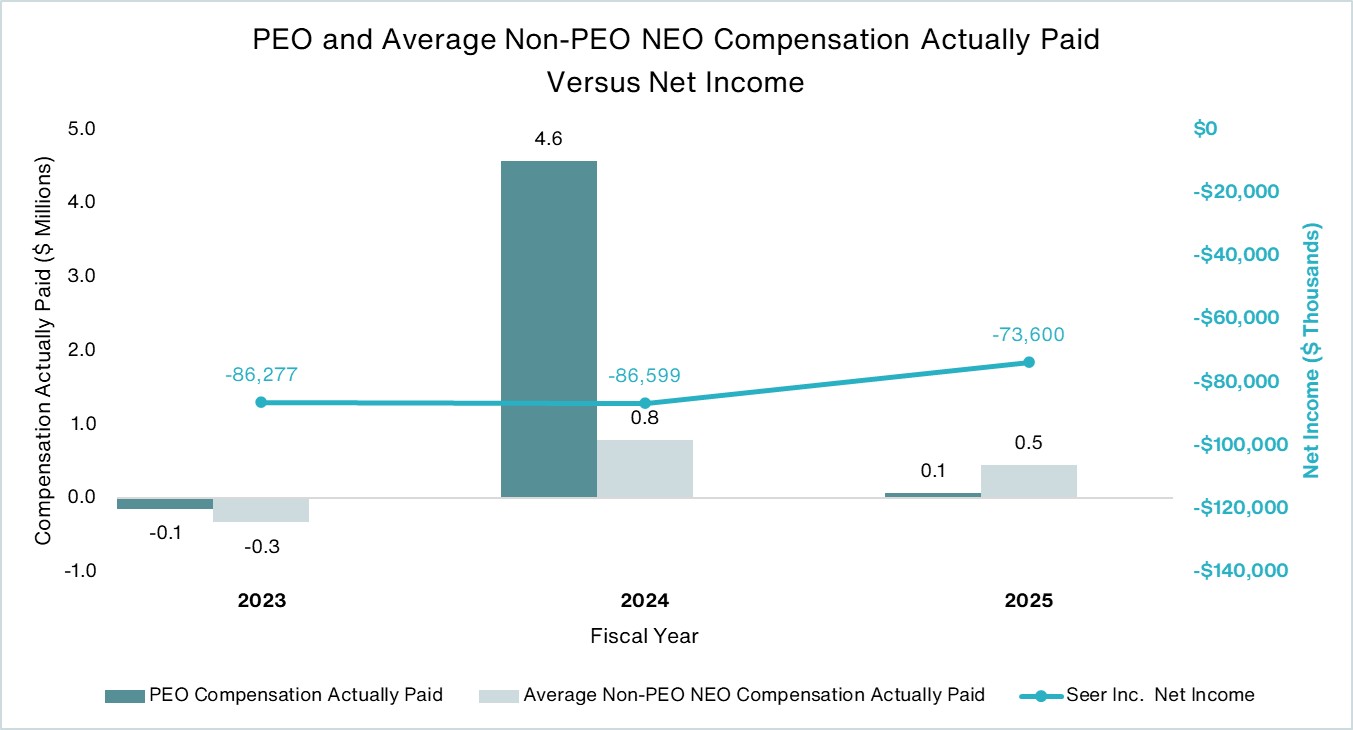
Compensation Actually Paid to PEO ($)(1)(2)(3) |
|
|
|
Average Summary Compensation Table Total for Non-PEO NEOs ($)(1) |
|
|
|
Average Compensation Actually Paid to Non-PEO NEOs ($)(1)(2)(3) |
|
|
|
Value of Initial Fixed $100 Investment based on |
|
|
|
Net Income |
|
||||||
2025 |
|
|
|
1,205,710 |
|
|
|
|
105,003 |
|
|
|
|
744,805 |
|
|
|
|
456,589 |
|
|
|
|
31.55 |
|
|
|
|
(73,600 |
) |
2024 |
|
|
|
3,549,950 |
|
|
|
|
4,581,646 |
|
|
|
|
1,118,658 |
|
|
|
|
790,704 |
|
|
|
|
39.83 |
|
|
|
|
(86,599 |
) |
2023 |
|
|
|
5,197,331 |
|
|
|
|
(136,662 |
) |
|
|
|
1,407,506 |
|
|
|
|
(320,892 |
) |
|
|
|
33.45 |
|
|
|
|
(86,277 |
) |
(1) Omid Farokhzad, M.D. was our PEO for each year presented. The individuals comprising the Non-PEO NEOs for each year presented are listed below:
2025 |
2023 - 2024 |
David Horn |
David Horn |
|
Elona Kogan |
(2) The amounts shown for Compensation Actually Paid have been calculated in accordance with Item 402(v) of Regulation S-K and do not reflect compensation actually earned, realized, or received by the Company’s NEOs. These amounts reflect the Summary Compensation Table Total with certain adjustments as described in footnote 3 below.
(3) Compensation Actually Paid reflects the exclusions and inclusions of certain amounts for the PEO and the Non-PEO NEOs as set forth below. Equity values are calculated in accordance with FASB ASC Topic 718. Amounts in the Exclusion of Stock Awards and Option Awards column are the totals from the Stock Awards and Option Awards columns set forth in the Summary Compensation Table.
Year |
|
|
Summary Compensation Table Total for PEO ($) |
|
|
|
Exclusion of Stock Awards and Option Awards for PEO ($) |
|
|
|
Inclusion of Equity Values for PEO ($) |
|
|
|
Compensation Actually Paid to PEO ($) |
|
||||
2025 |
|
|
|
1,205,710 |
|
|
|
|
— |
|
|
|
|
(1,100,707 |
) |
|
|
|
105,003 |
|
2024 |
|
|
|
3,549,950 |
|
|
|
|
(2,360,377 |
) |
|
|
|
3,392,073 |
|
|
|
|
4,581,646 |
|
2023 |
|
|
|
5,197,331 |
|
|
|
|
(4,015,530 |
) |
|
|
|
(1,318,463 |
) |
|
|
|
(136,662 |
) |
Year |
|
|
Average Summary Compensation Table Total for Non-PEO NEOs ($) |
|
|
|
Average Exclusion of Stock Awards and Option Awards for Non-PEO NEOs ($) |
|
|
|
Average Inclusion of Equity Values for Non-PEO NEOs ($) |
|
|
|
Average Compensation Actually Paid to Non-PEO NEOs ($) |
|
||||
2025 |
|
|
|
744,805 |
|
|
|
|
— |
|
|
|
|
(288,216 |
) |
|
|
|
456,589 |
|
2024 |
|
|
|
1,118,658 |
|
|
|
|
(601,024 |
) |
|
|
|
273,070 |
|
|
|
|
790,704 |
|
2023 |
|
|
|
1,407,506 |
|
|
|
|
(788,760 |
) |
|
|
|
(939,638 |
) |
|
|
|
(320,892 |
) |
The amounts in the Inclusion of Equity Values in the tables above are derived from the amounts set forth in the following tables (the Company has not paid dividends historically as a public company and does not sponsor any pension arrangements; thus no adjustments are made for these items):
Year |
|
|
Year-End Fair Value of Equity Awards Granted During Year That Remained Outstanding and Unvested as of Last Day of Year for PEO ($) |
|
|
Change in Fair Value from Last Day of Prior Year to Last Day of Year of Outstanding and Unvested Equity Awards for PEO ($) |
|
|
Vesting-Date Fair Value of Equity Awards Granted During Year that Vested During Year for PEO ($) |
|
|
Change in Fair Value from Last Day of Prior Year to Vesting Date of Unvested Equity Awards Granted in Prior Year that Vested During Year for PEO ($) |
|
|
Fair Value at Last Day of Prior Year of Equity Awards Granted in Prior Year that Forfeited During Year for PEO ($) |
|
|
Total - Inclusion of |
2025 |
|
|
— |
|
|
(1,107,996) |
|
|
— |
|
|
7,289 |
|
|
— |
|
|
(1,100,707) |
2024 |
|
|
2,996,803 |
|
|
451,882 |
|
|
— |
|
|
(56,612) |
|
|
— |
|
|
3,392,073 |
2023 |
|
|
1,542,178 |
|
|
(1,645,982) |
|
|
— |
|
|
(1,214,659) |
|
|
— |
|
|
(1,318,463) |
Year |
|
|
Average Year-End Fair Value of Equity Awards Granted During Year That Remained Outstanding and Unvested as of Last Day of Year for Non-PEO NEOs ($) |
|
|
Average Change in Fair Value from Last Day of Prior Year to Last Day of Year of Outstanding and Unvested Equity Awards for Non-PEO NEOs ($) |
|
|
Average Vesting-Date Fair Value of Equity Awards Granted During Year that Vested During Year for Non-PEO NEOs ($) |
|
|
Average Change in Fair Value from Last Day of Prior Year to Vesting Date of Unvested Equity Awards Granted in Prior Year that Vested During Year for Non-PEO NEOs ($) |
|
|
Average Fair Value at Last Day of Prior Year of Equity Awards Granted in Prior Year that Forfeited During Year for Non-PEO NEOs ($) |
|
|
Total - Average Inclusion of Equity Values for Non-PEO NEOs ($) |
2025 |
|
|
— |
|
|
(260,227) |
|
|
— |
|
|
(27,989) |
|
|
— |
|
|
(288,216) |
2024 |
|
|
427,600 |
|
|
64,266 |
|
|
— |
|
|
(18,866) |
|
|
(199,930) |
|
|
273,070 |
2023 |
|
|
299,987 |
|
|
(733,276) |
|
|
— |
|
|
(506,349) |
|
|
— |
|
|
(939,638) |
(4) Assumes $100 was invested in the Company for the period starting December 31, 2022, through the end of the listed year. Historical stock performance is not necessarily indicative of future stock performance.
(1) Omid Farokhzad, M.D. was our PEO for each year presented. The individuals comprising the Non-PEO NEOs for each year presented are listed below:
2025 |
2023 - 2024 |
David Horn |
David Horn |
|
Elona Kogan |
(3) Compensation Actually Paid reflects the exclusions and inclusions of certain amounts for the PEO and the Non-PEO NEOs as set forth below. Equity values are calculated in accordance with FASB ASC Topic 718. Amounts in the Exclusion of Stock Awards and Option Awards column are the totals from the Stock Awards and Option Awards columns set forth in the Summary Compensation Table.
Year |
|
|
Summary Compensation Table Total for PEO ($) |
|
|
|
Exclusion of Stock Awards and Option Awards for PEO ($) |
|
|
|
Inclusion of Equity Values for PEO ($) |
|
|
|
Compensation Actually Paid to PEO ($) |
|
||||
2025 |
|
|
|
1,205,710 |
|
|
|
|
— |
|
|
|
|
(1,100,707 |
) |
|
|
|
105,003 |
|
2024 |
|
|
|
3,549,950 |
|
|
|
|
(2,360,377 |
) |
|
|
|
3,392,073 |
|
|
|
|
4,581,646 |
|
2023 |
|
|
|
5,197,331 |
|
|
|
|
(4,015,530 |
) |
|
|
|
(1,318,463 |
) |
|
|
|
(136,662 |
) |
The amounts in the Inclusion of Equity Values in the tables above are derived from the amounts set forth in the following tables (the Company has not paid dividends historically as a public company and does not sponsor any pension arrangements; thus no adjustments are made for these items):
Year |
|
|
Year-End Fair Value of Equity Awards Granted During Year That Remained Outstanding and Unvested as of Last Day of Year for PEO ($) |
|
|
Change in Fair Value from Last Day of Prior Year to Last Day of Year of Outstanding and Unvested Equity Awards for PEO ($) |
|
|
Vesting-Date Fair Value of Equity Awards Granted During Year that Vested During Year for PEO ($) |
|
|
Change in Fair Value from Last Day of Prior Year to Vesting Date of Unvested Equity Awards Granted in Prior Year that Vested During Year for PEO ($) |
|
|
Fair Value at Last Day of Prior Year of Equity Awards Granted in Prior Year that Forfeited During Year for PEO ($) |
|
|
Total - Inclusion of |
2025 |
|
|
— |
|
|
(1,107,996) |
|
|
— |
|
|
7,289 |
|
|
— |
|
|
(1,100,707) |
2024 |
|
|
2,996,803 |
|
|
451,882 |
|
|
— |
|
|
(56,612) |
|
|
— |
|
|
3,392,073 |
2023 |
|
|
1,542,178 |
|
|
(1,645,982) |
|
|
— |
|
|
(1,214,659) |
|
|
— |
|
|
(1,318,463) |
(4) Assumes $100 was invested in the Company for the period starting December 31, 2022, through the end of the listed year. Historical stock performance is not necessarily indicative of future stock performance.
(3) Compensation Actually Paid reflects the exclusions and inclusions of certain amounts for the PEO and the Non-PEO NEOs as set forth below. Equity values are calculated in accordance with FASB ASC Topic 718. Amounts in the Exclusion of Stock Awards and Option Awards column are the totals from the Stock Awards and Option Awards columns set forth in the Summary Compensation Table.
Year |
|
|
Average Summary Compensation Table Total for Non-PEO NEOs ($) |
|
|
|
Average Exclusion of Stock Awards and Option Awards for Non-PEO NEOs ($) |
|
|
|
Average Inclusion of Equity Values for Non-PEO NEOs ($) |
|
|
|
Average Compensation Actually Paid to Non-PEO NEOs ($) |
|
||||
2025 |
|
|
|
744,805 |
|
|
|
|
— |
|
|
|
|
(288,216 |
) |
|
|
|
456,589 |
|
2024 |
|
|
|
1,118,658 |
|
|
|
|
(601,024 |
) |
|
|
|
273,070 |
|
|
|
|
790,704 |
|
2023 |
|
|
|
1,407,506 |
|
|
|
|
(788,760 |
) |
|
|
|
(939,638 |
) |
|
|
|
(320,892 |
) |
The amounts in the Inclusion of Equity Values in the tables above are derived from the amounts set forth in the following tables (the Company has not paid dividends historically as a public company and does not sponsor any pension arrangements; thus no adjustments are made for these items):
Year |
|
|
Average Year-End Fair Value of Equity Awards Granted During Year That Remained Outstanding and Unvested as of Last Day of Year for Non-PEO NEOs ($) |
|
|
Average Change in Fair Value from Last Day of Prior Year to Last Day of Year of Outstanding and Unvested Equity Awards for Non-PEO NEOs ($) |
|
|
Average Vesting-Date Fair Value of Equity Awards Granted During Year that Vested During Year for Non-PEO NEOs ($) |
|
|
Average Change in Fair Value from Last Day of Prior Year to Vesting Date of Unvested Equity Awards Granted in Prior Year that Vested During Year for Non-PEO NEOs ($) |
|
|
Average Fair Value at Last Day of Prior Year of Equity Awards Granted in Prior Year that Forfeited During Year for Non-PEO NEOs ($) |
|
|
Total - Average Inclusion of Equity Values for Non-PEO NEOs ($) |
2025 |
|
|
— |
|
|
(260,227) |
|
|
— |
|
|
(27,989) |
|
|
— |
|
|
(288,216) |
2024 |
|
|
427,600 |
|
|
64,266 |
|
|
— |
|
|
(18,866) |
|
|
(199,930) |
|
|
273,070 |
2023 |
|
|
299,987 |
|
|
(733,276) |
|
|
— |
|
|
(506,349) |
|
|
— |
|
|
(939,638) |
(4) Assumes $100 was invested in the Company for the period starting December 31, 2022, through the end of the listed year. Historical stock performance is not necessarily indicative of future stock performance.