Pay Versus Performance
Pursuant to Section 953(a) of the Dodd-Frank Act and Item 402(v) of SEC Regulation S-K, we are providing the following information about the relationship between executive “compensation actually paid” (or “CAP”) to the Company’s principal executive officer (“PEO”) and non-PEO NEOs for 2025, 2024 and 2023 and certain aspects of the financial performance of the Company. The Compensation Committee does not utilize CAP as the basis for making compensation decisions. We do not currently use any other financial performance measure to link CAP to the CEO and our other NEOs to the Company’s performance.
Pay Versus Performance Table
| Year | Summary | Summary | Summary | Compensation | Compensation | Compensation | Average | Average | Value of | Net | |||||||||||||||||||||
| 2025 | $ | 5,777,846 |
|
|
|
| $ | 8,283,181 |
|
|
|
| $ | 4,003,740 | $ | 10,998,273 | $ | 508.46 | $ | (380,789 | ) | ||||||||||
| 2024 | $ | 2,170,352 | $ | 1,002,566 | $ | 2,548,205 | $ | 2,170,352 | $ | 833,859 | $ | 3,575,260 | $ | 1,623,647 | $ | 1,733,398 | $ | 114.65 | $ | (450,554 | ) | ||||||||||
| 2023 |
|
| $ | 1,848,758 | $ | 1,950,218 |
|
| $ | 514,962 | $ | 591,910 | $ | 1,317,925 | $ | 258,204 | $ | 83.96 | $ | (73,096 | ) | ||||||||||
____________
(1) PEO 1 refers to Daniel Barcelo, our current PEO, PEO 2 refers to Birger Steen, and PEO 3 refers to Tom Einar Jensen. Amounts represent CAP to our CEO(s) and the average CAP to our remaining NEOs for the relevant year, as determined under SEC rules and described below, which includes the following individuals for each year:
(2) SEC rules require certain adjustments be made to the Summary Compensation Table (“SCT”) totals to determine CAP as reported in the Pay versus Performance Table. CAP does not necessarily represent cash and/or equity value transferred to the applicable NEO as realized income, but rather is a value calculated under applicable SEC rules. In general, CAP is calculated as Summary Compensation Table total compensation adjusted to include the fair market value of equity awards
as of December 31 of the applicable year or, if earlier, the vesting date. The equity values are computed in accordance with the methodology used for financial reporting purposes. The following table details these adjustments. The Company offers neither a defined benefit pension plan nor dividends, so no adjustment for those items is included in the table below.
| 2025 | |||||||
| PEO 1 | Average | ||||||
| SCT Total | $ | 5,777,846 | $ | 4,003,740 |
| ||
| Deduction for amounts reported in the “Stock Awards” column in the SCT | $ | 3,752,000 | $ | 2,733,600 |
| ||
| Deduction for amounts reported in the “Option Awards” column in the SCT | $ | 0 | $ | 135,000 |
| ||
| Year end fair value of equity awards granted during the year that are outstanding and unvested as of the last day of the covered year | $ | 4,453,336 | $ | 7,712,529 |
| ||
| Change in fair value of awards granted in prior years that are outstanding and unvested as of the last day of the covered year | $ | 0 | $ | 1,732,152 |
| ||
| Change in the fair value from the end of the prior year to the vesting date for vested awards during the covered year | $ | 0 | $ | (264,047 | ) | ||
| Fair value of awards that are granted and vested during the covered year | $ | 1,803,999 | $ | 682,500 |
| ||
| Deduction for awards granted in prior years that are determined to fail to meet the applicable vesting conditions | $ | 0 | $ | 0 |
| ||
| CAP | $ | 8,283,181 | $ | 10,998,273 |
| ||
(3) TSR is determined based on the end of the year value of $100 invested for the period from December 31, 2022 through the end of the listed fiscal year.
(4) The amounts in this column represent the Company’s disclosed net loss for each reported year.
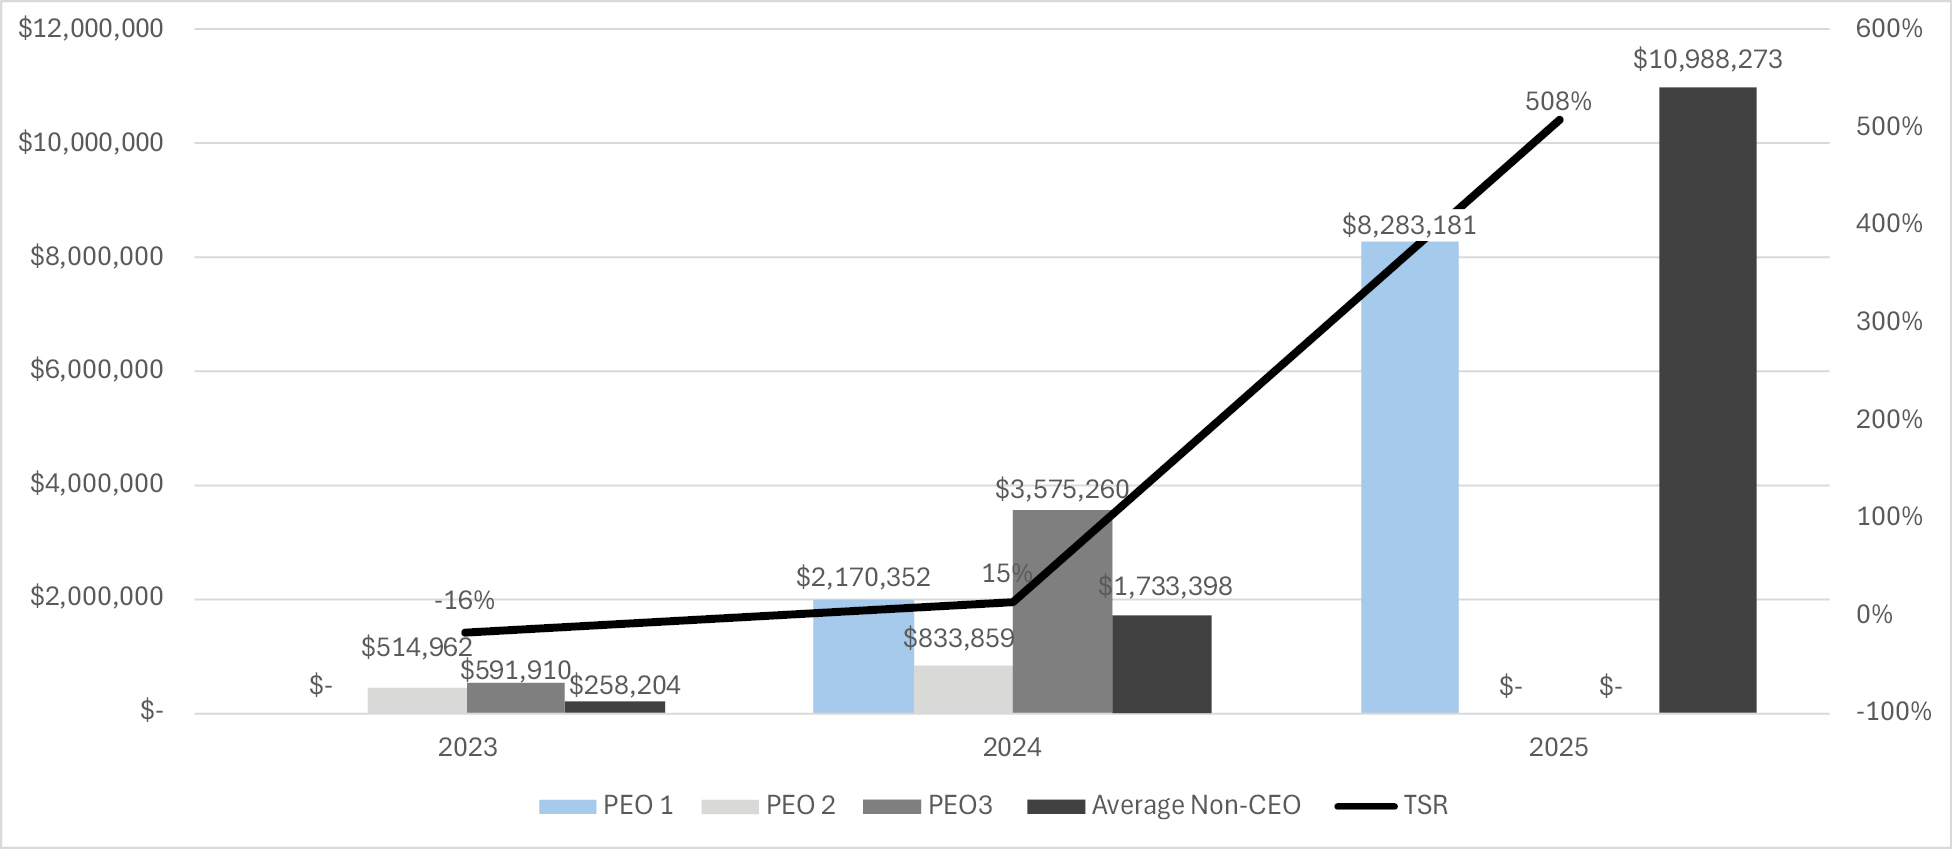
Description of the Relationship Between Pay and Performance
The following chart sets forth the relationship between CAP to our PEO 1, PEO 2, and PEO 3 and average CAP to our other named executive officers and Company total stockholder return for the years ended 2023, 2024 and 2025.
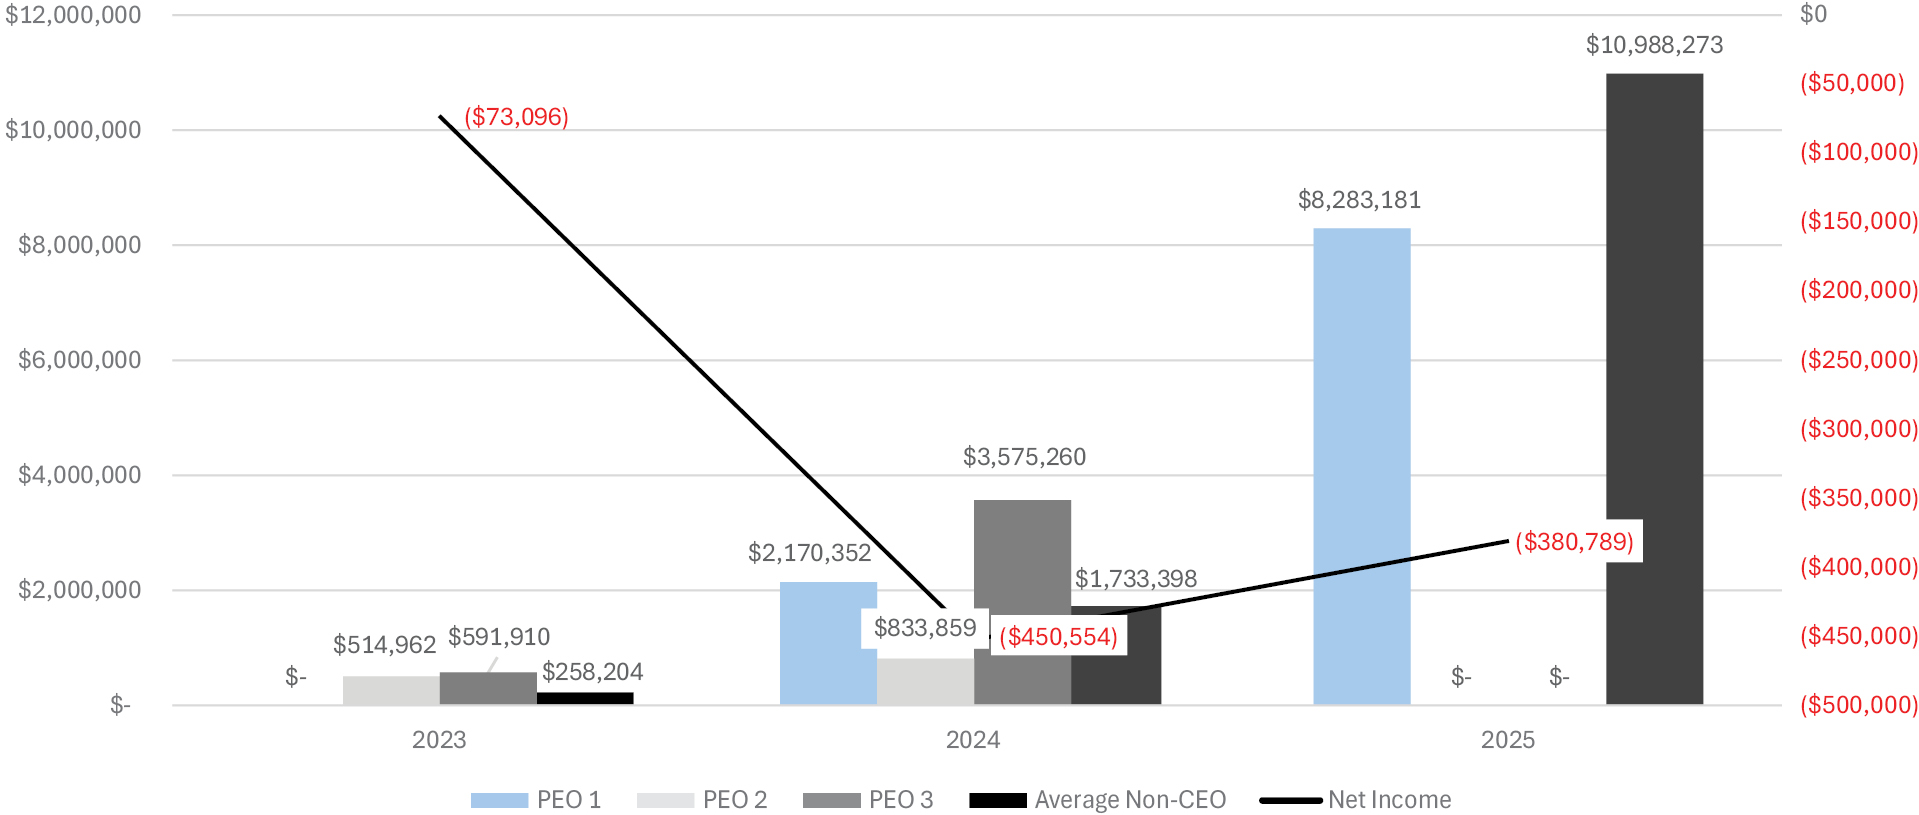
The following charts set forth the relationship between CAP to our PEO 1, PEO 2, and PEO 3 and average CAP to our other named executive officers and the Company’s net income (loss) for the years ended 2023, 2024 and 2025.
| Year | CEO | Non-CEO Named Executive Officers | ||
| 2025 | Daniel Barcelo | Joseph Evan Calio and Einar GS Kilde | ||
| 2024 | Daniel Barcelo, Birger Steen and Tom Einar Jensen | Joseph Evan Calio, Einar GS Kilde and Oscar K. Brown | ||
| 2023 | Birger Steen and Tom Einar Jensen | Oscar K. Brown, Jeremy Bezdek, Andreas Bentzen, Are L. Brautaset, Jan Arve Haugan and Tove Nilsen Ljungquist |
| [1] | PEO 1 refers to Daniel Barcelo, our current PEO, PEO 2 refers to Birger Steen, and PEO 3 refers to Tom Einar Jensen. Amounts represent CAP to our CEO(s) and the average CAP to our remaining NEOs for the relevant year, as determined under SEC rules and described below, which includes the following individuals for each year: | ||||||||||||||||||||||||||||||||||||||||||||||||||||||||||||||||||||||||||||||||||||||||
| [2] | SEC rules require certain adjustments be made to the Summary Compensation Table (“SCT”) totals to determine CAP as reported in the Pay versus Performance Table. CAP does not necessarily represent cash and/or equity value transferred to the applicable NEO as realized income, but rather is a value calculated under applicable SEC rules. In general, CAP is calculated as Summary Compensation Table total compensation adjusted to include the fair market value of equity awards as of December 31 of the applicable year or, if earlier, the vesting date. The equity values are computed in accordance with the methodology used for financial reporting purposes. The following table details these adjustments. The Company offers neither a defined benefit pension plan nor dividends, so no adjustment for those items is included in the table below.
|
||||||||||||||||||||||||||||||||||||||||||||||||||||||||||||||||||||||||||||||||||||||||
| [3] | TSR is determined based on the end of the year value of $100 invested for the period from December 31, 2022 through the end of the listed fiscal year. | ||||||||||||||||||||||||||||||||||||||||||||||||||||||||||||||||||||||||||||||||||||||||
| [4] | The amounts in this column represent the Company’s disclosed net loss for each reported year. | ||||||||||||||||||||||||||||||||||||||||||||||||||||||||||||||||||||||||||||||||||||||||