Average | ||||||||||||||||||
Summary | Average | |||||||||||||||||
Compensation | Compensation |
| ||||||||||||||||
Table Total for | Actually Paid |
| ||||||||||||||||
Summary | Non-PEO | to Non-PEO | Value of Initial |
| ||||||||||||||
Compensation | Compensation | Named | Named | Fixed $100 | Net (Loss) | |||||||||||||
Table Total for | Actually Paid | Executive | Executive | Investment | Income | |||||||||||||
Year | | PEO(1) | | to PEO(1)(2) | | Officers(1) | | Officers(1)(3) | | Based On TSR(4) | | (in thousands) | ||||||
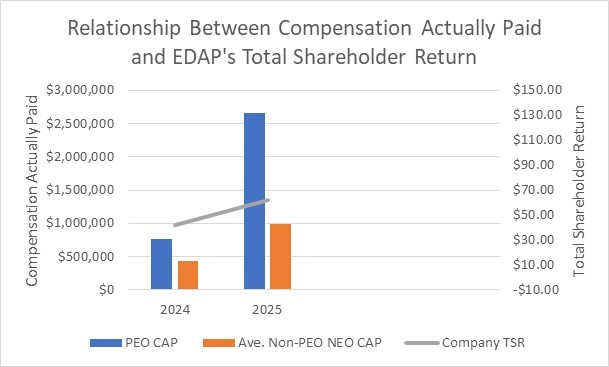
2025 | $ | 1,742,648 | $ | 2,660,067 | $ | 860,479 | $ | 984,302 | $ | 62.31 | $ | (29,246) | ||||||
2024 | $ | 1,281,812 | $ | 768,590 | $ | 738,074 | $ | 442,577 | $ | 41.86 | $ | (20,584) | ||||||
(1) | Mr. Rhodes served as our principal executive officer (“PEO”) for fiscal years 2025 and 2024. For fiscal years 2025 and 2024, our non-PEO named executive officers consisted of Messrs. Mobeck and Annen. |
(2) | “Compensation Actually Paid” to our PEO in fiscal years 2025 and 2024 reflects the respective amounts set forth in the table above, adjusted as set forth in the table below, as determined in accordance with SEC rules. |
Ryan Rhodes | | 2025 | | 2024 | ||
Summary Compensation Table Total for PEO | $ | 1,742,648 | $ | 1,281,812 | ||
Less: Aggregate Change in the Actuarial Present Value of Accumulated Benefits under all Defined Benefit and Pension Plans Reported in the Summary Compensation Table |
| — |
| — | ||
Plus: Service Cost for all Defined Benefit and Pension Plans Reported in the Summary Compensation Table |
| — |
| — | ||
Plus: Prior Service Cost for all Defined Benefit and Pension Plans Reported in the Summary Compensation Table |
| — |
| — | ||
Less: Stock Award Value Reported in the Summary Compensation Table for the Covered Year | $ | (283,900) | $ | 0 | ||
Less: Option Award Value Reported in the Summary Compensation Table for the Covered Year | $ | (390,000) | $ | (427,000) | ||
Plus: Year-End Fair Value for Stock and Option Awards Granted in the Covered Year that are Outstanding and Unvested as of the Covered Year-End | $ | 1,393,319 | $ | 66,750 | ||
Plus (Less): Year-End Change in Fair Value of Stock and Option Awards Granted in Prior Years that are Outstanding and Unvested as of the Covered Year-End | $ | 35,972 | $ | (170,944) | ||
Plus: Fair Value for Stock and Option Awards Granted and Vested in the Covered Year | $ | 167,500 | $ | 29,583 | ||
Plus (Less): Change in Fair Value from the End of the Prior Fiscal Year to the Vesting Date for Stock and Option Awards Granted in Any Prior Fiscal Year Which Vested During the Covered Year | $ | (5,472) | $ | (11,611) | ||
Less: Fair Value as of Prior-Year End of Stock and Option Awards Granted in Prior Years that Failed to Vest in the Covered Year |
| — |
| — | ||
Plus: Dollar Value of Any Dividends or Other Earnings Paid on Stock and Option Awards in the Covered Year |
| — |
| — | ||
Compensation Actually Paid to PEO | $ | 2,660,067 | $ | 768,590 | ||
(3) | “Average Compensation Actually Paid” to our non-PEO named executive officers for fiscal years 2025 and 2024 reflects the respective amounts set forth in the primary table above, adjusted as set forth in the table below, as determined in accordance with SEC rules. |
Non-PEO Named Executive Officers | | 2025 | | 2024 | ||
Average Summary Compensation Table Total for Non-PEO Named Executive Officers | $ | 860,479 | $ | 738,074 | ||
Less: Average Aggregate Change in the Actuarial Present Value of Accumulated Benefits under all Defined Benefit and Pension Plans Reported in the Summary Compensation Table |
| — |
| — | ||
Plus: Average Service Cost for all Defined Benefit and Pension Plans Reported in the Summary Compensation Table |
| — |
| — | ||
Plus: Average Prior Service Cost for all Defined Benefit and Pension Plans Reported in the Summary Compensation Table |
| — |
| — | ||
Less: Average Stock Award Values Reported in the Summary Compensation Table for the Covered Year | $ | (82,025) | $ | 0 | ||
Less: Average Option Award Values Reported in the Summary Compensation Table for the Covered Year | $ | (245,438) | $ | (184,000) | ||
Plus: Average Year-End Fair Value for Stock and Option Awards Granted in the Covered Year that are Outstanding and Unvested as of the Covered Year-End | $ | 402,977 | $ | 33,333 | ||
Plus (Less): Average Year-End Change in Fair Value of Stock and Option Awards Granted in Prior Years that are Outstanding and Unvested as of the Covered Year-End | $ | 14,825 | $ | (154,403) | ||
Plus: Average Fair Value for Stock and Option Awards Granted and Vested in the Covered Year | $ | 41,147 | $ | 32,264 | ||
Plus (Less): Average Change in Fair Value from the End of the Prior Fiscal Year to the Vesting Date for Stock and Option Awards Granted in Any Prior Fiscal Year Which Vested During the Covered Year | $ | (7,663) | $ | (22,691) | ||
Less: Average Fair Value as of Prior-Year End of Stock and Option Awards Granted in Prior Years that Failed to Vest in the Covered Year |
| — |
| — | ||
Plus: Average Dollar Value of Any Dividends or Other Earnings Paid on Stock and Option Awards in the Covered Year |
| — |
| — | ||
Average Compensation Actually Paid to Non-PEO Named Executive Officers | $ | 984,302 | $ | 442,577 | ||
(4) | The yearly percentage change in cumulative total shareholder return of our common stock was measured as the quotient of (a) the sum of (i) the cumulative amount of dividends for the period from December 29, 2023 through and including the last day of the covered fiscal year (each one- or two-year period, the “Measurement Period”), assuming dividend reinvestment, plus (ii) the difference between stock price per share at the end and the beginning of the Measurement Period, divided by (b) stock price per share at the beginning of the Measurement Period. Each of these yearly percentage changes was then applied to a deemed fixed investment of $100 at the beginning of the Measurement Period to produce the year-end values of such investment as of the end of fiscal years 2025 and 2024, as applicable. |
(1) | Mr. Rhodes served as our principal executive officer (“PEO”) for fiscal years 2025 and 2024. For fiscal years 2025 and 2024, our non-PEO named executive officers consisted of Messrs. Mobeck and Annen. |
(2) | “Compensation Actually Paid” to our PEO in fiscal years 2025 and 2024 reflects the respective amounts set forth in the table above, adjusted as set forth in the table below, as determined in accordance with SEC rules. |
Ryan Rhodes | | 2025 | | 2024 | ||
Summary Compensation Table Total for PEO | $ | 1,742,648 | $ | 1,281,812 | ||
Less: Aggregate Change in the Actuarial Present Value of Accumulated Benefits under all Defined Benefit and Pension Plans Reported in the Summary Compensation Table |
| — |
| — | ||
Plus: Service Cost for all Defined Benefit and Pension Plans Reported in the Summary Compensation Table |
| — |
| — | ||
Plus: Prior Service Cost for all Defined Benefit and Pension Plans Reported in the Summary Compensation Table |
| — |
| — | ||
Less: Stock Award Value Reported in the Summary Compensation Table for the Covered Year | $ | (283,900) | $ | 0 | ||
Less: Option Award Value Reported in the Summary Compensation Table for the Covered Year | $ | (390,000) | $ | (427,000) | ||
Plus: Year-End Fair Value for Stock and Option Awards Granted in the Covered Year that are Outstanding and Unvested as of the Covered Year-End | $ | 1,393,319 | $ | 66,750 | ||
Plus (Less): Year-End Change in Fair Value of Stock and Option Awards Granted in Prior Years that are Outstanding and Unvested as of the Covered Year-End | $ | 35,972 | $ | (170,944) | ||
Plus: Fair Value for Stock and Option Awards Granted and Vested in the Covered Year | $ | 167,500 | $ | 29,583 | ||
Plus (Less): Change in Fair Value from the End of the Prior Fiscal Year to the Vesting Date for Stock and Option Awards Granted in Any Prior Fiscal Year Which Vested During the Covered Year | $ | (5,472) | $ | (11,611) | ||
Less: Fair Value as of Prior-Year End of Stock and Option Awards Granted in Prior Years that Failed to Vest in the Covered Year |
| — |
| — | ||
Plus: Dollar Value of Any Dividends or Other Earnings Paid on Stock and Option Awards in the Covered Year |
| — |
| — | ||
Compensation Actually Paid to PEO | $ | 2,660,067 | $ | 768,590 | ||
(3) | “Average Compensation Actually Paid” to our non-PEO named executive officers for fiscal years 2025 and 2024 reflects the respective amounts set forth in the primary table above, adjusted as set forth in the table below, as determined in accordance with SEC rules. |
Non-PEO Named Executive Officers | | 2025 | | 2024 | ||
Average Summary Compensation Table Total for Non-PEO Named Executive Officers | $ | 860,479 | $ | 738,074 | ||
Less: Average Aggregate Change in the Actuarial Present Value of Accumulated Benefits under all Defined Benefit and Pension Plans Reported in the Summary Compensation Table |
| — |
| — | ||
Plus: Average Service Cost for all Defined Benefit and Pension Plans Reported in the Summary Compensation Table |
| — |
| — | ||
Plus: Average Prior Service Cost for all Defined Benefit and Pension Plans Reported in the Summary Compensation Table |
| — |
| — | ||
Less: Average Stock Award Values Reported in the Summary Compensation Table for the Covered Year | $ | (82,025) | $ | 0 | ||
Less: Average Option Award Values Reported in the Summary Compensation Table for the Covered Year | $ | (245,438) | $ | (184,000) | ||
Plus: Average Year-End Fair Value for Stock and Option Awards Granted in the Covered Year that are Outstanding and Unvested as of the Covered Year-End | $ | 402,977 | $ | 33,333 | ||
Plus (Less): Average Year-End Change in Fair Value of Stock and Option Awards Granted in Prior Years that are Outstanding and Unvested as of the Covered Year-End | $ | 14,825 | $ | (154,403) | ||
Plus: Average Fair Value for Stock and Option Awards Granted and Vested in the Covered Year | $ | 41,147 | $ | 32,264 | ||
Plus (Less): Average Change in Fair Value from the End of the Prior Fiscal Year to the Vesting Date for Stock and Option Awards Granted in Any Prior Fiscal Year Which Vested During the Covered Year | $ | (7,663) | $ | (22,691) | ||
Less: Average Fair Value as of Prior-Year End of Stock and Option Awards Granted in Prior Years that Failed to Vest in the Covered Year |
| — |
| — | ||
Plus: Average Dollar Value of Any Dividends or Other Earnings Paid on Stock and Option Awards in the Covered Year |
| — |
| — | ||
Average Compensation Actually Paid to Non-PEO Named Executive Officers | $ | 984,302 | $ | 442,577 | ||