MANAGEMENT’S DISCUSSION AND ANALYSIS OF OPERATIONS AND FINANCIAL CONDITION
FOR THE THREE MONTHS ENDED MARCH 31, 2026
TABLE OF CONTENTS
| | | | | | | | |
| 1 | HIGHLIGHTS AND RELEVANT UPDATES | |
| 2 | CORE BUSINESS, STRATEGY AND OUTLOOK | |
| 3 | REVIEW OF FINANCIAL RESULTS | |
| 4 | REVIEW OF OPERATIONS AND MINE PERFORMANCE | |
| 5 | CONSTRUCTION, DEVELOPMENT AND OTHER CORPORATE INITIATIVES | |
| 6 | MINERAL RESERVE AND MINERAL RESOURCE ESTIMATES | |
| 7 | FINANCIAL CONDITION AND LIQUIDITY | |
| 8 | ECONOMIC TRENDS, BUSINESS RISKS AND UNCERTAINTIES | |
| 9 | CONTINGENCIES | |
| 10 | CRITICAL ACCOUNTING POLICIES AND ESTIMATES | |
| 11 | NON-GAAP FINANCIAL PERFORMANCE MEASURES | |
| 12 | CAUTIONARY STATEMENTS AND INTERNAL CONTROLS OVER FINANCIAL REPORTING | |
ALLIED GOLD
MANAGEMENT'S DISCUSSION AND ANALYSIS
For the three months ended March 31, 2026
MANAGEMENT’S DISCUSSION AND ANALYSIS OF OPERATIONS & FINANCIAL CONDITION
This Management’s Discussion and Analysis of Operations and Financial Condition (“MD&A”), authorized for issuance by the Board of Directors of the Company on May 14, 2026, should be read in conjunction with Allied Gold Corporation’s (“Allied” or the “Company”) condensed consolidated interim financial statements for the three months ended March 31, 2026 (“Condensed Consolidated Interim Financial Statements”) and the most recently issued annual consolidated financial statements for the year ended December 31, 2025 (“Consolidated Financial Statements”). All figures are in United States Dollars (“US Dollars”) unless otherwise specified. The Condensed Consolidated Interim Financial Statements have been prepared in accordance with IAS 34 “Interim Financial Reporting”, as issued by the International Accounting Standards Board (“IASB”).
The Company has included certain non-GAAP financial performance measures, which the Company believes, that together with measures determined in accordance with IFRS, provide investors with an improved ability to evaluate the underlying performance of the Company. Non-GAAP financial performance measures do not have any standardized meaning prescribed under IFRS, and therefore they may not be comparable to similar non-GAAP financial performance measures employed by other companies. The data is intended to provide additional information and should not be considered in isolation or as a substitute for measures of performance prepared in accordance with IFRS. The non-GAAP financial performance measures included in this MD&A, include:
•Cash costs per gold ounce sold (“cash costs”), for which the most directly comparable IFRS measure is cost of sales;
•All-in sustaining costs (“AISC”) per gold ounce sold, for which the most directly comparable IFRS measure is cost of sales;
•Gross profit excluding Depreciation, Depletion and Amortization (“DDA”);
•Sustaining, and non-sustaining (expansionary and exploration) capital expenditures;
•Adjusted Net Earnings (Loss), for which the most directly comparable IFRS measure is Net Earnings (Loss); and
•Earnings before Interest, Taxes, DDA ("EBITDA") and Adjusted EBITDA, for which the most directly comparable IFRS measure is Net Earnings (Loss).
Reconciliations and descriptions associated with the above non-GAAP financial performance measures can be found in Section 11: Non-GAAP Financial Performance Measures in this MD&A. In addition, each non-GAAP financial performance measure in this MD&A has been annotated with a reference to endnote (1), which are provided on the final page of this MD&A.
Cautionary statements regarding forward-looking information, mineral reserves and mineral resources and statements on internal controls over financial reporting can be found in Section 12: Cautionary Statements and Internal Controls Over Financial Reporting in this MD&A.
Additional information relating to the Company, not incorporated as part of this MD&A, including the Annual Information Form of the Resulting Issuer (as defined herein), is available on SEDAR+ at www.sedarplus.com and EDGAR at www.sec.gov.
 | 3
| 3
ALLIED GOLD
MANAGEMENT'S DISCUSSION AND ANALYSIS
For the three months ended March 31, 2026
1. HIGHLIGHTS AND RELEVANT UPDATES
Allied Gold Corporation (“Allied”, “Allied Gold” or the “Company”) is a Canadian-based emerging senior gold producer with a portfolio of three operating gold mines, a significant gold development project, and exploration properties throughout Africa, located in Mali, Côte d’Ivoire, and Ethiopia. Allied plans to continue building on this base through expansion and optimization initiatives at its existing operating assets, the development of new mines, and the advancement of its exploration projects.
Allied is positioned for substantial growth, with a path to increase sustainable production to approximately 800,000 ounces by 2029. This robust growth trajectory, expected to drive a compounded and disproportionate increase in cash flows and profitability, is underpinned by the Company's exploration success and proven track record of reserve replacement and resource growth, notably at both Sadiola and the Côte d'Ivoire mines. Additionally, the Company benefits from low-risk, phased expansion projects that can be implemented quickly, such as the Kurmuk Project in Ethiopia currently under construction, and the Sadiola expansion project.
Allied is committed to developing high-quality mining assets and delivering shareholder value and returns. This is achieved by investing in high-potential generational assets and implementing operational improvements to enhance productivity, reduce costs, and increase cash flows. The aggregate ownership of management and Board members in the Company demonstrates strong alignment with shareholders and a firm commitment to value creation.
The Company is listed on the Toronto Stock Exchange (“TSX”) and the New York Stock Exchange (“NYSE”) under the ticker symbol AAUC. In addition, its publicly traded convertible debentures are listed on the TSX, trading in U.S. dollars under the symbol AAUC.DB.U.
Operational, Earnings and Cash Flows Highlights:
For the three months ended March 31, 2026, unless otherwise noted
•Quarterly consolidated production of 96,016 gold ounces, in line with plan and representing a 14% increase over prior year comparative production, as follows:
| | | | | | | | |
| |
| For three months ended March 31, 2026 | For three months ended March 31, 2025 |
| | |
| Sadiola | 44,104 | | 45,232 | |
| Bonikro | 29,011 | | 19,671 | |
| Agbaou | 22,901 | | 19,137 | |
| Consolidated | 96,016 | | 84,040 | |
•Sales of 99,878 gold ounces, slightly higher than production due to the timing of shipments of production and sale of end of year inventory.
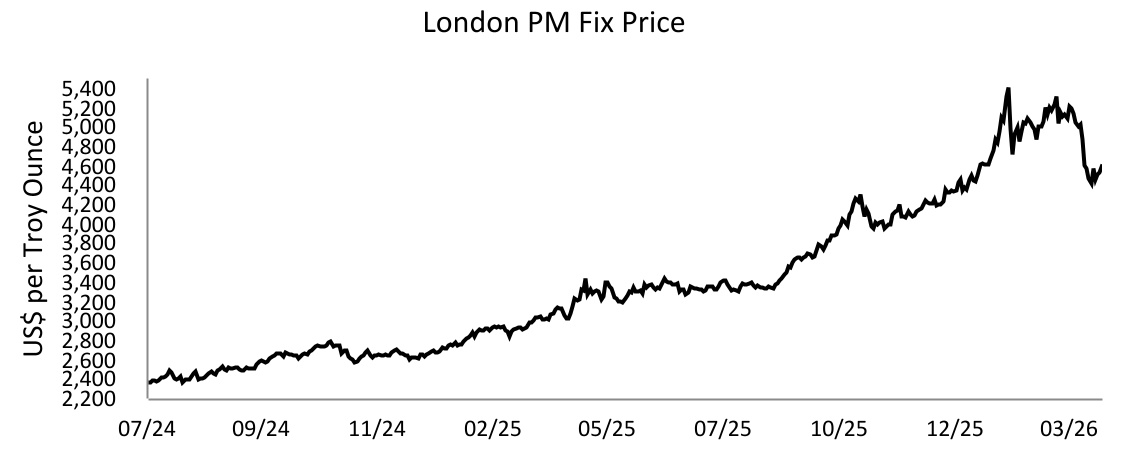
•Total cost of sales(4), cash costs(1) and AISC(1) in the first quarter were $2,235, $2,048, and $2,264, respectively, per ounce sold on a consolidated basis for the first quarter, and were in line with plan. The estimated gold price impact on first quarter AISC(1) as a result of higher royalties due to average gold prices of approximately $4,775 versus initial cost guidance at $4,250 amounts to approximately $80 per ounce.
| 4
ALLIED GOLD
MANAGEMENT'S DISCUSSION AND ANALYSIS
For the three months ended March 31, 2026
•Operating highlights by mine for the quarter as follows:
| | | | | | | | | | | | | | | | | |
For three months ended March 31, 2026 | Production Gold Ounces | Sales Gold Ounces | Cost of Sales Per Gold Ounce Sold | Cash Cost(1) Per Gold Ounce Sold | AISC(1) Per Gold Ounce Sold |
| Sadiola Gold Mine | 44,104 | | 45,995 | | $ | 2,647 | | $ | 2,538 | | $ | 2,642 | |
| Bonikro Gold Mine | 29,011 | | 31,265 | | $ | 1,691 | | $ | 1,418 | | $ | 1,628 | |
| Agbaou Gold Mine | 22,901 | | 22,618 | | $ | 2,147 | | $ | 1,922 | | $ | 2,376 | |
| Total | 96,016 | | 99,878 | | $ | 2,235 | | $ | 2,048 | | $ | 2,264 | |
•For the first quarter, Bonikro was a standout performer. As previously guided, elevated stripping and waste removal costs during the past two years were planned investments to access higher-quality ore, and results now confirm that these actions are delivering value. The program has repositioned the asset on both production and cost metrics, outperforming in the quarter relative to plan.
A similar trajectory is being established at Agbaou, which delivered production and cost performance in line with plan. Optimization initiatives and operational enhancements are in progress, with Bonikro serving as the benchmark. Agbaou is expected to follow as these measures are implemented and scaled, targeting reduced costs in the next quarters.
At Sadiola, with quarterly production tracking in line with guidance and near-term increases in throughput and feed grade planned for the next quarters, costs for the balance of the year are expected to decline, consistent with the anticipated transition from mining and feeding predominantly oxide ores to a blend dominated by higher-grade fresh mineralization. As part of the quarterly production plan, various blending strategies were progressively deployed to support the implementation of new operational practices, automation improvements, and enhanced process controls aimed at consolidating CIL circuit performance with increased fresh ore feed. This required increased ore rehandling and related expenditures during the quarter, compared to previous periods, which is expected to materially decrease going forward. Furthermore, the output of the Stage 1 crushing plant is expected to increase in the next quarter, allowing Sadiola to minimize reliance on contract crushing and rehandling, thereby reducing operating costs. As noted above, with the progressive implementation of these initiatives and other operational improvements paired with increased feed grades and throughput, a corresponding reduction of unit costs is expected over subsequent quarters. Importantly, Sadiola remains on track to deliver in excess of 200,000 ounces of production.
•As at March 31, 2026, the Company had cash and cash equivalents of $424.2 million. The Company has immediately available credit of $50.0 million (inclusive of a $10.0 million accordion) under its revolving credit facility, which remains undrawn.
•Net cash generated from operating activities for the quarter was $57.3 million. Operating cash flows before income tax paid and movements in working capital were a strong inflow of $162.7 million. Current period cash was positively impacted by strong gold sales and record high realized gold prices. Working capital impact for the first quarter is related to normal course movements in inventory (including stockpiles), timing of accounts payable, and payment of year-end accruals. As previously disclosed, certain positive impacts to working‑capital movements in the fourth quarter of 2025 were released in the first quarter of 2026, reflecting the settlement of various payables, accruals and other balance sheet items.
•Net Loss Attributable to the Shareholders to the Company (“Attributable Net Loss”) for the three months ended March 31, 2026 was $58.3 million or $(0.47) per share. Management believes that certain adjustments for items that may not be reflective of current and on-going operations are appropriate, and better reflect the underlying economic results. Adjustments include unrealized gains and losses on financial instruments and foreign exchange, along with share-based compensation largely impacted by share price movements and certain tax adjustments. After these adjustments, the Company reports Adjusted Net Earnings(1) of $48.6 million or $0.39 per share. Details of the adjustments can be found in the Summary of Financial Results discussion below.
•EBITDA(1) and Adjusted EBITDA(1) for the for the three months ended March 31, 2026 were $77.7 million and $173.3 million respectively. EBITDA(1) was impacted by unrealized mark-to-market losses on the Company's convertible debentures. The debentures will either be settled in cash at their face value at maturity, or converted at the pre-determined conversion ratio. The unrealized mark-to-market losses, which reflect fluctuations in the trading value of the publicly listed debentures, did not and will not result in cash outflows upon settlement above face value. Further, EBITDA(1) was impacted by remeasurements of contingent consideration. For consistency of showing underlying economic results, these losses are removed from the
| 5
ALLIED GOLD
MANAGEMENT'S DISCUSSION AND ANALYSIS
For the three months ended March 31, 2026
calculation of Adjusted EBITDA(1). The Company's strong Adjusted EBITDA(1) demonstrates its strong cash-flow generating ability and continued operational efficiency.
•At Kurmuk, the project continues to track well against plan, both in terms of physical completion and spend, while achieving key milestones and progress during the first quarter of 2026.
The project execution is progressing well, with the key focus during the quarter being on the logistics for the remaining equipment and materials to the site, the continued advancement of steel and mechanical erection activities, as well as the ramp-up of the electrical, control and instrumentation (“EC&I”) contractor, including the installation of medium-voltage cable, electrical-racking and lighting placement. Mining activities continue to advance toward building at least three months' worth of ore stockpiles to support the start of operations in mid-2026. The Ethiopian Electrical Power Company is advancing the power line construction, which is expected to be completed before commissioning. Pre-commissioning activities are planned to begin during the second quarter, with the first gold expected in mid-2026.
Along with the advancement of the project and as previously disclosed, the Company completed a review of the capacity of the processing plant in consideration of the ore inventory and the exploration progress at Dish Mountain, Ashashire and Tsenge. Allied made a strategic decision to maximize the operational flexibility for Kurmuk since the start of operations, and is now targeting an average processing capacity of up to 6.4 Mt/y. This increased flexibility has been incorporated into the project execution plan, with subsequent optimizations to the leaching circuit expected to be deployed in the future years to increase fresh ore recoveries. The enhancements and optimizations are expected to make Kurmuk a stronger, de-risked operation upon commencement of production, providing upside and operational flexibility, aligning with the Company’s long-term strategy of maximizing value at each of the Company's assets.
•Over the last several years, the Company has been advancing a strategy of optimization and expansion at the Sadiola Gold Mine. Initial efforts focused on stabilizing the operation, primarily related to the existing processing capacity of mostly oxide ores, followed by a phased expansion to allow the processing of fresh ore and increased throughput. The objective is to increase production and cash flows in both the short and long term.
On December 21, 2025, the Company announced that it began processing ore through the new fresh-ore comminution circuit installed as part of the Phase 1 expansion, marking a significant milestone in the transformational growth strategy for this long-life asset. The Phase 1 expansion is the first step in the Company’s strategy to increase production, reduce costs, and materially increase cash flows through a progressive expansion approach. The Phase 1 mill ramped up in the first quarter of 2026, alongside the completion of ancillary systems and power-supply upgrades. Further optimizations to the processing circuit, including instrumentation and automation upgrades, are advancing this year. Together, these initiatives are expected to improve operating performance, enhance overall processing rates, and reduce operating costs.
The Company has been advancing studies to define the best strategy for the next phase of the mine's expansion. The initial conclusion of these studies was that adding a pre-leach thickener to the circuit allows the plant to process over 90% of the fresh ore in the feed, increasing operational flexibility and potentially increasing production. Given that a pre-leach thickener is required regardless of the selected expansion scenario, the Company decided to begin engineering and design work in late 2025 in order to improve the operational flexibility and the capacity to treat fresh ore. Project execution activities began in the first quarter, with the aim of fully commissioning this addition to the circuit in the first quarter of 2027.
Furthermore, Allied concluded in the fourth quarter of 2025 that the best execution strategy for expansion at Sadiola is to progressively optimize, develop, and expand the current processing plant and ancillary infrastructure, rather than to build a new processing plant to treat fresh ore. This organic growth strategy allows for more efficient deployment of capital and management of execution risks, and it enables the same ultimate throughput of over 9 Mt/y of ore processed as defined in the previous studies, but with interim, organic steps at 7 Mt/y and 8 Mt/y. This strategy also enables the recovery improvement project and the energy program to be implemented progressively as throughput capacity expands, thereby improving capital efficiency and returns. For 2026, the Company will advance the engineering to a feasibility study level, as well as detailed engineering of the early works required for the 7 Mt/y step. In addition to this, Allied will continue advancing studies to increase recoveries for fresh ore, including test work and engineering for the Albion process, as well as new tailings dam construction, solar farm earthworks and mobilization, and further upgrades to the plant instrumentation and control systems.
•As previously disclosed, along with the advancement of the growth strategy for Sadiola, the Company is advancing its energy program for the asset and is undertaking a staged and scalable approach, initially having installed additional state-of-the-art diesel generators and control systems, followed by the implementation of a hybrid power solution, with the deployment of
| 6
ALLIED GOLD
MANAGEMENT'S DISCUSSION AND ANALYSIS
For the three months ended March 31, 2026
more efficient medium-speed thermal units, and a photovoltaic plant with battery energy storage systems (“BESS”) sufficient to meet the power requirements of the Phase 1 expansion at reduced costs. The systems will then be scaled up to satisfy the energy needs of the next phase expansion, providing Sadiola with a flexible power solution capable of meeting its ultimate power needs, while being self-reliant, efficient and cost-effective. Please refer to the Sadiola Energy Program section for further details.
•In relation to the exploration program at Côte d’Ivoire, first quarter activities reflect a continuation of the programs initiated in prior periods, with the objective of translating drilling and technical work into tangible mine life extensions and improvements to mine plans. The results to date provide a solid foundation, and the expectation is to provide an update for CDI by mid-year and for Sadiola and Kurmuk in the second half of 2026.
At Agbaou, ongoing infill drilling, both within and below a $2,000 pit shell, has demonstrated the continuity of the mineralized lenses with infill drilling focused on converting Inferred Mineral Resources to Indicated Mineral Resources as a necessary step to defining new reserves . Current results support the case for extending mine life beyond what is currently defined, with ongoing work aimed to complete de-risking and validating this potential. In parallel, the underground opportunity is gaining traction. Early-stage evaluation and drilling are focused on defining the scale and down-plunge continuity of mineralization, with the objective of establishing a complementary production profile to the open pit.
At Bonikro, exploration efforts remain active, with increased emphasis on the Oumé and Hiré districts. These areas represents a strategic priority, with ongoing work aimed at identifying additional targets to support growing a pipeline of future development opportunities to support long-term growth.
•As of December 31, 2025, Proven and Probable Mineral Reserves were reported at 11.2 million ounces of gold, contained within 247.1 million tonnes at a grade of 1.41 g/t. This represents a net year-over-year increase, reflecting the addition of new Mineral Reserves, replacing depletion from 2025 production, and updates to economic and design assumptions. Total Measured and Indicated Mineral Resources stood at 15.3 million ounces of gold, contained within 336.7 million tonnes at a grade of 1.41 g/t. The modest decrease from 2024 is primarily attributable to the recategorization of some Indicated Mineral Resources to Inferred Mineral Resources. Inferred Mineral Resources, at year-end totalled 2.1 million ounces contained within 54.2 million tonnes at a grade of 1.20 g/t.
Financing and Corporate Development Highlights:
Transaction with Zijin Gold
The Company is advancing the transaction with Zijin Gold International Company Limited ("Zijin Gold") after entering into a definitive agreement (the "Arrangement Agreement" or the "Agreement") as previously disclosed. Zijin Gold, a public company listed on the Hong Kong Stock Exchange, agreed to acquire all of the issued and outstanding shares of Allied Gold at a price of C$44 per share (the “Offer Price”) in cash, pursuant to the terms of a court-approved plan of arrangement under the Business Corporations Act (Ontario) (the "Arrangement"). The Company's Board of Directors determined that the Arrangement immediately achieved fair value realization while mitigating business risks, particularly in highly volatile markets, and Zijin Gold had demonstrated a strong track record of long-term asset stewardship and consequently, there was a suspension of the other strategic opportunities. The transaction value of the Arrangement is approximately C$5.5 billion, realizing a significant, certain and immediate value for Allied Gold shareholders. Further details on the benefits of the Arrangement can be found in the Company's previous public disclosure filed on SEDAR+.
As previously disclosed, all requisite shareholder and court approvals have been obtained.
The Company and Zijin Gold are in continuous dialogue, planning for an orderly transition on completion of the Arrangement. Both companies continue to engage diligently and cooperatively with regulatory bodies pursuant to previously filed applications for regulatory approvals necessary to complete the Arrangement with the objective of closing in a timely manner within the timeframe set out in the Arrangement Agreement. The Arrangement Agreement provides for an outside date for closing of May 29, 2026, subject to extension by the parties if by that date any regulatory approvals or other conditions precedent are still in progress. Both companies continue to demonstrate a strong commitment to complete the transaction in accordance with the Arrangement Agreement.
| 7
ALLIED GOLD
MANAGEMENT'S DISCUSSION AND ANALYSIS
For the three months ended March 31, 2026
Sustainability, Health and Safety Highlights:
Sustainability:
The Company's sustainability framework includes principles and expectations which are to be implemented to build a common understanding and approach to sustainability performance. The frameworks has the objective of enhancing the integration of sustainability within the Company’s strategy, operational processes, and culture.
During the first quarter of 2026, the Company continued supporting the development of its "We think safety, we act safely” culture, and finalized the development of the 2026 annual plan.
Health and Safety:
All rates are calculated on a 1,000,000 exposure-hour basis.
The Company’s Total Recordable Injury Rate (“TRIR”) for the three months ended March 31, 2026 was 1.80, compared to 1.21 for the 12 months ended December 31, 2025.
In terms of Lost Time Injuries (“LTI”), the Company reported three LTI for the three months ended March 31, 2026, which results in a Company Lost Time Injury rate (“LTIR”) for the three months ended March 31, 2026 of 0.45, compared to a LTIR of 0.29 for the 12 months ended December 31, 2025.
Environment and Social:
The Company did not report any significant Environmental Incidents for the three months ended March 31, 2026.
The Company did not report any significant Social Incidents for the three months ended March 31, 2026.
Summary of Operational Results
| | | | | | | | | | |
| | For three months ended March 31, |
| | | 2026 | 2025 |
| Gold ounces | | | | |
| Production | | | 96,016 | | 84,040 | |
Sales(8) | | | 99,878 | | 131,520 | |
| Per Gold Ounce Sold | | | | |
Total Cost of Sales(4) | | | $ | 2,235 | | $ | 1,838 | |
Cash Costs(1) | | | $ | 2,048 | | $ | 1,656 | |
AISC(1) | | | $ | 2,264 | | $ | 1,811 | |
| | | | |
| | | | |
| Average revenue per ounce for at-market sales* | | | 4,775 | | 2,839 | |
| | | | |
| Average market price per ounce | | | $ | 4,873 | | $ | 2,860 | |
*Average revenue per ounce sold differs from average revenue per ounce for at-market sales predominantly due to hedge settlements and sales made under streams. For the first quarter, the impact of hedge settlements was $646/ounce (first quarter of 2025 - $18/ounce) and the impact of stream, in-kind dividends and IFRS 15 adjustments was $193/per ounce (first quarter of 2025 - $15/ounce).
Gold production of 96,016 ounces during the three months ended March 31, 2026, compared to 84,040 ounces during the comparative prior period. The increase was predominantly driven by production growth at Bonikro and Agbaou in the first quarter of 2026, resulting from the benefits of stripping work executed in prior quarters, as anticipated.
Total cost of sales(4) of $2,235 for the three months ended March 31, 2026 compared to $1,838 during the comparative prior period. Cash costs(1) on a per gold ounce sold basis of $2,048 for the three months ended March 31, 2026, compared to $1,656 during the comparative prior period. AISC(1) for the current quarter of $2,264 compared to the comparative period AISC(1) of $1,811 per gold ounce. For the quarter, unit costs per ounce sold on a consolidated basis for the first quarter, and were in line with plan. The estimated gold price impact
| 8
ALLIED GOLD
MANAGEMENT'S DISCUSSION AND ANALYSIS
For the three months ended March 31, 2026
on first quarter AISC(1) as a result of higher royalties due to average gold prices of approximately $4,775 versus initial cost guidance at $4,250 amounts to approximately $80 per ounce.
Gold sales(8) of 99,878 ounces for three months ended March 31, 2026 compared to 131,520 ounces sold in the comparative period quarter. The variance in sales ounces is associated with the comparative prior year period, which was positively impacted by Korali-Sud gold production for the fourth quarter of 2024 being sold early in 2025, as previously disclosed.
Summary of Financial Results:
| | | | | | | | | | |
(In thousands of US Dollars, except for shares and per share amounts) (Unaudited) | | For three months ended March 31, |
| | 2026 | 2025 |
| Revenue | | | $ | 394,110 | | $ | 346,407 | |
| Cost of sales, excluding depreciation, depletion and amortization ("DDA") | | | (203,259) | | (207,792) | |
Gross profit excluding DDA(1) | | | $ | 190,851 | | $ | 138,615 | |
| DDA | | | (19,923) | | (18,957) | |
Gross profit | | | $ | 170,928 | | $ | 119,658 | |
| General and administrative expenses | | | $ | (69,158) | | $ | (18,852) | |
| Exploration and evaluation expenses | | | (3,618) | | (3,527) | |
| | | | |
Loss on revaluation of financial instruments | | | (37,839) | | (14,116) | |
| | | | |
| | | | |
Other (losses) income | | | (2,527) | | 1,128 | |
Net earnings before finance costs and income tax | | | $ | 57,786 | | $ | 84,291 | |
| Finance income (costs) | | | (5,798) | | (5,310) | |
Net earnings before income tax | | | 51,988 | | 78,981 | |
Current income tax expense | | | $ | (64,835) | | $ | (27,700) | |
Deferred income tax expense | | | (31,617) | | (11,344) | |
Net (loss) earnings for the period | | | $ | (44,464) | | $ | 39,937 | |
| | | | |
(Loss) earnings attributable to: | | | | |
| Shareholders of the Company | | | $ | (58,326) | | $ | 15,124 | |
| Non-controlling interests | | | 13,862 | | 24,813 | |
Net (loss) earnings for the period | | | $ | (44,464) | | $ | 39,937 | |
| | | | |
Net (loss) earnings per share attributable to shareholders of the Company | | | | |
| Basic | | | $ | (0.47) | | $ | 0.14 | |
| Diluted | | | $ | (0.47) | | $ | 0.13 | |
| | | | |
Attributable Net Loss for the three months ended March 31, 2026 was $58.3 million, compared to an Attributable Net Earnings $15.1 million in the comparative prior year period. After the adjustments noted below, the Company reports an Adjusted Net Earnings(1) of $48.6 million for the current period, compared to Adjusted Net Earnings(1) of $45.1 million in the comparative prior year period.
EBITDA(1) and Adjusted EBITDA(1) for the for the three months ended March 31, 2026 were $77.7 million and $173.3 million respectively, compared to $103.2 million and $133.8 million in the comparative prior year period. EBITDA(1) was impacted by unrealized mark-to-market losses on the Company's convertible debentures. The debentures will either be settled in cash at their face value at maturity, or converted at the pre-determined conversion ratio. The unrealized mark-to-market losses, which reflect fluctuations in the trading value of the publicly listed debentures, did not and will not result in cash outflows upon settlement above face value. Further, EBITDA(1) was impacted by remeasurements of contingent consideration. For consistency of showing underlying economic results, these losses are removed from the calculation of Adjusted EBITDA(1). The Company's strong Adjusted EBITDA(1) demonstrates its strong cash-flow generating ability and continued operational efficiency.
| 9
ALLIED GOLD
MANAGEMENT'S DISCUSSION AND ANALYSIS
For the three months ended March 31, 2026
Further details on Adjusted Net Earnings(1) can be found in the table that follows, while details on EBITDA(1) and Adjusted EBITDA(1) can be found in Section 11: Non-GAAP Financial Performance Measures.
| | | | | | | | | | |
| (In thousands of US Dollars, except per share amounts) | | For three months ended March 31, |
| | 2026 | 2025 |
Net (Loss) Earnings attributable to Shareholders of the Company | | | $ | (58,326) | | $ | 15,124 | |
Net (Loss) Earnings attributable to Shareholders of the Company per Share | | | $ | (0.47) | | $ | 0.14 | |
| | | | |
| | | | |
Loss on revaluation of financial instruments | | | 37,839 | | 14,116 | |
| Depreciation of Korali share-based payment for permit | | | — | | 3,880 | |
| | | | |
| Foreign exchange | | | 3,427 | | 3,043 | |
| Share-based compensation | | | 55,200 | | 4,107 | |
| Other | | | 2,620 | | 10,949 | |
| Tax adjustments | | | 7,839 | | (6,146) | |
Total increase to Attributable Net Earnings(2) | | | $ | 106,925 | | $ | 29,949 | |
Total increase to Attributable Net Earnings(2) per share | | | $ | 0.85 | | $ | 0.27 | |
Adjusted Net Earnings(1) | | | $ | 48,599 | | $ | 45,073 | |
Adjusted Net Earnings(1) per Share | | | $ | 0.39 | | $ | 0.41 | |
The current period was impacted by revaluations of financial instruments and the mark-to-market of the Company's publicly traded debt, foreign exchange, shared-based compensation, along with tax adjustments. Earnings for the prior year were impacted by similar matters.
The Company did not pay any dividends or have distributions to shareholders during the three months ended March 31, 2026 or 2025.
| | | | | | | | | | |
| (In thousands of US Dollars) | | For three months ended March 31, |
| | | 2026 | 2025 |
Operating cash flows before income tax paid and working capital(6) | | | $ | 162,714 | | $ | 100,788 | |
| Income tax paid | | | $ | (10,468) | | $ | (7,904) | |
| | | | |
Operating cash flows before movements in working capital(6) | | | $ | 152,246 | | $ | 92,884 | |
Working capital movement(6) | | | (94,953) | | 28,246 | |
Net cash generated from Operating activities | | | $ | 57,293 | | $ | 121,130 | |
Net cash used in Investing activities | | | (109,330) | | (103,870) | |
Net cash used in Financing activities | | | (256) | | (6,677) | |
Net (decrease) increase in cash and cash equivalents | | | $ | (52,293) | | $ | 10,583 | |
Net cash generated from operating activities for the three months ended March 31, 2026 was $57.3 million. This compares to $121.1 million in the prior year comparative quarter. Current period cash was positively impacted by strong gold sales and record high realized gold prices. Prior year cash flows were positively impacted by the sale of Korali inventory in the first quarter of 2025 from 2024 which significantly increased sales quantities, while positively impacting working capital due to the sale. Working capital impact for the first quarter is related to normal course movements in inventory (including stockpiles), timing of accounts payable, and payment of year-end accruals. As previously disclosed, certain positive impacts to working‑capital movements in the fourth quarter of 2025 were released in the first quarter of 2026, reflecting the settlement of various payables, accruals and other balance sheet items.
Operating cash flows before income tax paid and movements in working capital for the three months ended March 31, 2026 increased significantly, at an inflow of $162.7 million compared with the prior year comparative quarter inflow of $100.8 million. This was due to higher realized gold prices. The impact of higher prices was partially offset by lower ounces sold in the current period in association with the sale of Korali inventory in the first quarter of 2025.
As at March 31, 2026, the Company had cash and cash equivalents of $424.2 million, compared with $479.8 million as at December 31, 2025.
| 10
ALLIED GOLD
MANAGEMENT'S DISCUSSION AND ANALYSIS
For the three months ended March 31, 2026
Summary of Capital Expenditures
| | | | | | | | | | | | | | | | | | | | | | | | | | |
| | | | | | | | |
| | | | |
| | | | | | | | |
| | | | | | | | |
| | | | | | | | |
| | | | | | | | |
| | | | | | | | |
| | | | | | | | |
| | | | | | | | |
For three months ended March 31, | 2026 | 2025 | 2026 | 2025 | 2026 | 2025 | 2026 | 2025 |
| (In thousands of US Dollars) | Sustaining(1) | Expansionary(1) | Exploration(1) | Total |
| Sadiola | $ | 714 | | $ | 1,109 | | $ | 7,895 | | $ | 3,051 | | $ | 185 | | $ | 113 | | $ | 8,794 | | $ | 4,273 | |
| Bonikro | 902 | | 14,928 | | — | | 48 | | 2,453 | | 1,975 | | 3,355 | | 16,951 | |
| Agbaou | 8,445 | | 10,831 | | — | | 31 | | 1,380 | | 688 | | 9,825 | | 11,550 | |
| Kurmuk and Ethiopia | — | | — | | 82,275 | | 56,161 | | 1,168 | | — | | 83,443 | | 56,161 | |
| Capitalized borrowings and Other | — | | 74 | | 13,060 | | 8,166 | | — | | — | | 13,060 | | 8,240 | |
| Total | $ | 10,061 | | $ | 26,942 | | $ | 103,230 | | $ | 67,457 | | $ | 5,186 | | $ | 2,776 | | $ | 118,477 | | $ | 97,175 | |
All expenditures associated with Ethiopia and Kurmuk for the period are classified as Expansionary in nature, including project costs and office costs but excluding capitalized borrowing costs under IFRS and VAT recoverable. Exploration activities in the current year have been disclosed separately. All IFRS capitalized borrowing costs are disclosed under Capitalized borrowings and Other.
2. CORE BUSINESS, STRATEGY AND OUTLOOK
Allied Gold is a Canadian-based emerging senior gold producer with a portfolio of three operating gold mines, a significant gold development project, and exploration properties throughout Africa, located in Mali, Côte d’Ivoire, and Ethiopia. Allied plans to continue building on this base through expansion and optimization initiatives at its existing operating assets, the development of new mines, and the advancement of its exploration projects.
Allied’s principal mining properties comprise the Sadiola gold mine in the Kayes Region of West Mali (80% ownership), which includes the Korali-Sud open pit gold mine (65% ownership), the Bonikro (89.89% ownership) and Agbaou (85% ownership) gold mines in Côte d’Ivoire, and the Kurmuk gold development project in Ethiopia (100% ownership(7)).
Allied is positioned for substantial growth, with a path to increase sustainable production to approximately 800,000 ounces by 2029. This robust growth trajectory, expected to drive a compounded and disproportionate increase in cash flows and profitability, is underpinned by the Company's exploration success and proven track record of reserve replacement and resource growth, notably at both Sadiola and the Côte d'Ivoire mines. Additionally, the Company benefits from low-risk, phased expansion projects that can be implemented quickly, such as the Kurmuk Project in Ethiopia currently under construction, and the Sadiola expansion project.
The Company is listed on the Toronto Stock Exchange (“TSX”) and the New York Stock Exchange (“NYSE”) under the ticker symbol AAUC. In addition, its publicly traded convertible debentures are listed on the TSX, trading in U.S. dollars under the symbol AAUC.DB.U.
| 11
ALLIED GOLD
MANAGEMENT'S DISCUSSION AND ANALYSIS
For the three months ended March 31, 2026
3. REVIEW OF FINANCIAL RESULTS
For the three months ended March 31, 2026
Revenue
Revenue of $394.1 million for the three months ended March 31, 2026, compared to $346.4 million in the comparative prior year period. The significant change in revenue was driven by an increase in average revenue per ounce of 40% as a result of higher gold prices versus the comparative period, partially offset by a decrease in sales quantities of 31,642 ounces, or 24%. The variance in sales ounces is associated with the comparative prior year period, which was positively impacted by Korali-Sud gold production for the fourth quarter of 2024 being sold early in 2025, as previously disclosed.
The average realized gold price during the period, net of the impact of sales under the streaming arrangements and the settlement of gold collars, was $1,122/ounce higher, at $3,936/ounce compared to $2,814/ounce in the comparative prior period quarter.
Cost of sales, excluding DDA
Cost of sales, excluding DDA, of $203.3 million for the three months ended March 31, 2026, compared to $207.8 million in 2025. The decrease in Cost of Sales, excluding DDA was predominantly impacted by the anticipated and guided costs of production for the current year in relation to those from the prior year. Further, and importantly, current period costs were impacted by the increase in royalties associated with significantly higher gold prices. The prior year comparative quarter was also further impacted by the aforementioned delay in sale of Korali-Sud gold sold during the first quarter of 2025, which impacted the comparative cost of sales.
DDA
Total DDA(4) of $19.9 million for the three months ended March 31, 2026, was higher than the $19.0 million in the comparative prior year quarter. The increase is mostly attributable to the increase in deferred stripping capitalized during 2025 and their amortization in the first quarter of 2026, particularly at Bonikro and Agbaou. This has been partially offset by the change in ounces sold. Further, in connection with the definitive protocol agreement signed with the Government of Mali during the third quarter of 2024, the Company’s Korali-Sud mine and related assets were transferred to a new entity, Korali S.A., incorporated on January 8, 2025, and 35% of the ownership interests in the new entity were issued to the Government of Mali. The issuance of subsidiary shares is considered a share-based payment in exchange for the issuance of a definitive exploitation permit for large-scale mining and processing of ore mined at Korali at the Sadiola Plant, which is valued with reference to the fair value of the subsidiary shares granted. $6.0 million of the cost capitalized to the Korali mine was depreciated during the quarter ended March 31, 2025. The Company’s assets subject to DDA include a substantial amount of mining interests and PP&E, that are based on purchase price accounting and fair values from the mine acquisitions.
General and administrative expenses
Administrative expenses include costs related to the overall management of the business that are not part of direct mine operating costs.
For the three months ended March 31, 2026, administrative expenses excluding share-based expenses were $14.0 million, compared to $14.7 million in the comparative prior year quarter.
Share-based expense is impacted by volatility and share price performance, resulting in a mark-to-market and amortization of outstanding units, and are paid or issued based on future vesting and performance. As the Company’s stock gained over 36% in the first quarter alone, stock-based compensation for the first quarter increased accordingly, along with the normal course issuance of units during the year.
As costs further decrease, and production increases, the per ounce cost of general and administrative expenses will decrease more than
commensurately. The Company is establishing an administrative construct that supports growth from 375,000 ounces, to the near-term production plan of 600,000 ounces. Ultimately this will support a production platform of over one million ounces, targeting five to seven mines, without the requirement for additional significant overhead support, and costs decreasing meaningfully on a per ounce basis. Further, certain expenditures were incurred in different comparative prior year periods, resulting in expenditure volatility between quarters.
| 12
ALLIED GOLD
MANAGEMENT'S DISCUSSION AND ANALYSIS
For the three months ended March 31, 2026
Exploration expenses
Exploration expenses relate to exploration campaigns carried out at each site, described in detail within this MD&A.
Loss on revaluation of financial instruments
The result for the three months ended March 31, 2026 relates to the following items, with the most significant components of the current period result being related to the convertible debt valuation and deferred consideration.
•The revaluation of the convertible debenture and its associated unrealized mark-to-market impact, due to an increase in the observable market price of the debenture. The debentures will be either settled in cash at their face value or converted based on the predetermined conversion ratio. The unrealized mark-to-market losses, which reflect fluctuations in the trading value of the publicly listed debentures, did not and will not result in cash outflows upon settlement above face value.
•The revaluation of the contingent consideration to Agbaou, predominantly associated with higher consensus market prices.
•Then, to a smaller extent and not individually significant:
◦A portion of sales from the Bonikro Mine are subject to an offtake sales agreement. Pricing for this gold is based on a Quotational Period of six days and a loss is recorded in earnings as incurred, and
◦the revaluation of contingent consideration on the expected Net Smelter Return “NSR” royalty obligation that was part of the acquisition of the Agbaou Mine. The contingent consideration is revalued on each balance sheet date to include the latest life of mine production estimates and expected future gold prices.
Other (loss) income
Other loss for the three months ended March 31, 2026 was $2.5 million, compared to a gain of $1.1 million in the comparative prior year quarter.
Other losses for the current period and prior period are not significant and have no individually significant components.
Finance costs
Finance costs of $5.8 million for the three months ended March 31, 2026 were comparable to the finance costs of $5.3 million in the prior year comparative quarter. The costs comprise three major categories, as follows:
•Interest on Borrowings. Interest expense was $2.3 million, compared to $2.3 million in the comparative prior year quarter. Interest is related to the convertible debentures issued on September 7, 2023. Details on the Company’s borrowings can be found in the Financial Condition and Liquidity section of this MD&A.
•During the period, the Company capitalized interest of $13.1 million, associated with the construction of the Kurmuk project compared to $7.0 million in the comparative prior period.
•Other Non-Cash Finance Cost was $13.1 million compared to $6.9 million in the comparative prior quarter. These non-cash charges relate to accretion of asset retirement obligation liabilities, accretion of deferred consideration, and the calculated interest charge on the stream agreements (refer to the Condensed Consolidated Interim Financial Statements for further details).
•Current period costs included a loss of $3.4 million in foreign currency ($3.0 million loss in the prior year comparative period).
Income tax expense
Income tax expense was $96.5 million for the three months ended March 31, 2026 and reflects a current income tax expense of $64.8 million and a deferred income tax expense of $31.6 million. This compares to a total tax expense in the prior year comparative quarter of $39.0 million, with current income tax expense of $27.7 million and a deferred income tax expense of $11.3 million. The increase in income tax is related to the increase in revenue and the non-recognition of deferred tax assets.
The effective tax rate is subject to a number of factors including the source of income between different countries, different tax rates in the various jurisdictions, the recognition of deferred tax assets when applicable, foreign currency exchange movements, changes in tax laws and the impact of specific transactions and assessments. The high effective tax rate is the result of the tax impact of costs incurred in non-taxable jurisdictions which include general and administrative expenses, borrowing costs, hedging market-to-market and other non-operational expenses, while the underlying operations recorded income before tax. The effective tax rate on operations was approximately 42%, which is more in line with statutory rates.
| 13
ALLIED GOLD
MANAGEMENT'S DISCUSSION AND ANALYSIS
For the three months ended March 31, 2026
The Company operates in the following tax jurisdictions: Côte d’Ivoire, where the statutory tax rate is 25%; Mali, where the statutory tax rate is 30%; Ethiopia where the statutory tax rate is 25%; and Canada, where the combined federal and provincial statutory tax rate is 26.5%. The Company does not anticipate the statutory tax rates to change in the jurisdictions it operates in for the foreseeable future; therefore, there should be no impact on the calculation of the current or deferred tax expense in the period.
New taxation developments - OECD Pillar Two Model Rules
In June 2024, the Government of Canada enacted the Global Minimum Tax Act (“GMTA”) that was developed within the framework of the Organization for Economic Co-operation and Development (OECD)’s Pillar Two Model rules. The GMTA includes the introduction of a 15% global minimum tax that applies to large multinational enterprise groups with global consolidated revenues over €750 million for two out of the past four years. However, this legislation does not currently apply to the Company as 2025 was the first year that revenue exceeded €750 million. The effective tax rates in the jurisdictions in which the Company operate are above 15% and the Company does not expect a potential exposure to the global minimum tax when the rules apply to us in the future.
QUARTERLY FINANCIAL INFORMATION
| | | | | | | | | | | | | | | | | | | | | | | | | | |
| (In thousands of US Dollars) | Q1 2026 | Q4 2025 | Q3 2025 | Q2 2025 | Q1 2025 | Q4 2024 | Q3 2024 | Q2 2024 |
| Revenue | $ | 394,110 | | $ | 427,820 | | $ | 305,618 | | $ | 251,979 | | $ | 346,407 | | $ | 170,846 | | $ | 188,855 | | $ | 195,614 | |
(Loss) earnings attributable to shareholders | (58,326) | | (23,644) | | (17,917) | | (25,410) | | 15,124 | | (10,280) | | (107,965) | | 8,298 | |
(Loss) earnings per share attributable to shareholders of the Company | | | | | | | | |
| | | | | | | | |
| Basic | (0.47) | | (0.19) | | (0.15) | | (0.22) | | 0.14 | | (0.10) | | (1.28) | | 0.10 | |
| Diluted | (0.47) | | (0.19) | | (0.15) | | (0.22) | | 0.13 | | (0.10) | | (1.28) | | 0.09 | |
| 14
ALLIED GOLD
MANAGEMENT'S DISCUSSION AND ANALYSIS
For the three months ended March 31, 2026
4. REVIEW OF OPERATIONS AND MINE PERFORMANCE
Sadiola (80% interest), Mali
Sadiola comprises the Sadiola (80% interest) open pit gold mine, located in the Kayes region of Mali, as well as the Korali-Sud open pit gold mine (65% interest), 15 kilometres south of the processing plant at Sadiola. The remaining ownership in Sadiola is retained by the Government of Mali.
| | | | | | | | | | |
Sadiola Key Performance Information
(100% Basis) | | For three months ended March 31, |
| | 2026 | 2025 |
| Operating | | | | |
| Ore mined (M tonnes) | | | 1.94 | | 1.98 | |
| Waste mined (M tonnes) | | | 7.28 | | 6.06 | |
| Ore processed (M tonnes) | | | 1.28 | | 1.17 | |
| Gold | | | | |
| Production (Ounces) | | | 44,104 | | 45,232 | |
Sales(8) (Ounces) | | | 45,995 | | 92,033 | |
| Feed grade (g/t) | | | 1.36 | | 1.36 | |
| Recovery rate (%) | | | 81.4 | % | 89.3 | % |
Total cost of sales per ounce sold(4) | | | $ | 2,647 | | $ | 1,941 | |
Cash costs per ounce sold(1) | | | $ | 2,538 | | $ | 1,755 | |
AISC per ounce sold(1) | | | $ | 2,642 | | $ | 1,799 | |
Financial (In thousands of US Dollars) | | | | |
| Revenue | | | $ | 189,700 | | $ | 234,445 | |
| Cost of sales (excluding DDA) | | | (116,954) | | (152,416) | |
Gross profit excluding DDA(1) | | | $ | 72,746 | | $ | 82,029 | |
| DDA | | | (4,797) | | (10,375) | |
| Gross Profit | | | $ | 67,949 | | $ | 71,654 | |
Capital Expenditures (In thousands of US Dollars) | | | | |
Sustaining(1) | | | $ | 714 | | $ | 1,109 | |
Expansionary(1) | | | 7,895 | | 3,051 | |
Exploration(1) | | | 185 | | 113 | |
For the three months ended March 31, 2026, Sadiola produced 44,104 ounces of gold, compared to the 45,232 ounces produced in the comparative prior year quarter and aligned with the production plan. Production is expected to increase sequentially in the next quarter as result of increased grades and throughput. Sadiola remains on track to deliver in excess of 200,000 ounces of production.
Production in the first quarter of 2026 reflects the feed of transitional ore and oxide material from the Sadiola main pit and Sekekoto, supplemented by other oxide opportunities identified in late 2025. In parallel, the Phase 1 plant ramp-up progressed throughout the quarter, supported by the installation of new mill liners, instrumentation upgrades, improved process control, and other optimization initiatives.
With the continued ramp-up of mining capacity, ongoing processing optimization initiatives, and the flexibility to treat increased volumes of fresh ore, the operation is entering a phase of greater consistency and efficiency. These improvements are expected to translate into stronger throughput, improved feed grades and enhanced margin performance through the remainder of 2026.
Total cost of sales(4) and AISC(1) for the quarter of $2,647 and $2,642, respectively, per ounce sold on a consolidated basis for the first quarter, and were in line with plan. The estimated gold price impact on first quarter AISC(1) as a result of higher royalties due to average gold prices of approximately $4,775 versus initial cost guidance at $4,250 amounts to approximately $80 per ounce. For the quarter, with
| 15
ALLIED GOLD
MANAGEMENT'S DISCUSSION AND ANALYSIS
For the three months ended March 31, 2026
quarterly production tracking in line with guidance and near-term increases in throughput and feed grade planned for the next quarters, costs for the balance of the year are expected to decline, consistent with the anticipated transition from mining and feeding predominantly oxide ores to a blend dominated by higher-grade fresh mineralization. As part of the quarterly production plan, various blending strategies were progressively deployed to support the implementation of new operational practices, automation improvements, and enhanced process controls aimed at consolidating CIL circuit performance with increased fresh ore feed. This required increased ore rehandling and related expenditures during the quarter, compared to previous periods, which is expected to materially decrease going forward. Furthermore, the output of the Stage 1 crushing plant is expected to increase in the next quarter, allowing Sadiola to minimize reliance on contract crushing and rehandling, thereby reducing operating costs. As noted above, with the progressive implementation of these initiatives and other operational improvements paired with increased feed grades and throughput, a corresponding reduction of unit costs is expected over subsequent quarters.
Gold sales for the current quarter were slightly higher than production, with small differences attributable to the timing of shipments. Sales in the prior year comparative quarter significantly exceeded production due to the sale of Korali inventory produced in the fourth quarter of 2024.
As disclosed in the Company's press release dated April 28, 2026, in light of recent events in Mali involving the conflicts between government and insurgent groups, the Company continues to monitor the situation and take precautions to ensure the safety and wellbeing of persons employed by the Company in the country.
Sadiola Expansion Project
Over the last several years, the Company has been advancing a strategy of optimization and expansion at the Sadiola Gold Mine. Initial efforts focused on stabilizing the operation, primarily related to the existing processing capacity of mostly oxide ores, followed by a phased expansion to allow the processing of fresh ore and increased throughput. The objective is to increase production and cash flows in both the short and long term.
On December 21, 2025, the Company announced that it began processing ore through the new fresh-ore comminution circuit installed as part of the Phase 1 expansion, marking a significant milestone in the transformational growth strategy for this long-life asset. The Phase 1 expansion is the first step in the Company’s strategy to increase production, reduce costs, and materially increase cash flows through a progressive expansion approach. The Phase 1 mill ramped up in the first quarter of 2026, alongside the completion of ancillary systems and power-supply upgrades. Further optimizations to the processing circuit, including instrumentation and automation upgrades, are advancing this year. Together, these initiatives are expected to improve operating performance, enhance overall processing rates, and reduce operating costs.
The Company has been advancing studies to define the best strategy for the next phase of the mine's expansion. The initial conclusion of these studies was that adding a pre-leach thickener to the circuit allows the plant to process over 90% of the fresh ore in the feed, increasing operational flexibility and potentially increasing production. Given that a pre-leach thickener is required regardless of the selected expansion scenario, the Company decided to begin engineering and design work in late 2025 in order to improve the operational flexibility and the capacity to treat fresh ore. Project execution activities began in the first quarter, with the aim of fully commissioning this addition to the circuit in the first quarter of 2027.
Allied concluded in the fourth quarter of 2025 that the best execution strategy for expansion at Sadiola is to progressively optimize, develop, and expand the current processing plant and ancillary infrastructure, rather than to build a new processing plant to treat fresh ore. This organic growth strategy allows for more efficient deployment of capital and management of execution risks, and it enables the same ultimate throughput of over 9 Mt/y of ore processed as defined in the previous studies, but with interim, organic steps at 7 Mt/y and 8 Mt/y. This strategy also enables the recovery improvement project and the energy program to be implemented progressively as throughput capacity expands, thereby improving capital efficiency and returns. For 2026, the Company will advance the engineering to a feasibility study level, as well as detailed engineering of the early works required for the 7 Mt/y step. In addition to this, Allied will continue advancing studies to increase recoveries for fresh ore, including test work and engineering for the Albion process, as well as new tailings dam construction, solar farm earthworks and mobilization, and further upgrades to the plant instrumentation and control systems.
The total capital expenditures for the 7 Mt/y step of the processing plant are estimated at approximately $200 million, including engineering and construction of a permanent two-stage crushing plant and a grinding mill in the second line of the Sadiola plant, which are planned to be developed between late 2026 and late 2028. The subsequent 8 Mt/y and 9 Mt/y per year steps consist of adding a permanent tertiary crushing circuit and wet plant upgrades, respectively, and could be executed sequentially or concurrently, along with related expansions to power generation and ancillary facilities.
| 16
ALLIED GOLD
MANAGEMENT'S DISCUSSION AND ANALYSIS
For the three months ended March 31, 2026
At the 7 Mt/y throughput, the plant configuration will include the existing Stage 1 three-stage crushing circuit operating in parallel with a new two-stage crushing circuit. Downstream, the comminution circuit will comprise two parallel milling circuits (Stage 1 and a new mill already owned by the Company), producing a final grind of P80 75 μm. The remainder of the flowsheet will include a pre-leach thickener, pre-oxidation, cyanidation, and carbon adsorption, utilizing the existing facilities and remaining consistent with the general processing path defined for Sadiola in the previous technical work.
Sadiola Energy Program
Along with the advancement of the growth strategy for Sadiola, the Company is advancing its energy program for the asset and is undertaking a staged and scalable approach, having initially installed additional diesel generators and control systems to support the start of operations of the first phase expansion, followed by the implementation of a hybrid power solution, with the deployment of medium-speed thermal units and a photovoltaic plant with battery energy storage systems (“BESS”) sufficient to meet the power requirements of the Phase 1 expansion at reduced costs and providing the base for a scalable system capable of satisfying the energy needs of the next phase expansion, thereby providing Sadiola with a flexible power solution capable of meeting its ultimate power needs and reducing its emissions, while being self-reliant, efficient and cost-effective.
The introduction of the initial photovoltaic plant and BESS is projected to reduce energy costs by up to 20 percent compared to current costs. The introduction of additional photovoltaic and BESS capacity, as well as medium-speed thermal generators, is projected to further reduce energy costs by up to 45 percent, representing a reduction in All-In Sustaining Costs ("AISC"), once the power program is fully implemented, estimated to range from an initial amount of $150 per ounce of gold to as much as $200 per ounce of gold with incremental interim reductions as each of the components of the power program are implemented. The projected operating costs are comparable to the average costs expected for grid-supplied power with diesel backup, adjusted for grid availability in Mali. Considering the schedule of implementation for the different stages of the plan noted above, which is driven by engineering and procurement timelines of the various components, cost improvements are expected to be modest in 2026 and then gradually increase with the deployment of solar and BESS in 2027, and then increase meaningfully with the subsequent introduction of medium-speed thermal generation.
These investments will secure power for the ongoing needs and future growth at Sadiola, while progressively lowering costs, fuel consumption and carbon intensity of operations. In addition, the hybrid power generation solution will ensure a robust, independent and uninterrupted power supply for operations, while preserving the option to connect to Mali's public grid system in the future. These enhancements reinforce Allied's commitment to disciplined capital allocation, operational excellence, and ESG-driven value creation for shareholders and stakeholders. With improved and more efficient, cost-effective energy availability, Allied remains on track to deliver the Sadiola expansion on schedule and within budget, while advancing its broader growth pipeline across Africa.
Sadiola Exploration
Since acquiring the Sadiola Project in 2021, Allied has identified over 15 million tonnes of economic oxide mineralization within the near-mine footprint, significantly enhancing the oxide resource base critical for the existing and planned processing infrastructure. Ongoing exploration activities at Sadiola Main, Tambali, Sekekoto West, FE3/4, FE2 Trend and TK1 support Allied's strategy to leverage the existing resources, known mineralization trends and infrastructure to maximize production and cash flows in the short to medium term.
During the first quarter of 2026, exploratory and resource drilling programs were conducted on the Sadiola license with a total of 138 holes drilled comprising 19,174 metres utilizing five exploration core and RC drill rigs. Resource and exploratory drilling programs continued and were expanded at Tambali and along the FE2 Trend during the first quarter. A sterilization drill program over a proposed solar field and waste pile site to the east of the FE2.5 oxide deposit did not indicate any significant mineralization.
While no exploratory drilling was carried out over at the Sekekoto West Deposit in the quarter, and the results from fresh rock core drilling are still pending, further drilling will likely be carried out at this target after the ongoing IP survey is completed. The IP survey is designed to trace the Sekekoto West host geology to the north and to provide enough data to create a 3D resistivity image of the S12 deposit which will be used to assist resource modelling of this highly prospective karsted zone.
At Tambali North, a program was designed to follow-up on historic oxide gold mineralization and test a model that suggests that the Tambali Deposit mineralization continued to the north into the Sadiola Main pit. This program initially comprised six short drill lines spaced 200 metres apart. Results to date have been positive and the Company will advance infill drilling at a 100-metre line spacing at Tambali North. As of the end of the first quarter of 2026, 83 holes, comprising 9,375 metres, had been completed with drilling continuing past the end of the quarter.
| 17
ALLIED GOLD
MANAGEMENT'S DISCUSSION AND ANALYSIS
For the three months ended March 31, 2026
Drilling continued at Sadiola Main during the quarter with 10 drill holes, totalling 7,975 metres. These holes are designed to test the southern strike extensions of the deposit and to test below previous drilling to begin to support an expansion of the reserve pit at depth and to evaluate Sadiola's underground potential. Additional holes are being planned with a goal to demonstrate depth extensions to the northern end of the Sadiola Main Zone and the northeast-trending cross-structures while gathering additional geological data to define bedding-parallel mineralization across the entire deposit area.
Drilling was completed at the north end of the FE2 Trend with 16 infill holes totalling 1,566 metres completed at FE2N and 24 RC holes totalling 2,552 metres completed at FE1 (located at the north end of the FE2 Trend). Next steps will be determined after a review of all of the results from these two target areas. Drilling tested a 2.3-kilometre limestone/clastic sediment contact with wide-spaced drill fences that is open to the north with a goal to exhibit short-term potential for shallow oxide gold resources.
Induced polarization geophysical surveys commenced over the S12 deposit area as part of a survey to test the Sekekoto West mineralized trend. S12 is a high-grade mineralized zone that has been subject to karsting, and one goal of the IP survey is to model the karsting and associated karst geological facies to support 3D modelling of this high-grade zone. IP surveys are predominantly used to outline potential zones of increased sulphides or quartz veins, both know to be related to gold mineralization.
Sterilization drilling was completed over a planned solar field site and at a proposed waste dump immediately east of the FE2.5 oxide deposit. This work, which comprised 37 holes totalling 3,632 metres, did not intersect any significant mineralized zones.
For the remainder of 2026, Sadiola will see continued efforts with four to five drills dedicated to continue testing for, and extending, the gold mineralized structures at Sadiola Main, Tambali North, FE2 Trend, Sekekoto Trend, FE3/FE4, TK1, Mandakoto and Kouloukan. The exploration is focused on both oxide and shallow fresh mineralization with a preference for oxide gold mineralization in the near term. Oxide ore is favoured in the short term as it provides the plant with relatively inexpensive, high-quality ounces. The horizontal and down-dip/down-plunge limits of these systems are still open and as such, expectations of new discoveries and additions to the mineral inventory are high.
Sadiola Mineral Reserves and Mineral Resources
Please refer to Section 6: Mineral Reserve and Mineral Resource Estimates for further details.
| 18
ALLIED GOLD
MANAGEMENT'S DISCUSSION AND ANALYSIS
For the three months ended March 31, 2026
Bonikro (89.89% interest), Côte d’Ivoire
The Bonikro gold mine is an open pit gold mine located in the Oumé region of Côte d’Ivoire (“Bonikro” or “Bonikro Mine”). The remaining ownership is split between the Government of Côte d’Ivoire (10%) and a local minority shareholder (0.11%).
Bonikro is contiguous to Agbaou, and together they comprise the CDI Complex, with the two processing plants located only 20 km from each other.
Bonikro comprises two separate mining licences (the Bonikro Licence and Hiré Licence), although integrated as a single operation.
| | | | | | | | | | |
Bonikro Key Performance Information
(100% Basis) | | For three months ended March 31, |
| | 2026 | 2025 |
| Operating | | | | |
| Ore mined (M tonnes) | | | 0.91 | | 0.44 | |
| Waste mined (M tonnes) | | | 1.92 | | 5.23 | |
| Ore processed (M tonnes) | | | 0.61 | | 0.63 | |
| Gold | | | | |
| Production (Ounces) | | | 29,011 | | 19,671 | |
| Sales (Ounces) | | | 31,265 | | 20,924 | |
| Feed grade (g/t) | | | 1.63 | | 1.07 | |
| Recovery rate (%) | | | 93.4 | % | 92.8 | % |
Total cost of sales per ounce sold(4) | | | $ | 1,691 | | $ | 1,721 | |
Cash costs per ounce sold(1) | | | $ | 1,418 | | $ | 1,390 | |
AISC per ounce sold(1) | | | $ | 1,628 | | $ | 1,582 | |
Financial (In thousands of US Dollars) | | | | |
| Revenue | | | $ | 113,548 | | $ | 60,224 | |
| Cost of sales (excluding DDA) | | | (44,992) | | (29,218) | |
Gross profit excluding DDA(1) | | | $ | 68,556 | | $ | 31,006 | |
| DDA | | | (7,873) | | (6,799) | |
| Gross Profit | | | $ | 60,683 | | $ | 24,207 | |
Capital Expenditures (In thousands of US Dollars) | | | | |
Sustaining(1) | | | $ | 902 | | $ | 14,928 | |
Expansionary(1) | | | — | | 48 | |
Exploration(1) | | | 2,453 | | 1,975 | |
Bonikro produced 29,011 ounces of gold during the three months ended March 31, 2026, compared with 19,671 ounces in the first quarter of the previous year, due to mine sequencing and a standout performance in relation to the production plan. As previously guided, elevated stripping and waste removal costs during the past two years were planned investments to access higher-quality ore, and results now confirm that these actions are delivering value. The program has repositioned the asset on both production and cost metrics, outperforming in the quarter relative to plan.
For the first quarter, ore mined and total material mined were higher than plan, with higher grades obtained due to slight optimizations to the mining sequence. For the second quarter, mining performance is expected to remain stable, with minimal waste-stripping requirements for the current Stage 5. Process optimization initiatives continue with a focus on improving gravity circuit efficiency and slurry control.
Refinements to the mine design, supported by new geotechnical data, have enabled the inclusion of Stage 6 as Mineral Reserves at Bonikro, adding approximately 101,000 ounces of gold. Combined with additional Mineral Reserves at Hire, particularly at Akissi So, this will provide greater production flexibility at Bonikro while Oumé is being developed.
| 19
ALLIED GOLD
MANAGEMENT'S DISCUSSION AND ANALYSIS
For the three months ended March 31, 2026
For costs, AISC(1) for the first quarter were in line with plan and include capitalized stripping at PB5 incurred during 2024 and 2025, which is being amortized in 2026 and 2027. This represents approximately $135 per ounce of gold sold in the cost structure.
During the quarter gold sales were higher than production, due to the timing of production and shipments related to fourth quarter of 2025 inventory.
Hiré Exploration
In the first quarter of 2026, drilling at Hiré focused on testing for oxides along the eastern extension of the Chapelle orebody and two more holes into the west end of the Akissi So Deposit. In total 32 holes comprising 3,315 metres were drilled with the bulk of the holes completed with an RC drill.
Drone magnetic surveying commenced in the first quarter with a plan to cover the northern part of the property package including the area north and east of the Bonikro Mine to the northernmost extents of the property. In total, 4,743.2 linear kilometres of 25 and 50 metre spaced drone magnetic lines were completed over the Oumé and Hire areas to April 4, 2026 comprising 61% of the planned surveying. This survey is designed to better define the structural zones that are associated with the gold zones to improve targeting success. As well, a secondary goal of the magnetic survey is to identify additional Bonikro Mine-type porphyritic felsic intrusions, which have been demonstrated to host significant gold zones.
Bonikro West Exploration
Infill soil sampling commenced over an area of historic gold-in-soil enrichment immediately west of the Bonikro Mine in 2026 with a goal of defining a drillable target. To the end of the first quarter of 2026, 991 of 1,232 planned samples were collected.
Oumé Exploration
Following the successful Oumé exploration program, which resulted in the declaration of initial Proven and Probable Mineral Reserves containing approximately 585,000 ounces of gold, Allied expanded its exploration efforts to test for extensions to the Oumé gold system. In the first quarter of 2026, exploration resumed over the projected eastern extent of the Oumé mineralized system, with 86 holes totalling 2,679 metres completed. Wide-spaced drill fences were designed to follow-up Au-in-soil anomalies, historic drill results, prospecting sample results and geological mapping. Approximately 233 scout holes are planned in this first pass program with additional holes pending results. Additional holes planned to test the southwestern extent of the mineralized system are scheduled for later in the second and third quarters of 2026.
Bonikro Mineral Reserve and Mineral Resource
Please refer to Section 6: Mineral Reserve and Mineral Resource Estimates for further details.
| 20
ALLIED GOLD
MANAGEMENT'S DISCUSSION AND ANALYSIS
For the three months ended March 31, 2026
Agbaou (85% interest), Côte d’Ivoire
Agbaou is an open pit gold mine, located in the Oumé region of Côte d’Ivoire. The remaining ownership is split between the Government of Côte d’Ivoire (10%) and the SODEMI development agency (5%).
Agbaou is contiguous to Bonikro, and together they comprise the CDI Complex, with the two processing plants located only 20 km from each other. The combined milling capacity and existing infrastructure including water supply dams, tailings storage facilities, access and site roads, power supply and accommodation facilities provides optionality and significant synergies for the future.
| | | | | | | | | | |
Agbaou Key Performance Information
(100% Basis) | | For three months ended March 31, |
| | 2026 | 2025 |
| Operating | | | | |
| Ore mined (M tonnes) | | | 1.17 | | 0.63 | |
| Waste mined (M tonnes) | | | 7.70 | | 8.77 | |
| Ore processed (M tonnes) | | | 0.70 | | 0.57 | |
| Gold | | | | |
| Production (Ounces) | | | 22,901 | | 19,137 | |
| Sales (Ounces) | | | 22,618 | | 18,563 | |
| Feed grade (g/t) | | | 1.07 | | 1.08 | |
| Recovery rate (%) | | | 94.8 | % | 95.3 | % |
Total cost of sales per ounce sold(4) | | | $ | 2,147 | | $ | 1,505 | |
Cash costs per ounce sold(1) | | | $ | 1,922 | | $ | 1,466 | |
AISC per ounce sold(1) | | | $ | 2,376 | | $ | 2,125 | |
Financial (In thousands of US Dollars) | | | | |
| Revenue | | | $ | 90,862 | | $ | 51,738 | |
| Cost of sales (excluding DDA) | | | (41,313) | | (26,158) | |
Gross profit excluding DDA(1) | | | $ | 49,549 | | $ | 25,580 | |
| DDA | | | (7,253) | | (1,783) | |
| Gross Profit | | | $ | 42,296 | | $ | 23,797 | |
Capital Expenditures (In thousands of US Dollars) | | | | |
Sustaining(1) | | | $ | 8,445 | | $ | 10,831 | |
Expansionary(1) | | | — | | 31 | |
Exploration(1) | | | 1,380 | | 688 | |
Agbaou produced 22,901 ounces of gold during the three months ended March 31, 2026, compared to 19,137 ounces in the corresponding quarter of the previous year.
Agbaou AISC(1) for the first quarter were in line with plan. Optimization initiatives and operational enhancements are in progress, with Bonikro serving as the benchmark. Agbaou is expected to follow as these measures are implemented and scaled, targeting reduced costs in the next quarters.
Production in the first quarter focused primarily on ore from sources in the North extension area. Waste stripping in WP8 is underway with target access to higher-grade ore in the second quarter.
The Company has now completed the implementation of a centralized management model for both mines in CDI, streamlining processes, optimizing resources, enhancing service delivery for sustainable growth, and targeting lower AISC(1). The benefits of the centralized contractor model and the Hub-and-Spoke structure implemented are starting to materialize, enabling improved agility in managing shared resources and coordinating recovery efforts across sites. These enablers will be further embedded in the coming months as the Company transitions to full implementation.
| 21
ALLIED GOLD
MANAGEMENT'S DISCUSSION AND ANALYSIS
For the three months ended March 31, 2026
In addition to operational factors, the waste removal performed in 2025 allows for less reliance on short-term mineral resource conversion to support production levels in 2026, creating a bridge to focus additional exploration spending at Agbaou on more transformational targets aimed to add ounces and with an objective to increase mine life at Agbaou by four to six years, with the completion of the first stage exploration program in 2026.
Gold sales during the quarter were in line with production, with minor variances related to the timing of shipments.
Agbaou Exploration
At Agbaou, Allied is actively pursuing opportunities to extend the mine life by increasing Mineral Reserves through sustained drilling and other exploration efforts. In the first quarter of 2026, Allied completed 45 holes totalling 9,014 metres with up to five drills operating. These holes tested the down-dip extensions of known gold-bearing ore bodies and new gold zones. This sustained effort, which commenced in July 2025, comprises a minimum of 162 holes totalling 33,400 metres with a goal of adding to mine life. This work program is approximately 84% completed and scheduled to finish early in the second quarter of 2026. Modelling and resource estimation, in advance of updated Mineral Reserves, are in progress at the WP7 Agbaou Pit, which was the largest of the mineralized areas being subject to infill drilling with a goal to convert Inferred Mineral Resources to Indicated Mineral Resources. An updated mineral resource estimate will be completed after all assays have been received and interpreted, likely near mid-year 2026.
Soil sampling was completed over the Agbaou West target in the first quarter of 2026 with 849 samples collected out of a total of 1,232 planned samples. Anomalous gold-in-soil values noted in 4 areas, will be followed up in the second quarter of 2026 with infill sampling with a goal to develop coherent Au-in-soil anomalies that can be followed up with a scout.
Looking forward in 2026, continued testing of the known zones to depth will continue along with testing for oxide gold zones along strike of known deposits and new targets outside of the compensation boundaries.
Agbaou Mineral Reserve and Mineral Resource
Please refer to Section 6: Mineral Reserve and Mineral Resource Estimates for further details.
| 22
ALLIED GOLD
MANAGEMENT'S DISCUSSION AND ANALYSIS
For the three months ended March 31, 2026
5. CONSTRUCTION, DEVELOPMENT AND OTHER CORPORATE INITIATIVES
For details on the Sadiola Expansion Project, please refer to the Sadiola section of Section 4 of this MD&A.
Notable progress relating to some of the Company’s development and advanced stage exploration include, but are not limited to the following:
Kurmuk Project (100% Interest)(7), Ethiopia
Kurmuk Project Summary
The Kurmuk Project is a transformational development mine in the Benishangul-Gumuz region of Ethiopia. The Company holds an effective 100% ownership stake in the project; however, the Government of Ethiopia is entitled to a 7% equity participation in Kurmuk once the mine enters commercial production and certain governmental commitments such as public road upgrades and the finalized installation of a power line and substations. The power supply construction agreement is in development and is expected to be completed and energized ahead of first gold. An existing development agreement, signed with the Government of Ethiopia, spans an initial 20-year period and is renewable thereafter. The current project design encompasses the Dish Mountain and Ashashire deposits, with numerous exploration targets across the Kurmuk Project’s expansive 1,450 km² exploration territory.
Key project details are as follow:
•First gold pour is expected mid-2026.
•Currently defined 2.7 million ounces in Proven and Probable Mineral Reserves.
•Kurmuk is expected to deliver between 100,000 and 150,000 gold ounces for the partial year of production in 2026, an average production level of approximately 290,000 gold ounces per annum over the first four years and 240,000 gold ounces per annum over a 10-year mine life at industry-leading AISC(1) below $950 per ounce, based solely on Mineral Reserves. This represents a significant improvement over the original project, which was projected to average 200,000 ounces annually at similar capital costs, with further upside potential supporting an initial strategic target mine life of 15-years.
•A mining plan utilizing conventional open pit mining techniques with internationally recognized mining contractors and a robust process design using proven technologies.
•A 2023 study proposed an increase in plant throughput from 4.4 Mt/y in the 2022 Definitive Feasibility Study to 6.0 Mt/y, representing a 38% increase. By utilizing existing major equipment and contractor mining, the proposed expanded project could be developed within the same capital requirements range as initially planned. The Company is now strategically targeting 6.4 Mt/y as further described below.
The project implementation team features strong African project delivery capabilities. Operational readiness remains a strategic focus, supported by active planning and phased preparation. Minopex, a specialized operational readiness company based in South Africa, was selected to assist the operational team with the commissioning, ramp-up, and stabilization of operations in the early months of the project, to enhance organizational depth and provide training and development for the local workforce.
Kurmuk Quarterly Progress
The project continues to track well against plan, both in terms of physical completion and spend, while achieving key milestones and progress during the first quarter of 2026.
The project execution is progressing well, with the key focus during the quarter being on the logistics for the remaining equipment and materials to the site, the continued advancement of steel and mechanical erection activities, as well as the ramp-up of the electrical, control and instrumentation (“EC&I”) contractor, including the installation of medium-voltage cable, electrical-racking and lighting placement. Mining activities continue to advance toward building at least three months' worth of ore stockpiles to support the start of operations in mid-2026. The Ethiopian Electrical Power Company is advancing the power line construction, which is expected to be completed before commissioning. Pre-commissioning activities are planned to begin during the second quarter, with the first gold expected in mid-2026.
The key focus beyond the first quarter, and for the remainder of the project to first gold in mid-2026 is on construction completion and operational readiness. All remaining mechanical and electrical equipment is expected on site during the second quarter, and the earthworks and civil contractor is expected to commence demobilization. Construction handovers are due to commence in the second quarter, with pre-commissioning activities commencing thereafter in the quarter. The tailings storage facility and haul road are due for
| 23
ALLIED GOLD
MANAGEMENT'S DISCUSSION AND ANALYSIS
For the three months ended March 31, 2026
completion towards the end of the second quarter. Mining activities are expected to continue to ramp up in line with the production schedule, supporting the build-up of run-of-mine stockpiles and ensuring operational readiness for plant commissioning. The crushing circuit remains on track for early completion, which is critical to ensuring sufficient ore availability to support the targeted mid-year first gold milestone. Focus will be placed on achieving mechanical completion, testing, and handover of the crushing facilities to enable timely integration into the overall commissioning sequence.
Beyond the first gold expected for mid-year and a partial production year in 2026, the Company expects Kurmuk to produce an average of 290,000 ounces per year for the first four years and 240,000 ounces per year on average for the mine’s life, with AISC(1) below $950 per ounce.
Along with the advancement of the project and as previously disclosed, the Company completed a review of the capacity of the processing plant in consideration of the ore inventory and the exploration progress at Dish Mountain, Ashashire and Tsenge. Allied made a strategic decision to maximize the operational flexibility for Kurmuk since the start of operations, and is now targeting an average processing capacity of up to 6.4 Mt/y. This increased flexibility has been incorporated into the project execution plan, with subsequent optimizations to the leaching circuit expected to be deployed in the future years to increase fresh ore recoveries. The enhancements and optimizations are expected to make Kurmuk a stronger, de-risked operation upon commencement of production, providing upside and operational flexibility, aligning with the Company’s long-term strategy of maximizing value at each of the Company's assets.
Kurmuk Project Exploration
On November 27, 2025, Allied presented results of the exploration programs carried out over the Kurmuk Property during the period from mid 2024 to the middle of November 2025. The Company’s five-year exploration goal for Kurmuk is to reach 5 million ounces of Mineral Resources, representing a sequential target of over 1.5 million ounces of new Mineral Resources in addition to the current inventory. The objective is to add at least 0.5 million ounces of new Mineral Resources within 10 km of the mill to sustain or exceed the initial gold production of approximately 290,000 ounces per annum. The exploration plan considers expanding on the existing Mineral Resources near both the Ashashire and Dish Mountain deposits, advancing exploration at Tsenge utilizing a combination of geophysical surveys, trenching, and drilling, with a focus on higher-grades, and advancing exploration at three other prospects in the property. At both Dish Mountain and Ashashire, drilling continues to intersect lateral and vertical extensions of the deposits, with the limits of the mineralized system remaining open. At Tsenge, near-term exploration is focused on defining the extent of higher-grade zones and updating the mineralization models with a medium-term exploration goal of evaluating the entire 9-kilometre strike length of the gold-in-soil anomalies at Tsenge. A significant amount of highly successful trenching continues to be carried out at Tsenge, confirming the bedrock expression of the mineralized lenses that are coincident and proximal to the gold-in-soil anomalies aligned along this 9 km long trend. A second-pass drill program completed over the Urchin Prospect, located adjacent to the Ashashire haul road, yielded positive results that will require follow-up drilling.
During the first quarter of 2026, drilling was focused on resource extension drilling on the strike and depth extensions of Dish Mountain Resource, exploratory drilling and channel sampling continued at the Tsenge Prospect, the continuation of a new round of resource extension drilling at Ashashire, more follow-up drilling over the Urchin Prospect, and continued ROM and waste pad sterilization drilling. A total of 29 holes for 6,700 metres was drilled by five exploration drill rigs in the first quarter. Reprioritization of additional extensional drilling at Dish Mountain will be carried out in the second quarter of 2026.
Kurmuk Power Purchase Agreement ("PPA")
On August 19, 2024, the Company announced that its subsidiary, Kurmuk Gold Mine PLC, which owns the Kurmuk Project, entered into a definitive PPA with Ethiopian Electric Power to secure a reliable, competitive, and sustainable energy supply for Kurmuk throughout the life of the mine. This is an important milestone in the project's development, as a steady supply of hydroelectric power ensures that Kurmuk remains one of the lowest AISC(1) projects in the world. Ethiopia is a low-cost power producer, generating power almost entirely through hydroelectric sources, making it one of the most durable and cleanest power supplies globally.
Key Terms of the Agreement:
•Term: The Power Purchase Agreement will be in effect for a period of twenty years and may be extended by mutual agreement.
•Energy Charge: The agreement secures a flat energy charge of $0.04 per kWh, applicable from the supply commencement date and remaining fixed for the entire term, providing cost certainty for the project.
•Renewable Energy Source: The project will benefit from Ethiopia's predominantly renewable energy sources, aligning with the Company's commitment to sustainable mining practices.
| 24
ALLIED GOLD
MANAGEMENT'S DISCUSSION AND ANALYSIS
For the three months ended March 31, 2026
•Transmission Line Construction: Electrical grid power will be supplied to the operation via a 75-kilometre, 132 kV power line, which is expected to be completed and energized ahead of first production in mid-2026, with substations at Asosa—a major city near the project—and at the project site. The government will provide the grid connection, which will increase their equity stake in Kurmuk Gold Mine PLC from 5% to 7%, as defined in the Kurmuk Development Agreement. On-site power will be distributed via a network of 11 kV power lines.
Securing the terms of the PPA marks a key milestone in advancing the Kurmuk Gold Project, cementing its path to becoming a low-cost producing mine for the Company. This agreement not only ensures the project's financial viability by locking in low energy costs but also reinforces Allied's strategic focus on leveraging sustainable energy solutions, positioning Kurmuk as a model for responsible mining in the region.
Currently the development of the installation works is trending towards being complete when the project requires full load for ramp up and performance testing. Progress updates are received weekly and aligned with the overall construction schedule. The progress will be monitored against challenging fuel constraints and global logistical concerns of late.
Kurmuk Mineral Reserve and Mineral Resource
Please refer to Section 6: Mineral Reserve and Mineral Resource Estimates for further details.
Transaction with Zijin Gold
The Company is advancing the transaction with Zijin Gold International Company Limited ("Zijin Gold") after entering into a definitive agreement (the "Arrangement Agreement" or the "Agreement") as previously disclosed. Zijin Gold, a public company listed on the Hong Kong Stock Exchange, agreed to acquire all of the issued and outstanding shares of Allied Gold at a price of C$44 per share (the “Offer Price”) in cash, pursuant to the terms of a court-approved plan of arrangement under the Business Corporations Act (Ontario) (the "Arrangement"). The Company's Board of Directors determined that the Arrangement immediately achieved fair value realization while mitigating business risks, particularly in highly volatile markets, and Zijin Gold had demonstrated a strong track record of long-term asset stewardship and consequently, there was a suspension of the other strategic opportunities. The transaction value of the Arrangement is approximately C$5.5 billion, realizing a significant, certain and immediate value for Allied Gold shareholders. Further details on the benefits of the Arrangement can be found in the Company's previous public disclosure filed on SEDAR+.
As previously disclosed, all requisite shareholder and court approvals have been obtained.
The Company and Zijin Gold are in continuous dialogue, planning for an orderly transition on completion of the Arrangement. Both companies continue to engage diligently and cooperatively with regulatory bodies pursuant to previously filed applications for regulatory approvals necessary to complete the Arrangement with the objective of closing in a timely manner within the timeframe set out in the Arrangement Agreement. The Arrangement Agreement provides for an outside date for closing of May 29, 2026, subject to extension by the parties if by that date any regulatory approvals or other conditions precedent are still in progress. Both companies continue to demonstrate a strong commitment to complete the transaction in accordance with the Arrangement Agreement.
| 25
ALLIED GOLD
MANAGEMENT'S DISCUSSION AND ANALYSIS
For the three months ended March 31, 2026
6. MINERAL RESERVE AND MINERAL RESOURCE ESTIMATES
Please refer to Section 12: Cautionary Statements and Internal Controls Over Financial Reporting – Notes on Mineral Reserves and Mineral Resources for further details.
2025 Year-End Mineral Reserves and Mineral Resources Summary
Allied’s near-term guidance and longer-term outlook are underpinned by its Mineral Reserves and Mineral Resources, which support the reliability and sustainability of the Company’s production platform while providing flexibility to enhance near-term production and cash flows from high-yield, near-mine opportunities. During the year, Allied completed a comprehensive review of all its resource models and mining design parameters, incorporating new exploration and production information, standardized geological modelling processes and mining design assumptions, particularly with respect to mining selectivity and dilution. These adjustments were intended to strengthen ore control practices and improve short-term operational predictability. Allied remains confident that ongoing exploration efforts will continue to grow mineral inventories, with the objective of delivering additional growth during 2026. This has been demonstrated with the declaration of Mineral Reserves at Oumé for the first time in 2025, significantly increasing the LOM at Bonikro, along with the inclusion of Stage 6.
As of December 31, 2025, Proven and Probable Mineral Reserves were reported at 11.2 million ounces of gold, contained within 247.1 million tonnes at a grade of 1.41 g/t. This represents a net year-over-year increase, reflecting the addition of new Mineral Reserves, replacing depletion from 2025 production, and updates to economic and design assumptions. Total Measured and Indicated Mineral Resources stood at 15.3 million ounces of gold, contained within 336.7 million tonnes at a grade of 1.41 g/t. The modest decrease from 2024 is primarily attributable to the recategorization of some Indicated Mineral Resources to Inferred Mineral Resources. Inferred Mineral Resources, at year-end totalled 2.1 million ounces contained within 54.2 million tonnes at a grade of 1.20 g/t, increasing from 1.4 million ounces from the prior year, reflecting the Company’s progress on increasing its mineral inventories.
Further details on a mine-by-mine basis can be found in the Review of Operations section of this MD&A, along with the Construction section for Kurmuk.
The Company’s 2025 year-end statement is provided below.
Mineral Reserves (Proven and Probable)
The following table sets forth the Mineral Reserve estimates for the Company’s mineral properties at December 31, 2025.
| | | | | | | | | | | | | | | | | | | | | | | | | | | | | |
| Proven Mineral Reserves | Probable Mineral Reserves | Total Mineral Reserves |
| Tonnes (kt) | Grade (g/t) | Content (k ounces) | Tonnes (kt) | Grade (g/t) | Content (k ounces) | Tonnes (kt) | Grade (g/t) | Content (k ounces) |
| Sadiola Mine | 37,164 | | 1.17 | | 1,400 | | 104,664 | | 1.61 | | 5,411 | | 141,827 | | 1.49 | | 6,811 | |
| Korali-Sud Mine | 1,658 | | 0.68 | | 36 | | 1,275 | | 1.56 | | 64 | | 2,933 | | 1.06 | | 100 | |
| Kurmuk Project | 7,893 | | 1.28 | | 324 | | 56,057 | | 1.32 | | 2,382 | | 63,950 | | 1.32 | | 2,706 | |
| Bonikro Mine | 6,601 | | 0.87 | | 185 | | 26,217 | | 1.32 | | 1,111 | | 32,819 | | 1.23 | | 1,296 | |
| Agbaou Mine | 1,798 | | 1.07 | | 62 | | 3,810 | | 1.53 | | 188 | | 5,608 | | 1.39 | | 250 | |
| Total Mineral Reserves | 55,114 | | 1.13 | | 2,007 | | 192,023 | | 1.48 | | 9,156 | | 247,137 | | 1.41 | | 11,164 | |
Note: Rounding of numbers may lead to discrepancies when summing columns or rows.
| 26
ALLIED GOLD
MANAGEMENT'S DISCUSSION AND ANALYSIS
For the three months ended March 31, 2026
Mineral Resources (Measured, Indicated, Inferred)
The following table set forth the Measured and Indicated Mineral Resource estimates (inclusive of Mineral Reserves) and for the Company’s mineral properties at December 31, 2025.
| | | | | | | | | | | | | | | | | | | | | | | | | | | | | |
| Measured Mineral Resources | Indicated Mineral Resources | Total Measured and Indicated |
| Tonnes (kt) | Grade (g/t) | Content (k ounces) | Tonnes (kt) | Grade (g/t) | Content (k ounces) | Tonnes (kt) | Grade (g/t) | Content (k ounces) |
| Sadiola Mine | 49,326 | | 1.06 | | 1,686 | | 158,434 | | 1.55 | | 7,872 | | 207,760 | | 1.43 | | 9,557 | |
| Korali-Sud Mine | 2,117 | | 0.68 | | 46 | | 5,863 | | 1.11 | | 209 | | 7,980 | | 1.00 | | 256 | |
| Kurmuk Project | 7,748 | | 1.45 | | 361 | | 64,969 | | 1.44 | | 3,002 | | 72,717 | | 1.44 | | 3,363 | |
| Bonikro Mine | 8,339 | | 1.14 | | 306 | | 32,316 | | 1.38 | | 1,436 | | 40,654 | | 1.33 | | 1,742 | |
| Agbaou Mine | 3,064 | | 1.25 | | 123 | | 4,537 | | 1.73 | | 252 | | 7,601 | | 1.53 | | 374 | |
| Total Mineral Resources (M&I) | 70,595 | | 1.11 | | 2,522 | | 266,118 | | 1.49 | | 12,771 | | 336,713 | | 1.41 | | 15,292 | |
Note: Rounding of numbers may lead to discrepancies when summing columns or rows.
The following table set forth the Inferred Mineral Resource estimates and for the Company’s mineral properties at December 31, 2025.
| | | | | | | | | | | |
| Inferred Mineral Resources |
| Tonnes (kt) | Grade (g/t) | Content (k ounces) |
| Sadiola Mine | 45,547 | | 1.13 | | 1,656 | |
| Korali-Sud Mine | 1,209 | | 1.66 | | 65 | |
| Kurmuk Project | 4,988 | | 1.35 | | 217 | |
| Bonikro Mine | 1,659 | | 1.65 | | 88 | |
| Agbaou Mine | 781 | | 2.62 | | 66 | |
| Total Mineral Resources (Inferred) | 54,183 | | 1.20 | | 2,091 | |
Note: Rounding of numbers may lead to discrepancies when summing columns or rows.
| 27
ALLIED GOLD
MANAGEMENT'S DISCUSSION AND ANALYSIS
For the three months ended March 31, 2026
Mineral Reserve and Mineral Resource Reporting Notes
| | | | | | | | | | | |
1.Metal Price, Cut-off Grade, Metallurgical Recovery: |
| | Mineral Reserves | | Mineral Resources |
Sadiola (80%) | Price assumption: $2,000/ounce gold Open pit cut-off grades range from 0.26 to 0.69 g/t gold | | Price assumption: $2,300/ounce gold Open pit cut-off grades range from 0.23 g/t to 0.58 g/t gold |
Korali-Sud (65%) | Price assumption: $2,000/ounce gold Open pit cut-off grades range from 0.34 to 0.76 g/t gold | | Price assumption: $2,300/ounce gold Open pit cut-off grades range from 0.30 g/t to 0.66 g/t gold |
| | | | |
Kurmuk (100%)(7) | Price assumption: $1,700/ounce gold. Selected pit shells using values of US$1,530/oz (revenue factor 0.90) for Dish Mountain and US$1,300/oz (revenue factor 0.76) for Ashashire. Open pit cut-off grades range from 0.36 to 0.49 g/t gold | | Price assumption: $2,300/ounce gold Open pit cut-off grades range from 0.37 g/t to 0.49 g/t gold |
| | | | |
Bonikro (89.89%) | Price assumption: $2,000/ounce gold Open pit cut-off grades range from 0.46 to 0.57 g/t gold.
| | Price assumption: $2,300/ounce gold Open pit cut-off grades range from 0.38 g/t to 0.60 g/t gold |
Oume (100%) | Price assumption: $2,300/ounce gold Open pit cut-off grades range from 0.54 to 0.71 g/t gold.
| | Price assumption: $2,400/ounce gold Open pit cut-off grades range from 0.54 g/t to 0.69 g/t gold |
Hire (89.89%) | Price assumption: $2,000/ounce gold Open pit cut-off grades range from 0.59 to 0.69 g/t gold.
| | Price assumption: $2,300/ounce gold Open pit cut-off grades range from 0.38 g/t to 0.60 g/t gold |
| | | | |
Agbaou (85%) | Price assumption: $2,000/ounce gold Open pit cut-off grades range from 0.43 to 0.55 g/t gold | | Price assumption: $2,300/ounce gold Open pit cut-off grades range from 0.37 g/t to 0.48 g/t gold |
| | | | |
| 2. Mineral Reserve and Mineral Resource estimates are shown on a 100% basis. Designated government entities and national minority shareholders hold the following interests in each of the mines: 20% of Sadiola, 35% of Korali-Sud, 10.1% of Bonikro and 15% of Agbaou. The Government of Ethiopia is entitled to a 7% equity participation in Kurmuk. Only a portion of the government interests are carried. |
| 3. All Mineral Reserves and Mineral Resources have been estimated in accordance with the standards of the Canadian Institute of Mining, Metallurgy and Petroleum and NI 43-101. |
| 4. The Measured and Indicated Mineral Resource estimates are inclusive of those Mineral Resource estimates modified to produce the Mineral Reserve estimates. |
| 5. Mineral Resources which are not Mineral Reserves do not have demonstrated economic viability. |
| 6. Mineral Reserves and Mineral Resources are reported as of December 31, 2025. |
7. For the Qualified Person responsible for the Mineral Reserve and Mineral Resource estimates, see Section 12: Cautionary Statements and Internal Controls Over Financial Reporting of this MD&A. |
| 28
ALLIED GOLD
MANAGEMENT'S DISCUSSION AND ANALYSIS
For the three months ended March 31, 2026
7. FINANCIAL CONDITION AND LIQUIDITY
| | | | | | | | |
(In thousands of US Dollars) | As at March 31, 2026 | As at December 31, 2025 |
| Current Assets (including Cash and Cash Equivalents) | $ | 748,404 | | $ | 763,709 | |
| Non-Current Assets | 1,496,353 | | 1,359,970 | |
| Total Assets | $ | 2,244,757 | | $ | 2,123,679 | |
| Current Liabilities | 1,156,083 | | 988,564 | |
| Non-Current Liabilities | 643,115 | | 630,436 | |
| Total Liabilities | $ | 1,799,198 | | $ | 1,619,000 | |
Equity attributable to Shareholders of the Company | 334,627 | | 407,609 | |
| Non-controlling interest | 110,932 | | 97,070 | |
| Total Equity | $ | 445,559 | | $ | 504,679 | |
| | |
Net Working Capital(3) | $ | (193,121) | | $ | (70,543) | |
Total assets were $2,244.8 million as at March 31, 2026, compared to total assets of $2,123.7 million as at December 31, 2025. The Company’s asset base is primarily non-current assets such as property plant and equipment, mining interests and exploration and evaluation assets. This reflects the capital-intensive nature of the mining business and previous growth through acquisitions. Other significant assets include cash and cash equivalents, inventories, prepayments and other receivables (comprising value-added taxes in the jurisdictions in which the Company operates). Notable changes from the prior year are related to capital expenditures at Kurmuk, general increases to property, plant and equipment due to ongoing operations, and general changes to working capital.
Total liabilities as at March 31, 2026, were $1,799.2 million compared to $1,619.0 million as at December 31, 2025. The increase is predominantly attributable to unrealized mark-to-markets on the Company's gold collars and convertible debentures, and general timing on accounts payable and accrued liabilities, offset by payments under the claim settlement. Other significant liabilities include: provision of closure & reclamation, deferred and contingent consideration, trade and other payables, and income taxes (payable and deferred).
Cash and Working Capital
Cash and cash equivalents were $424.2 million as at March 31, 2026, compared to $479.8 million as at December 31, 2025. Cash balances were positively impacted by significant operating cash flows. This was offset by capital expenditures at Kurmuk and Sadiola Phase 1, general increases to property, plant and equipment due to ongoing operations, and general changes to working capital. The Company has sufficient cash on hand, and liquidity to fully manage its business. The Company believes that it is able to meet its obligations as they come due with funds from cash flows from operating activities.
Net working capital(3) was a deficit of $193.1 million at March 31, 2026, compared to negative $70.5 million at December 31, 2025. Working capital in the current period is affected by the short-term liabilities associated with the gold collars, which become payable when, on settlement, gold price average for the period exceed the collar’s upper limit. While settlements result in a cash outlay, such outlays are triggered by revenue cash generating events, with the proceeds of the sale at prices exceeding that limit providing the necessary funds for settlement. Further, working capital is impacted by the current component of deferred revenue which is settled by the delivery of gold under the respective agreements and does not result in a direct outlay of cash and cash equivalents.
Total Borrowings
The total borrowings, including the convertible debentures of the Company at March 31, 2026 were $214.6 million compared to $154.3 million as at December 31, 2025.
Current borrowings are associated with the convertible debentures, net of transaction costs, and movements from the prior period are fully associated with the mark-to-market of the instrument.
| 29
ALLIED GOLD
MANAGEMENT'S DISCUSSION AND ANALYSIS
For the three months ended March 31, 2026
LIQUIDITY
The Company plans to meet its spending commitments, which include continued spending on business development activities, exploration and project development (notably the Sadiola Expansion Project and the Kurmuk Project), with funds on hand and cash flows from operating activities and, as described below, with the execution on number of non-dilutive stream and prepaid transactions.
Lastly, the Company has immediately available credit of $50.0 million (inclusive of a $10.0 million accordion) under its revolving credit facility, which remains undrawn.
The Company’s near-term financial obligations include capital commitments and other financing commitments of $118.5 million, interest payments of $9.4 million and deferred and contingent consideration of $30.3 million, along with accounts payable and accrued liabilities.
SOURCES AND USES OF CASH
The following table summarizes cash inflows and outflows:
| | | | | | | | | | |
| (In thousands of US Dollars) | | For three months ended March 31, |
| | | 2026 | 2025 |
Operating cash flows before income tax paid and working capital(6) | | | $ | 162,714 | | $ | 100,788 | |
| Income tax paid | | | (10,468) | | (7,904) | |
| | | | |
Operating cash flows before movements in working capital(6) | | | $ | 152,246 | | $ | 92,884 | |
Working capital movement(6) | | | (94,953) | | 28,246 | |
Net cash generated from operating activities | | | $ | 57,293 | | $ | 121,130 | |
Net cash used in investing activities | | | (109,330) | | (103,870) | |
Net cash used in financing activities | | | (256) | | (6,677) | |
Net (decrease) increase in cash and cash equivalents | | | $ | (52,293) | | $ | 10,583 | |
Operating Activities
Net cash generated from operating activities for the three months ended March 31, 2026 was $57.3 million. This compares to $121.1 million in the prior year comparative quarter. Current period cash was positively impacted by strong gold sales and record high realized gold prices. Working capital impact for the first quarter is related to normal course movements in inventory (including stockpiles), timing of accounts payable, and payment of year-end accruals. As previously disclosed, certain positive impacts to working‑capital movements in the fourth quarter of 2025 were released in the first quarter of 2026, reflecting the settlement of various payables, accruals and other balance sheet items. Prior year cash flows were positively impacted by the sale of Korali inventory in the first quarter of 2025 from 2024 which significantly increased sales quantities, while positively impacting working capital due to the sale.
Operating cash flows before income tax paid and movements in working capital for the three months ended March 31, 2026 increased significantly, at an inflow of $162.7 million compared with the prior year comparative quarter inflow of $100.8 million, due to higher realized gold prices. The impact of higher prices was partially offset by lower ounces sold in the current period in association with the sale of Korali inventory in the first quarter of 2025.
Working capital movement(6) for the three months ended March 31, 2026 impacted cash flows by $95.0 million, compared to $28.2 million in the prior year comparative quarter. Working capital impact for the first quarter is related to normal course movements in inventory (including stockpiles), timing of accounts payable, and payment of year-end accruals. As previously disclosed, certain positive impacts to working‑capital movements in the fourth quarter of 2025 were released in the first quarter of 2026, reflecting the settlement of various payables, accruals and other balance sheet items. Prior year comparative working capital was positively impacted by the sale of Korali inventory that had been built up in the prior year.
| 30
ALLIED GOLD
MANAGEMENT'S DISCUSSION AND ANALYSIS
For the three months ended March 31, 2026
Investing Activities
For the three months ended March 31, 2026, net cash used in investing activities was $109.3 million compared to $103.9 million in the prior year comparative quarter. Investing outflows in the current period comprised primarily additions to PP&E and exploration and evaluation assets, which importantly included Kurmuk construction-related activities, owner costs and capitalized borrowings.
Financing Activities
In the three months ended March 31, 2026, net cash used in financing activities was $0.3 million compared to outflows of $6.7 million in the comparative prior year quarter. Current quarter cash outflows from financing activities are immaterial, while prior comparative period financing cash flows are related to dividends paid to non-controlling interests.
CAPITAL RESOURCES
The capital of the Company consists of items included in shareholders’ equity and borrowings, net of cash and cash equivalents, as follows:
| | | | | | | | |
(In thousands of US Dollars) | As at March 31, 2026 | As at December 31, 2025 |
Total Equity | $ | 445,559 | | $ | 504,679 | |
Current and Non-Current Borrowings | 214,558 | | 154,312 | |
| $ | 660,117 | | $ | 658,991 | |
| Less: Cash and cash equivalents | (424,200) | | (479,777) | |
| $ | 235,917 | | $ | 179,214 | |
To maintain or adjust its capital structure, the Company may, upon approval from its Board of Directors, issue shares, pay dividends, or undertake other activities as deemed appropriate under the specific circumstances.
The Company manages its discretionary spending to align with cash availability and future cash flow forecasts. Amounts above may be higher or lower than expected depending on cash flows generated during the year.
| 31
ALLIED GOLD
MANAGEMENT'S DISCUSSION AND ANALYSIS
For the three months ended March 31, 2026
CONTRACTUAL OBLIGATIONS AND COMMITMENTS
In the normal course of business, the Company enters into contracts that give rise to commitments for future minimum payments. The following table summarizes the remaining contractual maturities of the Company’s financial liabilities and operating and capital commitments at March 31, 2026, shown on an undiscounted basis:
| | | | | | | | | | | | | | | | | |
| (In millions of US dollars) | Within 1 year | Years 2 and 3 | Years 4 and 5 | After 5 years | Total |
| Debt | | | | | |
| Repayment of principal | $ | — | | $ | 107.3 | | $ | — | | $ | — | | $ | 107.3 | |
| Interest | 9.4 | | 13.5 | | — | | — | | 22.9 | |
| Accounts payable and accrued liabilities | 409.8 | | — | | — | | — | | 409.8 | |
| Derivative financial liability | 174.3 | | — | | — | | — | | 174.3 | |
| Reclamation and closure costs | — | | — | | 13.9 | | 224.7 | | 238.6 | |
| Deferred and contingent consideration | 30.3 | | 38.6 | | 24.9 | | — | | 93.8 | |
| Capital and other financial commitments | 118.5 | | 15.7 | | 5.5 | | 4.2 | | 143.9 | |
| Total contractual obligations and commitments | $ | 742.3 | | $ | 175.1 | | $ | 44.3 | | $ | 228.9 | | $ | 1,190.6 | |
OUTSTANDING SHARE DATA
The Company is authorized to issue an unlimited number of common shares at no par value. The following table summarizes the Company’s common shares and securities convertible into common shares as at the following dates:
| | | | | | | | | | | | | | | | | |
| (In millions of units) | As at May 13, 2026 | As at March 31, 2026 | As at December 31, 2025 | | |
| Common Shares issued and outstanding | 125.9 | | 125.9 | | 124.7 | | | |
Stock options(5) | 2.4 | | 2.4 | | 2.4 | | | |
Restricted share units(5) | 2.2 | | 2.2 | | 3.3 | | | |
Convertible debentures(5) | 6.2 | | 6.2 | | 6.2 | | | |
Total Shares and Convertible Securities Issued and Outstanding(5) | 136.7 | | 136.7 | | 136.6 | | | |
| 32
ALLIED GOLD
MANAGEMENT'S DISCUSSION AND ANALYSIS
For the three months ended March 31, 2026
8. ECONOMIC TRENDS, BUSINESS RISKS AND UNCERTAINTIES
Exploration, development and mining of precious metals involve numerous risks as a result of the inherent nature of the business, global economic trends, and the influences of local social, political, environmental and economic conditions in the various geographical areas of operation. As such, the Company is subject to several financial and operational risks that could have a significant impact on its profitability and levels of operating cash flows.
Below is a summary of the principal financial risks and related uncertainties facing the Company. Readers are also encouraged to read and consider the risk factors and related uncertainties as described in the Annual Information Form of the Resulting Issuer, which is available on SEDAR+ at www.sedarplus.com. Such risk factors could materially affect the future operating results of the Company and could cause actual events to differ materially from those described in forward-looking statements.
METAL PRICE RISK
The Company’s profitability and long-term viability depend, in large part, upon the market price of metals that may be produced from the
Company’s properties, primarily gold. Market price fluctuations of these precious metals could adversely affect profitability of operations and lead to impairments of mineral properties. Metal prices fluctuate widely and are affected by numerous factors beyond the Company’s control including but not limited to supply and demand, consumption patterns, macroeconomic factors (interest, exchange, inflation), banking and political conditions, nature and climate condition risks, and mining specific factors.
During the three months ended March 31, 2026, spot gold prices as (as measured by the LBMA PM Gold Price) averaged $4,873 per ounce, compared to $2,860 per ounce during the comparative prior year quarter. During the period, the highest price was $5,405 per ounce and the lowest price was $4,353 per ounce.
Gold reached a new all‑time high in the first quarter of 2026, surpassing $5,000 per ounce in January before retreating sharply toward the end of the period. Early‑quarter strength was driven by elevated geopolitical and macroeconomic uncertainty. However, gold came under pressure in March as conflict escalated in the Middle East and both the U.S. dollar and oil prices rose significantly. Investor sentiment weakened, leading to broad liquidation of gold positions and an overall decline in global ETF holdings. Central banks remained net buyers of gold in 2026, with Poland and Uzbekistan leading official‑sector purchases.
In the near term, gold prices are expected to remain sensitive to geopolitical developments and broader macroeconomic conditions. Over the longer horizon, persistent global economic and geopolitical uncertainty, combined with sustained investor and central bank demand, should continue to provide support for gold.
| 33
ALLIED GOLD
MANAGEMENT'S DISCUSSION AND ANALYSIS
For the three months ended March 31, 2026
CURRENCY RISK
Currency fluctuations may affect the Company’s assets and liabilities and the costs that the Company incurs at its operations. Gold is sold throughout the world based principally on a US Dollar price, but a significant portion of the Company’s operating and capital expenses are incurred in West African CFA franc (XOF). XOF is pegged to the Euro at a fixed rate of 655.957 per Euro. This effectively means the Company primary currency exposure is to the Euro.
All else being equal, a higher USD/EUR exchange rate will result in lower costs to the Company when measured in its reporting currency of USD.
During the three months ended March 31, 2026, the average USD/EUR exchange rate was 1.1706, the lowest was 1.1417, and the highest was 1.2041. The rate at the end of the period was 1.1553.
9. CONTINGENCIES
The Company may be involved in disputes with other parties in the future that may result in litigation. If the Company is unable to resolve these disputes favourably, it may have a material adverse impact on the Company's financial condition, cash flows and results of operations.
| 34
ALLIED GOLD
MANAGEMENT'S DISCUSSION AND ANALYSIS
For the three months ended March 31, 2026
10. CRITICAL ACCOUNTING POLICIES AND ESTIMATES
BASIS OF PREPARATION
The Company’s Condensed Consolidated Financial Statements have been prepared in accordance with International Accounting Standard 34 “Interim Financial Reporting” (IAS 34). Other than as noted, the accounting policies applied by the Company in these Condensed Consolidated Financial Statements are the same as those set out in the Allied Gold audited financial statements for the year ended December 31, 2025, except for those discussed below.
New accounting standards and amendments adopted
Classification and Measurement of Financial Instruments - Amendments to IFRS 9, Financial Instruments and IFRS 7, Financial Instruments: Disclosures
On May 30, 2024, the IASB issued narrow scope amendments to IFRS 9 “Financial Instruments” (“IFRS 9”) and IFRS 7. The amendments include the clarification of the date of initial recognition or derecognition of financial liabilities, including financial liabilities that are settled in cash using an electronic payment system. The amendments also introduce additional disclosure requirements to enhance transparency regarding investments in equity instruments designated at FVOCI and financial instruments with contingent features. The amendments were adopted on January 1, 2026, and did not have a significant impact on the Company’s financial statements.
Contracts Referencing Nature-Dependent Electricity - Amendments to IFRS 9, Financial Instruments and IFRS 7, Financial Instruments: Disclosures
On December 18, 2024, the IASB issued targeted amendments to IFRS 9 and IFRS 7 to help companies better report the financial effects of nature-dependent electricity contracts. The amendments clarify the factors an entity would consider when assessing whether a renewable electricity contract qualifies for the own-use exemption under IFRS 9, as well as hedge accounting requirements for when a renewable electricity contract is designated as the hedging instrument in a cash flow hedge of forecasted sales or purchases of electricity. The amendments were adopted on January 1, 2026. The Company does not currently have such contracts in effect and therefore the adoption of the amendment did not have a significant impact on the Company's financial statements.
New accounting standards and amendments to be adopted
IFRS 18, Presentation and Disclosures of Financial Statements.
In April 2024, the IASB issued IFRS 18, Presentation and Disclosures of Financial Statements (“IFRS 18”) with the aim of improving companies’ reporting of financial performance and giving investors a better basis for analyzing and comparing companies. IFRS 18 introduces three new sets of requirements:
•Improved comparability in the statements of income which introduces three defined categories for income and expenses: operating, investing and financing. These changes would require all companies to use the same structure of the statements of income and provide new defined subtotals, including operating profit.
•Enhanced transparency of management-defined performance measures which would require companies to disclose explanations of those company specific measures that are related to the income statement.
•More useful grouping of information in the financial statements which provides enhanced guidance on how to organize information and whether to provide it in the primary financial statements or in the notes.
IFRS 18 is effective for annual reporting periods beginning on or after January 1, 2027. The Company is currently evaluating the impact of this new standard.
The condensed financial statements do not include all of the information required for a complete set of IFRS financial statements and should be read in conjunction with the audited consolidated financial statements for the year ended December 31, 2025. Selected explanatory notes are included to explain events and transactions that are significant to an understanding of the changes in the Company’s financial position and performance since the audited financial statements for the year ended December 31, 2025.
CRITICAL JUDGEMENTS AND ESTIMATES
In preparing the consolidated financial statements in accordance with IFRS, management is required to make estimates and assumptions that affect the reported amounts of assets, liabilities, revenue and expenses. Critical accounting estimates represent estimates that are
| 35
ALLIED GOLD
MANAGEMENT'S DISCUSSION AND ANALYSIS
For the three months ended March 31, 2026
uncertain and for which changes in those estimates could materially impact the Company's consolidated financial statements. Actual future outcomes may differ from present estimates. Management reviews its estimates and assumptions on an ongoing basis using the most current information available.
The critical judgements and key sources of estimation uncertainty in the application of accounting policies during the year ended December 31, 2026 are disclosed in note 5 to the Consolidated Financial Statements - Critical Judgements and Estimation Uncertainties.
11. NON-GAAP FINANCIAL PERFORMANCE MEASURES
The Company has included certain non-GAAP financial performance measures to supplement its Condensed Consolidated Interim Financial Statements, which are presented in accordance with IFRS, including the following:
•Cash costs per gold ounce sold;
•AISC per gold ounce sold;
•Gross profit excluding DDA;
•Sustaining, Expansionary and Exploration Capital Expenditures;
•Adjusted Net Earnings (Loss) and Adjusted Net Earnings (Loss) per share; and
•EBITDA and Adjusted EBITDA
The Company believes that these measures, together with measures determined in accordance with IFRS, provide investors with an improved ability to evaluate the underlying performance of the Company.
Non-GAAP financial performance measures, including cash costs(1), AISC(1), Gross profit excluding DDA(1), Sustaining(1), Expansionary(1) and Exploration Capital Expenditures(1), Adjusted Net Earnings (Loss)(1), Adjusted Net Earnings (Loss) per Share(1), EBITDA(1) and Adjusted EBITDA(1), do not have any standardized meaning prescribed under IFRS, and therefore may not be comparable to similar measures employed by other companies. Non-GAAP financial performance measures intend to provide additional information, and should not be considered in isolation as a substitute for measures of performance prepared in accordance with IFRS and are not necessarily indicative of operating costs, operating earnings or cash flows presented under IFRS.
Management’s determination of the components of non-GAAP financial performance measures and other financial measures are evaluated on a periodic basis, influenced by new items and transactions, a review of investor uses and new regulations as applicable. Any changes to the measures are described and retrospectively applied, as applicable. Subtotals and per unit measures may not calculate based on amounts presented in the following tables due to rounding.
The measures of cash costs and AISC, along with revenue from sales, are considered to be key indicators of a Company’s ability to generate operating earnings and cash flows from its mining operations. This data is furnished to provide additional information and is a non-GAAP financial performance measure.
CASH COSTS PER GOLD OUNCE SOLD
Cash costs(1) include mine site operating costs such as mining, processing, administration, production taxes and royalties which are not based on sales or taxable income calculations. Cash costs exclude DDA, exploration costs, accretion and amortization of reclamation and remediation, and capital, development and exploration spend. Cash costs include only items directly related to each mine site, and do not include any cost associated with the general corporate overhead structure.
The Company discloses cash costs because it understands that certain investors use this information to determine the Company’s ability to generate earnings and cash flows for use in investing and other activities. The Company believes that conventional measures of performance prepared in accordance with IFRS do not fully illustrate the ability of its operating mines to generate cash flows. The most directly comparable IFRS measure is cost of sales. As aforementioned, this non-GAAP measure does not have any standardized meaning prescribed under IFRS, and therefore may not be comparable to similar measures employed by other companies, should not be considered in isolation as a substitute for measures of performance prepared in accordance with IFRS, and is not necessarily indicative of operating costs, operating earnings or cash flows presented under IFRS.
Cash costs(1) are computed on a weighted average basis, with the aforementioned costs, net of by-product revenue credits from sales of silver, being the numerator in the calculation, divided by gold ounces sold.
| 36
ALLIED GOLD
MANAGEMENT'S DISCUSSION AND ANALYSIS
For the three months ended March 31, 2026
AISC PER GOLD OUNCE SOLD
AISC(1) figures are calculated generally in accordance with a standard developed by the World Gold Council (“WGC”), a non-regulatory, market development organization for the gold industry. Adoption of the standard is voluntary, and the standard is an attempt to create uniformity and a standard amongst the industry and those that adopt it. Nonetheless, the cost measures presented herein may not be comparable to other similarly titled measures of other companies. The Company is not a member of the WGC at this time.
AISC(1) include cash costs(1) (as defined above), mine sustaining capital expenditures (including stripping), sustaining mine-site exploration and evaluation expensed and capitalized, and accretion and amortization of reclamation and remediation. AISC(1) exclude capital expenditures attributable to projects or mine expansions, exploration and evaluation costs attributable to growth projects, DDA, income tax payments, borrowing costs and dividend payments. AISC(1) include only items directly related to each mine site, and do not include any cost associated with the general corporate overhead structure. As a result, Total AISC(1) represent the weighted average of the three operating mines, and not a consolidated total for the Company. Consequently, this measure is not representative of all of the Company’s cash expenditures. Further, in relation to Bonikro, as the 2025 waste stripping benefits not only 2025 but also the following two years of production, the AISC per ounce sold figure accounts for the allocation of the stripping spend over the ounces it benefits through 2027.
Sustaining capital expenditures are expenditures that do not increase annual gold ounce production at a mine site and excludes all expenditures at the Company’s development projects as well as certain expenditures at the Company’s operating sites that are deemed expansionary in nature, such as the Sadiola Phased Expansion and the construction and development of Kurmuk. Exploration capital expenditures represent exploration spend that has met criteria for capitalization under IFRS.
The Company discloses AISC, as it believes that the measure provides useful information and assists investors in understanding total sustaining expenditures of producing and selling gold from current operations, and evaluating the Company’s operating performance and its ability to generate cash flow. The most directly comparable IFRS measure is cost of sales. As aforementioned, this non-GAAP measure does not have any standardized meaning prescribed under IFRS, and therefore may not be comparable to similar measures employed by other companies, should not be considered in isolation as a substitute for measures of performance prepared in accordance with IFRS, and is not necessarily indicative of operating costs, operating earnings or cash flows presented under IFRS.
AISC are computed on a weighted average basis, with the aforementioned costs, net of by-product revenue credits from sales of silver, being the numerator in the calculation, divided by gold ounces sold.
The following tables provide detailed reconciliations from total costs of sales to cash costs(1) and AISC(1). Subtotals and per unit measures may not calculate based on amounts presented in the following tables due to rounding.
| 37
ALLIED GOLD
MANAGEMENT'S DISCUSSION AND ANALYSIS
For the three months ended March 31, 2026
| | | | | | | | | | | | | | | | | | | | | | | | | | |
| | |
| | | | | | | |
| | | | | | | | |
| | | | | | | | |
| | | | | | | | |
| | | | | | | | |
| | | | | | | | |
| | | | | | | | |
| | | | | | | | |
| | | | | | | | |
| | | | | | | | |
| | | | | | | | |
| | | | | | | | |
| | | | | | | | |
| | | | | | | | |
| | | | | | | | |
| | | | | | | | |
| | | | | | | | |
| | | | | | | | |
| | | | | | | | |
| | | | | | | | |
| | | | | | | | |
| | | | | | | | |
| | | | | | | | |
| | | | | | | | |
| | | | | | | | |
| (In thousands of US Dollars, unless otherwise noted) | For three months ended March 31, 2026 | For three months ended March 31, 2025 |
| Bonikro | Agbaou | Sadiola | Total | Bonikro | Agbaou | Sadiola | Total |
| Cost of Sales, excluding DDA | $ | 44,992 | | $ | 41,313 | | $ | 116,954 | | $ | 203,259 | | $ | 29,218 | | $ | 26,158 | | $ | 152,416 | | $ | 207,792 | |
| DDA | 7,873 | | 7,253 | | 4,797 | | 19,923 | | 6,799 | | 1,783 | | 10,375 | | 18,957 | |
| Cost of Sales | $ | 52,865 | | $ | 48,566 | | $ | 121,751 | | $ | 223,182 | | $ | 36,017 | | $ | 27,941 | | $ | 162,791 | | $ | 226,749 | |
| Cash Cost Adjustments | | | | | | | | |
| DDA | $ | (7,873) | | $ | (7,253) | | $ | (4,797) | | $ | (19,923) | | $ | (6,799) | | $ | (1,783) | | $ | (10,375) | | $ | (18,957) | |
| Cost of production of ounces delivered as dividend prepayment | — | | — | | — | | — | | — | | — | | 9,135 | | 9,135 | |
| Agbaou Contingent Consideration | — | | 2,326 | | — | | 2,326 | | — | | 1,120 | | — | | 1,120 | |
| Silver by-Product credit | (659) | | (159) | | (223) | | (1,041) | | (137) | | (71) | | (48) | | (256) | |
Total Cash Costs(1) | $ | 44,333 | | $ | 43,480 | | $ | 116,731 | | $ | 204,544 | | $ | 29,081 | | $ | 27,207 | | $ | 161,503 | | $ | 217,791 | |
| | | | | | | | |
AISC(1) Adjustments to Total Cash Costs(1) noted above | | | | | | | | |
| Reclamation & Remediation Accretion | $ | 161 | | $ | 113 | | $ | 504 | | $ | 778 | | $ | 137 | | $ | 156 | | $ | 419 | | $ | 712 | |
| Exploration Capital | 945 | | 1,380 | | 185 | | 2,510 | | 675 | | 688 | | 113 | | 1,476 | |
| Exploration Expenses | — | | — | | 3,392 | | 3,392 | | 445 | | 235 | | 2,432 | | 3,112 | |
| Sustaining Capital Expenditures | 5,124 | | 8,445 | | 714 | | 14,283 | | 2,452 | | 10,831 | | 1,109 | | 14,392 | |
| IFRS 16 Lease Adjustments | 322 | | 322 | | — | | 644 | | 322 | | 322 | | — | | 644 | |
Total AISC(1) | $ | 50,885 | | $ | 53,740 | | $ | 121,526 | | $ | 226,151 | | $ | 33,112 | | $ | 39,439 | | $ | 165,576 | | $ | 238,127 | |
| | | | | | | | |
| Gold Ounces Sold | 31,265 | | 22,618 | | 45,995 | | 99,878 | | 20,924 | | 18,563 | | 92,033 | | 131,520 | |
| Gold Ounces Sold excluding ounces distributed as dividend-in-kind | 31,265 | | 22,618 | | 45,995 | | 99,878 | | 20,924 | | 18,563 | | 83,878 | | 123,365 | |
| | | | | | | | |
| Cost of Sales per Gold Ounce Sold | $ | 1,691 | | $ | 2,147 | | $ | 2,647 | | $ | 2,235 | | $ | 1,721 | | $ | 1,505 | | $ | 1,941 | | $ | 1,838 | |
Cash Cost(1) per Gold Ounce Sold | $ | 1,418 | | $ | 1,922 | | $ | 2,538 | | $ | 2,048 | | $ | 1,390 | | $ | 1,466 | | $ | 1,755 | | $ | 1,656 | |
AISC(1) per Gold Ounce Sold | $ | 1,628 | | $ | 2,376 | | $ | 2,642 | | $ | 2,264 | | $ | 1,582 | | $ | 2,125 | | $ | 1,799 | | $ | 1,811 | |
GROSS PROFIT EXCLUDING DDA
The Company uses the financial measure “Gross Profit excluding DDA” to supplement information in its financial statements. The Company believes that in addition to conventional measures prepared in accordance with IFRS, the Company and certain investors and analysts use this information to evaluate the Company’s performance.
Gross profit excluding DDA is calculated as Gross Profit plus DDA.
The Company discloses Gross Profit excluding DDA(1) because it understands that certain investors use this information to determine the Company’s ability to generate earnings and cash flows. The Company believes that conventional measures of performance prepared in accordance with IFRS do not fully illustrate the ability of its operating mines to generate cash flows. The most directly comparable IFRS measure is Gross Profit. As aforementioned, this non-GAAP measure does not have any standardized meaning prescribed under IFRS, and therefore may not be comparable to similar measures employed by other companies, should not be considered in isolation as a substitute for measures of performance prepared in accordance with IFRS, and is not necessarily indicative of operating costs, operating earnings or cash flows presented under IFRS.
| 38
ALLIED GOLD
MANAGEMENT'S DISCUSSION AND ANALYSIS
For the three months ended March 31, 2026
The reconciliation of Gross Profit to Gross Profit Excluding DDA can be found in Section 1: Highlights and Relevant Updates of this MD&A, under the Summary of Financial Results and Section 4: Review of Operations and Mine Performance, for the relevant mines.
ADJUSTED NET EARNINGS (LOSS) AND ADJUSTED NET EARNINGS (LOSS) PER SHARE
The Company uses the financial measures “Adjusted Net Earnings (Loss)”(1) and the non-GAAP ratio “Adjusted Net Earnings (Loss) per share”(1) to supplement information in its financial statements. The Company believes that in addition to conventional measures prepared in accordance with IFRS, the Company and certain investors and analysts use this information to evaluate the Company’s performance.
Adjusted Net Earnings (Loss)(1) and Adjusted Net Earnings (Loss)(1) per share are calculated as Net Earnings (Loss) attributable to Shareholders of the Company, excluding non-recurring items, items not related to a particular period and/or not directly related to the core mining business such as the following, with notation of Gains (Losses) as they would show up on the financial statements.
•Gains (losses) related to the reverse takeover transaction events and other items,
•Gains (losses) on the revaluation of historical call and put options,
•Unrealized Gains (losses) on financial instruments and embedded derivatives,
•Write-offs (reversals) on mineral interest, exploration and evaluation and other assets,
•Gains (losses) on sale of assets,
•Unrealized foreign exchange gains (losses),
•Share-based (expense) and other share-based compensation,
•Unrealized foreign exchange gains (losses) related to revaluation of deferred income tax asset and liability on non-monetary items,
•Deferred income tax recovery (expense) on the translation of foreign currency inter-corporate debt,
•One-time tax adjustments to historical deferred income tax balances relating to changes in enacted tax rates,
•Non-recurring provisions,
•Any other non-recurring adjustments and the tax impact of any of these adjustments calculated at the statutory effective rate for the same jurisdiction as the adjustment.
Non-recurring adjustments from unusual events or circumstances are reviewed from time to time based on materiality and the nature of the event or circumstance.
Management uses these measures for internal valuation of the core mining performance for the period and to assist with planning and forecasting of future operations. Management believes that the presentation of Adjusted Net Earnings (Loss) and Adjusted Net Earnings (Loss) per share provide useful information to investors because they exclude non-recurring items, items not related to or not indicative of current or future periods' results and/or not directly related to the core mining business and are a better indication of the Company’s profitability from operations as evaluated by internal management and the board of directors. The items excluded from the computation of Adjusted Net Earnings (Loss)(1) and Adjusted Net Earnings (Loss)(1) per share, which are otherwise included in the determination of Net Earnings (Loss) and Net Earnings (Loss) per share prepared in accordance with IFRS, are items that the Company does not consider to be meaningful in evaluating the Company’s past financial performance or the future prospects and may hinder a comparison of its period-to-period profitability.
The most directly comparable IFRS measure is Net Earnings (Loss). As aforementioned, this non-GAAP measure does not have any standardized meaning prescribed under IFRS, and therefore may not be comparable to similar measures employed by other companies, should not be considered in isolation as a substitute for measures of performance prepared in accordance with IFRS, and is not necessarily indicative of operating costs, operating earnings or cash flows presented under IFRS.
The reconciliation of Net (Loss) Earnings to attributable to Shareholders of the Company to Adjusted Net Earnings can be found in Section 1: Highlights and Relevant Updates of this MD&A, under the Summary of Financial Results.
EBITDA AND ADJUSTED EBITDA
The Company uses the financial measures “EBITDA” and "Adjusted EBITDA” to supplement information in its financial statements. The Company believes that in addition to conventional measures prepared in accordance with IFRS, the Company and certain investors and analysts use this information to evaluate the Company’s performance.
EBITDA(1) is calculated as Net Earnings (Loss), plus Finance Costs, DDA, Current income tax expense and Deferred income tax expense. Adjusted EBITDA calculated is further calculated as EBITDA(1), excluding non-recurring items, items not related to a particular period and/
| 39
ALLIED GOLD
MANAGEMENT'S DISCUSSION AND ANALYSIS
For the three months ended March 31, 2026
or not directly related to the core mining business such as the following, with notation of Gains (Losses) as they would show up on the financial statements.
•Gains (losses) on the revaluation of historical call and put options,
•Unrealized Gains (losses) on financial instruments and embedded derivatives,
•Write-offs (reversals) on mineral interest, exploration and evaluation and other assets,
•Gains (losses) on sale of assets,
•Unrealized foreign exchange gains (losses),
•Share-based (expense) and other share-based compensation,
•Unrealized foreign exchange gains (losses) related to revaluation of deferred income tax asset and liability on non-monetary items,
•Non-recurring provisions,
•Non-recurring adjustments from unusual events or circumstances are reviewed from time to time based on materiality and the nature of the event or circumstance.
Management uses these measures for internal valuation of the cash flow generation ability of the period and to assist with planning and forecasting of future operations. Management believes that the presentation of EBITDA(1) and Adjusted EBITDA(1) provide useful information to investors because they exclude non-recurring items, items not related to or not indicative of current or future periods' results and/or not directly related to the core mining business and are a better indication of the Company’s cash flow from operations as evaluated by internal management and the board of directors. The items excluded from the computation of Adjusted EBITDA(1), which are otherwise included in the determination of Net Earnings (Loss) prepared in accordance with IFRS, are items that the Company does not consider to be meaningful in evaluating the Company’s past financial performance or the future prospects and may hinder a comparison of its period-to-period performance comparisons.
The most directly comparable IFRS measure is Net Earnings (Loss). As aforementioned, this non-GAAP measure does not have any standardized meaning prescribed under IFRS, and therefore may not be comparable to similar measures employed by other companies, should not be considered in isolation as a substitute for measures of performance prepared in accordance with IFRS, and is not necessarily indicative of operating costs, operating earnings or cash flows presented under IFRS.
| | | | | | | | | | |
| (In thousands of US Dollars) | | For three months ended March 31, |
| | 2026 | 2025 |
Net (Loss) Earnings | | | $ | (44,464) | | $ | 39,937 | |
| Finance costs, net | | | $ | 5,798 | | $ | 5,310 | |
| DDA | | | 19,923 | | 18,957 | |
| Current income tax expense | | | 64,835 | | 27,700 | |
| Deferred income tax expense | | | 31,617 | | 11,344 | |
| | | | |
| | | | |
| | | | |
| | | | |
EBITDA(1) | | | $ | 77,709 | | $ | 103,248 | |
| | | | | | | | | | |
| (In thousands of US Dollars) | For three months ended March 31, | |
2026 | 2025 | | |
EBITDA(1) | $ | 77,709 | | $ | 103,248 | | | |
| | | | |
| | | | |
| Loss on revaluation of financial instruments | 37,839 | | 14,116 | | | |
| | | | |
| | | | |
| Share-based compensation | 55,200 | | 4,107 | | | |
| Other | 2,527 | | 12,363 | | | |
| | | | |
| | | | |
Adjusted EBITDA(1) | $ | 173,275 | | $ | 133,834 | | | |
| 40
ALLIED GOLD
MANAGEMENT'S DISCUSSION AND ANALYSIS
For the three months ended March 31, 2026
12. CAUTIONARY STATEMENTS AND INTERNAL CONTROLS OVER FINANCIAL REPORTING
This MD&A provides a discussion and analysis of the financial condition and results of operations to enable a reader to assess material changes in financial condition between March 31, 2026, and December 31, 2025, and results of operations for the three months ended March 31, 2026, and March 31, 2025.
This MD&A has been prepared as of May 14, 2026. This MD&A is intended to supplement and complement the Condensed Consolidated Interim Financial Statements prepared in accordance with IFRS. Readers are encouraged to review the Consolidated Financial Statements in conjunction with their review of this MD&A. Certain notes to the Consolidated Financial Statements are specifically referred to in this MD&A. All dollar amounts in the MD&A are in US Dollars, unless otherwise specified.
CAUTIONARY STATEMENT REGARDING FORWARD-LOOKING INFORMATION
This MD&A contains “forward-looking information” including "future oriented financial information" under applicable Canadian securities legislation. Except for statements of historical fact relating to the Company, information contained herein constitutes forward-looking information, including, but not limited to, any information as to the Company’s strategy, objectives, plans or future financial or operating performance. Forward-looking statements are characterized by words such as “plan”, “expect”, “budget”, “target”, “project”, “intend”, “believe”, “anticipate”, “estimate” and other similar words or negative versions thereof, or statements that certain events or conditions “may”, “will”, “should”, “would” or “could” occur. In particular, forward looking information included in this MD&A includes, without limitation, statements with respect to:
•the Company’s expectations in connection with the production and exploration, development and expansion plans at the Company’s projects discussed herein being met;
•the Company’s plans to continue building on its base of significant gold production, development-stage properties, exploration properties and land positions in Mali, Côte d’Ivoire and Ethiopia through optimization initiatives at existing operating mines, development of new mines, the advancement of its exploration properties and, at times, by targeting other consolidation opportunities with a primary focus in Africa;
•the Company’s expectations relating to the performance of its mineral properties;
•the estimation of Mineral Reserves and Mineral Resources;
•the timing and amount of estimated future production;
•the estimation of the life of mine of the Company’s projects;
•the timing and amount of estimated future capital and operating costs;
•the costs and timing of exploration and development activities;
•the Company’s expectation regarding the timing of feasibility or pre-feasibility studies, conceptual studies or environmental impact assessments;
•the Company’s expectations with respect to the Arrangement (as defined herein), including the ability of the Company and Zijin Gold (as defined herein) to obtain all necessary regulatory approvals in connection with the Arrangement in a timely manner or at all, and to satisfy all other conditions precedent in the Arrangement Agreement (as defined herein);
•the effect of government regulations (or changes thereto) with respect to restrictions on production, export controls, income taxes, expropriation of property, repatriation of profits, environmental legislation, land use, water use, land claims of local people, mine safety and receipt of necessary permits;
•the Company’s community relations in the locations where it operates and the further development of the Company’s social responsibility programs;
•the Company’s expectations regarding the payment of any future dividends; and
•the Company’s plans to continue implementing and scaling the Energy Program (as defined herein), including expectations regarding energy needs and the performance of the Energy Program.
Forward-looking information is based on the opinions, assumptions and estimates of management considered reasonable at the date the statements are made, and is inherently subject to a variety of risks and uncertainties and other known and unknown factors that could cause actual events or results to differ materially from those projected in the forward-looking information. These factors include the Company’s dependence on products produced from its key mining assets; fluctuating price of gold; risks relating to the exploration, development and operation of mineral properties, including but not limited to adverse environmental and climatic conditions, unusual and unexpected geologic conditions and equipment failures; risks relating to operating in emerging markets, particularly Africa, including risk of government expropriation or nationalization of mining operations; health, safety and environmental risks and hazards to which the Company’s operations are subject; the Company’s ability to obtain all necessary regulatory approvals in connection with the Arrangement in a timely manner or at all; the ability of Zijin Gold to obtain all necessary shareholder and regulatory approvals in connection with the
| 41
ALLIED GOLD
MANAGEMENT'S DISCUSSION AND ANALYSIS
For the three months ended March 31, 2026
Arrangement in a timely manner or at all; the ability of the Company and Zijin Gold to satisfy all conditions precedent to the completion of the Arrangement; the Company’s ability to maintain or increase present level of gold production; nature and climatic condition risks; counterparty, credit, liquidity and interest rate risks and access to financing; cost and availability of commodities; increases in costs of production, such as fuel, steel, power, labour and other consumables; risks associated with infectious diseases; uncertainty in the estimation of Mineral Reserves and Mineral Resources; the Company’s ability to replace and expand Mineral Resources and Mineral Reserves, as applicable, at its mines; factors that may affect the Company’s future production estimates, including but not limited to the quality of ore, production costs, infrastructure and availability of workforce and equipment; risks relating to partial ownerships and/or joint ventures at the Company’s operations; reliance on the Company’s existing infrastructure and supply chains at the Company’s operating mines; risks relating to the acquisition, holding and renewal of title to mining rights and permits, and changes to the mining legislative and regulatory regimes in the Company’s operating jurisdictions; limitations on insurance coverage; risks relating to illegal and artisanal mining; the Company’s compliance with anti-corruption laws; risks relating to the development, construction and start-up of new mines, including but not limited to the availability and performance of contractors and suppliers, the receipt of required governmental approvals and permits, and cost overruns; risks relating to acquisitions and divestitures; title disputes or claims; risks relating to the termination of mining rights; risks relating to security and human rights; risks associated with processing and metallurgical recoveries; risks related to enforcing legal rights in foreign jurisdictions; competition in the precious metals mining industry; risks related to the Company’s ability to service its debt obligations; fluctuating currency exchange rates (including the US Dollar, Euro, West African CFA Franc and Ethiopian Birr exchange rates); the values of assets and liabilities based on projected future conditions and potential impairment charges; risks related to shareholder activism; timing and possible outcome of pending and outstanding litigation and labour disputes; risks related to the Company’s investments and use of derivatives; taxation risks; scrutiny from non-governmental organizations; labour and employment relations; risks related to third-party contractor arrangements; repatriation of funds from foreign subsidiaries; community relations; risks related to relying on local advisors and consultants in foreign jurisdictions; the impact of global financial, economic and political conditions, global liquidity, interest rates, inflation and other factors on the Company’s results of operations and market price of common shares; risks associated with financial projections; force majeure events; the Company’s plans with respect to dividend payment; transactions that may result in dilution to common shares; future sales of common shares by existing shareholders; the Company’s dependence on key management personnel and executives; possible conflicts of interest of directors and officers of the Company; the reliability of the Company’s disclosure and internal controls; compliance with international ESG disclosure standards and best practices; vulnerability of information systems including cyber attacks; the expected performance of the Energy Program not being realized; as well as those risk factors discussed or referred to herein.
Although the Company has attempted to identify important factors that could cause actual actions, events or results to differ materially from those described in forward-looking information, there may be other factors that could cause actions, events or results to not be as anticipated, estimated or intended. There can be no assurance that forward-looking information will prove to be accurate, as actual results and future events could differ materially from those anticipated in such statements. The Company undertakes no obligation to update forward-looking information if circumstances or management’s estimates, assumptions or opinions should change, except as required by applicable law. The reader is cautioned not to place undue reliance on forward-looking information. The forward-looking information contained herein is presented for the purpose of assisting investors in understanding the Company’s expected financial and operational performance and results as at and for the periods ended on the dates presented in the Company’s plans and objectives and may not be appropriate for other purposes.
NOTES ON MINERAL RESERVES AND MINERAL RESOURCES
Mineral Resources are stated effective as at December 31, 2025 are estimated in accordance with the 2014 Canadian Institute of Mining, Metallurgy and Petroleum Definition Standards for Mineral Resources and Mineral Reserves (“CIM Standards”) and National Instrument 43-101 Standards of Disclosure for Mineral Projects (“NI 43-101”). Where Mineral Resources are stated alongside Mineral Reserves, those Mineral Resources are inclusive of, and not in addition to, the stated Mineral Reserves. Mineral Resources that are not Mineral Reserves do not have demonstrated economic viability.
Mineral Reserves are stated effective as at December 31, 2025 and estimated in accordance with CIM Standards and NI 43-101. The Mineral Reserves:
•are inclusive of the Mineral Resources which were converted in line with the material classifications based on the level of confidence within the Mineral Resource estimate;
•reflect that portion of the Mineral Resources which can be economically extracted by open pit methods;
•consider the modifying factors and other parameters, including but not limited to the mining, metallurgical, social, environmental, statutory and financial aspects of the project;
•include an allowance for mining dilution and ore loss.
| 42
ALLIED GOLD
MANAGEMENT'S DISCUSSION AND ANALYSIS
For the three months ended March 31, 2026
Mineral Reserve and Mineral Resource estimates are shown on a 100% basis. Designated government entities and national minority shareholders hold the following interests in each of the mines: 20% of Sadiola, 35% of Korali-Sud, 10.1% of Bonikro and 15% of Agbaou. Only a portion of the government interests are carried. The Government of Ethiopia is entitled to a 7% equity participation in Kurmuk once the mine enters into commercial production and certain governmental commitments such as public road upgrades and installation of a power line are complete.
The Mineral Resource and Mineral Reserve estimates for each of the Company’s mineral properties have been approved by the qualified persons within the meaning of NI 43-101 as set forth below:
| | | | | | | | |
| Mineral Property | Qualified Person of Mineral Reserves | Qualified Person of Mineral Resources |
| Sadiola Mine | Esteban Chacon, Ing. Chilean Mining Commission | Alejandro Garrone, MAusIMM (CP) |
| Korali-Sud Mine | Esteban Chacon, Ing. Chilean Mining Commission | Alejandro Garrone, MAusIMM (CP) |
| Kurmuk Project | Esteban Chacon, Ing. Chilean Mining Commission | Chelsey Protulipac, P.Geo |
| Bonikro Mine | Esteban Chacon, Ing. Chilean Mining Commission | Chelsey Protulipac, P.Geo |
| Agbaou Mine | Esteban Chacon, Ing. Chilean Mining Commission | Chelsey Protulipac, P.Geo |
| | |
| | |
| | |
Except as otherwise disclosed, all scientific and technical information contained in this MD&A has been reviewed and approved by Sébastien Bernier, P.Geo (Senior Vice President, Technical Services). Mr. Bernier is an employee of Allied and a "Qualified Person" as defined by Canadian Securities Administrators' National Instrument 43-101 - Standards of Disclosure for Mineral Projects (“NI 43-101”)
INTERNAL CONTROLS OVER FINANCIAL REPORTING
Management’s Report on Internal Controls Over Financial Reporting (“ICFR”)
Management is responsible for establishing and maintaining adequate internal controls over financial reporting (“ICFR”), as defined in Rules 13a-15(f) and 15d-15(f) under the Securities Exchange Act of 1934, as amended, (the "Exchange Act") and National Instrument 52-109 Certification of Disclosure in Issuers’ Interim Filings (“NI 52-109”). ICFR is designed to provide reasonable assurance regarding the reliability of financial reporting and preparation of consolidated financial statements for external purposes in accordance with IFRS. Any system of ICFR, no matter how well designed, has inherent limitations. Therefore, even those systems determined to be effective can provide only reasonable assurance with respect to financial statement preparation and presentation.
Beginning with the Company’s second annual report following its listing on the NYSE, for 2026 financial results, the Company will be required to provide a management report on ICFR and the Company's independent registered public accounting firm will be required to attest to the effectiveness of ICFR once the Company is subject to the auditor attestation requirements under Section 404(b) of the Sarbanes‑Oxley Act.
Under the supervision and with the participation of management, including the Chairman & Chief Executive Officer and Chief Financial Officer, the Company has designed ICFR based on the framework issued by the Committee of Sponsoring Organizations of the Treadway Commission in Internal Control – Integrated Framework (2013) and conducted an evaluation of the design and operating effectiveness of the Company's ICFR as of December 31, 2025 and March 31, 2026.
In connection with the preparation and audit of the consolidated financial statements as of and for the year ended December 31, 2025, the Company identified deficiencies in its ICFR which were deemed to aggregate to a material weakness. A “material weakness” is a deficiency, or a combination of deficiencies, in ICFR such that there is a reasonable possibility that a material misstatement of the Company’s annual or interim financial statements will not be prevented or detected on a timely basis.
The material weaknesses relate primarily to deficiencies in the Company’s information technology general controls ("ITGCs") predominantly related to legacy systems and deficiencies in the Company’s process-level IT application controls, including weaknesses in access management, segregation of duties, and control execution, which collectively create a reasonable possibility that the Company’s ICFR would not prevent or detect a material misstatement on a timely basis.
| 43
ALLIED GOLD
MANAGEMENT'S DISCUSSION AND ANALYSIS
For the three months ended March 31, 2026
The Company has concluded that the material weaknesses resulted from limitations in its processes, systems, and resourcing, resulting in a pervasive potential impact to the consolidated financial statements. The control environment, systems architecture, documentation standards, and available resources require further redesign to meet the necessary formalized internal control, governance, and documentation requirements.
As remediation efforts are ongoing, the Company's Chairman & Chief Executive Officer and Chief Financial Officer concluded that, as of March 31, 2026 the Company has not yet remediated its material weaknesses. Consequently, it has been concluded that the Company did not maintain effective internal control over financial reporting.
Changes in ICFR
During the three months ended March 31, 2026, management continued remediation activities related to the previously identified material weaknesses. Other than in respect of the material weakness and related remediation, during the quarter ended March 31, 2026, no change occurred in the Company’s ICFR that has materially affected, or is reasonably likely to materially affect, the Company's ICFR.
Management’s Remediation Plan
The Company has developed and initiated a comprehensive remediation plan designed to strengthen the Company’s internal control environment and support sustainable public-company compliance, including:
•Completing enhancements and redesign of ITGCs for certain legacy systems;
•Continuing to perform ICFR and IT risk assessments and implementing additional control activities responsive to identified risks (including enhancements to IT general controls);
•Implementing automated controls and system-based validations, where feasible, to reduce reliance on manual processes and strengthen control consistency;
•Improving documentation and retention practices to ensure audit-ready support including clear supporting data sources, and evidence of timely review and approval in accordance with internal control and governance requirements;
•Completing the formalization of policies and procedures across finance and IT functions to align with public company governance standards and NYSE listing requirements;
•Continuing to engage a third-party advisor to support the SOX readiness efforts and to assist with control design, documentation, and testing in preparation for compliance with Section 404.
While management is making improvements to the Company’s control environment and business processes to support and scale with its growing operations, the remediation process is ongoing and the material weaknesses have not yet been fully remediated. The Company may not be able to fully remediate the material weaknesses until these steps have been completed and the internal controls have been operating effectively for a sufficient period of time.
This evaluation process, including testing the effectiveness of the remediation efforts, is expected to be substantially concluded prior to December 31, 2026, but may extend into 2027 as full remediation requires controls to operate effectively for a sufficient period of time.
Disclosure Controls and Procedures (“DCP”)
DCP have been designed to provide reasonable assurance that all relevant information required to be disclosed by the Company is gathered and communicated to senior management to allow timely decisions regarding required disclosure. Our Chairman & Chief Executive Officer and Chief Financial Officer, after evaluating the effectiveness of the Company's DCPs as of March 31, 2026, have concluded that, by implication of the aforementioned material weaknesses, the Company's DCPs were not effective in providing reasonable assurance that information required to be disclosed by the Company is (a) recorded, processed, summarized and reported within the time periods specified in the securities legislation, and (b) accumulated and communicated to management, including our Chairman & Chief Executive Officer and Chief Financial Officer, as appropriate, to allow timely decisions regarding required disclosure.
Control and Procedure Limitations
The Company’s management, including the Chairman & Chief Executive Officer and Chief Financial Officer, recognize that any ICFR and DCP, no matter how well designed or operated, have inherent limitations. Therefore, even those systems determined to be effective can provide only reasonable assurance that the objectives of the control system are achieved.
| 44
ALLIED GOLD
MANAGEMENT'S DISCUSSION AND ANALYSIS
For the three months ended March 31, 2026
ENDNOTES
(1)This is a non-GAAP financial performance measure. A cautionary note regarding non-GAAP financial performance measures, along with detailed reconciliations and descriptions, can be found in Section 11: Non-GAAP Financial Performance Measures.
(2)Adjustments to net earnings are those attributable to the Shareholders of the Company.
(3)Net working capital is defined as the excess of current assets over current liabilities. Current liabilities for the purpose of the net working capital calculation exclude the borrowings associated with the Convertible Debenture, which is classified as current as per IAS 1. Holders can convert at any time, but a conversion would not result in a cash outlay for the Company as it would be settled in shares.
(4)Historically, Cost of sales was presented inclusive of DDA. Cost of sales is the sum of mine production costs, royalties, and refining cost, while DDA refers to the sum of DDA of mining interests. Starting in the prior year, these figures appear on the face of the Consolidated Financial Statements. The metric “Total cost of sales per ounce sold” is defined as Cost of sales inclusive of DDA, divided by ounces sold.
(5)Each stock option is exercisable into one common share of the Company, upon vesting. Restricted share units once fully vested are redeemable into one common share of the Company.
(6)Working Capital movement refers to the sum of
a.(Increase) / decrease in trade and other receivables
b.(Increase) / decrease in inventories
c.Increase / (decrease) in trade and other payables
(7)The Government of Ethiopia is entitled to a 7% equity participation in Kurmuk once the mine enters commercial production and certain governmental commitments such as public road upgrades and installation of a power line are complete.
(8)Included in gold ounces sold for the three months ended March 31, 2025 are 8,155 ounces from Korali-Sud not included in revenue, as they were distributed to the Government of Mali as an advance dividend-in-kind at prevailing market prices.
(9)Cost of Sales per Gold Ounces Sold is determined based on ounces considered revenue not including those advanced as a dividend-in-kind, while Cash Costs(1) and AISC(1) are determined based on total sales of gold ounces, including the ounces advanced as a dividend-in-kind, along with the costs of production associated with those ounces.
| 45