Exhibit 99.1
| New York City Portfolio Presentation May 2026 May 2026 New York City Portfolio Presentation Cu self storage |
| 2 The forward-looking statements contained in this presentation are subject to various risks and known and unknown uncertainties . Although the Company believes the expectations reflected in such forward-looking statements are based on reasonable assumptions, there can be no assurance that the Company’s expectations will be achieved . Factors which could cause the Company’s actual results, performance, or achievements to differ significantly from the results, performance, or achievements expressed or implied by such statements are set forth under the captions “Item 1A. Risk Factors” and “Forward - Looking Statements” in our annual report on Form 10-K and in our quarterly reports on Form 10-Q and described from time to time in the Company’s filings with the SEC . Forward -looking statements are not guarantees of performance . For forward-looking statements herein, the Company claims the protection of the safe harbor for forward-looking statements contained in the Private Securities Litigation Reform Act of 1995. The Company assumes no obligation to update or supplement forward-looking statements that become untrue because of subsequent events. This presentation contains certain non-GAAP financial measures, including Net Operating Income (NOI), Funds From Operations (FFO), and Funds From Operations, as adjusted (FFO, as adjusted) . The definitions of these terms, the reasons for their use, and reconciliations to the most directly comparable GAAP measures are included in our Earnings Release as well as the Non-GAAP Financial Measures section under the caption “Management’s Discussion and Analysis of Financial Condition and Results of Operations” (or similar captions) in our annual report on Form 10-K and quarterly reports on Form 10-Q, and described from time to time in the Company’s filings with the SEC . Safe Harbor Statement Use of Non -GAAP Financial Measures Safe Harbor Statement The forward-looking statements contained in this presentation are subject to various risks and known and unknown uncertainties. Although the Company believes the expectations reflected in such forward-looking statements are based on reasonable assumptions, there can be no assurance that the Company"s expectations will be achieved . Factors which could cause the Company's actual results, performance, or achievements to differ significantly from the results, performance, or achievements expressed or implied by such statements are set forth under the captions "Item 1A. Risk Factors " and "Forward-Looking Statements" in our annual report on Form 10-K and in our quarterly reports on Form 10-Q and described from time to time in the Company's filings with the SEC . Forward-looking statements are not guarantees of performance. For forward-looking statements herein, the Company claims the protection of the safe harbor for forward-looking statements contained in the Private Securities Litigation Reform Act of 1995. The Company assumes no obligation to update or supplement forward-looking statements that become untrue because of subsequent events. Use of Non-GAAP Financial Measures This presentation contains certain non-GAAP financial measures, including Net Operating Income [NOi]. Funds From Operations [FFO]. and Funds From Operations, as adjusted [FFO, as adjusted]. The definitions of these terms, the reasons for their use, and reconciliations to the most directly comparable GAAP measures are included in our Earnings Release as well as the Non-GAAP Financial Measures section under the caption "Management's Discussion and Analysis of Financial Condition and Results of Operations" [or similar captions] in our annual report on Form 10-K and quarterly reports on Form 10-Q, and described from time to time in the Company's filings with the SEC . ® CuBE5MART· |
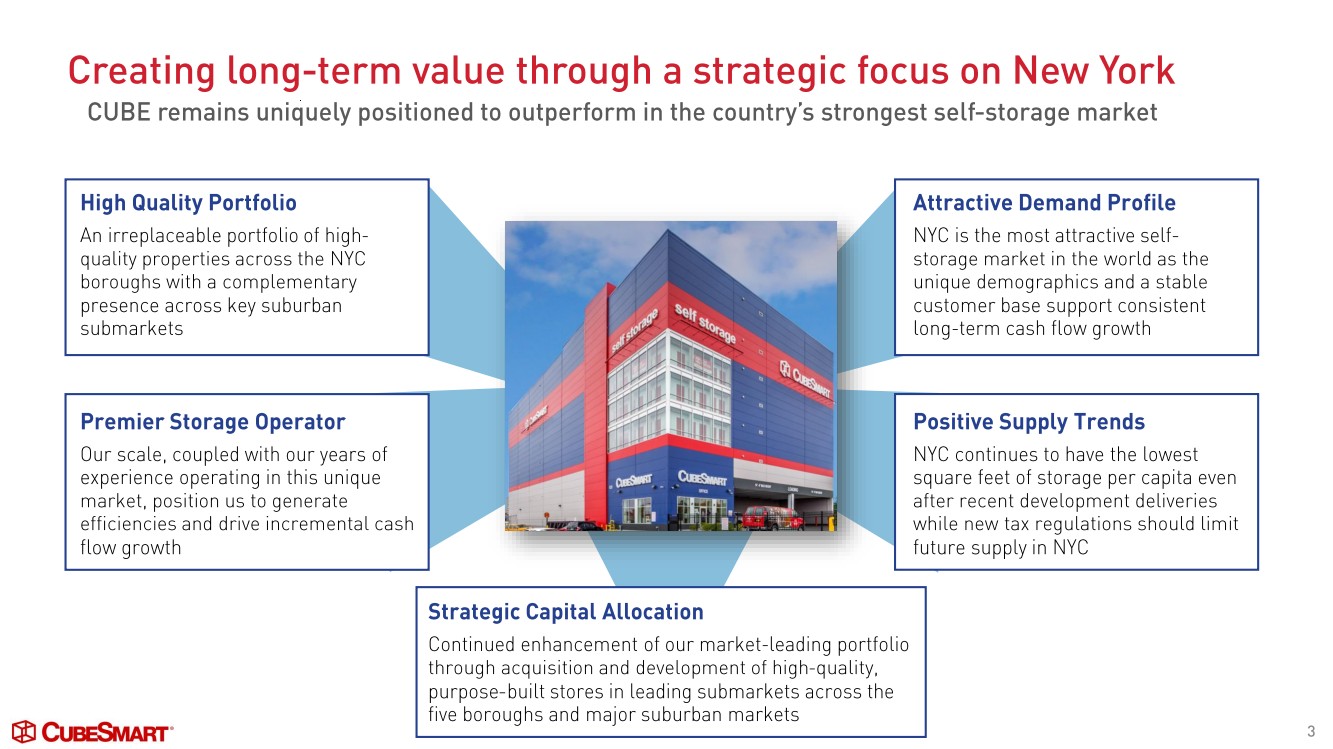
| 3 High Quality Portfolio An irreplaceable portfolio of high - quality properties across the NYC boroughs with a complementary presence across key suburban submarkets Premier Storage Operator Our scale, coupled with our years of experience operating in this unique market, position us to generate efficiencies and drive incremental cash flow growth Attractive Demand Profile NYC is the most attractive self - storage market in the world as the unique demographics and a stable customer base support consistent long -term cash flow growth Positive Supply Trends NYC continues to have the lowest square feet of storage per capita even after recent development deliveries while new tax regulations should limit future supply in NYC Strategic Capital Allocation Continued enhancement of our market -leading portfolio through acquisition and development of high -quality, purpose -built stores in leading submarkets across the five boroughs and major suburban markets Creating long -term value through a strategic focus on New York CUBE remains uniquely positioned to outperform in the country’s strongest self -storage market Creating long-term value through a strategic focus on New York CUBE remains uniquely positioned to outperform in the country's strongest self-storage market High Quality Portfolio An irreplaceable portfolio of high-quality properties across the NYC boroughs with a complementary presence across key su bu rba n submarkets Premier Storage Operator Our scale, coupled with our years of experience operating in this unique market, position us to generate efficiencies and drive incremental cash flow growth ® CuBE5MART· Strategic Capital Allocation Continued enhancement of our market-leading portfolio through acquisition and development of high-quality, purpose-built stores in leading submarkets across the five boroughs and major suburban markets Attractive Demand Profile NYC is the most attractive self-storage market in the world as the unique demographics and a stable customer base support consistent long-term cash flow growth Positive Supply Trends NYC continues to have the lowest square feet of storage per capita even after recent development deliveries while new tax regulations should limit future supply in NYC 3 |
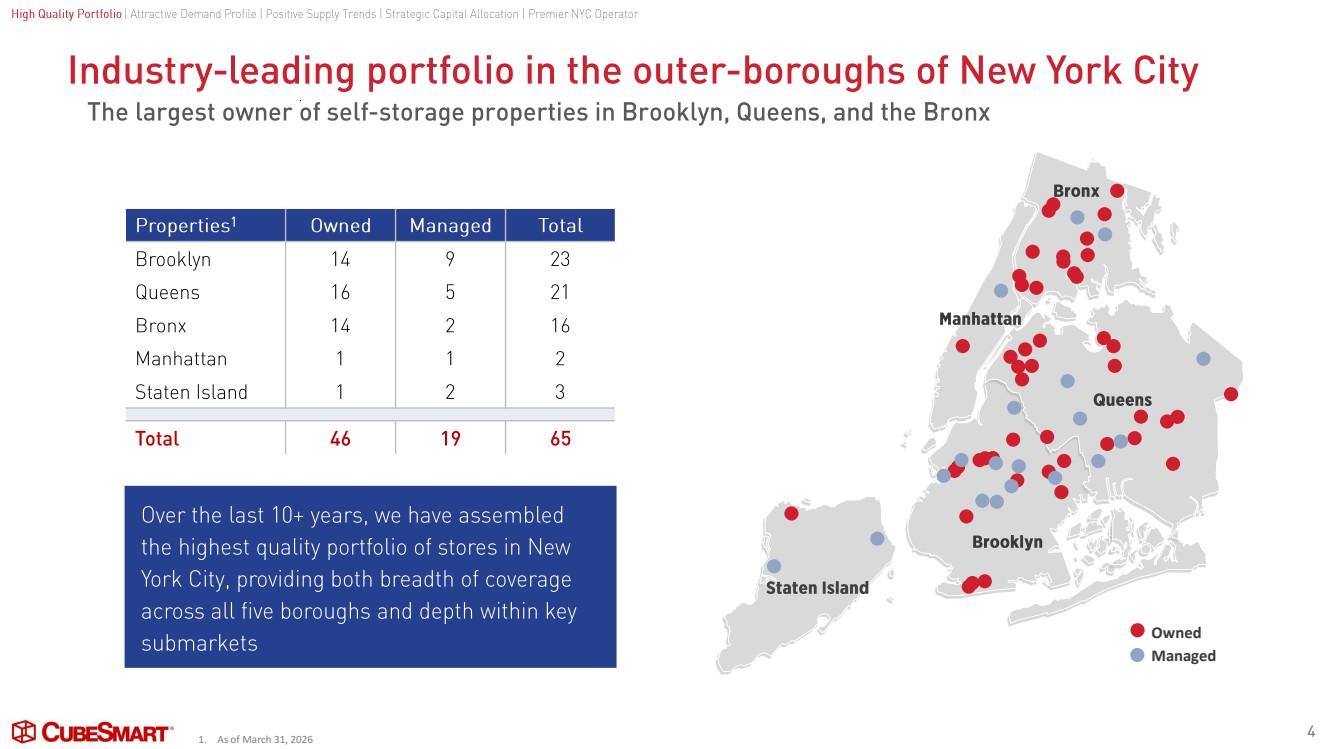
| 1. As of March 31, 2026 Industry -leading portfolio in the outer -boroughs of New York City 4 The largest owner of self -storage properties in Brooklyn, Queens, and the Bronx Over the last 10+ years, we have assembled the highest quality portfolio of stores in New York City, providing both breadth of coverage across all five boroughs and depth within key submarkets Properties 1 Owned Managed Total Brooklyn 14 9 23 Queens 16 5 21 Bronx 14 2 16 Manhattan 1 1 2 Staten Island 1 2 3 Total 46 19 65 Brooklyn Queens Bronx Manhattan Staten Island Owned Managed High Quality Portfolio High Quality Portfolio | Attractive Demand Profile | Positive Supply Trends | Strategic Capital Allocation | Premier NYC Operator I Attractive Demand Profile I Positive Supply Trends I Strategic Capital Allocation I Premier NYC Operator Industry-leading portfolio in the outer-boroughs of New York City The largest owner of self-storage properties in Brooklyn, Queens, and the Bronx Properties 1 Owned Managed Total Brooklyn 14 9 23 Queens 16 5 21 Bronx 14 2 16 Manhattan 1 1 2 Staten Island 1 2 3 Total 46 19 65 Over the last 1 O+ years, we have assembled the highest quality portfolio of stores in New York City, providing both breadth of coverage across all five boroughs and depth within key submarkets ® CuBE5MART· • Brooklyn Staten Island Queens . ·- •• • • • • • 4 |
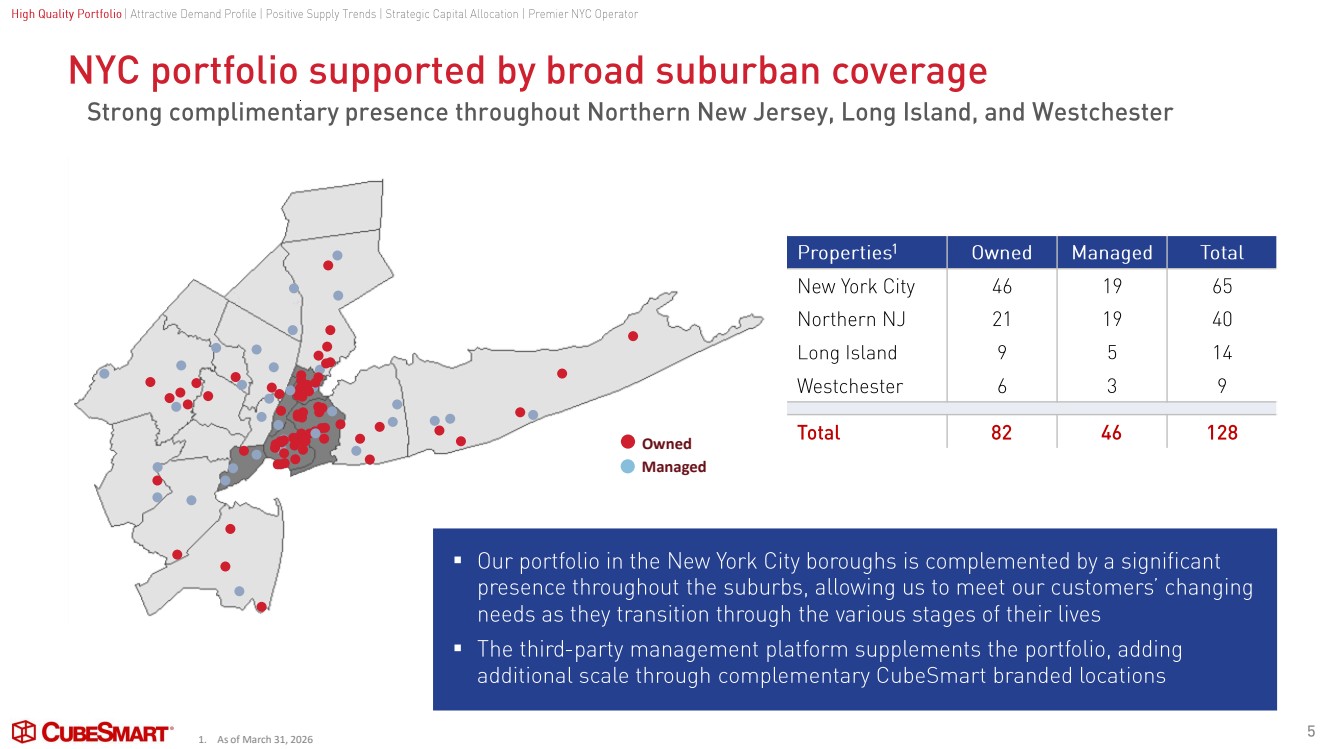
| NYC portfolio supported by broad suburban coverage 5 Strong complimentary presence throughout Northern New Jersey, Long Island, and Westchester ▪ Our portfolio in the New York City boroughs is complemented by a significant presence throughout the suburbs, allowing us to meet our customers’ changing needs as they transition through the various stages of their lives ▪ The third -party management platform supplements the portfolio, adding additional scale through complementary CubeSmart branded locations Properties 1 Owned Managed Total New York City 46 19 65 Northern NJ 21 19 40 Long Island 9 5 14 Westchester 6 3 9 Total 82 46 128 Owned Managed 1. As of March 31, 2026 High Quality Portfolio High Quality Portfolio | Attractive Demand Profile | Positive Supply Trends | Strategic Capital Allocation | Premier NYC Operator I Attractive Demand Profile I Positive Supply Trends I Strategic Capital Allocation I Premier NYC Operator NYC portfolio supported by broad suburban coverage Strong complimentary presence throughout Northern New Jersey, Long Island, and Westchester Properties 1 Owned Managed Total New York City 46 19 65 Northern NJ 21 19 40 Long Island 9 5 14 • Westchester 6 3 9 •• • Total 82 46 128 • ® CuBE5MART· 5 |
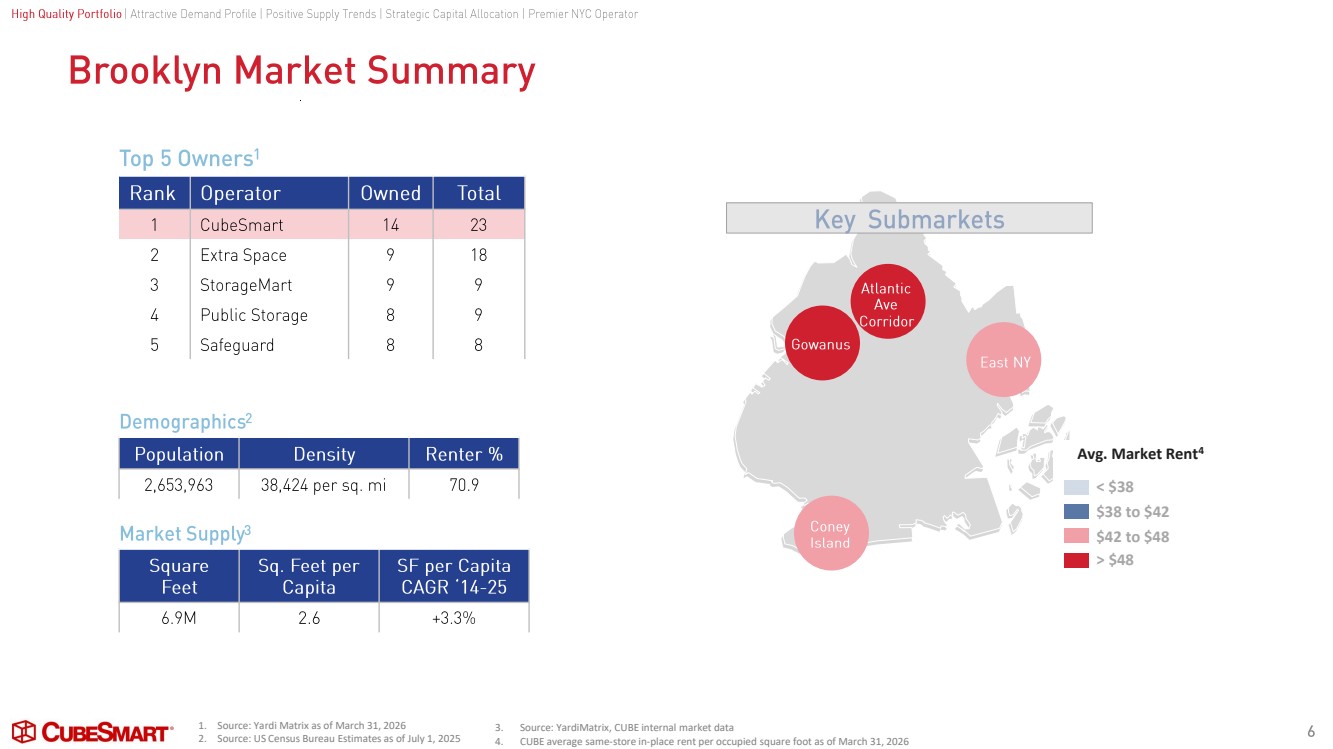
| Brooklyn Market Summary 6 Population Density Renter % 2,653,963 38,424 per sq. mi 70.9 Rank Operator Owned Total 1 CubeSmart 14 23 2 Extra Space 9 18 3 StorageMart 9 9 4 Public Storage 8 9 5 Safeguard 8 8 Top 5 Owners 1 Demographics 2 Square Feet Sq. Feet per Capita SF per Capita CAGR ‘14 - 25 6.9M 2.6 +3.3% Market Supply 3 Coney Island Gowanus East NY Atlantic Ave Corridor Key Submarkets < $38 $38 to $42 $42 to $48 > $48 Avg. Market Rent4 1. Source: Yardi Matrix as of March 31, 2026 2. Source: US Census Bureau Estimates as of July 1, 2025 3. Source: YardiMatrix, CUBE internal market data 4. CUBE average same-store in-place rent per occupied square foot as of March 31, 2026 High Quality Portfolio High Quality Portfolio | Attractive Demand Profile | Positive Supply Trends | Strategic Capital Allocation | Premier NYC Operator I Attractive Demand Profile I Positive Supply Trends I Strategic Capital Allocation I Premier NYC Operator Brooklyn Market Summary Top 5 Owners 1 I; Operator •·kh,i§,■ 1 CubeSmart 2 Extra Space 3 StorageMart 4 Public Storage 5 Safeguard Demographics2 Density 14 9 9 8 8 38,424 per sq . mi Market Supply3 Square Feet 6.9M ® CuBE5MART· Sq. Feet per Capita 2.6 Total 23 18 9 9 8 Key Submarkets . - . - • • • 6 |
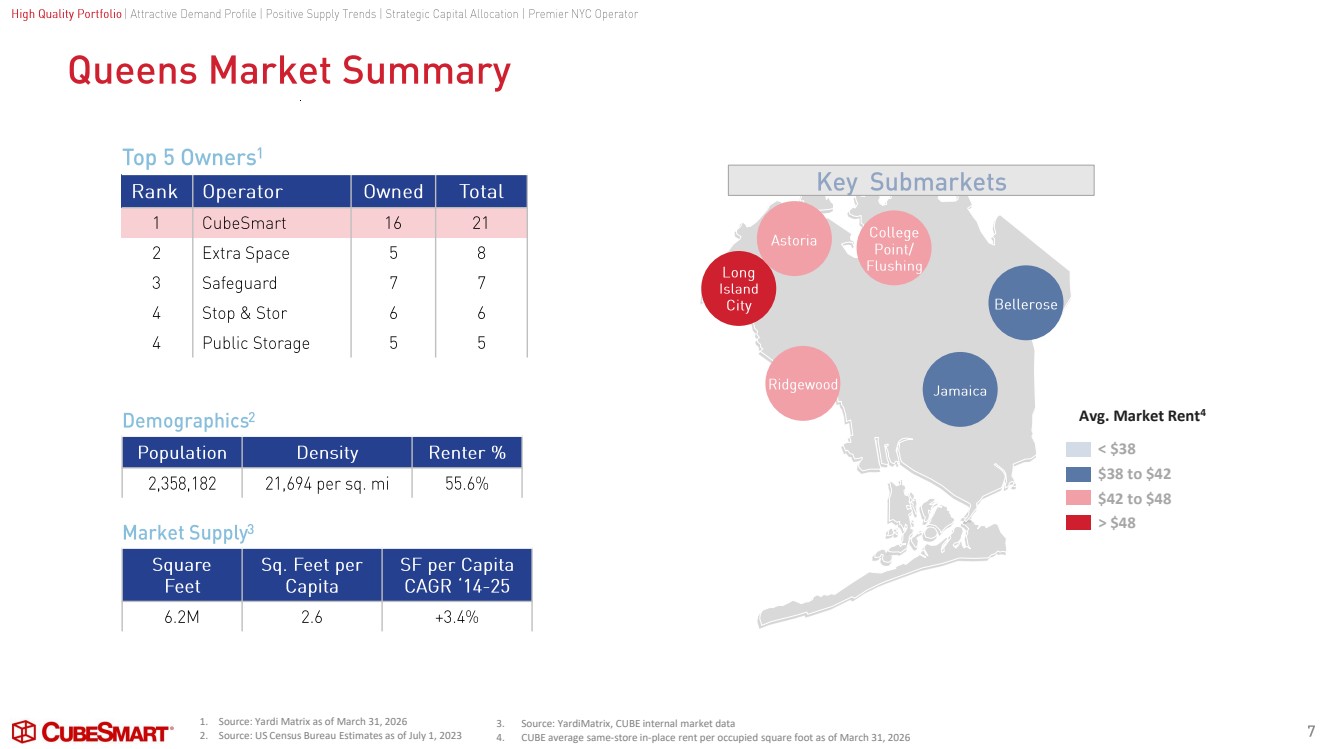
| Queens Market Summary 7 Top 5 Owners 1 Rank Operator Owned Total 1 CubeSmart 16 21 2 Extra Space 5 8 3 Safeguard 7 7 4 Stop & Stor 6 6 4 Public Storage 5 5 Population Density Renter % 2,358,182 21,694 per sq. mi 55.6% Demographics 2 Square Feet Sq. Feet per Capita SF per Capita CAGR ‘14 - 25 6.2M 2.6 +3.4% Market Supply 3 Ridgewood Jamaica Long Island City Astoria College Point/ Flushing Bellerose Key Submarkets < $38 $38 to $42 $42 to $48 > $48 Avg. Market Rent4 1. Source: Yardi Matrix as of March 31, 2026 2. Source: US Census Bureau Estimates as of July 1, 2023 3. Source: YardiMatrix, CUBE internal market data 4. CUBE average same-store in-place rent per occupied square foot as of March 31, 2026 High Quality Portfolio High Quality Portfolio | Attractive Demand Profile | Positive Supply Trends | Strategic Capital Allocation | Premier NYC Operator I Attractive Demand Profile I Positive Supply Trends I Strategic Capital Allocation I Premier NYC Operator Queens Market Summary Top 5 Owners1 lriH,ii Operator i•f}i,i§, ■ Total 1 CubeSmart 2 Extra Space 3 Safeguard 4 Stop & Stor 4 Public Storage Demographics2 Market Supply3 ® CuBE5MART· Sq. Feet per Capita 2.6 16 5 7 6 5 21 8 7 6 5 SF per Capita CAGR '14-25 +3.4% Key Submarkets • I - - - - 7 |
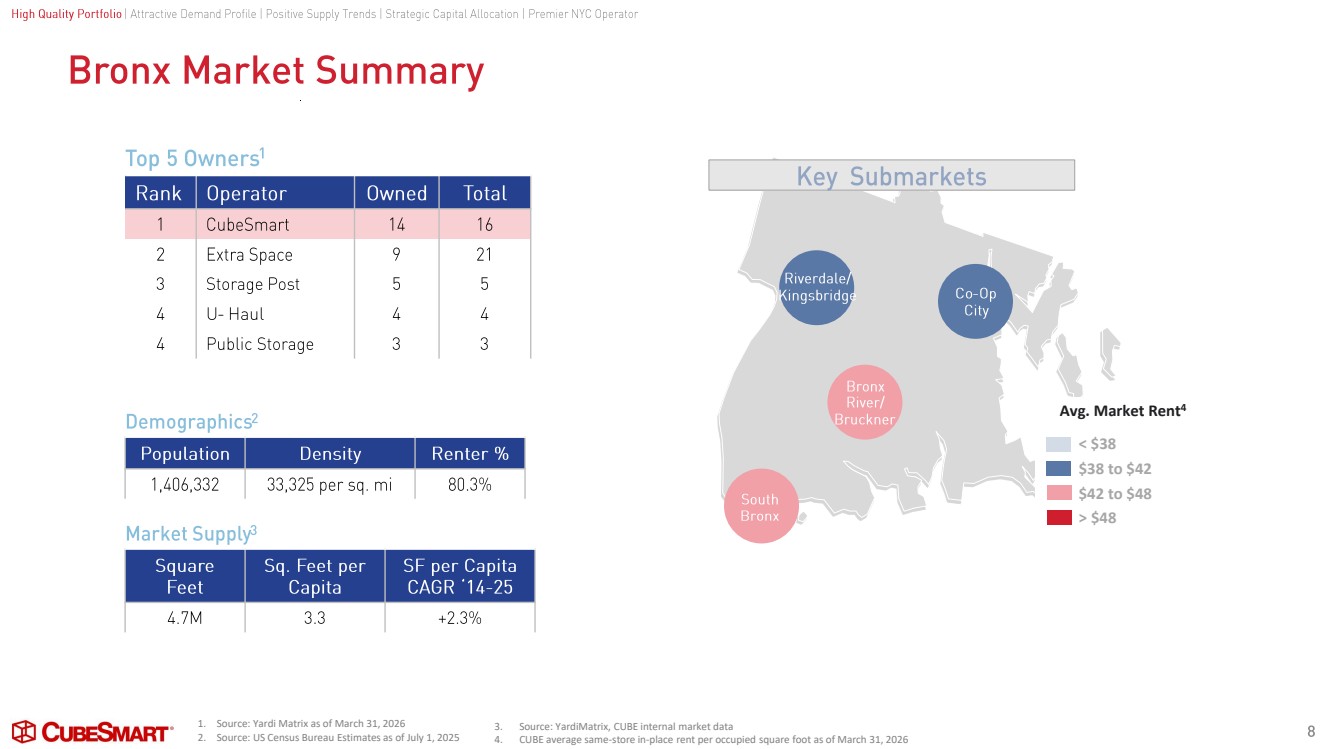
| Bronx Market Summary 8 Rank Operator Owned Total 1 CubeSmart 14 16 2 Extra Space 9 21 3 Storage Post 5 5 4 U- Haul 4 4 4 Public Storage 3 3 Top 5 Owners 1 Population Density Renter % 1,406,332 33,325 per sq. mi 80.3% Demographics 2 Square Feet Sq. Feet per Capita SF per Capita CAGR ‘14 - 25 4.7M 3.3 +2.3% Market Supply 3 Key Submarkets South Bronx Bronx River/ Bruckner Riverdale/ Kingsbridge Co -Op City < $38 $38 to $42 $42 to $48 > $48 Avg. Market Rent4 1. Source: Yardi Matrix as of March 31, 2026 2. Source: US Census Bureau Estimates as of July 1, 2025 3. Source: YardiMatrix, CUBE internal market data 4. CUBE average same-store in-place rent per occupied square foot as of March 31, 2026 High Quality Portfolio High Quality Portfolio | Attractive Demand Profile | Positive Supply Trends | Strategic Capital Allocation | Premier NYC Operator I Attractive Demand Profile I Positive Supply Trends I Strategic Capital Allocation I Premier NYC Operator Bronx Market Summary Top 5 Owners1 ,,.,u, Operator 1,fheil•• Total 1 CubeSmart Extra Space Storage Post U- Haul 2 3 4 4 Public Storage Demographics2 Density 14 9 5 4 3 16 21 5 4 3 33,325 per sq. mi Market Supply3 Square Feet 4.7M ® CuBE5MART· Sq. Feet per Capita 3.3 SF per Capita CAGR '14-25 +2 .3% Key Submarkets • . • - - - - 8 |
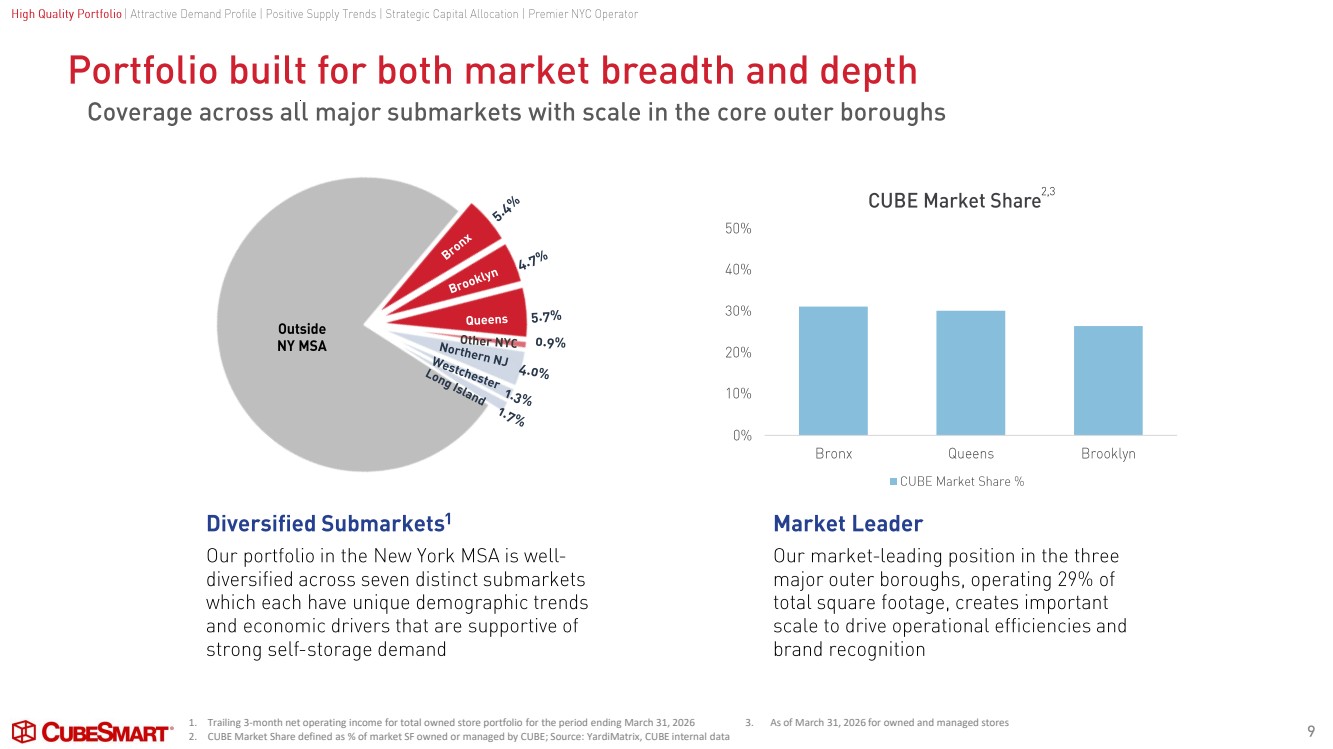
| 0% 10% 20% 30% 40% 50% Bronx Queens Brooklyn CUBE Market Share CUBE Market Share % 9 2,3 Diversified Submarkets 1 Our portfolio in the New York MSA is well - diversified across seven distinct submarkets which each have unique demographic trends and economic drivers that are supportive of strong self -storage demand Market Leader Our market -leading position in the three major outer boroughs, operating 29% of total square footage, creates important scale to drive operational efficiencies and brand recognition Outside NY MSA 1. Trailing 3-month net operating income for total owned store portfolio for the period ending March 31, 2026 2. CUBE Market Share defined as % of market SF owned or managed by CUBE; Source: YardiMatrix, CUBE internal data 3. As of March 31, 2026 for owned and managed stores Coverage across all major submarkets with scale in the core outer boroughs Portfolio built for both market breadth and depth High Quality Portfolio High Quality Portfolio | Attractive Demand Profile | Positive Supply Trends | Strategic Capital Allocation | Premier NYC Operator I Attractive Demand Profile I Positive Supply Trends I Strategic Capital Allocation I Premier NYC Operator Portfolio built for both market breadth and depth Coverage across all major submarkets with scale in the core outer boroughs ® CuBE5MART· Outside NYMSA Diversified Submarkets1 Our portfolio in the New York MSA is well-diversified across seven distinct submarkets which each have unique demographic trends and economic drivers that are supportive of strong self-storage demand 50% 40% 30% 20% 10% 0% CUBE Market Share2· 3 Bronx Queens Brooklyn ■ CUBE Market Share% Market Leader Our market-leading position in the three major outer boroughs, operating 29% of total square footage, creates important scale to drive operational efficiencies and brand recognition 9 |
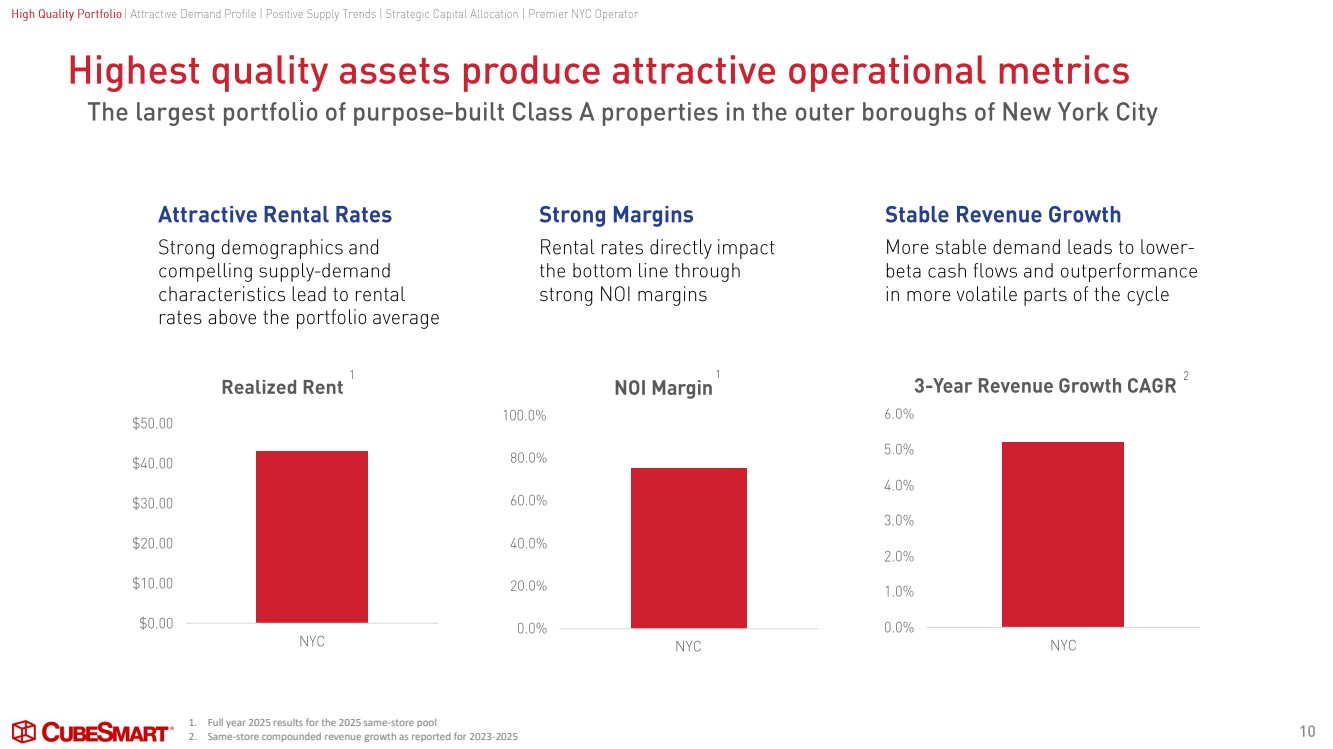
| $0.00 $10.00 $20.00 $30.00 $40.00 $50.00 NYC Realized Rent 0.0% 1.0% 2.0% 3.0% 4.0% 5.0% 6.0% NYC 3-Year Revenue Growth CAGR 0.0% 20.0% 40.0% 60.0% 80.0% 100.0% NYC NOI Margin Highest quality assets produce attractive operational metrics 10 The largest portfolio of purpose -built Class A properties in the outer boroughs of New York City High Quality Portfolio | Attractive Demand Profile | Positive Supply Trends | Strategic Capital Allocation | Premier NYC Operator 1 Strong Margins Rental rates directly impact the bottom line through strong NOI margins Stable Revenue Growth More stable demand leads to lower - beta cash flows and outperformance in more volatile parts of the cycle Attractive Rental Rates Strong demographics and compelling supply -demand characteristics lead to rental rates above the portfolio average 1 2 1. Full year 2025 results for the 2025 same-store pool 2. Same-store compounded revenue growth as reported for 2023-2025 High Quality Portfolio I Attractive Demand Profile I Positive Supply Trends I Strategic Capital Allocation I Premier NYC Operator Highest quality assets produce attractive operational metrics The largest portfolio of purpose-built Class A properties in the outer boroughs of New York City Attractive Rental Rates Strong demographics and compelling supply-demand characteristics lead to rental rates above the portfolio average $50.00 $40.00 $30.00 $20.00 $10.00 $0.00 ® CuBE5MART· Realized Rent NYC Strong Margins Rental rates directly impact the bottom line through strong NOi margins 1 NOi Margin 100.0% 80.0% 60.0% 40.0% 20.0% 0.0% NYC Stable Revenue Growth More stable demand leads to lower-beta cash flows and outperformance in more volatile parts of the cycle 6.0% 5.0% 4.0% 3.0% 2.0% 1.0% 0.0% 2 3-Year Revenue Growth CAGR NYC 10 |
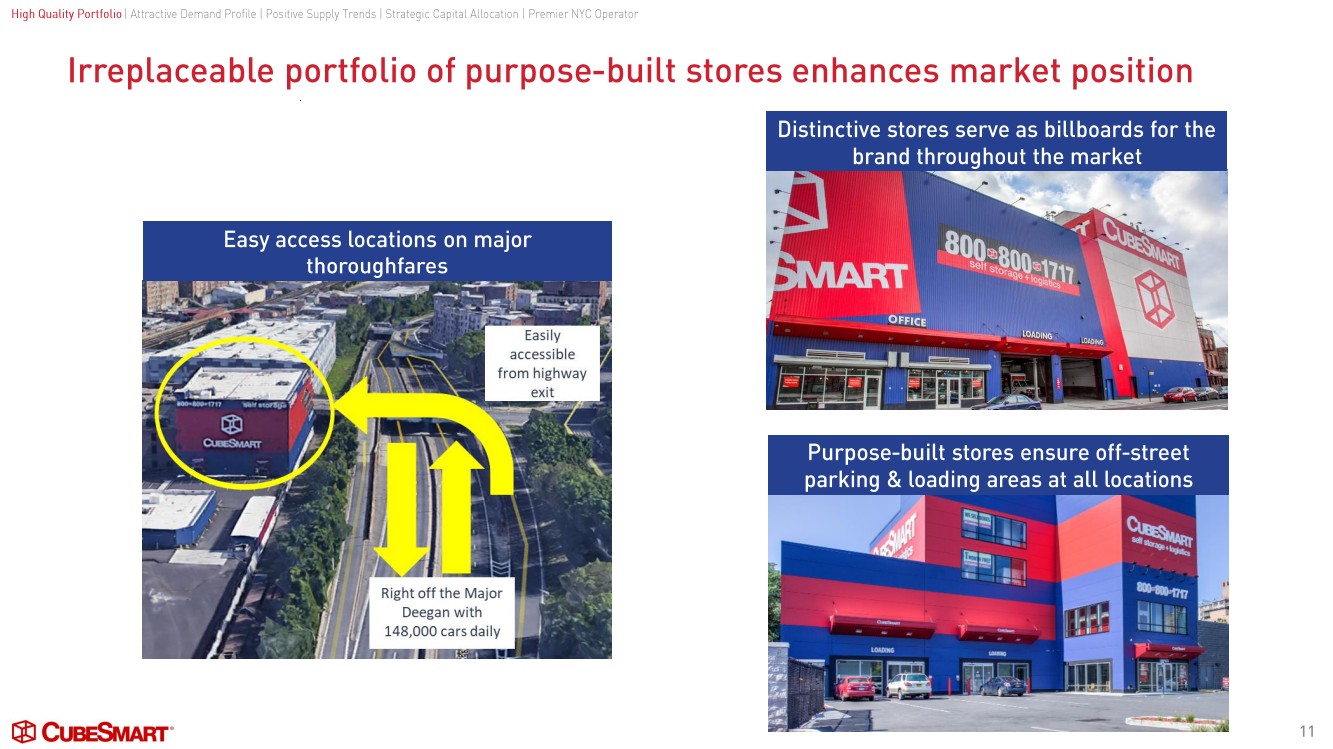
| Irreplaceable portfolio of purpose -built stores enhances market position 11 Easy access locations on major thoroughfares Distinctive stores serve as billboards for the brand throughout the market Purpose -built stores ensure off -street parking & loading areas at all locations High Quality Portfolio High Quality Portfolio | Attractive Demand Profile | Positive Supply Trends | Strategic Capital Allocation | Premier NYC Operator I Attractive Demand Profile I Positive Supply Trends I Strategic Capital Allocation I Premier NYC Operator Irreplaceable portfolio of purpose-built stores enhances market position ® CuBE5MART· 11 |
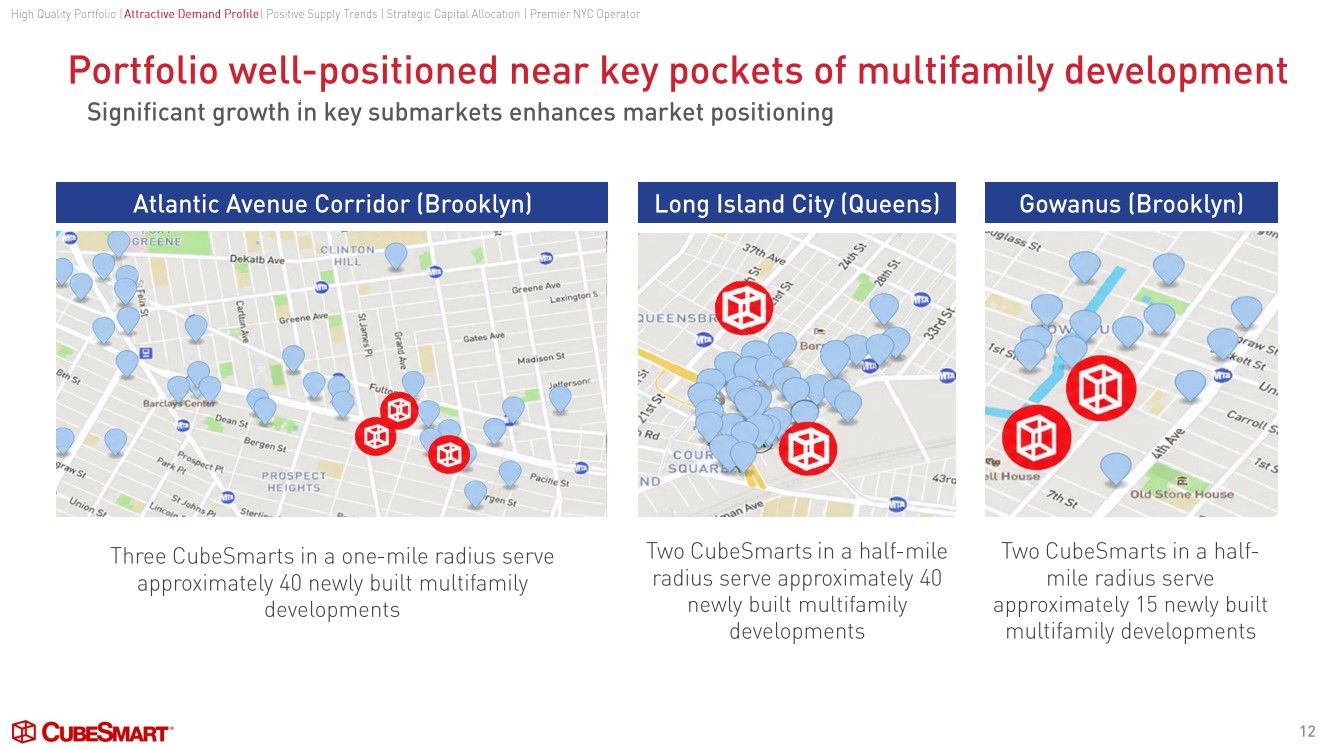
| Portfolio well -positioned near key pockets of multifamily development 12 Atlantic Avenue Corridor (Brooklyn) Long Island City (Queens) Three CubeSmarts in a one -mile radius serve approximately 40 newly built multifamily developments Gowanus (Brooklyn) Two CubeSmarts in a half -mile radius serve approximately 40 newly built multifamily developments Two CubeSmarts in a half - mile radius serve approximately 15 newly built multifamily developments Significant growth in key submarkets enhances market positioning High Quality Portfolio | High Quality Portfolio I Attractive Demand Profile Attractive Demand Profile | Positive Supply Trends | Strategic Capital Allocation | Premier NYC Operator I Positive Supply Trends I Strategic Capital Allocation I Premier NYC Operator Portfolio well-positioned near key pockets of multifamily development Significant growth in key submarkets enhances market positioning u,,.r. o,,s,. Atlantic Avenue Corridor (Brooklyn) DeKalb Ave Gr eneAve Barcl 0-. . Greene AVO Ul<'n9\onS Three CubeSmarts in a one-mile radius serve approximately 40 newly built multifamily developments Long Island City (Queens) .;>;>,~ c:,- "'"e ~ q ~ '\; ~ c:,- ~ -~- I;- ~ :lUE NSB <?" ◄~ ~'b ~ ?" ;, c.,- ;:,- ~ '>i?d ◄► C 'v .... ◄~ SQUAR !:../\ NO 43rc . .-@~ i,..-ie ~ Two CubeSmarts in a half-mile radius serve approximately 40 newly built multifamily developments Gowanus (Brooklyn) -v.91, ilsss, '"" 's, "»,.-s, ·=+-ot, ~- ,2> s, u,,, Ca,-, "°Oft .:,,_¢; s. • -·► ~""'(- "- 'a' .l'st-5 ll Hou. i£ ..:}~ s, Old ton Hou Two CubeSmarts in a half-mile radius serve approximately 15 newly built multifamily developments 12 |
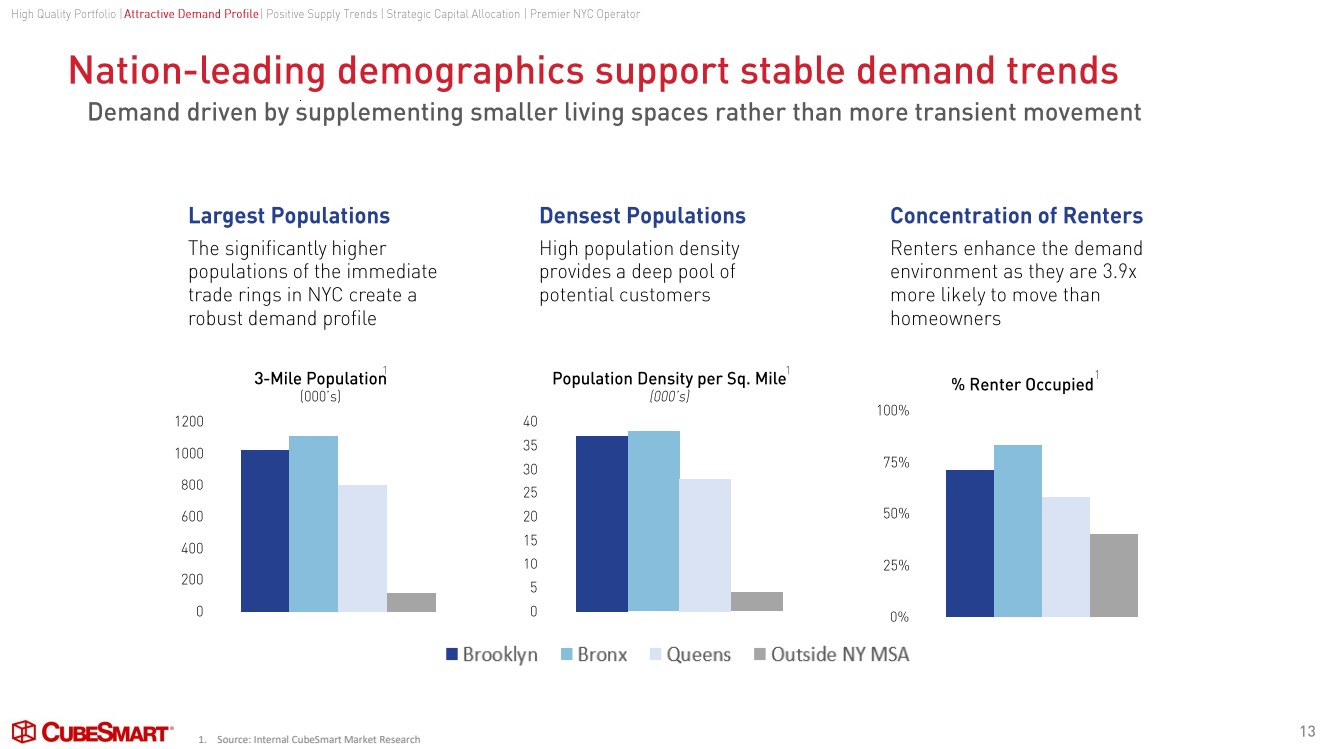
| Nation -leading demographics support stable demand trends 0 200 400 600 800 1000 1200 3-Mile Population (000’s) 0 5 10 15 20 25 30 35 40 Population Density per Sq. Mile (000’s) 0% 25% 50% 75% 100% % Renter Occupied 1 Largest Populations The significantly higher populations of the immediate trade rings in NYC create a robust demand profile Densest Populations High population density provides a deep pool of potential customers Concentration of Renters Renters enhance the demand environment as they are 3.9x more likely to move than homeowners 1. Source: Internal CubeSmart Market Research 1 1 High Quality Portfolio | Attractive Demand Profile | Positive Supply Trends | Strategic Capital Allocation | Premier NYC Operator 13 Demand driven by supplementing smaller living spaces rather than more transient movement High Quality Portfolio I Attractive Demand Profile I Positive Supply Trends I Strategic Capital Allocation I Premier NYC Operator Nation-leading demographics support stable demand trends Demand driven by supplementing smaller living spaces rather than more transient movement ® CuBE5MART· Largest Populations The significantly higher populations of the immediate trade rings in NYC create a robust demand profile 1200 1000 800 600 400 200 0 3-Mile Populatiori [000' s] - 40 35 30 25 20 15 10 5 0 ■ Brooklyn Densest Populations High population density provides a deep pool of potential customers Population Density per Sq. Mile 1 (OOO 's} - Concentration of Renters Renters enhance the demand environment as they are 3.9x more likely to move than homeowners % Renter Occupied 1 100% 75% 50% 25% 0% ■ Bronx Quee s ■ Outside NY MSA 13 |
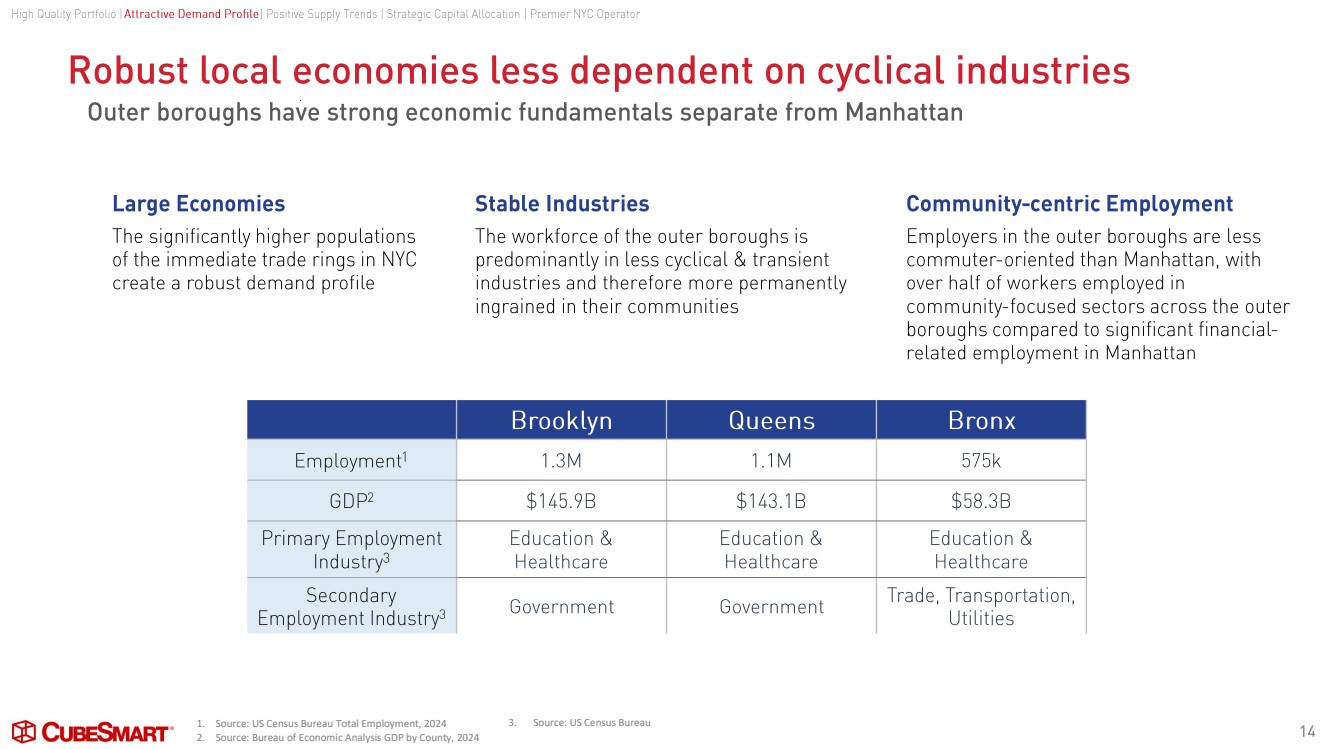
| Robust local economies less dependent on cyclical industries 14 Outer boroughs have strong economic fundamentals separate from Manhattan Brooklyn Queens Bronx Employment 1 1.3M 1.1M 575k GDP 2 $145.9B $143.1B $58.3B Primary Employment Industry 3 Education & Healthcare Education & Healthcare Education & Healthcare Secondary Employment Industry 3 Government Government Trade, Transportation, Utilities Large Economies The significantly higher populations of the immediate trade rings in NYC create a robust demand profile Stable Industries The workforce of the outer boroughs is predominantly in less cyclical & transient industries and therefore more permanently ingrained in their communities Community - centric Employment Employers in the outer boroughs are less commuter -oriented than Manhattan, with over half of workers employed in community -focused sectors across the outer boroughs compared to significant financial - related employment in Manhattan High Quality Portfolio | Attractive Demand Profile | Positive Supply Trends | Strategic Capital Allocation | Premier NYC Operator 1. Source: US Census Bureau Total Employment, 2024 2. Source: Bureau of Economic Analysis GDP by County, 2024 3. Source: US Census Bureau High Quality Portfolio I Attractive Demand Profile I Positive Supply Trends I Strategic Capital Allocation I Premier NYC Operator Robust local economies less dependent on cyclical industries Outer boroughs have strong economic fundamentals separate from Manhattan Large Economies The significantly higher populations of the immediate trade rings in NYC create a robust demand profile Employment 1 GDP2 Primary Employment lndustry3 Secondary Employment Ind ustry3 ® CuBE5MART· Stable Industries The workforce of the outer boroughs is predominantly in less cyclical & transient industries and therefore more permanently ingrained in their communities Brooklyn Queens 1.3M 1.1 M $145.9B $143.1 B Education & Education & Healthcare Healthcare Government Government Community-centric Employment Employers in the outer boroughs are less commuter-oriented than Manhattan, with over half of workers employed in community-focused sectors across the outer boroughs compared to significant financial-related employment in Manhattan Bronx 575k $58.3B Education & Healthcare Trade, Transportation, Utilities 14 |
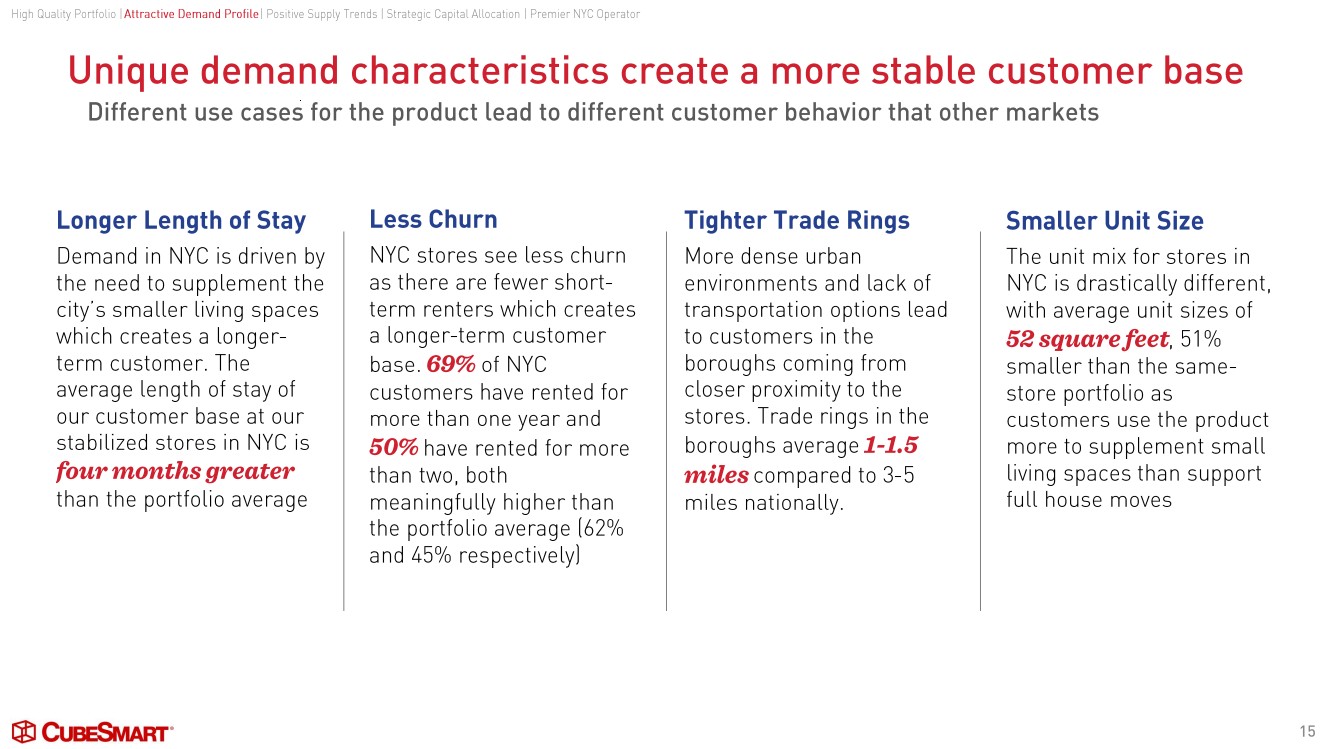
| Unique demand characteristics create a more stable customer base 15 Longer Length of Stay Demand in NYC is driven by the need to supplement the city’s smaller living spaces which creates a longer - term customer. The average length of stay of our customer base at our stabilized stores in NYC is four months greater than the portfolio average Less Churn NYC stores see less churn as there are fewer short - term renters which creates a longer -term customer base. 69% of NYC customers have rented for more than one year and 50% have rented for more than two, both meaningfully higher than the portfolio average (62% and 45% respectively) Tighter Trade Rings More dense urban environments and lack of transportation options lead to customers in the boroughs coming from closer proximity to the stores. Trade rings in the boroughs average 1-1.5 miles compared to 3 -5 miles nationally. Smaller Unit Size The unit mix for stores in NYC is drastically different, with average unit sizes of 52 square feet , 51% smaller than the same - store portfolio as customers use the product more to supplement small living spaces than support full house moves High Quality Portfolio | Attractive Demand Profile | Positive Supply Trends | Strategic Capital Allocation | Premier NYC Operator Different use cases for the product lead to different customer behavior that other markets High Quality Portfolio I Attractive Demand Profile I Positive Supply Trends I Strategic Capital Allocation I Premier NYC Operator Unique demand characteristics create a more stable customer base Different use cases for the product lead to different customer behavior that other markets Longer Length of Stay Demand in NYC is driven by the need to supplement the city's smaller living spaces which creates a longer-term customer. The average length of stay of our customer base at our stabilized stores in NYC is four months greater than the portfolio average ® CuBE5MART· Less Churn NYC stores see less churn as there are fewer short-term renters which creates a longer-term customer base. 69% of NYC customers have rented for more than one year and 50% have rented for more than two, both meaningfully higher than the portfolio average [62% and 45% respectively] Tighter Trade Rings More dense urban environments and lack of transportation options lead to customers in the boroughs coming from closer proximity to the stores. Trade rings in the boroughs average 1-1.5 miles compared to 3-5 miles nationally. Smaller Unit Size The unit mix for stores in NYC is drastically different, with average unit sizes of 52squarefeet, 51% smaller than the same-store portfolio as customers use the product more to supplement small living spaces than support full house moves 15 |
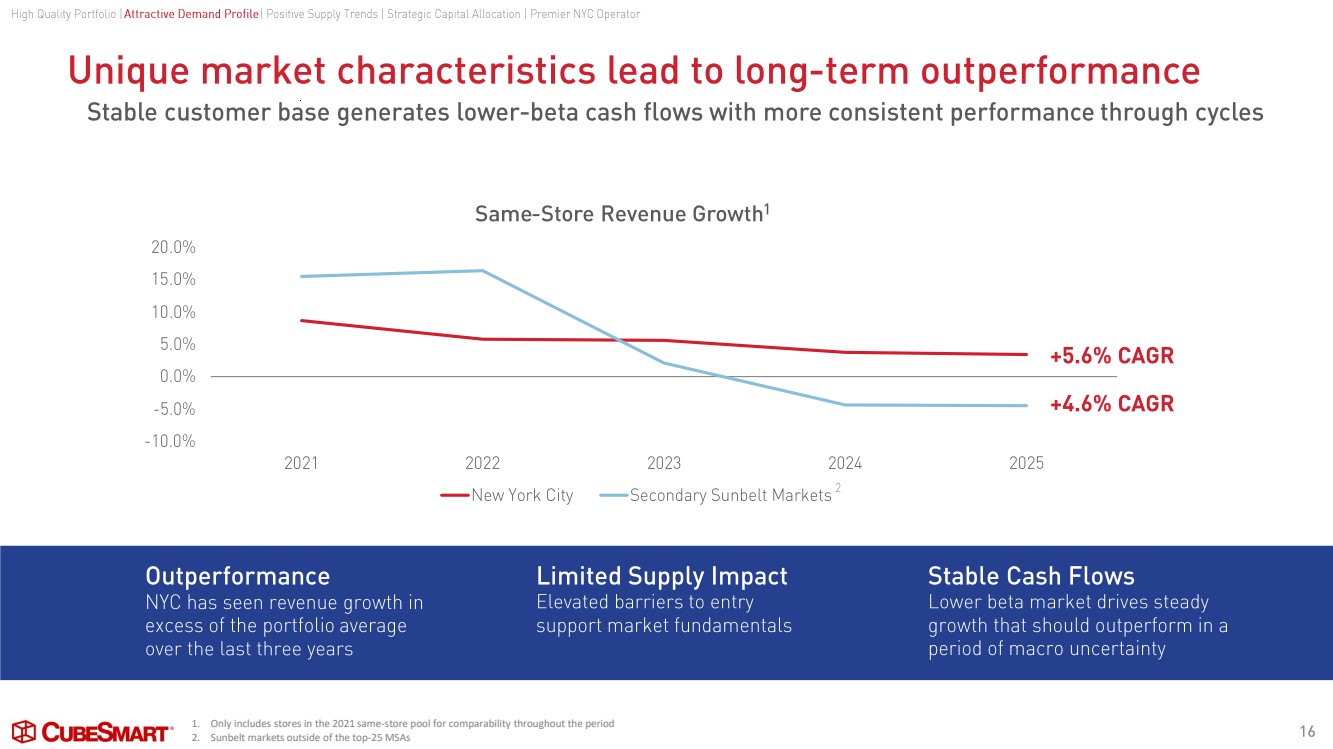
| -10.0% -5.0% 0.0% 5.0% 10.0% 15.0% 20.0% 2021 2022 2023 2024 2025 Same - Store Revenue Growth 1 New York City Secondary Sunbelt Markets +5.6% CAGR +4.6% CAGR Stable customer base generates lower -beta cash flows with more consistent performance through cycles Unique market characteristics lead to long -term outperformance 1. Only includes stores in the 2021 same-store pool for comparability throughout the period 2. Sunbelt markets outside of the top-25 MSAs 2 Outperformance NYC has seen revenue growth in excess of the portfolio average over the last three years Limited Supply Impact Elevated barriers to entry support market fundamentals Stable Cash Flows Lower beta market drives steady growth that should outperform in a period of macro uncertainty High Quality Portfolio | Attractive Demand Profile | Positive Supply Trends | Strategic Capital Allocation | Premier NYC Operator 16 High Quality Portfolio I Attractive Demand Profile I Positive Supply Trends I Strategic Capital Allocation I Premier NYC Operator Unique market characteristics lead to long-term outperformance Stable customer base generates lower-beta cash flows with more consistent performance through cycles 20 .0% 15 .0% 10 .0% 5.0% 0.0% -5.0% -10.0% 2021 0 ut pe rf o rma n c e NYC has seen revenue growth in excess of the portfolio average over the last three years Same-Store Revenue Growth 1 2022 2023 2024 - New York City 2 - Secondary Sunbelt Markets Limited Supply Impact Elevated barriers to entry support market fundamentals +5.6% CAGR +4.6% CAGR 2025 Stable Cash Flows Lower beta market drives steady growth that should outperform in a period of macro uncertainty 16 |
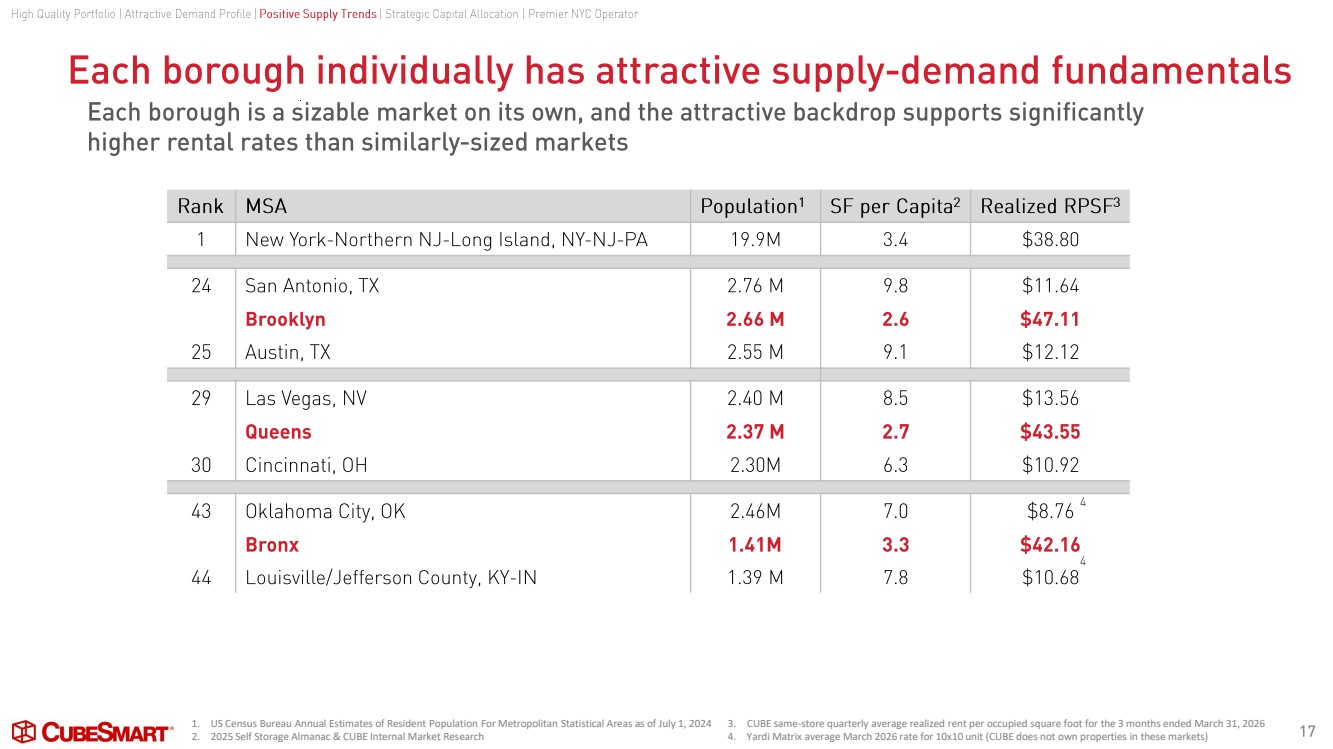
| Each borough individually has attractive supply -demand fundamentals 17 Each borough is a sizable market on its own, and the attractive backdrop supports significantly higher rental rates than similarly -sized markets Rank MSA Population 1 SF per Capita 2 Realized RPSF 3 1 New York -Northern NJ - Long Island, NY -NJ -PA 19.9M 3.4 $38.80 24 San Antonio, TX 2.76 M 9.8 $11.64 Brooklyn 2.66 M 2.6 $47.11 25 Austin, TX 2.55 M 9.1 $12.12 29 Las Vegas, NV 2.40 M 8.5 $13.56 Queens 2.37 M 2.7 $43.55 30 Cincinnati, OH 2.30M 6.3 $10.92 43 Oklahoma City, OK 2.46M 7.0 $8.76 Bronx 1.41M 3.3 $42.16 44 Louisville/Jefferson County, KY -IN 1.39 M 7.8 $10.68 4 1. US Census Bureau Annual Estimates of Resident Population For Metropolitan Statistical Areas as of July 1, 2024 2. 2025 Self Storage Almanac & CUBE Internal Market Research 3. CUBE same-store quarterly average realized rent per occupied square foot for the 3 months ended March 31, 2026 4. Yardi Matrix average March 2026 rate for 10x10 unit (CUBE does not own properties in these markets) 4 High Quality Portfolio | Attractive Demand Profile | High Quality Portfolio I Attractive Demand Profile I Positive Supply Trends Positive Supply Trends | Strategic Capital Allocation | Premier NYC Operator I Strategic Capital Allocation I Premier NYC Operator Each borough individually has attractive supply-demand fundamentals Each borough is a sizable market on its own, and the attractive backdrop supports significantly higher rental rates than similarly-sized markets Rank MSA Population 1 SF per Capita2 Realized RPSF3 1 New York-Northern NJ-Long Island, NY-NJ-PA 19.9M 3.4 $38.80 24 San Antonio, TX 2.76 M 9.8 $11 .64 Brooklyn 2.66 M 2.6 $47.11 25 Austin, TX 2.55 M 9 .1 $12.12 29 Las Vegas, NV 2.40 M 8.5 $13.56 Queens 2.37 M 2.7 $43.55 30 Cincinnati, OH 2.30M 6.3 $10.92 43 Oklahoma City, OK 2.46M 7.0 $8. 7 6 4 Bronx 1.41 M 3.3 $42.16 4 44 Louisville/ Jefferson County, KY-IN 1.39 M 7.8 $10.68 ® CuBE5MART· 17 |
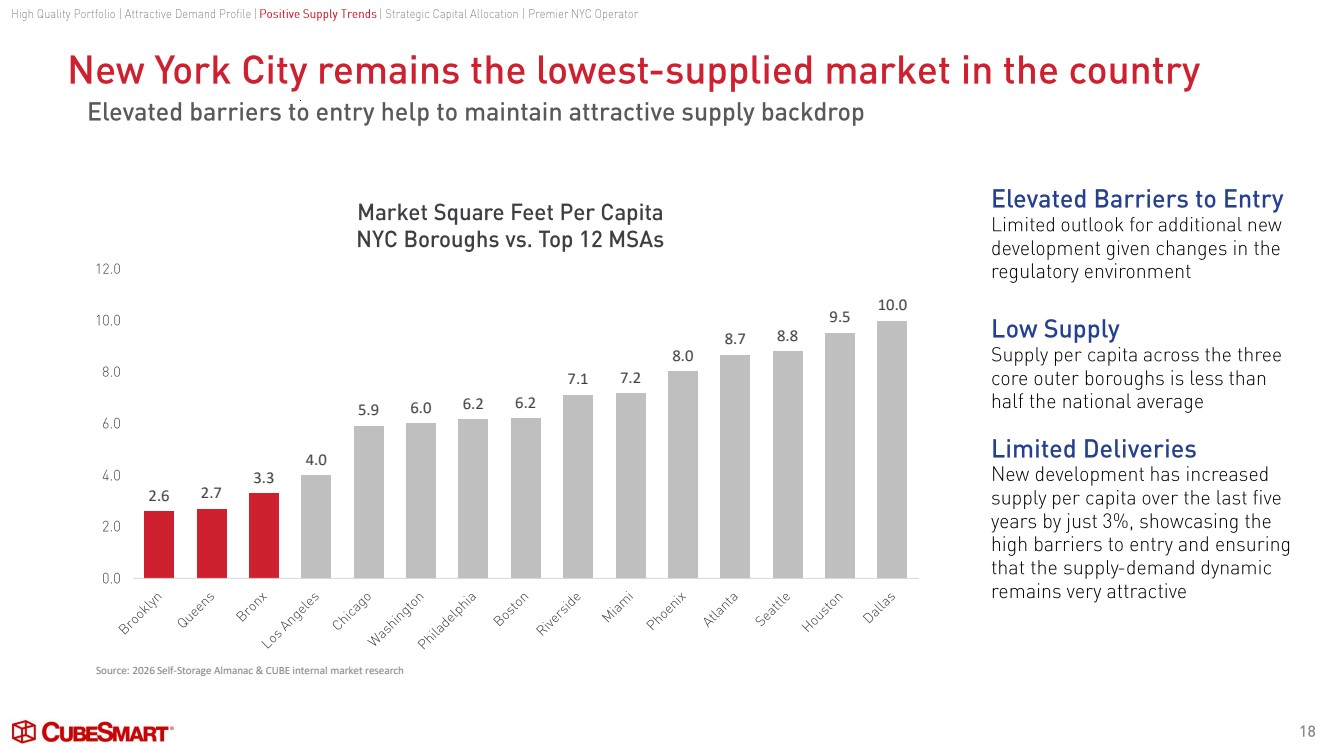
| New York City remains the lowest -supplied market in the country 18 Elevated barriers to entry help to maintain attractive supply backdrop 2.6 2.7 3.3 4.0 5.9 6.0 6.2 6.2 7.1 7.2 8.0 8.7 8.8 9.5 10.0 0.0 2.0 4.0 6.0 8.0 10.0 12.0 Market Square Feet Per Capita NYC Boroughs vs. Top 12 MSAs Elevated Barriers to Entry Limited outlook for additional new development given changes in the regulatory environment Low Supply Supply per capita across the three core outer boroughs is less than half the national average Limited Deliveries New development has increased supply per capita over the last five years by just 3%, showcasing the high barriers to entry and ensuring that the supply -demand dynamic remains very attractive High Quality Portfolio | Attractive Demand Profile | Positive Supply Trends | Strategic Capital Allocation | Premier NYC Operator Source: 2026 Self-Storage Almanac & CUBE internal market research High Quality Portfolio I Attractive Demand Profile I Positive Supply Trends I Strategic Capital Allocation I Premier NYC Operator New York City remains the lowest-supplied market in the country Elevated barriers to entry help to maintain attractive supply backdrop 12.0 10.0 8.0 6.0 4.0 2.0 0.0 ~~ ~0 ~+ e,0 e,e, ~ <o'o ~ <::-0:, <o'o ,§> 0"?' ,y ® CuBE5MART· Market Square Feet Per Capita NYC Boroughs vs. Top 12 MSAs ·'o . oe- . :\- 'o ~ ~ 0~ ~ ....._o~ 0' ~ ~,'o ~ ~G -~<::i:, ~~ 00 ' oe, <o (j q' -~'o~ . ,:,.0 ~~ ~'o ~~ ~ ~'o x:::,e, 0~ 0 <::- ~ <} ~'o ~'o x-0'0 ~'o "?' c,? Elevated Barriers to Entry Limited outlook for additional new development given changes in the regulatory environment Low Supply Supply per capita across the three core outer boroughs is less than half the national average Limited Deliveries New development has increased supply per capita over the last five years by just 3%, showcasing the high barriers to entry and ensuring that the supply-demand dynamic remains very attractive 18 |
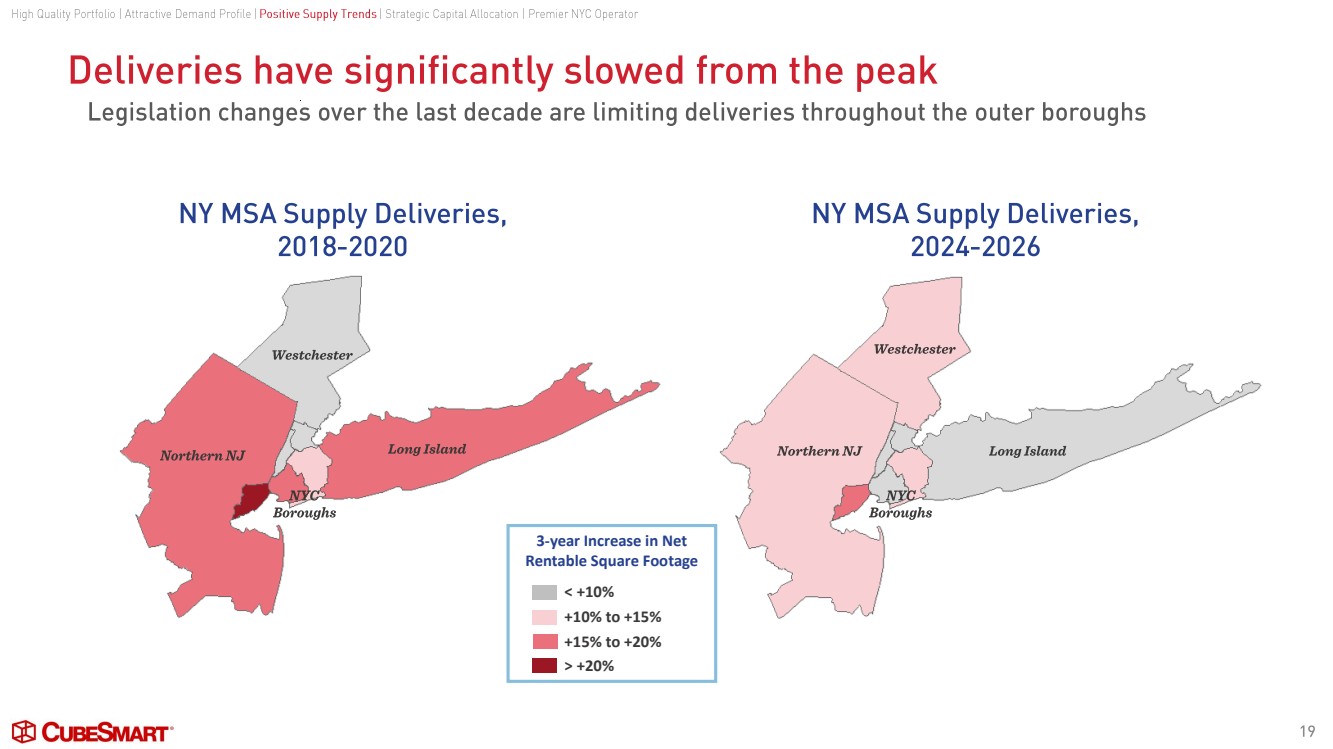
| Deliveries have significantly slowed from the peak 19 NY MSA Supply Deliveries, 2018-2020 NY MSA Supply Deliveries, 2024-2026 Legislation changes over the last decade are limiting deliveries throughout the outer boroughs < +10% +10% to +15% +15% to +20% > +20% 3-year Increase in Net Rentable Square Footage High Quality Portfolio | Attractive Demand Profile | Positive Supply Trends | Strategic Capital Allocation | Premier NYC Operator Long Island Northern NJ Westchester NYC Boroughs Northern NJ Long Island Westchester NYC Boroughs High Quality Portfolio I Attractive Demand Profile I Positive Supply Trends I Strategic Capital Allocation I Premier NYC Operator Deliveries have significantly slowed from the peak Legislation changes over the last decade are limiting deliveries throughout the outer boroughs NY MSA Supply Deliveries, 2018-2020 Westchester - - - - NY MSA Supply Deliveries, 2024-2026 Westchester Northern NJ Long Island 19 |
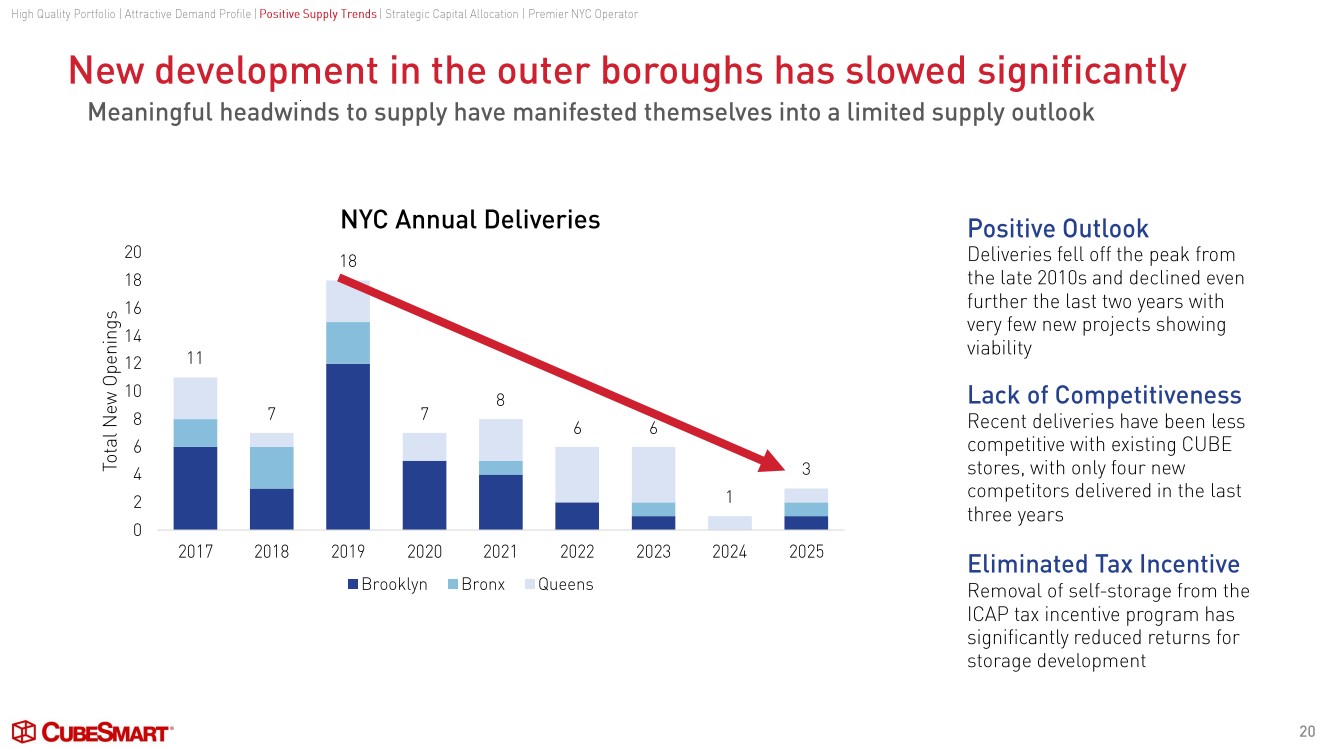
| 11 7 18 7 8 6 6 1 3 0 2 4 6 8 10 12 14 16 18 20 2017 2018 2019 2020 2021 2022 2023 2024 2025 Total New Openings NYC Annual Deliveries Brooklyn Bronx Queens New development in the outer boroughs has slowed significantly 20 High Quality Portfolio | Attractive Demand Profile | Positive Supply Trends | Strategic Capital Allocation | Premier NYC Operator Positive Outlook Deliveries fell off the peak from the late 2010s and declined even further the last two years with very few new projects showing viability Lack of Competitiveness Recent deliveries have been less competitive with existing CUBE stores, with only four new competitors delivered in the last three years Eliminated Tax Incentive Removal of self -storage from the ICAP tax incentive program has significantly reduced returns for storage development Meaningful headwinds to supply have manifested themselves into a limited supply outlook High Quality Portfolio I Attractive Demand Profile I Positive Supply Trends I Strategic Capital Allocation I Premier NYC Operator New development in the outer boroughs has slowed significantly Meaningful headwinds to supply have manifested themselves into a limited supply outlook 20 18 (f) 16 CT) -~ 14 C 11 (I) 12 0... 0 10 s (I) 8 7 z (0 ....., 6 0 I- 4 2 0 2017 2018 ® CuBE5MART· NYC Annual Deliveries 18 2019 2020 2021 - 2022 ■ Brooklyn ■ Bronx Queens 3 2023 2024 2025 Positive Outlook Deliveries fell off the peak from the late 201 Os and declined even further the last two years with very few new projects showing viability Lack of Competitiveness Recent deliveries have been less competitive with existing CUBE stores, with only four new competitors delivered in the last three years Eliminated Tax Incentive Removal of self- storage from the ICAP tax incentive program has significantly reduced returns for storage development 20 |
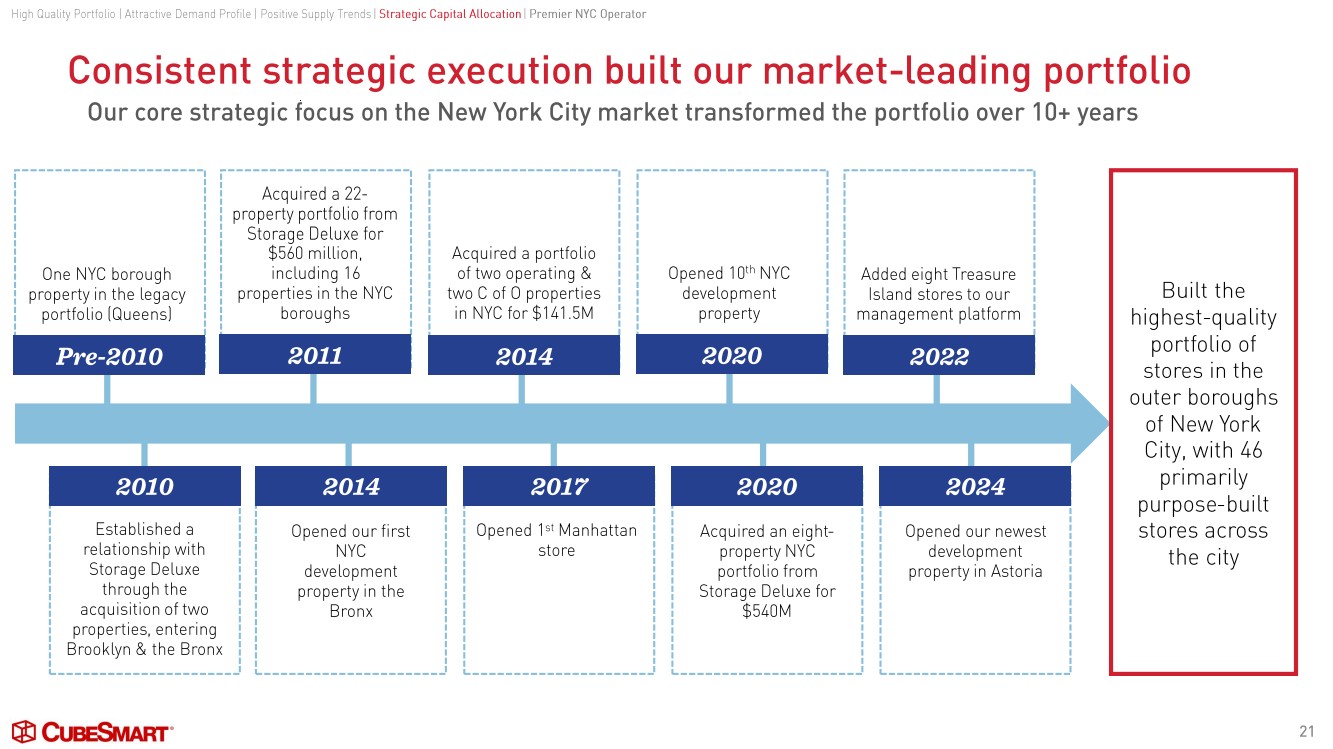
| Consistent strategic execution built our market -leading portfolio 21 Our core strategic focus on the New York City market transformed the portfolio over 10+ years One NYC borough property in the legacy portfolio (Queens) Pre -2010 2011 2014 2020 2022 Acquired a 22 - property portfolio from Storage Deluxe for $560 million, including 16 properties in the NYC boroughs Acquired a portfolio of two operating & two C of O properties in NYC for $141.5M Opened 10 th NYC development property Added eight Treasure Island stores to our management platform Built the highest -quality portfolio of stores in the outer boroughs of New York City, with 46 primarily purpose -built stores across the city 2010 2014 2017 2020 Established a relationship with Storage Deluxe through the acquisition of two properties , entering Brooklyn & the Bronx Opened our first NYC development property in the Bronx Opened 1 st Manhattan store Acquired an eight - property NYC portfolio from Storage Deluxe for $540M High Quality Portfolio | Attractive Demand Profile | Positive Supply Trends | Strategic Capital Allocation | Premier NYC Operator 2024 Opened our newest development property in Astoria High Quality Portfolio I Attractive Demand Profile I Positive Supply Trends I Strategic Capital Allocation I Premier NYC Operator Consistent strategic execution built our market-leading portfolio Our core strategic focus on the New York City market transformed the portfolio over 10+ years ----------------------. One NYC borough property in the legacy portfolio [Queens] Pre-2010 2010 Established a relationship with Storage Deluxe through the acquisition of two properties, entering Brooklyn & the Bronx Acquired a 22- property portfolio from Storage Deluxe for $560 million, including 16 properties in the NYC boroughs 2011 2014 Opened our first NYC development property in the Bronx ---------------------- ----------------------. ----------------------. Acquired a portfolio of two operating & two C of O properties in NYC for$141 .5M 2014 2017 Opened 1st Manhattan store Opened 10th NYC development property 2020 2020 Acquired an eight-property NYC portfolio from Storage Deluxe for $540M Added eight Treasure Island stores to our management platform 2022 2024 Opened our newest development property in Astoria L---------------------- L---------------------- L---------------------- L---------------------- L---------------------- Built the h ig hest-q ua lity portfolio of stores i n the outer boroughs of New York City, with 46 primarily purpose-built stores across the city ® CuBESMARr· 21 |
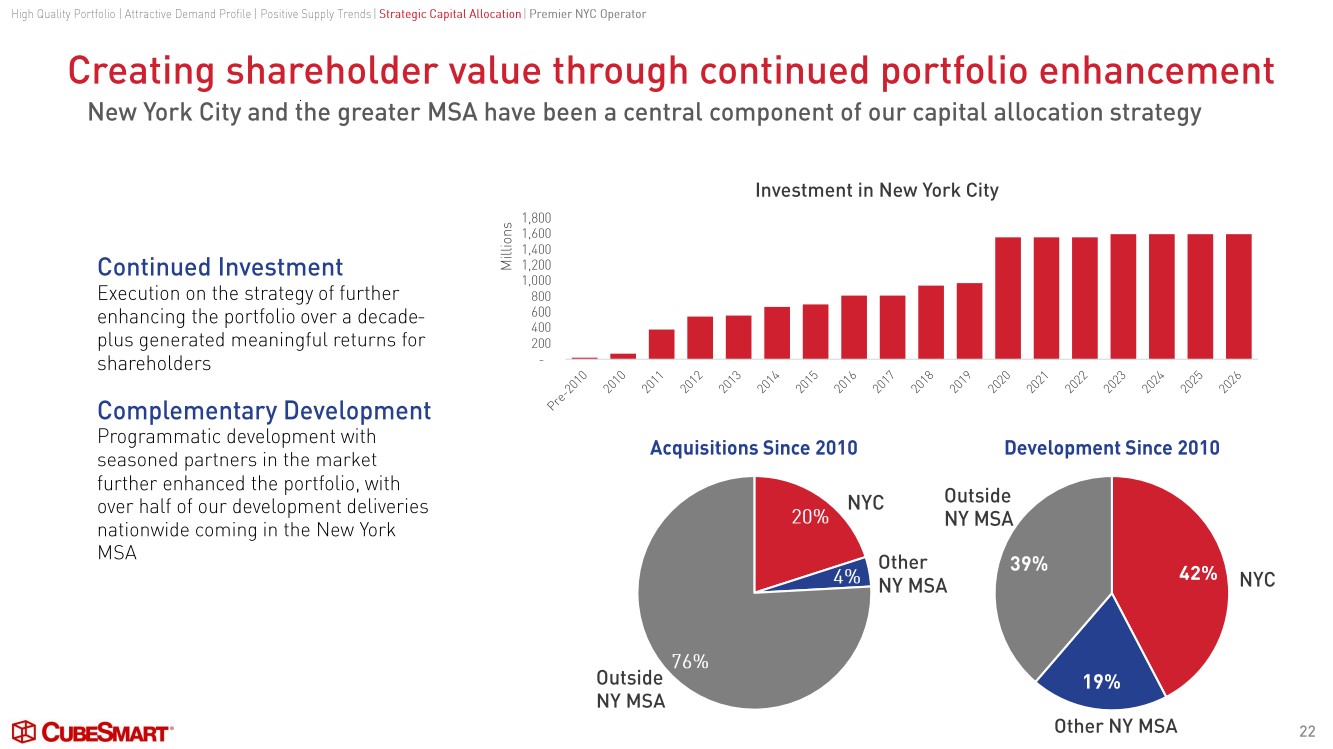
| Creating shareholder value through continued portfolio enhancement 22 New York City and the greater MSA have been a central component of our capital allocation strategy - 200 400 600 800 1,000 1,200 1,400 1,600 1,800 Millions Investment in New York City 42% 19% 39% Development Since 2010 20% 4% 76% Acquisitions Since 2010 High Quality Portfolio | Attractive Demand Profile | Positive Supply Trends | Strategic Capital Allocation | Premier NYC Operator NYC Other NY MSA NYC Other NY MSA Continued Investment Execution on the strategy of further enhancing the portfolio over a decade - plus generated meaningful returns for shareholders Complementary Development Programmatic development with seasoned partners in the market further enhanced the portfolio, with over half of our development deliveries nationwide coming in the New York MSA Outside NY MSA Outside NY MSA High Quality Portfolio I Attractive Demand Profile I Positive Supply Trends I Strategic Capital Allocation I Premier NYC Operator Creating shareholder value through continued portfolio enhancement New York City and the greater MSA have been a central component of our capital allocation strategy Continued Investment Execution on the strategy of further enhancing the portfolio over a decade-plus generated meaningful returns for shareholders Complementary Development Programmatic development with seasoned partners in the market further enhanced the portfolio, with over half of our development deliveries nationwide coming in the New York MSA ® CuBE5MART· Investment in New York City (/) 1,800 § 1,600 1,400 2 1,200 1,000 800 !ii __ .11111111 Acquisitions Since 2010 Other NYMSA Development Since 2010 Other NY MSA NYC 22 |
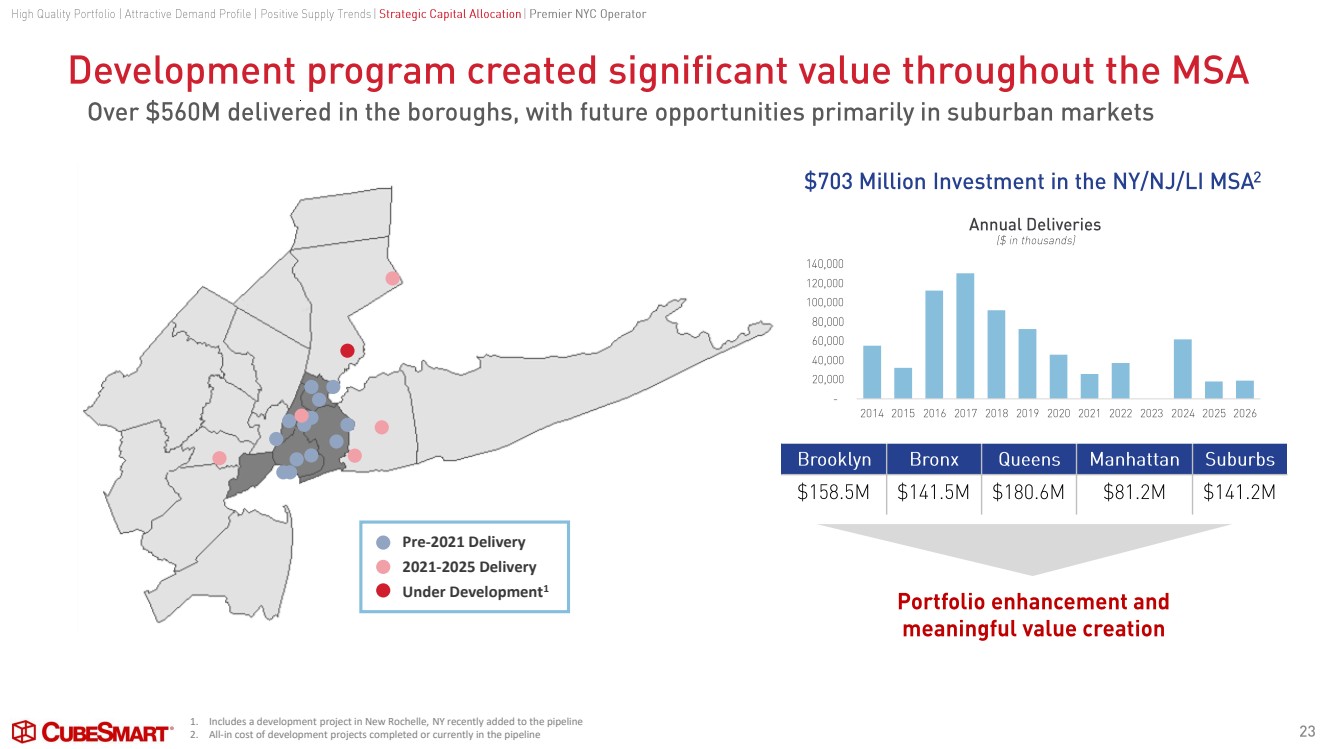
| Development program created significant value throughout the MSA 23 Over $560M delivered in the boroughs, with future opportunities primarily in suburban markets 1. Includes a development project in New Rochelle, NY recently added to the pipeline 2. All-in cost of development projects completed or currently in the pipeline Pre-2021 Delivery 2021-2025 Delivery Under Development1 $703 Million Investment in the NY/NJ/LI MSA 2 Portfolio enhancement and meaningful value creation Brooklyn Bronx Queens Manhattan Suburbs $158.5M $141.5M $180.6M $81.2M $141.2M - 20,000 40,000 60,000 80,000 100,000 120,000 140,000 2014 2015 2016 2017 2018 2019 2020 2021 2022 2023 2024 2025 2026 Annual Deliveries ($ in thousands) High Quality Portfolio | Attractive Demand Profile | Positive Supply Trends High Quality Portfolio I Attractive Demand Profile I Positive Supply Trends | I Strategic Capital Allocation Strategic Capital Allocation | I Premier NYC Operator Premier NYC Operator Development program created significant value throughout the MSA Over $560M delivered in the boroughs, with future opportunities primarily in suburban markets ® CuBE5MART· • • • $703 Million Investment in the NY/NJ/LI MSA2 140,000 120,000 100,000 80,000 60,000 40,000 20,000 Annual Deliveries /$ in thousands/ 2014 2015 2016 2017 2018 2019 2020 2021 2022 2023 2024 2025 2026 Brooklyn Bronx Queens Manhattan $158.5M $141 .5M $180.6M $81 .2M Portfolio enhancement and meaningful value creation Suburbs $141 .2M 23 |
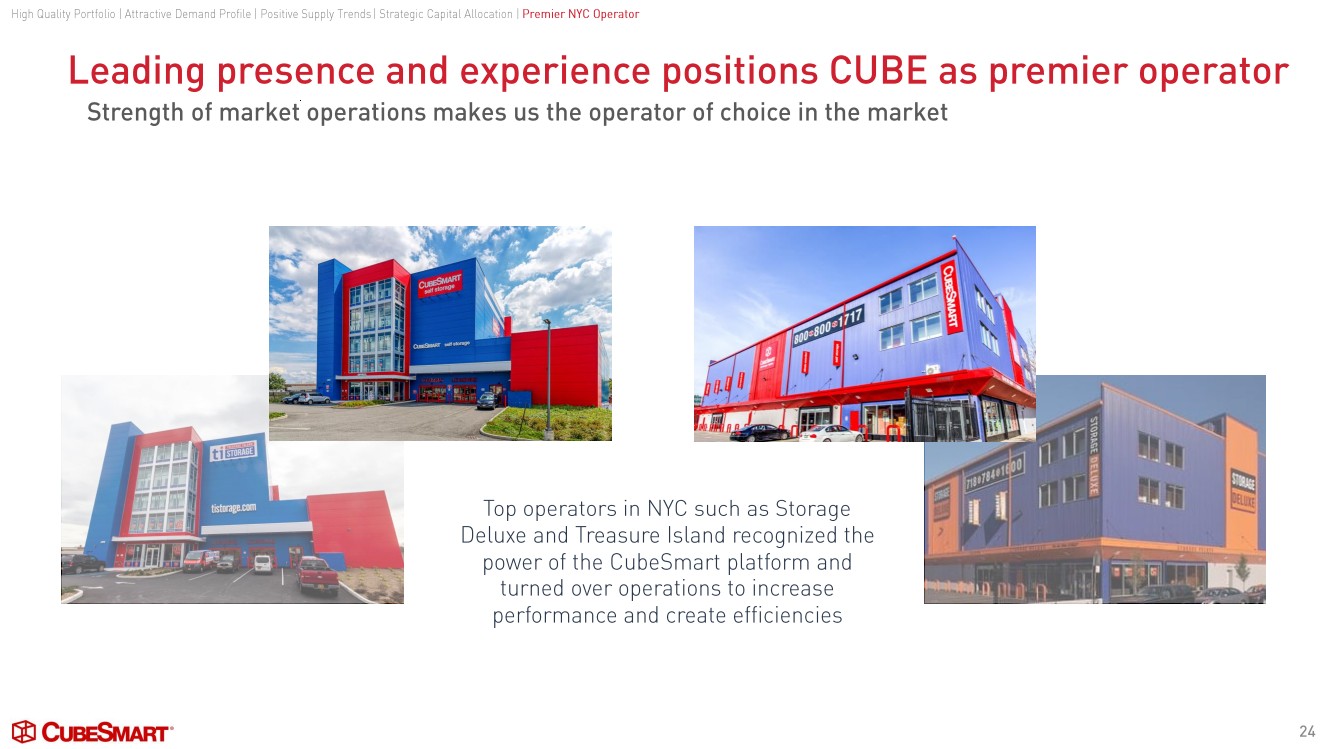
| Leading presence and experience positions CUBE as premier operator 24 Strength of market operations makes us the operator of choice in the market Top operators in NYC such as Storage Deluxe and Treasure Island recognized the power of the CubeSmart platform and turned over operations to increase performance and create efficiencies High Quality Portfolio | Attractive Demand Profile | Positive Supply Trends High Quality Portfolio I Attractive Demand Profile I Positive Supply Trends | Strategic Capital Allocation | I Strategic Capital Allocation I Premier NYC Operator Premier NYC Operator Leading presence and experience positions CUBE as premier operator Strength of market operations makes us the operator of choice in the market ® CuBE5MART· Top operators in NYC such as Storage Deluxe and Treasure Island recognized the power of the CubeSmart platform and turned over operations to increase performance and create efficiencies 24 |
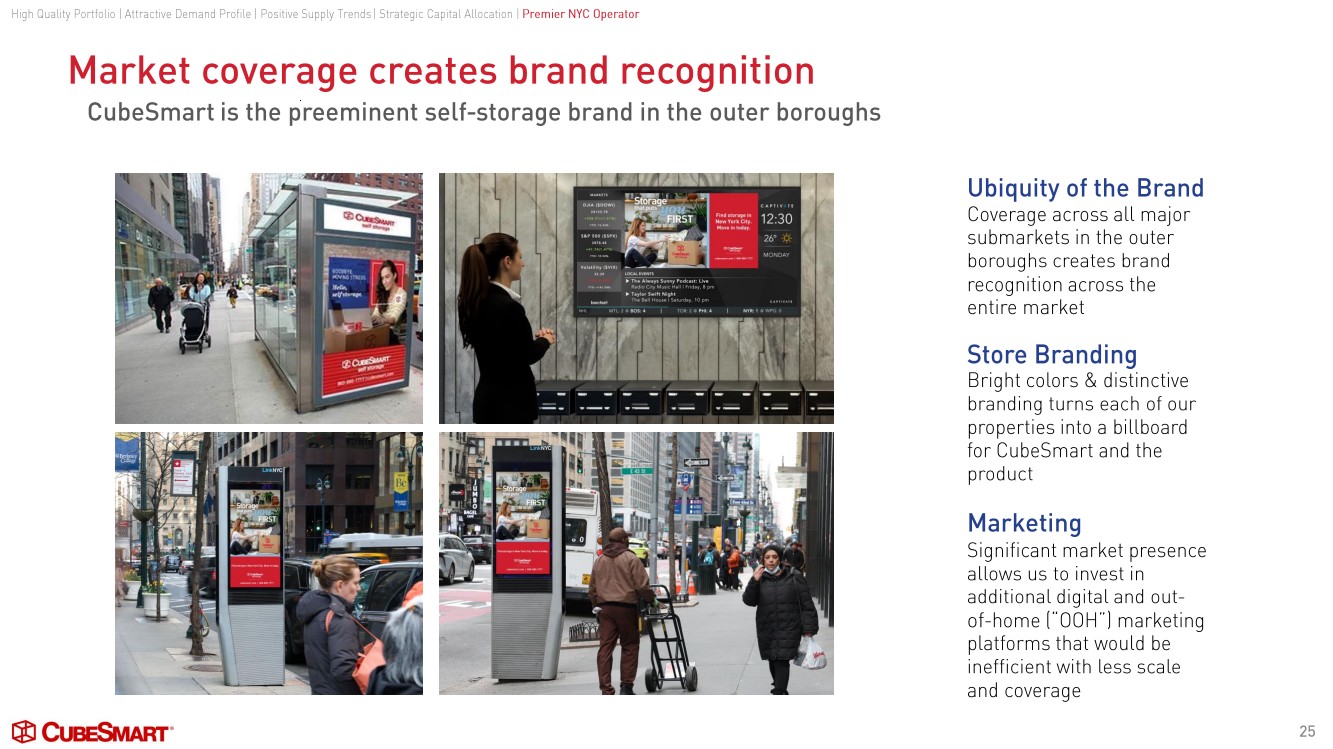
| Market coverage creates brand recognition 25 CubeSmart is the preeminent self -storage brand in the outer boroughs Ubiquity of the Brand Coverage across all major submarkets in the outer boroughs creates brand recognition across the entire market Store Branding Bright colors & distinctive branding turns each of our properties into a billboard for CubeSmart and the product Marketing Significant market presence allows us to invest in additional digital and out - of-home (“OOH”) marketing platforms that would be inefficient with less scale and coverage High Quality Portfolio | Attractive Demand Profile | Positive Supply Trends High Quality Portfolio I Attractive Demand Profile I Positive Supply Trends | Strategic Capital Allocation | I Strategic Capital Allocation I Premier NYC Operator Premier NYC Operator Market coverage creates brand recognition CubeSmart is the preeminent self-storage brand in the outer boroughs ® CuBE5MART· Ubiquity of the Brand Coverage across all major submarkets in the outer boroughs creates brand recognition across the entire market Store Branding Bright colors & distinctive branding turns each of our properties into a billboard for CubeSmart and the product Marketing Significant market presence allows us to invest in additional digital and out-of-home ["OOH "] marketing platforms that would be inefficient with less scale and coverage 25 |
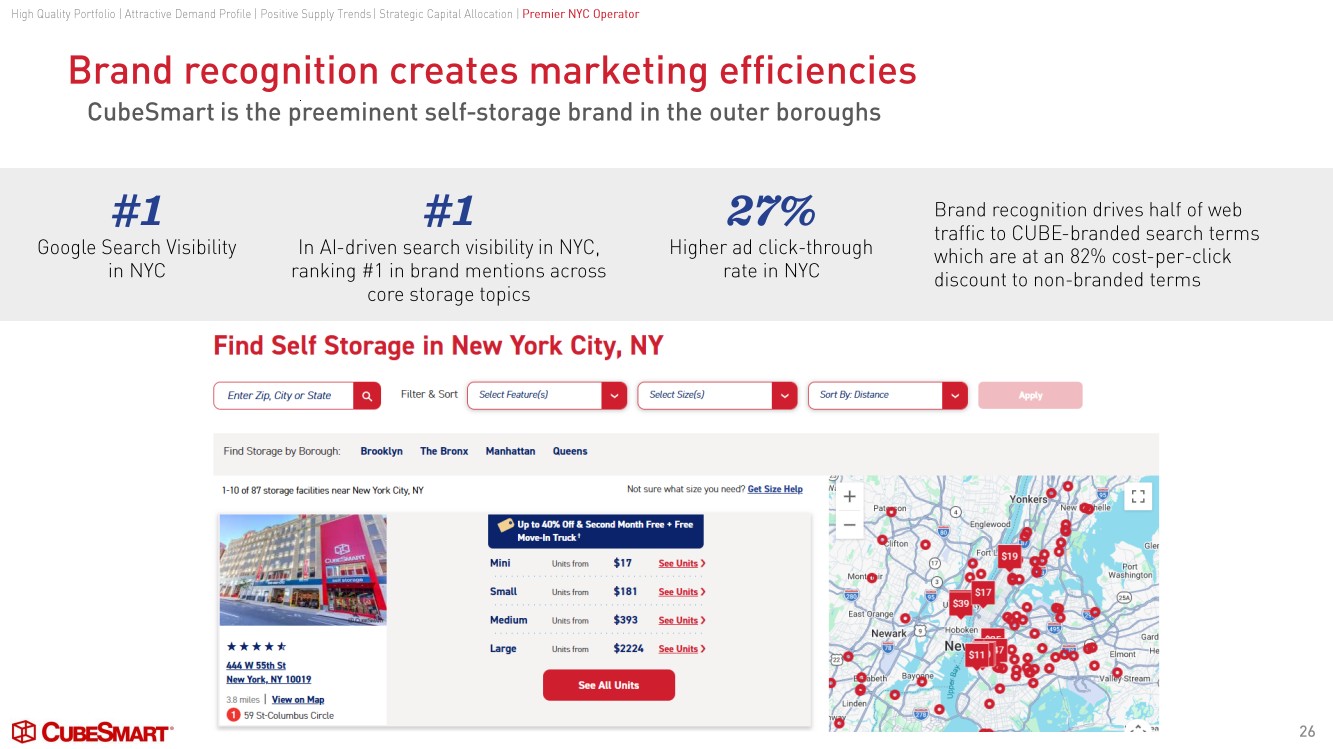
| Brand recognition creates marketing efficiencies 26 CubeSmart is the preeminent self -storage brand in the outer boroughs #1 Google Search Visibility in NYC #1 In AI-driven search visibility in NYC, ranking #1 in brand mentions across core storage topics Brand recognition drives half of web traffic to CUBE -branded search terms which are at an 82% cost -per- click discount to non -branded terms 27% Higher ad click -through rate in NYC High Quality Portfolio | Attractive Demand Profile | Positive Supply Trends High Quality Portfolio I Attractive Demand Profile I Positive Supply Trends | Strategic Capital Allocation | I Strategic Capital Allocation I Premier NYC Operator Premier NYC Operator Brand recognition creates marketing efficiencies CubeSmart is the preeminent self-storage brand in the outer boroughs #1 #1 27% Google Search Visibility in NYC In Al-driven search visibility in NYC, ranking #1 in brand mentions across core storage topics Higher ad click-through rate in NYC ® CuBE5MART· Find Self Storage in New York City, NY [ Enter Zip, City or S tate ■ Filter & Sort [ Select Feature(s) a [ Select Size(s) a [ Sort By: Distance Find Storage by Borough: Brooklyn The Bronx Manhattan Queens 1-10 of 87 storage facilities near New Yori< City, NY Not sure what size you need? Get Size Hell! ***** 444 W 55th St New York. NY 10019 3.8 miles I View on Mal! 0 59 St-Columbus Circle - Up to 40% Off & Second Month Free + Free Move-In Truck t Mini Units from $17 See Units> Small Units from $18 1 See Units) Medium Units from $393 See Units> Large Units from $2224 See Units> See All Units Brand recognition drives half of web traffic to CUBE-branded search terms which are at an 82% cost-per-click discount to non-branded terms a r, L. J Gier Port Washington 26 |
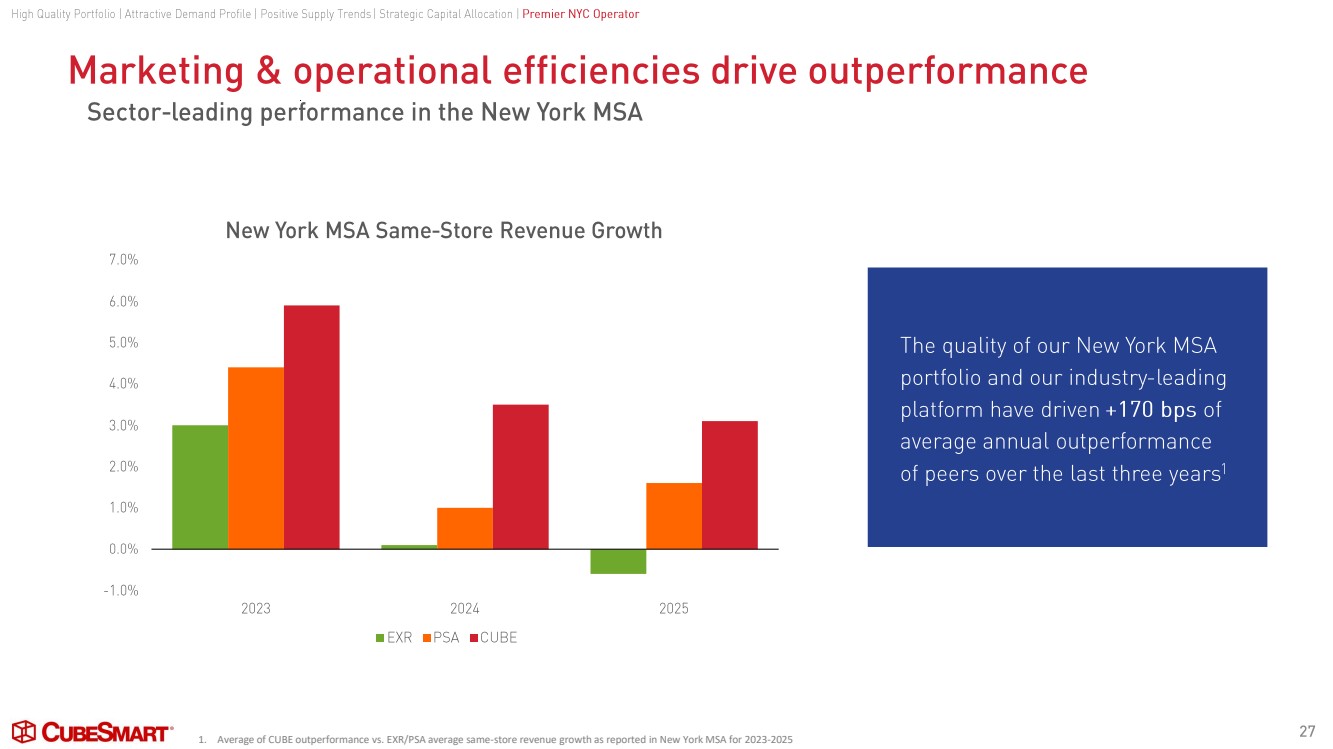
| Marketing & operational efficiencies drive outperformance 27 Sector -leading performance in the New York MSA -1.0% 0.0% 1.0% 2.0% 3.0% 4.0% 5.0% 6.0% 7.0% 2023 2024 2025 New York MSA Same - Store Revenue Growth EXR PSA CUBE High Quality Portfolio | Attractive Demand Profile | Positive Supply Trends | Strategic Capital Allocation | Premier NYC Operator The quality of our New York MSA portfolio and our industry -leading platform have driven +170 bps of average annual outperformance of peers over the last three years 1 1. Average of CUBE outperformance vs. EXR/PSA average same-store revenue growth as reported in New York MSA for 2023-2025 High Quality Portfolio I Attractive Demand Profile I Positive Supply Trends I Strategic Capital Allocation I Premier NYC Operator Marketing & operational efficiencies drive outperformance Sector-leading performance in the New York MSA New York MSA Same-Store Revenue Growth 7.0% 6.0% 5.0% 4.0% 3.0% 2.0% 1.0% 0.0% -1 .0% 2023 2024 2025 ■ EXR ■ PSA ■ CUBE ® CuBE5MART· The quality of our New York MSA portfolio and our industry-leading platform have driven + 170 bps of average annual outperformance of peers over the last three years 1 27 |
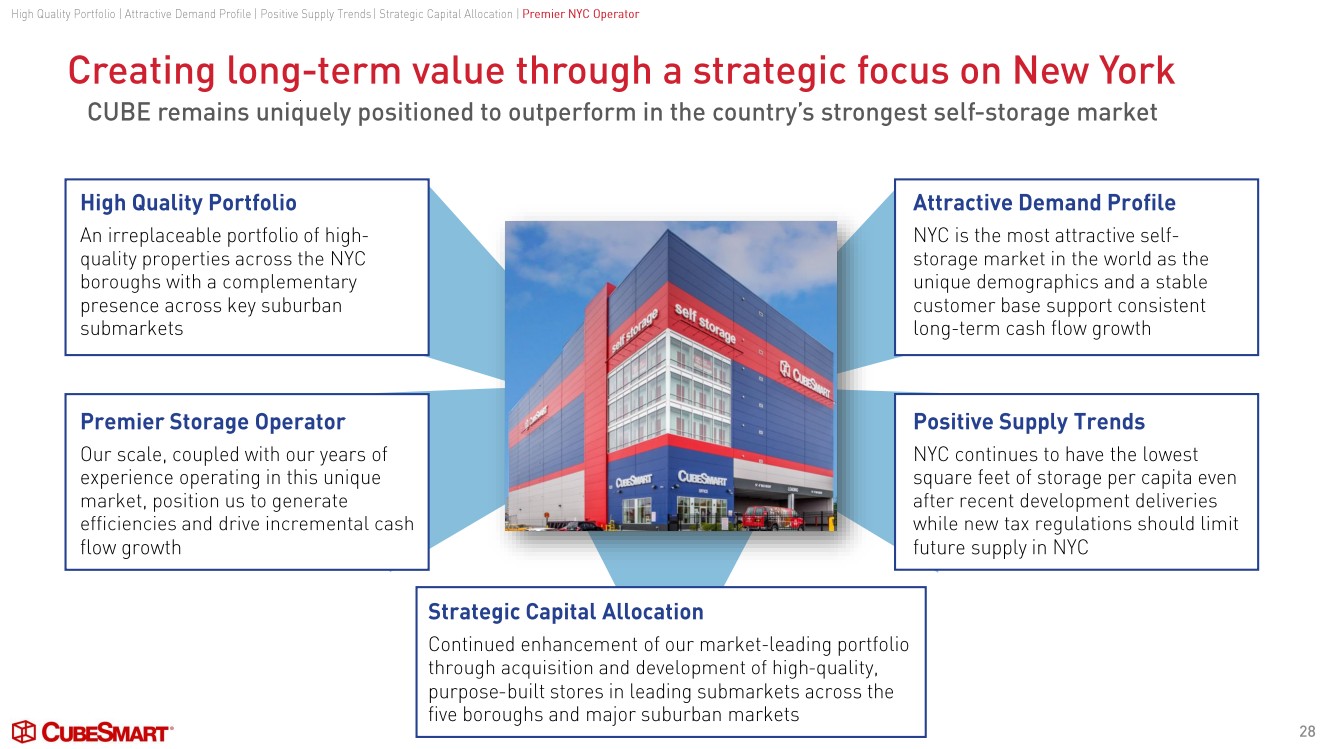
| 28 High Quality Portfolio An irreplaceable portfolio of high - quality properties across the NYC boroughs with a complementary presence across key suburban submarkets Premier Storage Operator Our scale, coupled with our years of experience operating in this unique market, position us to generate efficiencies and drive incremental cash flow growth Attractive Demand Profile NYC is the most attractive self - storage market in the world as the unique demographics and a stable customer base support consistent long -term cash flow growth Positive Supply Trends NYC continues to have the lowest square feet of storage per capita even after recent development deliveries while new tax regulations should limit future supply in NYC Strategic Capital Allocation Continued enhancement of our market -leading portfolio through acquisition and development of high -quality, purpose -built stores in leading submarkets across the five boroughs and major suburban markets Creating long -term value through a strategic focus on New York CUBE remains uniquely positioned to outperform in the country’s strongest self -storage market High Quality Portfolio | Attractive Demand Profile | Positive Supply Trends High Quality Portfolio I Attractive Demand Profile I Positive Supply Trends | Strategic Capital Allocation | I Strategic Capital Allocation I Premier NYC Operator Premier NYC Operator Creating long-term value through a strategic focus on New York CUBE remains uniquely positioned to outperform in the country's strongest self-storage market High Quality Portfolio An irreplaceable portfolio of high-quality properties across the NYC boroughs with a complementary presence across key su bu rba n submarkets Premier Storage Operator Our scale, coupled with our years of experience operating in this unique market, position us to generate efficiencies and drive incremental cash flow growth ® CuBE5MART· Strategic Capital Allocation Continued enhancement of our market-leading portfolio through acquisition and development of high-quality, purpose-built stores in leading submarkets across the five boroughs and major suburban markets Attractive Demand Profile NYC is the most attractive self-storage market in the world as the unique demographics and a stable customer base support consistent long-term cash flow growth Positive Supply Trends NYC continues to have the lowest square feet of storage per capita even after recent development deliveries while new tax regulations should limit future supply in NYC 28 |