Pay vs Performance Disclosure - USD ($)
|
12 Months Ended |
Jan. 31, 2026 |
Feb. 01, 2025 |
Feb. 03, 2024 |
Jan. 28, 2023 |
Jan. 29, 2022 |
| Pay vs Performance Disclosure |
|
|
|
|
|
| Pay vs Performance Disclosure, Table |
| | | | | | | | | | | | | | | | | | | | | | | | | | | | | | | | | | | | | | | | | | | | | | | | | | | Fiscal
Year | | Summary Compensation Table Total for PEO ($)(1) | | Compensation Actually Paid to PEO ($)(3) | | Average Summary Compensation Table Total for Non-PEO NEOs ($)(2) | | Average Compensation Actually Paid to Non-PEO NEOs ($)(3) | | Value of Initial Fixed $100 Investment Based on: | | Net (Loss) Income ($) (in 000s)(6) | | PBT ($) (in 000s)(7) | | | | | | Total Shareholder Return ($)(4) | | Peer Group Total Shareholder Return ($)(5) | | | | 2025 | | 5,529,136 | | | (1,011,815) | | | 1,914,928 | | | 157,645 | | | 66.54 | | | 54.60 | | | (27,889) | | | 42,163 | | | 2024 | | 5,315,173 | | | 2,882,597 | | | 1,807,048 | | | 1,202,029 | | | 141.66 | | | 64.17 | | | 92,973 | | | 102,432 | | | 2023 | | 5,642,525 | | | 1,677,767 | | | 1,903,562 | | | 682,702 | | | 157.73 | | | 58.68 | | | 60,703 | | | 173,207 | | | 2022 | | 5,212,353 | | | 11,376,661 | | | 1,922,191 | | | 4,101,452 | | | 187.25 | | | 71.83 | | | 165,735 | | | 195,961 | | | 2021 | | 4,765,870 | | | 5,702,329 | | | 1,893,007 | | | 2,310,681 | | | 126.25 | | | 98.50 | | | 131,321 | | | 150,568 | |
|
|
|
|
|
| Company Selected Measure Name |
Profit Before Taxes
|
|
|
|
|
| Named Executive Officers, Footnote |
Thomas C. Chubb III was our PEO for the entirety of fiscal 2025, 2024, 2023, 2022 and 2021. The amounts reported reflect the amounts of total compensation reported in the “Total” column of the Summary Compensation Table (SCT) for each applicable year.The amounts reported reflect the average of the amounts of total compensation reported for our non-PEO NEOs in the “Total” column of the SCT for each applicable year. The non-PEO NEOs included in this calculation for fiscal 2025 are: K. Scott Grassmyer, Thomas E. Campbell, Michelle M. Kelly, Douglas B. Wood and Robert S. Trauber. The non-PEO NEOs included in this calculation for each of fiscal 2024, 2023, 2022 and 2021 are: K. Scott Grassmyer, Thomas E. Campbell, Michelle M. Kelly and Douglas B. Wood.
|
|
|
|
|
| PEO Total Compensation Amount |
$ 5,529,136
|
$ 5,315,173
|
$ 5,642,525
|
$ 5,212,353
|
$ 4,765,870
|
| PEO Actually Paid Compensation Amount |
$ (1,011,815)
|
2,882,597
|
1,677,767
|
11,376,661
|
5,702,329
|
| Adjustment To PEO Compensation, Footnote |
The amounts reported reflect the “compensation actually paid” to Thomas C. Chubb III and the average “compensation actually paid” to our non-PEO NEOs for the applicable year, calculated in accordance with Item 402(v) of Regulation S-K. These amounts do not reflect the actual amounts of compensation paid to Thomas C. Chubb III or our non-PEO NEOs for the applicable year. The following table details the adjustments to the total compensation reflected in the SCT used to calculate “compensation actually paid” in accordance with the requirements of Item 402(v). The Company does not maintain a defined benefit pension plan so no adjustments for pension benefits are included in the table below. | | | | | | | | | | | | | | | | | | | | | | | | | | | | | | | | | | | | | | | | | | | | | | | | | | | | | | | | | | | | | | | | PEO | Non-PEO NEOs (Average) | | | 2025
($) | | 2024
($) | | 2023
($) | | 2022
($) | | 2021
($) | | 2025
($) | | 2024
($) | | 2023
($) | | 2022
($) | | 2021
($) | | | Total Compensation reported in SCT | 5,529,136 | | | 5,315,173 | | | 5,642,525 | | | 5,212,353 | | | 4,765,870 | | | 1,914,928 | | | 1,807,048 | | | 1,903,562 | | | 1,922,191 | | | 1,893,007 | | | Deduct: Grant date fair value reported in SCT of equity awards granted during covered fiscal year | 3,942,205 | | | 4,048,660 | | | 4,247,460 | | | 2,544,375 | | | 2,249,159 | | | 921,058 | | | 1,056,606 | | | 1,071,316 | | | 783,859 | | | 762,800 | | | Add: Fair value as of fiscal year-end of equity awards granted during the year that are outstanding and unvested as of fiscal year-end | 1,705,900 | | | 2,503,480 | | | 2,888,580 | | | 3,982,295 | | | 2,045,469 | | | 436,318 | | | 651,808 | | | 731,751 | | | 1,233,241 | | | 693,750 | | |
| | | | | | | | | | | | | | | | | | | | | | | | | | | | | | | | | | | | | | | | | | | | | | | | | | | | | | | | | | | | | | | Add: Change as of fiscal year-end in fair value of awards granted in any prior year that are outstanding and unvested as of fiscal year-end | (3,384,420) | | | (1,701,210) | | | (2,157,805) | | | 4,570,887 | | | 817,308 | | | (871,355) | | | (471,593) | | | (693,136) | | | 1,670,440 | | | 331,645 | | | Add: Change as of vesting date in fair value for any equity awards granted in any prior year that vested during the covered fiscal year | (920,226) | | | 813,814 | | | (448,073) | | | 155,500 | | | 322,840 | | | (257,065) | | | 271,372 | | | (188,159) | | | 59,439 | | | 155,079 | | | Deduct: Fair value as of fiscal year-end of awards granted in any prior year that fail to meet applicable vesting conditions during the covered fiscal year | — | | | — | | | — | | | — | | | — | | | 144,123 | | | — | | | — | | | — | | | — | | | | Compensation Actually Paid | (1,011,815) | | | 2,882,597 | | | 1,677,767 | | | 11,376,661 | | | 5,702,329 | | | 157,645 | | | 1,202,029 | | | 682,702 | | | 4,101,452 | | | 2,310,681 | | |
|
|
|
|
|
| Non-PEO NEO Average Total Compensation Amount |
$ 1,914,928
|
1,807,048
|
1,903,562
|
1,922,191
|
1,893,007
|
| Non-PEO NEO Average Compensation Actually Paid Amount |
$ 157,645
|
1,202,029
|
682,702
|
4,101,452
|
2,310,681
|
| Adjustment to Non-PEO NEO Compensation Footnote |
The amounts reported reflect the “compensation actually paid” to Thomas C. Chubb III and the average “compensation actually paid” to our non-PEO NEOs for the applicable year, calculated in accordance with Item 402(v) of Regulation S-K. These amounts do not reflect the actual amounts of compensation paid to Thomas C. Chubb III or our non-PEO NEOs for the applicable year. The following table details the adjustments to the total compensation reflected in the SCT used to calculate “compensation actually paid” in accordance with the requirements of Item 402(v). The Company does not maintain a defined benefit pension plan so no adjustments for pension benefits are included in the table below. | | | | | | | | | | | | | | | | | | | | | | | | | | | | | | | | | | | | | | | | | | | | | | | | | | | | | | | | | | | | | | | | PEO | Non-PEO NEOs (Average) | | | 2025
($) | | 2024
($) | | 2023
($) | | 2022
($) | | 2021
($) | | 2025
($) | | 2024
($) | | 2023
($) | | 2022
($) | | 2021
($) | | | Total Compensation reported in SCT | 5,529,136 | | | 5,315,173 | | | 5,642,525 | | | 5,212,353 | | | 4,765,870 | | | 1,914,928 | | | 1,807,048 | | | 1,903,562 | | | 1,922,191 | | | 1,893,007 | | | Deduct: Grant date fair value reported in SCT of equity awards granted during covered fiscal year | 3,942,205 | | | 4,048,660 | | | 4,247,460 | | | 2,544,375 | | | 2,249,159 | | | 921,058 | | | 1,056,606 | | | 1,071,316 | | | 783,859 | | | 762,800 | | | Add: Fair value as of fiscal year-end of equity awards granted during the year that are outstanding and unvested as of fiscal year-end | 1,705,900 | | | 2,503,480 | | | 2,888,580 | | | 3,982,295 | | | 2,045,469 | | | 436,318 | | | 651,808 | | | 731,751 | | | 1,233,241 | | | 693,750 | | |
| | | | | | | | | | | | | | | | | | | | | | | | | | | | | | | | | | | | | | | | | | | | | | | | | | | | | | | | | | | | | | | Add: Change as of fiscal year-end in fair value of awards granted in any prior year that are outstanding and unvested as of fiscal year-end | (3,384,420) | | | (1,701,210) | | | (2,157,805) | | | 4,570,887 | | | 817,308 | | | (871,355) | | | (471,593) | | | (693,136) | | | 1,670,440 | | | 331,645 | | | Add: Change as of vesting date in fair value for any equity awards granted in any prior year that vested during the covered fiscal year | (920,226) | | | 813,814 | | | (448,073) | | | 155,500 | | | 322,840 | | | (257,065) | | | 271,372 | | | (188,159) | | | 59,439 | | | 155,079 | | | Deduct: Fair value as of fiscal year-end of awards granted in any prior year that fail to meet applicable vesting conditions during the covered fiscal year | — | | | — | | | — | | | — | | | — | | | 144,123 | | | — | | | — | | | — | | | — | | | | Compensation Actually Paid | (1,011,815) | | | 2,882,597 | | | 1,677,767 | | | 11,376,661 | | | 5,702,329 | | | 157,645 | | | 1,202,029 | | | 682,702 | | | 4,101,452 | | | 2,310,681 | | |
|
|
|
|
|
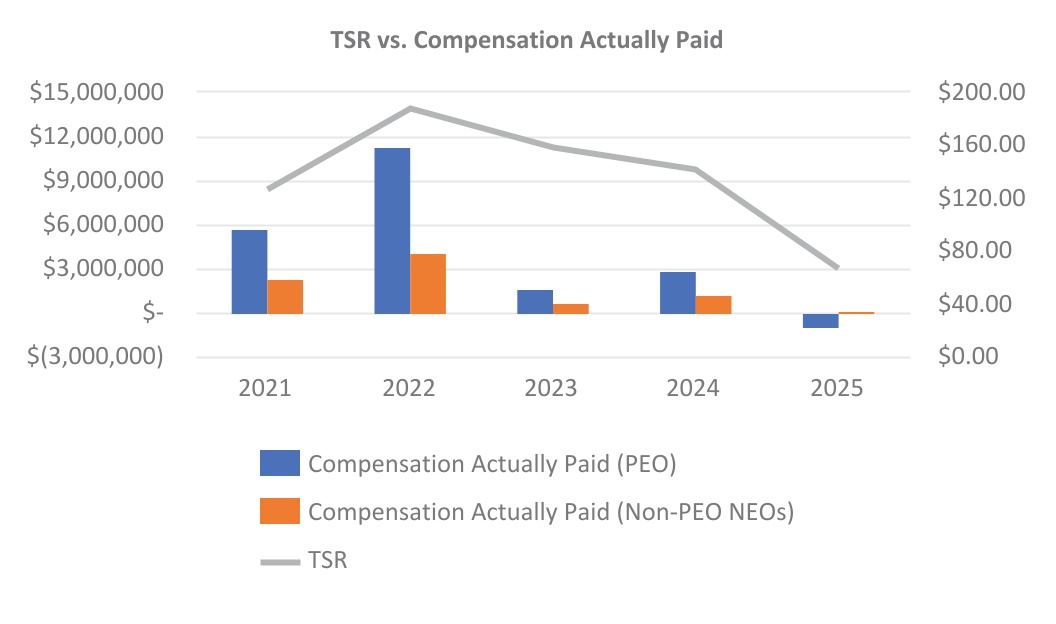
| Compensation Actually Paid vs. Total Shareholder Return |
Compensation Actually Paid and Total Shareholder Return The following graph reflects the relationship between “compensation actually paid” to our PEO and the average “compensation actually paid” to our non-PEO NEOs and our cumulative TSR for the fiscal years presented in the table.
|
|
|
|
|
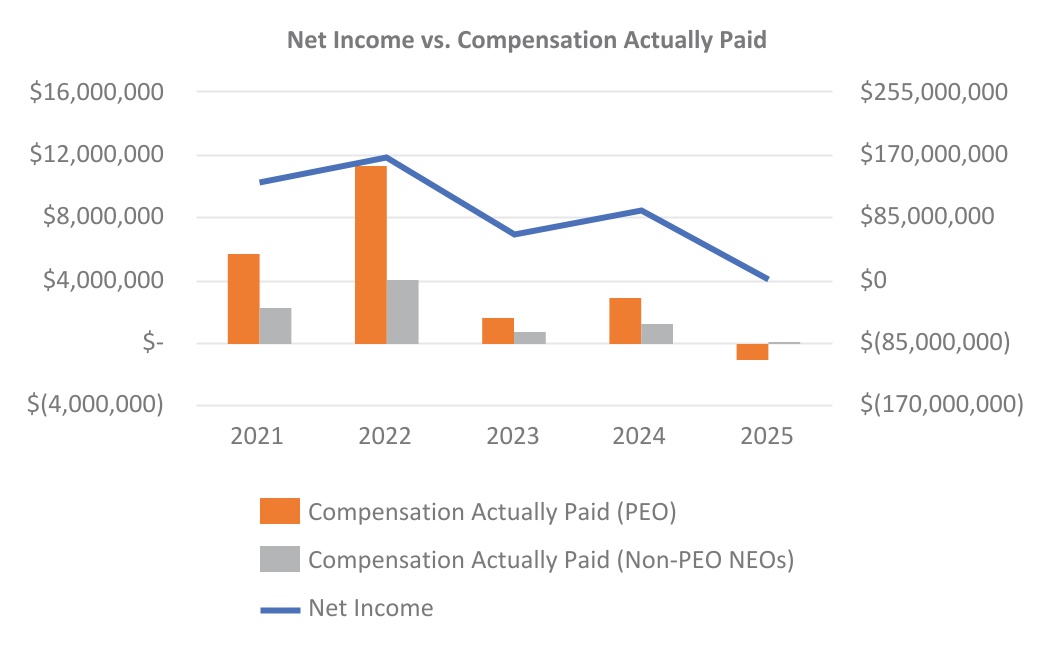
| Compensation Actually Paid vs. Net Income |
Compensation Actually Paid and Net Income SEC rules require that net income be presented as a performance measure in the Pay versus Performance table above. The following graph reflects the relationship between “compensation actually paid” to our PEO and the average “compensation actually paid” to our non-PEO NEOs and our net income during the fiscal years presented in the table, as reported in our audited financial statements for the applicable fiscal year.
|
|
|
|
|
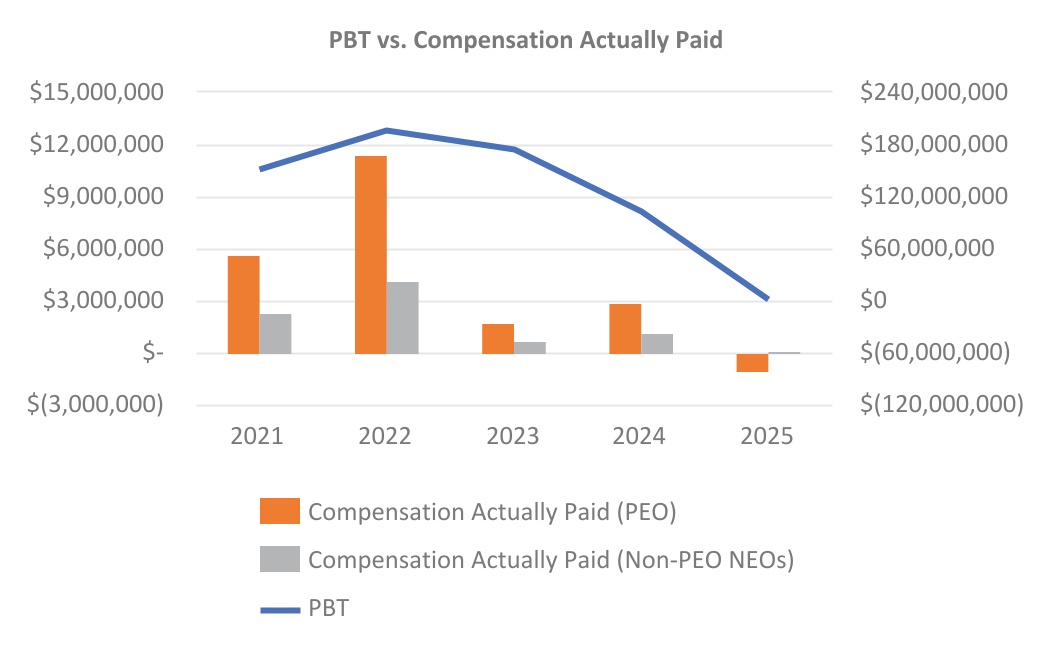
| Compensation Actually Paid vs. Company Selected Measure |
Compensation Actually Paid and PBT The following graph reflects the relationship between “compensation actually paid” to our PEO and the average “compensation actually paid” to our non-PEO NEOs and our total company PBT for the applicable fiscal year.
|
|
|
|
|
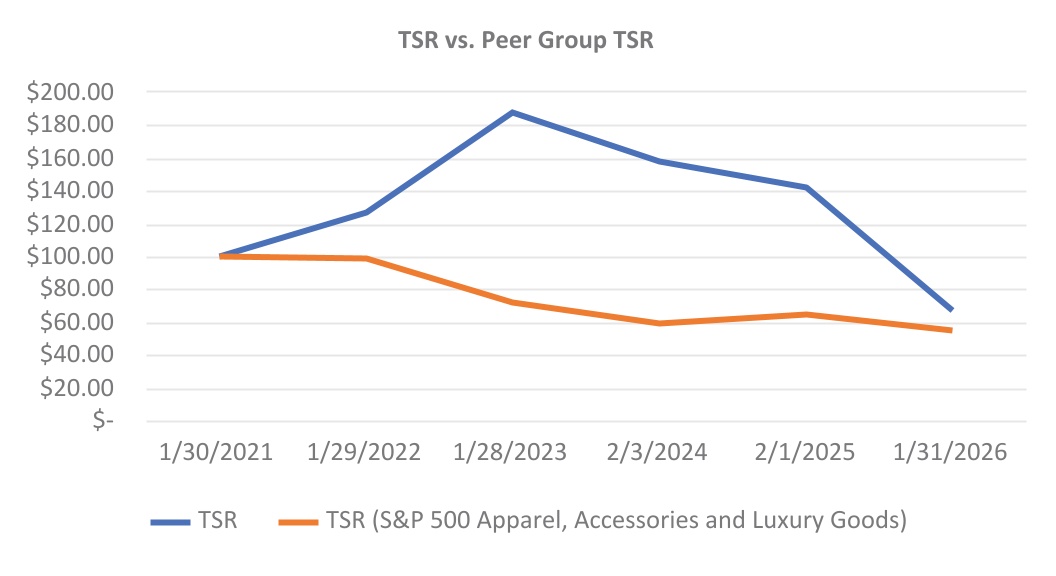
| Total Shareholder Return Vs Peer Group |
Total Shareholder Return and Peer Group Total Shareholder Return The following graph reflects a comparison of our cumulative TSR and the cumulative TSR of The S&P 500 Apparel, Accessories and Luxury Goods for the fiscal years presented in the table.
|
|
|
|
|
| Total Shareholder Return Amount |
$ 66.54
|
141.66
|
157.73
|
187.25
|
126.25
|
| Peer Group Total Shareholder Return Amount |
54.60
|
64.17
|
58.68
|
71.83
|
98.50
|
| Net Income (Loss) |
$ (27,889,000)
|
$ 92,973,000
|
$ 60,703,000
|
$ 165,735,000
|
$ 131,321,000
|
| Company Selected Measure Amount |
42,163,000
|
102,432,000
|
173,207,000
|
195,961,000
|
150,568,000
|
| PEO Name |
Thomas C. Chubb III
|
|
|
|
|
| Additional 402(v) Disclosure |
The amounts reported reflect cumulative total shareholder return (assuming an initial investment of $100 and the reinvestment of dividends) on our common stock during a period commencing as of market close on January 30, 2021 through and including the end of the applicable fiscal year (the measurement period calculated in accordance with Item 201(e) of Regulation S-K). The amounts reported reflect cumulative total shareholder return (assuming an initial investment of $100 and the reinvestment of dividends) of the S&P 500 Apparel, Accessories and Luxury Goods during a period commencing as of market close on January 30, 2021 through and including the end of the applicable fiscal year. The amounts reported reflect the amount of net income reported in our audited financial statements for the applicable fiscal year. In fiscal 2025 and fiscal 2023, we incurred non-cash impairment charges in goodwill, intangible assets and equity method investments of $61.0 million and $113.6 million, respectively.
|
|
|
|
|
| Measure:: 1 |
|
|
|
|
|
| Pay vs Performance Disclosure |
|
|
|
|
|
| Name |
Profit Before Taxes
|
|
|
|
|
| Non-GAAP Measure Description |
We have determined that PBT is the financial performance measure that represents the most important measure (that is not otherwise required to be disclosed in the table) to link compensation actually paid to the PEO and our other NEOs to our financial performance.
|
|
|
|
|
| Measure:: 2 |
|
|
|
|
|
| Pay vs Performance Disclosure |
|
|
|
|
|
| Name |
Total Shareholder Return
|
|
|
|
|
| Measure:: 3 |
|
|
|
|
|
| Pay vs Performance Disclosure |
|
|
|
|
|
| Name |
Comparator Group Total Shareholder Return
|
|
|
|
|
| PEO | Aggregate Grant Date Fair Value of Equity Award Amounts Reported in Summary Compensation Table |
|
|
|
|
|
| Pay vs Performance Disclosure |
|
|
|
|
|
| Adjustment to Compensation, Amount |
$ (3,942,205)
|
$ (4,048,660)
|
$ (4,247,460)
|
$ (2,544,375)
|
$ (2,249,159)
|
| PEO | Year-end Fair Value of Equity Awards Granted in Covered Year that are Outstanding and Unvested |
|
|
|
|
|
| Pay vs Performance Disclosure |
|
|
|
|
|
| Adjustment to Compensation, Amount |
1,705,900
|
2,503,480
|
2,888,580
|
3,982,295
|
2,045,469
|
| PEO | Year-over-Year Change in Fair Value of Equity Awards Granted in Prior Years That are Outstanding and Unvested |
|
|
|
|
|
| Pay vs Performance Disclosure |
|
|
|
|
|
| Adjustment to Compensation, Amount |
(3,384,420)
|
(1,701,210)
|
(2,157,805)
|
4,570,887
|
817,308
|
| PEO | Change in Fair Value as of Vesting Date of Prior Year Equity Awards Vested in Covered Year |
|
|
|
|
|
| Pay vs Performance Disclosure |
|
|
|
|
|
| Adjustment to Compensation, Amount |
(920,226)
|
813,814
|
(448,073)
|
155,500
|
322,840
|
| PEO | Prior Year End Fair Value of Equity Awards Granted in Any Prior Year that Fail to Meet Applicable Vesting Conditions During Covered Year |
|
|
|
|
|
| Pay vs Performance Disclosure |
|
|
|
|
|
| Adjustment to Compensation, Amount |
0
|
0
|
0
|
0
|
0
|
| Non-PEO NEO | Aggregate Grant Date Fair Value of Equity Award Amounts Reported in Summary Compensation Table |
|
|
|
|
|
| Pay vs Performance Disclosure |
|
|
|
|
|
| Adjustment to Compensation, Amount |
(921,058)
|
(1,056,606)
|
(1,071,316)
|
(783,859)
|
(762,800)
|
| Non-PEO NEO | Year-end Fair Value of Equity Awards Granted in Covered Year that are Outstanding and Unvested |
|
|
|
|
|
| Pay vs Performance Disclosure |
|
|
|
|
|
| Adjustment to Compensation, Amount |
436,318
|
651,808
|
731,751
|
1,233,241
|
693,750
|
| Non-PEO NEO | Year-over-Year Change in Fair Value of Equity Awards Granted in Prior Years That are Outstanding and Unvested |
|
|
|
|
|
| Pay vs Performance Disclosure |
|
|
|
|
|
| Adjustment to Compensation, Amount |
(871,355)
|
(471,593)
|
(693,136)
|
1,670,440
|
331,645
|
| Non-PEO NEO | Change in Fair Value as of Vesting Date of Prior Year Equity Awards Vested in Covered Year |
|
|
|
|
|
| Pay vs Performance Disclosure |
|
|
|
|
|
| Adjustment to Compensation, Amount |
(257,065)
|
271,372
|
(188,159)
|
59,439
|
155,079
|
| Non-PEO NEO | Prior Year End Fair Value of Equity Awards Granted in Any Prior Year that Fail to Meet Applicable Vesting Conditions During Covered Year |
|
|
|
|
|
| Pay vs Performance Disclosure |
|
|
|
|
|
| Adjustment to Compensation, Amount |
$ (144,123)
|
$ 0
|
$ 0
|
$ 0
|
$ 0
|