Pay vs Performance Disclosure - USD ($)
Jan. 31, 2026
Jan. 31, 2025
Jan. 31, 2024
Jan. 31, 2023
Jan. 31, 2022
Pay-Versus-Performance
As required by Section 952(a) of the Dodd-Frank Wall Street Reform and Consumer Protection Act and Item 402(v) of Regulation S-K, we are providing the following information about the relationship between executive “compensation actually paid” and certain measures of company performance for each of the last five completed fiscal years. The material that follows is provided in compliance with these rules, however, additional information regarding our compensation philosophy, the structure of our performance-based compensation programs, and compensation decisions made this year is described above in our “Compensation Discussion and Analysis.”
In determining the “compensation actually paid” to our named executive officers (or “NEOs”), we are required to make various adjustments to amounts that have been previously reported in the Summary Compensation Table as the SEC’s rules for this disclosure differ from those required in the Summary Compensation Table. For our NEOs other than our principal executive officer (the “PEO”), amounts disclosed are reported as an average.
Value of initial fixed $100 Investment based on: | ||||||||||||||||||||||||||
Fiscal Year | Summary Compensation Table Total for PEO($)(1) | Compensation Actually Paid to PEO($)(2) | Average Summary Compensation Table Total for Non-PEO NEO($)(3) | Average Compensation Actually Paid to Non-PEO NEO($)(4) | Total Shareholder Return($)(5) | Peer Group Total Shareholder Return($)(6) | Net Income($)(7) | Company Selected Measure (Non-GAAP Operating Income)($)(8) | ||||||||||||||||||
2026 | 257,076 | (9,154,524) | 4,647,399 | 1,982,294 | 146 | 257 | 115,383,000 | 333,583,000 | ||||||||||||||||||
2025 | 12,608,146 | 13,289,146 | 4,944,982 | 8,361,326 | 193 | 198 | 244,621,000 | 303,648,000 | ||||||||||||||||||
2024 | 211,269 | 211,269 | 6,883,737 | 3,738,831 | 150 | 151 | 129,032,000 | 256,767,000 | ||||||||||||||||||
2023 | 273,579 | (790,421) | 5,219,219 | 7,108,682 | 184 | 97 | 26,783,000 | 228,978,000 | ||||||||||||||||||
2022 | 292,514 | 252,514 | 4,499,801 | 7,932,606 | 151 | 125 | (41,459,000) | 173,422,000 | ||||||||||||||||||
(1) | Our PEO for each year reported is Aaron Levie, our Chief Executive Officer. The dollar amounts reported in this column are the amounts of total compensation reported for Mr. Levie in the “Total” column of the Summary Compensation Table in the applicable fiscal year. |
(2) | Compensation actually paid does not mean that our PEO was actually paid these amounts in the listed year, but this is a dollar amount derived from the starting point of Summary Compensation Table total compensation under the methodology prescribed under the SEC’s rules as shown in the adjustments table below. |
Description of Adjustment | 2026 | ||||
Summary Compensation Table – Total Compensation PEO | 257,076 | ||||
Subtract grant date fair value of equity awards in Summary Compensation Table ($) | — | ||||
Add year end fair value of equity awards granted during year that are outstanding and unvested at fiscal year end ($) * | — | ||||
Adjust for year over year change in fair value of outstanding and unvested equity awards granted in prior years ($) | (9,411,600) | ||||
Add fair value as of vesting date of equity awards granted and vested in the year ($) | — | ||||
Adjust for year over year change in fair value of equity awards granted in prior years that vested in the year ($) | — | ||||
Subtract fair value at the end of the prior year of equity awards that failed to meet vesting conditions in the year ($) | — | ||||
Total Equity Adjustments (subtotal) ($) | (9,411,600) | ||||
Compensation Actually Paid ($) | (9,154,524) | ||||
* | The assumptions used for determining the fair values shown in this table are materially consistent with those used to determine the fair values disclosed as of the grant date of such awards. |
(3) | The non-PEO NEOs for fiscal years 2026 and 2025 were Olivia Nottebohm and Dylan Smith. The non-PEO NEOs for fiscal year 2024 were Stephanie Carullo, Olivia Nottebohm, and Dylan Smith. The non-PEO NEOs for fiscal years 2023 and 2022 were Stephanie Carullo and Dylan Smith. The dollar amounts reported in this column represent the average of the amounts reported for the non-PEO NEOs in the “Total” column of the Summary Compensation Table in the applicable fiscal year. |
(4) | Compensation actually paid does not mean that that these NEOs were actually paid those amounts in the listed year, but this is a dollar amount derived from the starting point of Summary Compensation Table total compensation under the methodology prescribed under the SEC’s rules as shown in the adjustment table below. |
Description of Adjustment | 2026 | ||||
Summary Compensation Table – Total Compensation non-PEO NEOs | 4,647,399 | ||||
Subtract grant date fair value of equity awards in Summary Compensation Table ($) | (4,058,225) | ||||
Add year end fair value of equity awards granted during year that are outstanding and unvested at fiscal year end ($) * | 3,224,539 | ||||
Adjust for year over year change in fair value of outstanding and unvested equity awards granted in prior years ($) | (1,924,673) | ||||
Add fair value as of vesting date of equity awards granted and vested in the year ($) | 410,391 | ||||
Adjust for year over year change in fair value of equity awards granted in prior years that vested in the year ($) | (317,137) | ||||
Subtract fair value at the end of the prior year of equity awards that failed to meet vesting conditions in the year ($) | — | ||||
Total Equity Adjustments (subtotal) ($) | (2,665,105) | ||||
Compensation Actually Paid ($) | 1,982,294 | ||||
* | The assumptions used for determining the fair values shown in this table are materially consistent with those used to determine the fair values disclosed as of the grant date of such awards. |
(5) | Total shareholder return is calculated by assuming that a $100 investment was made on the day prior to the first fiscal year reported below and reinvesting all dividends until the last day of each reported fiscal year. |
(6) | The peer group used is the NASDAQ Computer Index, as used in the company’s performance graph in our Annual Report on Form 10-K. Total shareholder return is calculated by assuming that a $100 investment was made on the day prior to the first fiscal year reported below and reinvesting all dividends until the last day of each reported fiscal year. |
(7) | The dollar amounts reported represent the amount of net income reflected in our audited financial statements for the applicable year. |
(8) | In the company’s assessment, non-GAAP operating income is the financial performance measure that is the most important financial measure used by the company in fiscal 2026 to link compensation actually paid to performance. The dollar amounts reported reflect the amount of non-GAAP operating income for the applicable year. |
(1) | Our PEO for each year reported is Aaron Levie, our Chief Executive Officer. The dollar amounts reported in this column are the amounts of total compensation reported for Mr. Levie in the “Total” column of the Summary Compensation Table in the applicable fiscal year. |
(3) | The non-PEO NEOs for fiscal years 2026 and 2025 were Olivia Nottebohm and Dylan Smith. The non-PEO NEOs for fiscal year 2024 were Stephanie Carullo, Olivia Nottebohm, and Dylan Smith. The non-PEO NEOs for fiscal years 2023 and 2022 were Stephanie Carullo and Dylan Smith. The dollar amounts reported in this column represent the average of the amounts reported for the non-PEO NEOs in the “Total” column of the Summary Compensation Table in the applicable fiscal year. |
(6) | The peer group used is the NASDAQ Computer Index, as used in the company’s performance graph in our Annual Report on Form 10-K. Total shareholder return is calculated by assuming that a $100 investment was made on the day prior to the first fiscal year reported below and reinvesting all dividends until the last day of each reported fiscal year. |
(2) | Compensation actually paid does not mean that our PEO was actually paid these amounts in the listed year, but this is a dollar amount derived from the starting point of Summary Compensation Table total compensation under the methodology prescribed under the SEC’s rules as shown in the adjustments table below. |
Description of Adjustment | 2026 | ||||
Summary Compensation Table – Total Compensation PEO | 257,076 | ||||
Subtract grant date fair value of equity awards in Summary Compensation Table ($) | — | ||||
Add year end fair value of equity awards granted during year that are outstanding and unvested at fiscal year end ($) * | — | ||||
Adjust for year over year change in fair value of outstanding and unvested equity awards granted in prior years ($) | (9,411,600) | ||||
Add fair value as of vesting date of equity awards granted and vested in the year ($) | — | ||||
Adjust for year over year change in fair value of equity awards granted in prior years that vested in the year ($) | — | ||||
Subtract fair value at the end of the prior year of equity awards that failed to meet vesting conditions in the year ($) | — | ||||
Total Equity Adjustments (subtotal) ($) | (9,411,600) | ||||
Compensation Actually Paid ($) | (9,154,524) | ||||
* | The assumptions used for determining the fair values shown in this table are materially consistent with those used to determine the fair values disclosed as of the grant date of such awards. |
(4) | Compensation actually paid does not mean that that these NEOs were actually paid those amounts in the listed year, but this is a dollar amount derived from the starting point of Summary Compensation Table total compensation under the methodology prescribed under the SEC’s rules as shown in the adjustment table below. |
Description of Adjustment | 2026 | ||||
Summary Compensation Table – Total Compensation non-PEO NEOs | 4,647,399 | ||||
Subtract grant date fair value of equity awards in Summary Compensation Table ($) | (4,058,225) | ||||
Add year end fair value of equity awards granted during year that are outstanding and unvested at fiscal year end ($) * | 3,224,539 | ||||
Adjust for year over year change in fair value of outstanding and unvested equity awards granted in prior years ($) | (1,924,673) | ||||
Add fair value as of vesting date of equity awards granted and vested in the year ($) | 410,391 | ||||
Adjust for year over year change in fair value of equity awards granted in prior years that vested in the year ($) | (317,137) | ||||
Subtract fair value at the end of the prior year of equity awards that failed to meet vesting conditions in the year ($) | — | ||||
Total Equity Adjustments (subtotal) ($) | (2,665,105) | ||||
Compensation Actually Paid ($) | 1,982,294 | ||||
* | The assumptions used for determining the fair values shown in this table are materially consistent with those used to determine the fair values disclosed as of the grant date of such awards. |
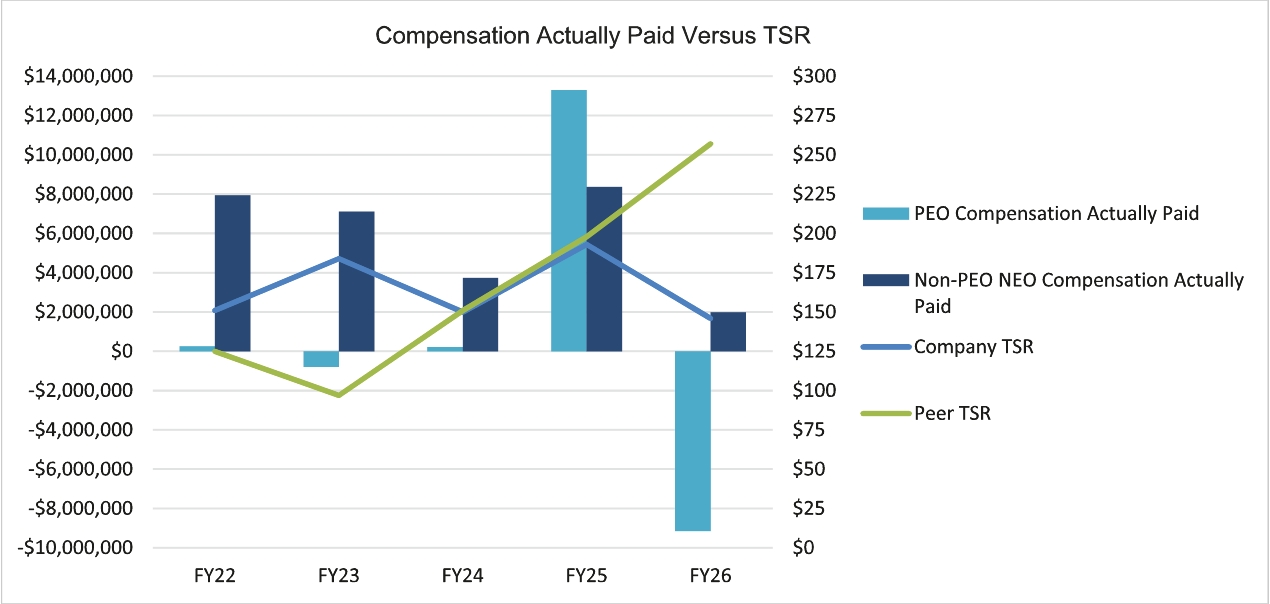
Compensation Actually Paid and Total Shareholder Return
Our Compensation Committee makes executive compensation decisions independent of SEC disclosure requirements. For a discussion of our decision-making process, please see the “Compensation Discussion and Analysis” section above.
The following graph reflects the relationship between the PEO and average non-PEO NEO “compensation actually paid” (“CAP”), our cumulative Total Shareholder Return (“TSR”) and the TSR of the NASDAQ Computer Index (“Peer TSR”), assuming an initial fixed investment on January 31, 2021 of $100, for the fiscal years ended January 31, 2026, 2025, 2024, 2023, and 2022.
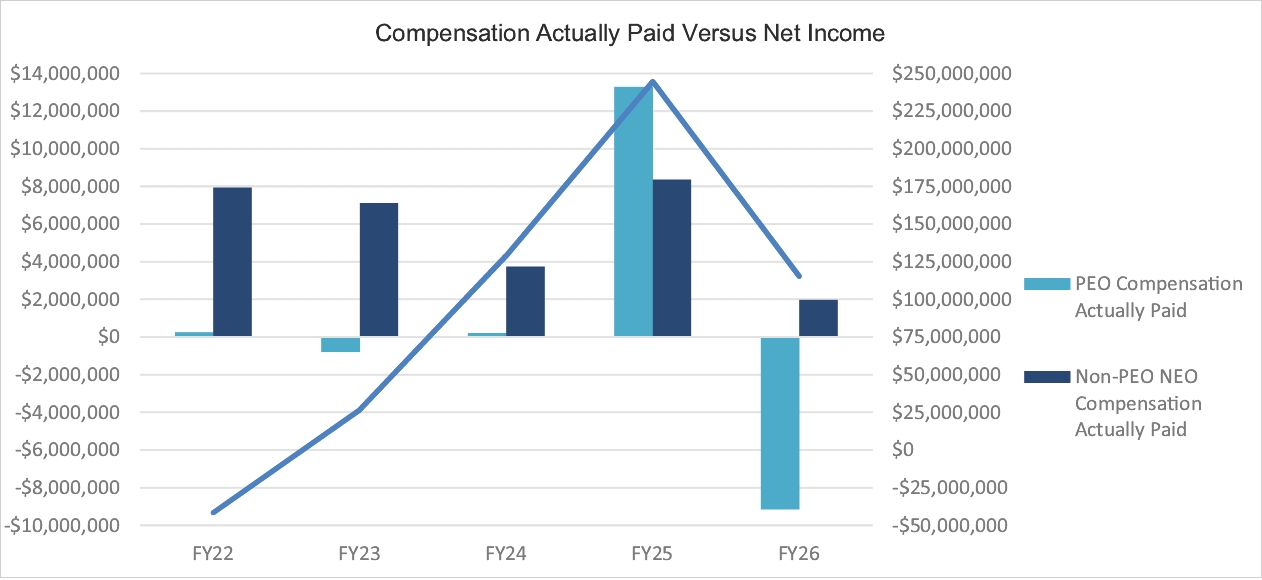
Compensation Actually Paid and Net Income
The following graph reflects the relationship between the PEO and average non-PEO NEO CAP, and our net income (loss) for the fiscal years ended January 31, 2026, 2025, 2024, 2023, and 2022. While we are required by SEC rules to disclose the relationship between our net income and “compensation actually paid” to our NEOs, this is not a metric our Compensation Committee currently uses in evaluating our NEOs’ compensation.
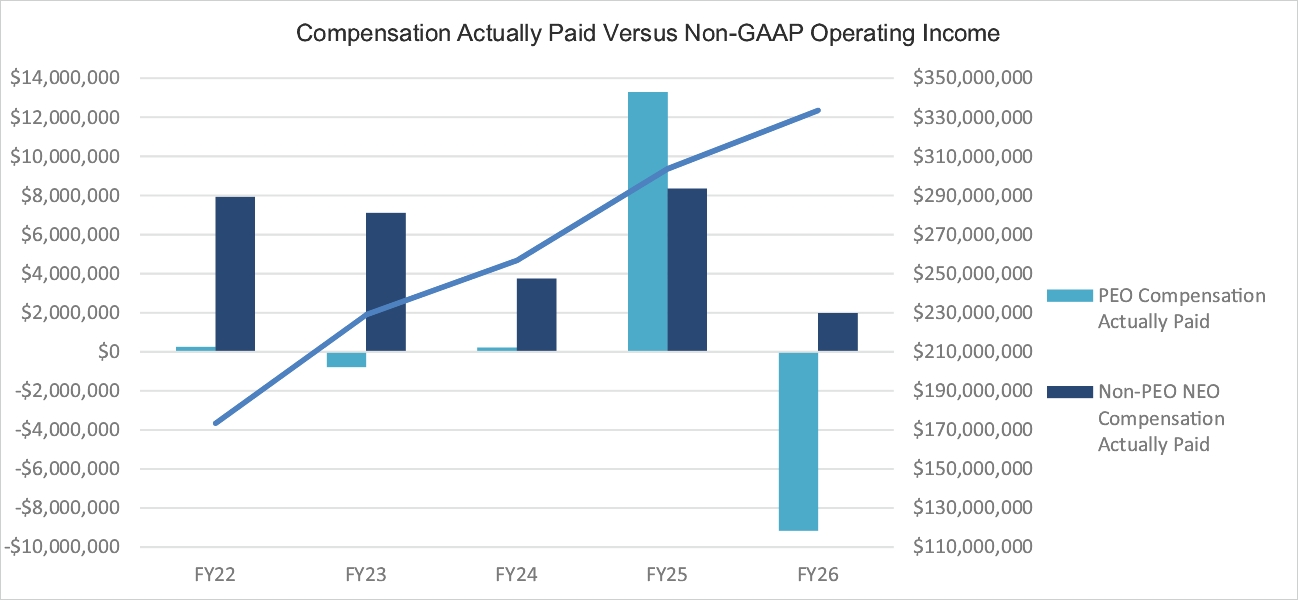
Compensation Actually Paid and Non-GAAP Operating Income
The following graph reflects the relationship between the PEO and average non-PEO NEO CAP, and our non-GAAP operating income for the fiscal years ended January 31, 2026, 2025, 2024, 2023, and 2022.
Compensation Actually Paid and Total Shareholder Return
Our Compensation Committee makes executive compensation decisions independent of SEC disclosure requirements. For a discussion of our decision-making process, please see the “Compensation Discussion and Analysis” section above.
The following graph reflects the relationship between the PEO and average non-PEO NEO “compensation actually paid” (“CAP”), our cumulative Total Shareholder Return (“TSR”) and the TSR of the NASDAQ Computer Index (“Peer TSR”), assuming an initial fixed investment on January 31, 2021 of $100, for the fiscal years ended January 31, 2026, 2025, 2024, 2023, and 2022.
Tabular List of Performance Measures
Every year our Board of Directors sets a list of corporate goals as part of our annual business plan. These goals are used to evaluate our performance and the performance of our executive officers. These goals are used in our executive compensation programs, in particular in our annual executive bonus program. The list below includes the three financial performance measures that in our assessment represent the most important financial performance measures used in fiscal year 2026 to link compensation actually paid to company performance.
• | Non-GAAP operating income |
• | Revenue |
• | Stock price |
(8) | In the company’s assessment, non-GAAP operating income is the financial performance measure that is the most important financial measure used by the company in fiscal 2026 to link compensation actually paid to performance. The dollar amounts reported reflect the amount of non-GAAP operating income for the applicable year. |