
Exhibit 99.2
CTW Fiscal First Half 2026 Results May 13, 2026

Disclosures 2 The following materials have been prepared for use in the May 13, 2026 conference call on CTW results of operations for the s ix months ending January 31, 2026. The call will be archived on the internet at https://ctw.inc/investors?lang=en. This presentation contains“forward - looking statements ˮ within the meaning of the“safe harbor ˮ provisions of the Private Securities Litigation Reform Act of 1995. These forward - looking statements are made as of the date they were first issued and were based on current plans, expectations, estimates, forecasts, and projections as we ll as the beliefs and assumptions of management. Words such as“expect, ˮ “vision, ˮ “envision, ˮ “evolving, ˮ “drive, ˮ “anticipate, ˮ “intend, ˮ “maintain, ˮ “should, ˮ “believe, ˮ “continue, ˮ “plan, ˮ “goal, ˮ “opportunity, ˮ “estimate, ˮ “predict, ˮ “may, ˮ “will, ˮ “could, ˮ “hope, ˮ “target, ˮ “project, ˮ “potential, ˮ “might, ˮ “shall, ˮ “contemplate, ˮ and“would, ˮ and variations of these terms or the negative of these terms and similar expressions are intended to identify these forward - loo king statements. Forward - looking statements are subject to a number of risks and uncertainties, many of which involve factors or circumstances that are beyond ou r control. Our actual results could differ materially from those stated or implied in forward - looking statements due to a number of factors, including but not limited to risks detailed in our filings with the Secur ities and Exchange Commission (the“SEC ˮ ), including our annual reports on Form 20 - F, our semi - annual reports on Form 6 - K, and other filings and reports we make with the SEC from time to time. In particular, the fo llowing factors, among others, could cause results to differ materially from those expressed or implied by such forward - looking statements. Additional information regarding these and other risks and uncertaintie s that could cause actual results to differ materially from our expectations is included inthereports wehave filedor willfilewiththe SEC,includingourannualreport on Form20 - F. The forward - looking statements included in this presentation represent our views as of the date of this presentation. We anticip ate that subsequent events and developments will cause our views to change. However, we undertake no intention or obligation to update or revise any forward - looking statements, whether as a result of new information, future events, or otherwise. These forward - looking statements should notbe reliedupon asrepresenting our viewsasof anydate subsequent to thedate of thispresentation. NoOffer or Solicitation This presentation does not constitute an offer to sell, or a solicitation of an offer to buy, or a recommendation to purchase , a ny securities in any jurisdiction, or the solicitation of any vote. consent or approval in any jurisdiction, nor shall there be any sale, issuance or transfer of any securities in any jurisdiction where, or to any pe rso n to whom such offer, solicitation or sale may be unlawful under the laws of such jurisdiction. ThisPresentation does not constitute eitheradvice or a recommendation regarding any securities. Nooffering of s ecu rities shall be made except by means of a prospectus meeting the requirement of theSecuritiesActof 1933, asamended, orinrelianceon anexemption therefrom. FinancialData The financial information presented in this presentation should be read in conjunction with the audited consolidated financia l s tatements and related notes included inCTW’s annual report on Form 20 - F filed with theSEC on November 17,2025,andon Form 6 - Kfiledwiththe SECon May13, 2026,whichprovides amore completediscussion of its accounting policies andcertainother information. Please review our risk factors on Form 20 - F filed with the SEC.
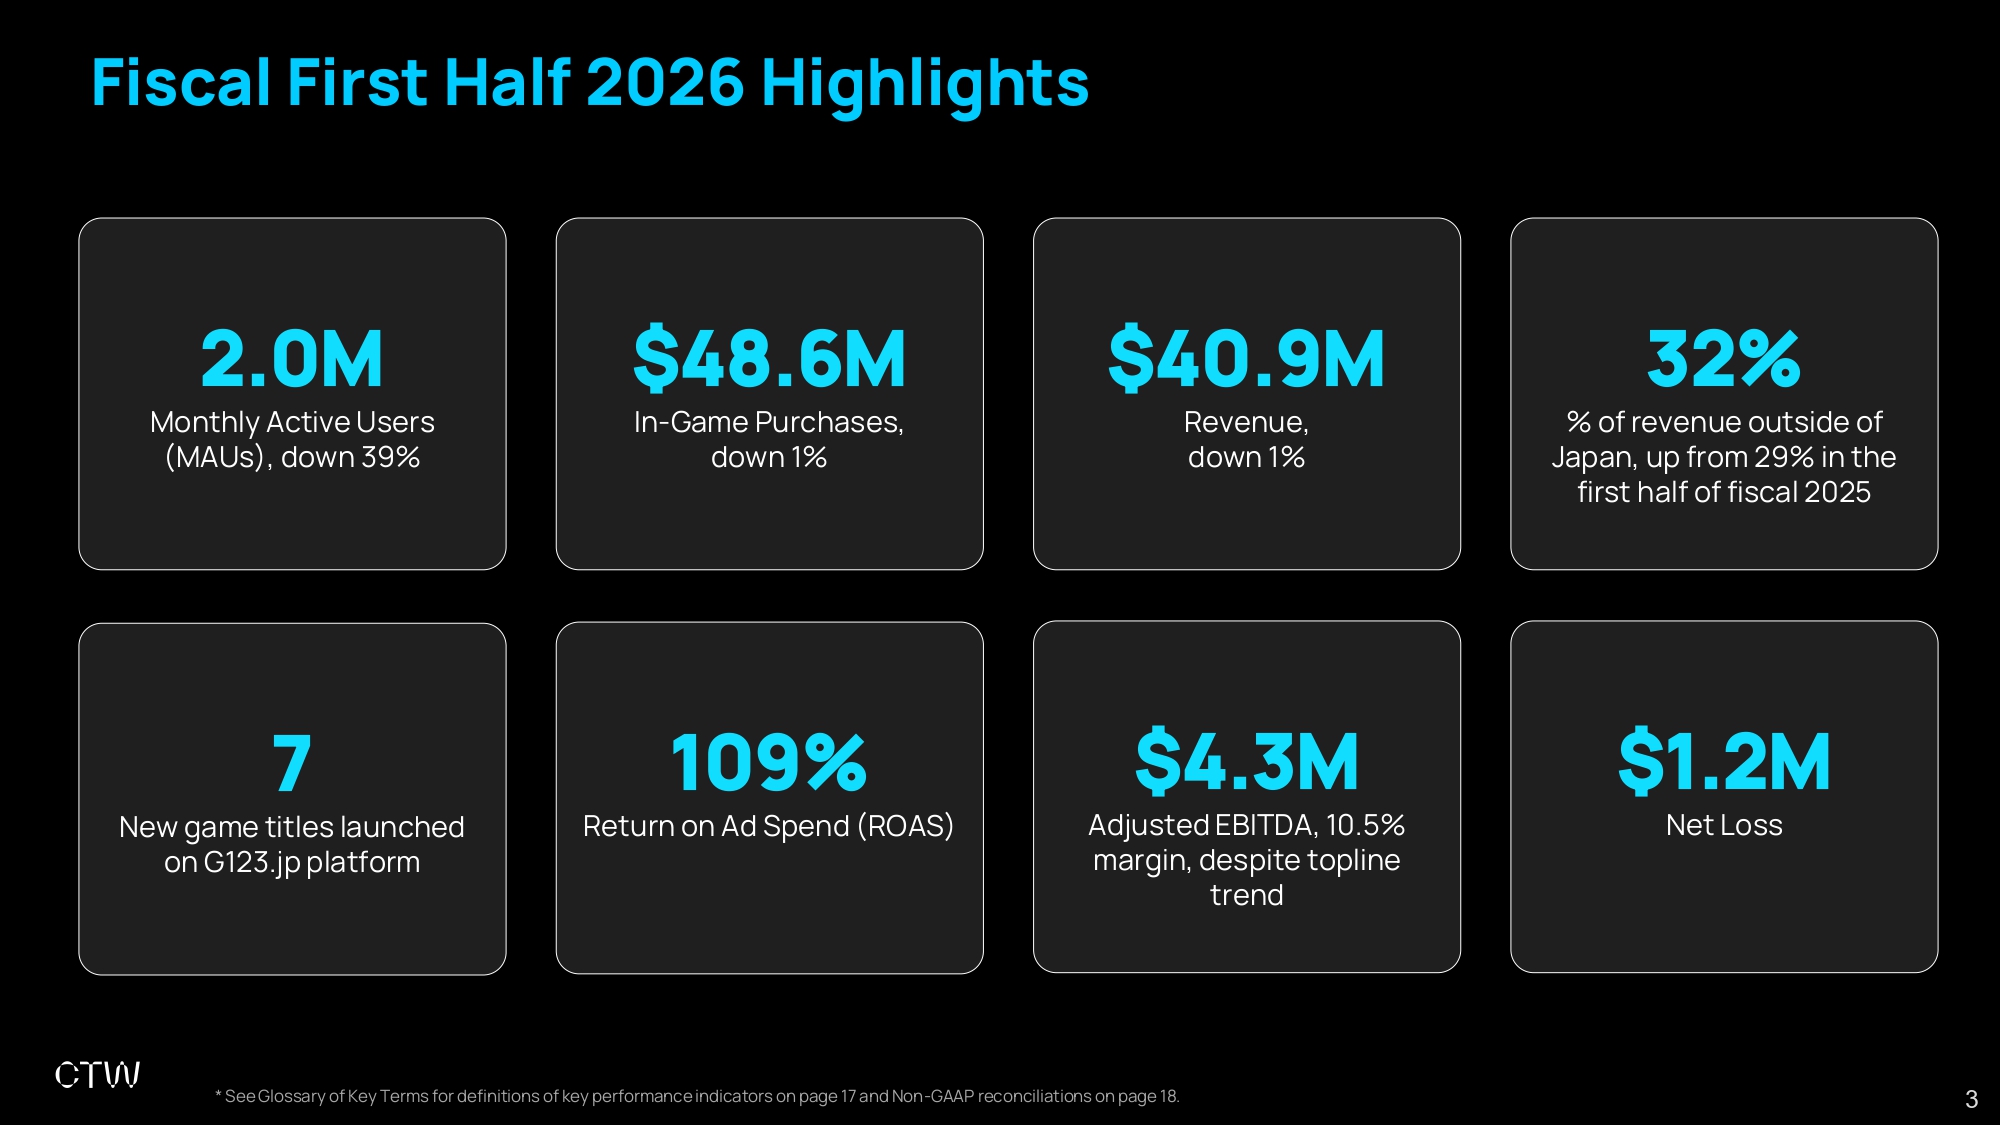
3 Fiscal First Half 2026 Highlights 2.0M Monthly Active Users (MAUs), down 39% 7 New game titles launched on G123.jp platform $48.6M In - Game Purchases, down 1% 109% Return on Ad Spend (ROAS) $40.9M Revenue, down 1% $4.3M Adjusted EBITDA, 10.5% margin, despite topline trend 32% % of revenue outside of Japan, up from 29% in the first half of fiscal 2025 $1.2M Net Loss * See Glossary of Key Terms for definitions of key performance indicators on page 17 and Non - GAAP reconciliations on page 18.
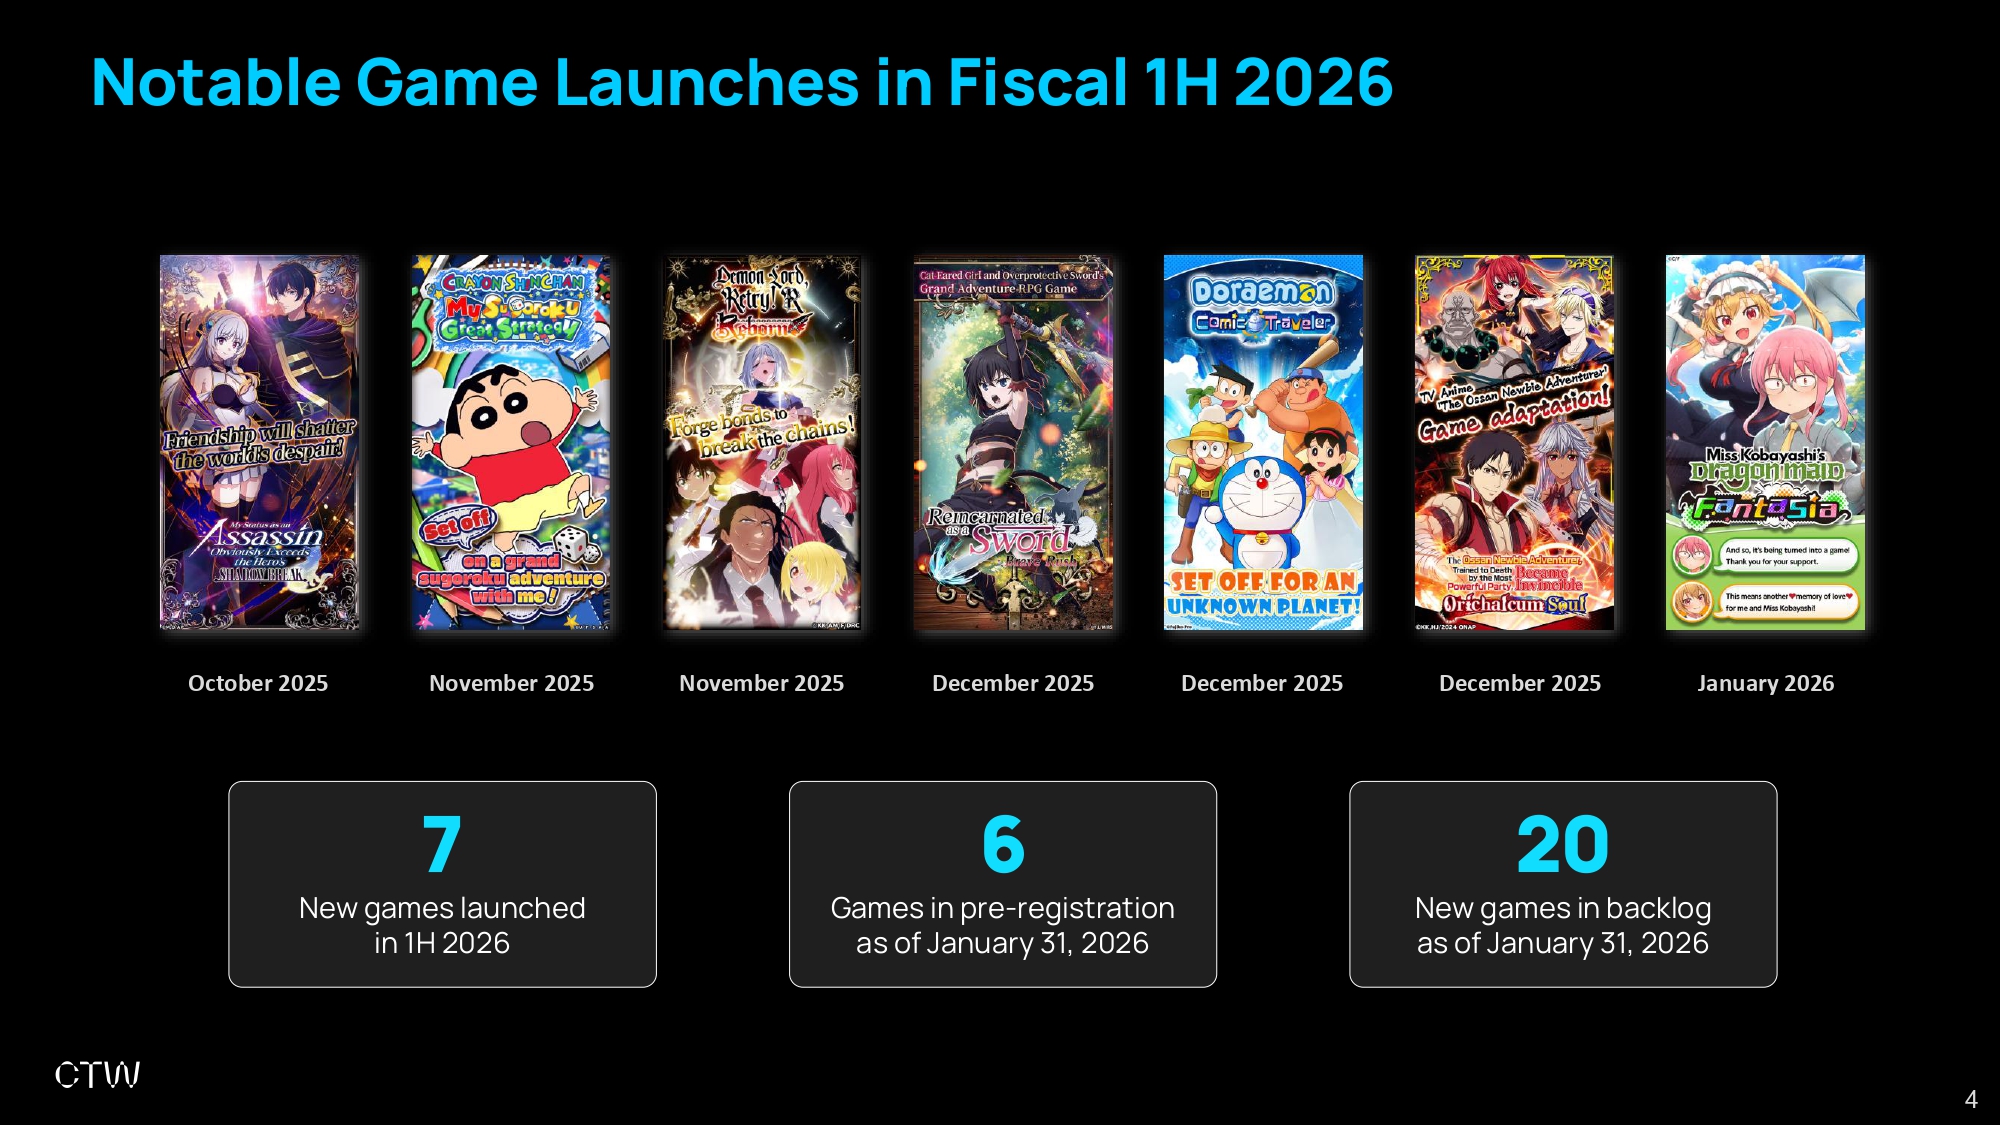
4 Notable Game Launches in Fiscal 1H 2026 November 2025 November 2025 December 2025 December 2025 January 2026 December 2025 6 Games in pre - registration as of January 31, 2026 20 New games in backlog as of January 31, 2026 7 New games launched in 1H 2026 October 2025
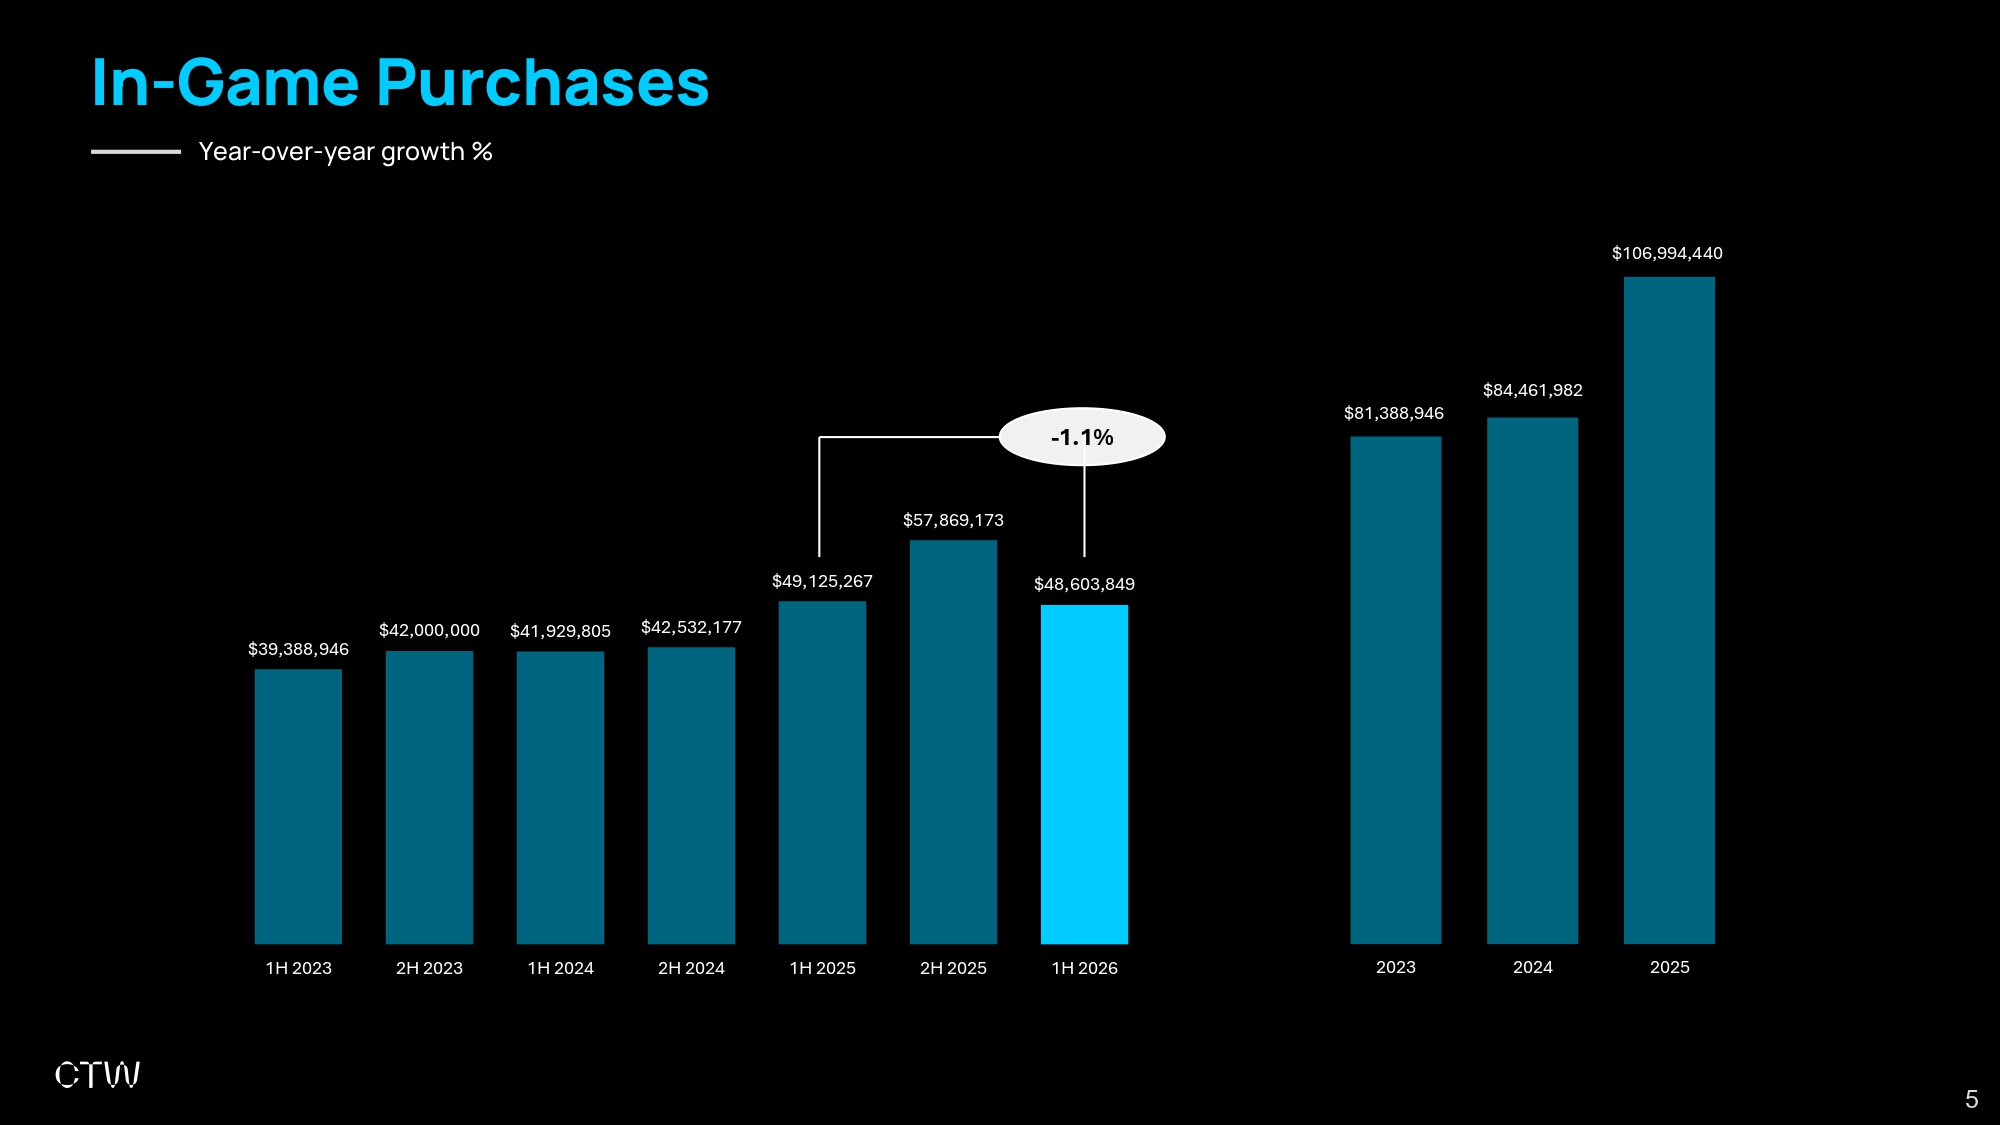
$81,388,946 $84,461,982 $106,994,440 2023 2024 2025 $39,388,946 $42,000,000 $41,929,805 $42,532,177 $49,125,267 $57,869,173 $48,603,849 1H 2023 2H 2023 1H 2024 2H 2024 1H 2025 2H 2025 1H 2026 5 In - Game Purchases Year - over - year growth % - 1.1%
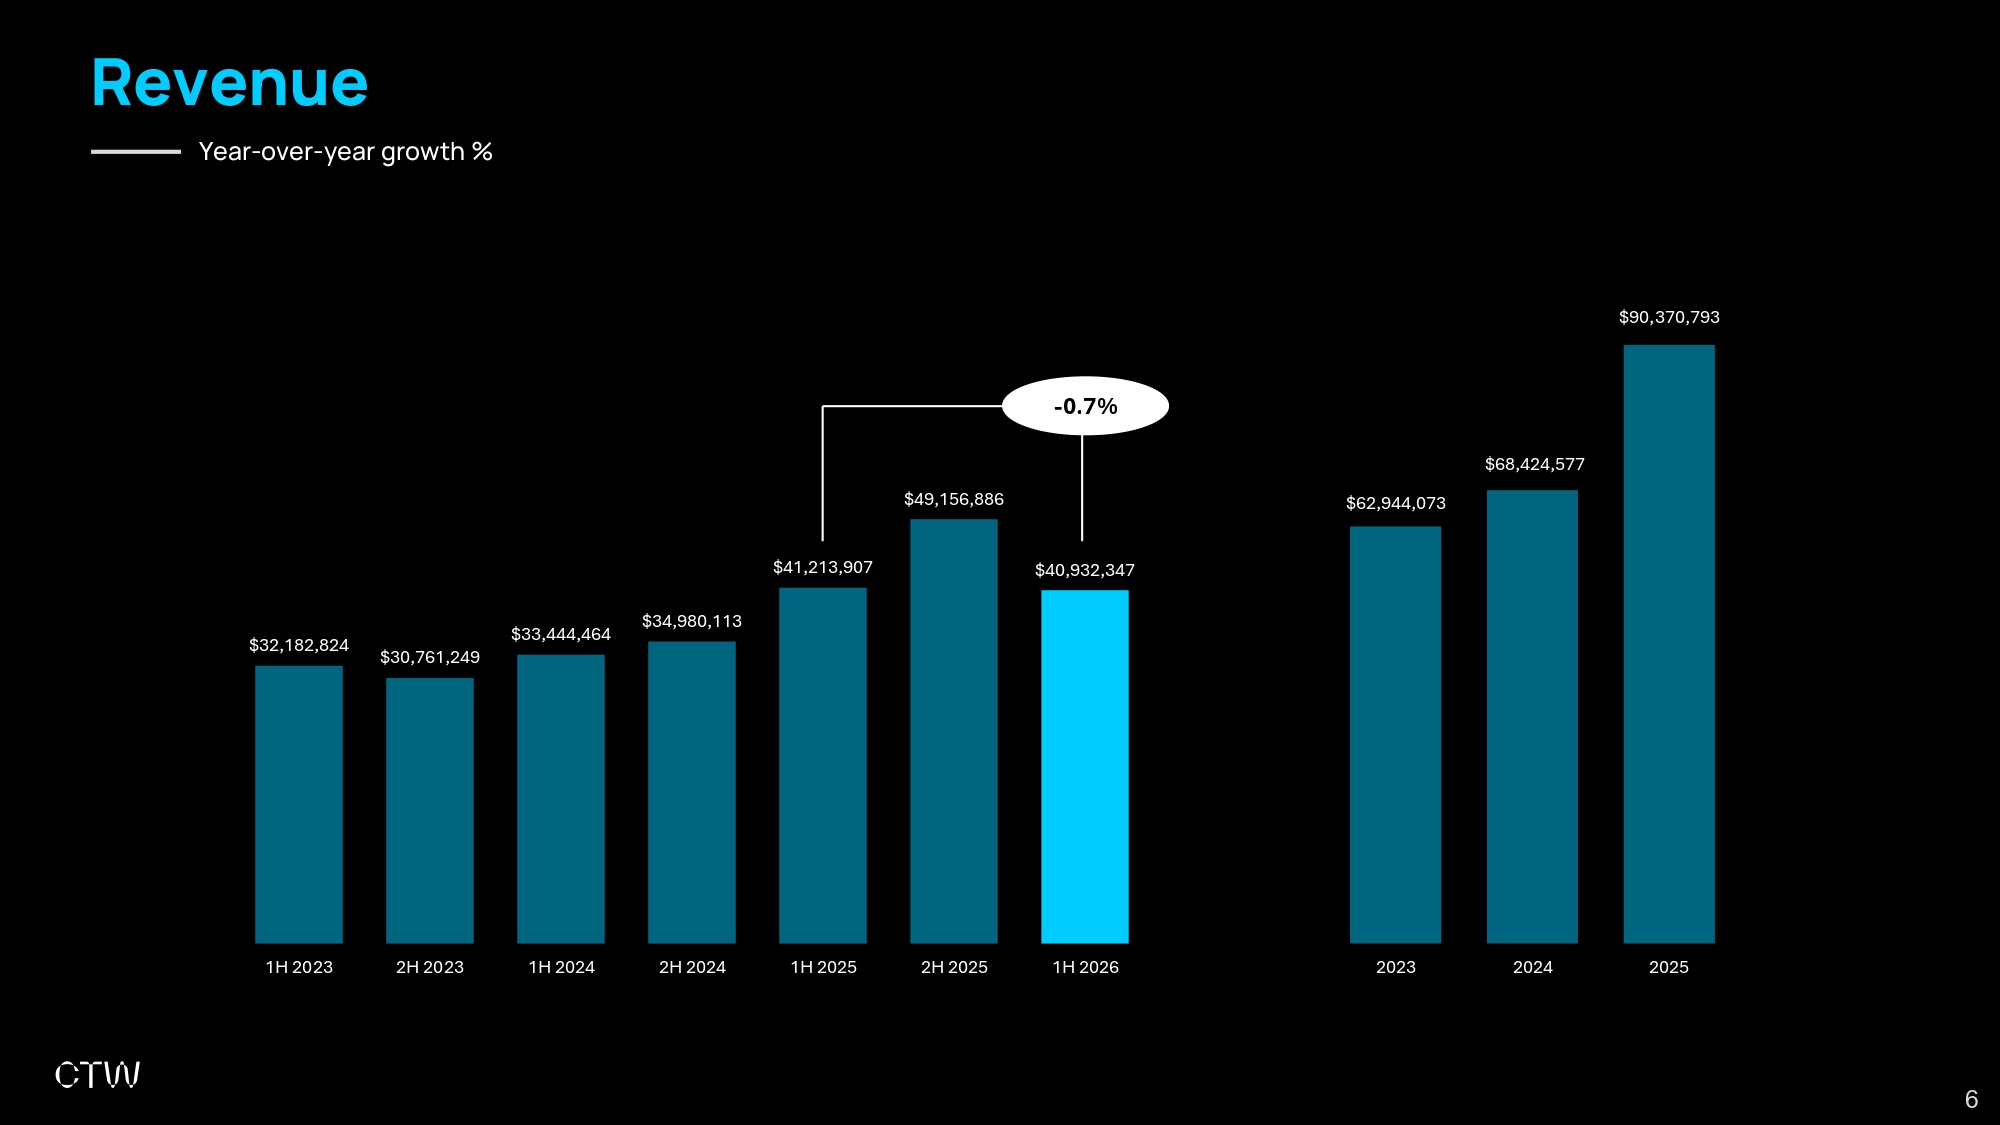
$62,944,073 $68,424,577 $90,370,793 2023 2024 2025 $32,182,824 $30,761,249 $33,444,464 $34,980,113 $41,213,907 $49,156,886 $40,932,347 1H 2023 2H 2023 1H 2024 2H 2024 1H 2025 2H 2025 1H 2026 6 Revenue Year - over - year growth % - 0.7%
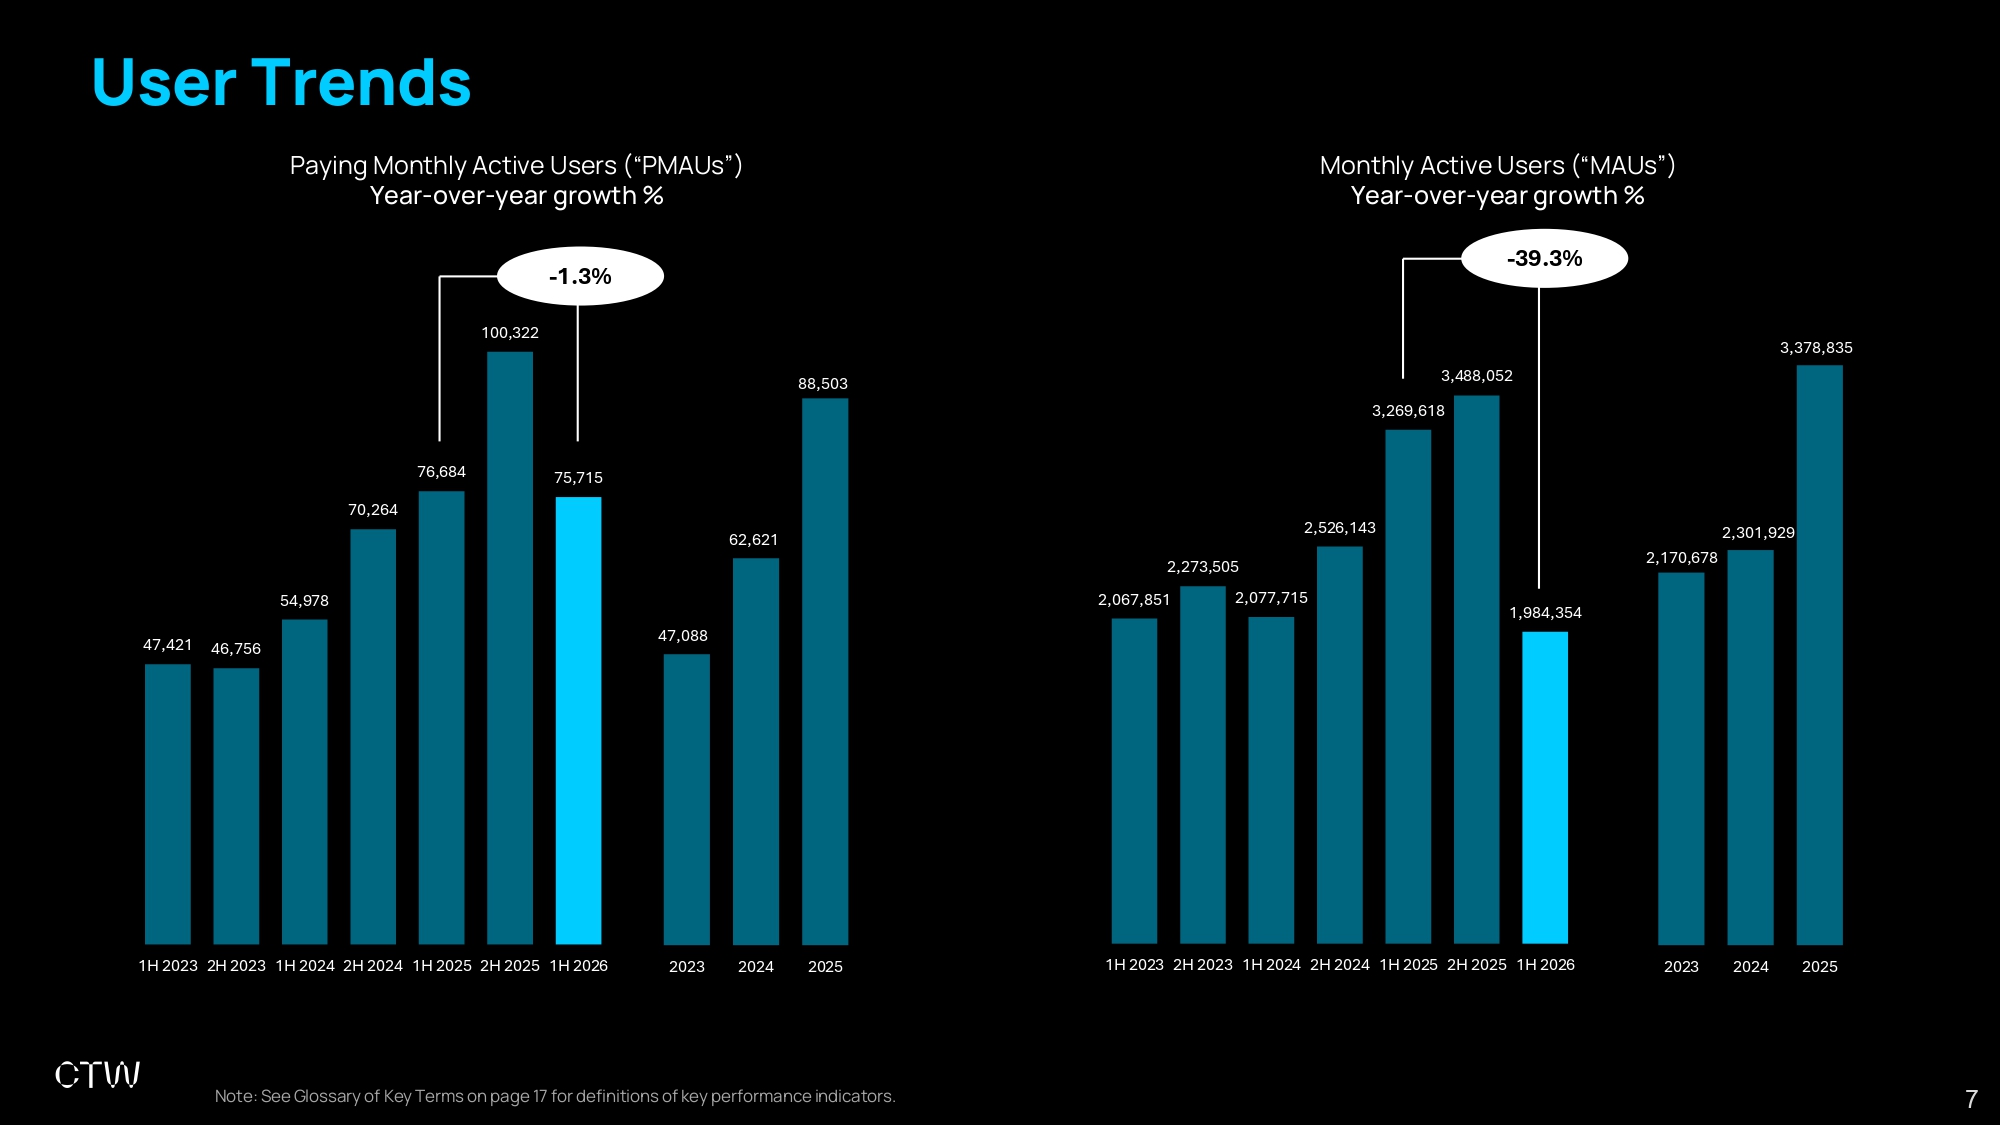
2,170,678 2,301,929 3,378,835 2023 2024 2025 2,067,851 2,273,505 2,077,715 2,526,143 3,269,618 3,488,052 1,984,354 1H 2023 2H 2023 1H 2024 2H 2024 1H 2025 2H 2025 1H 2026 7 User Trends Note: See Glossary of Key Terms on page 17 for definitions of key performance indicators. - 39.3% Paying Monthly Active Users (“PMAUs”) Year - over - year growth % 47,421 46,756 54,978 70,264 76,684 100,322 75,715 1H 2023 2H 2023 1H 2024 2H 2024 1H 2025 2H 2025 1H 2026 - 1.3% 47,088 62,621 88,503 2023 2024 2025 Monthly Active Users (“MAUs”) Year - over - year growth %
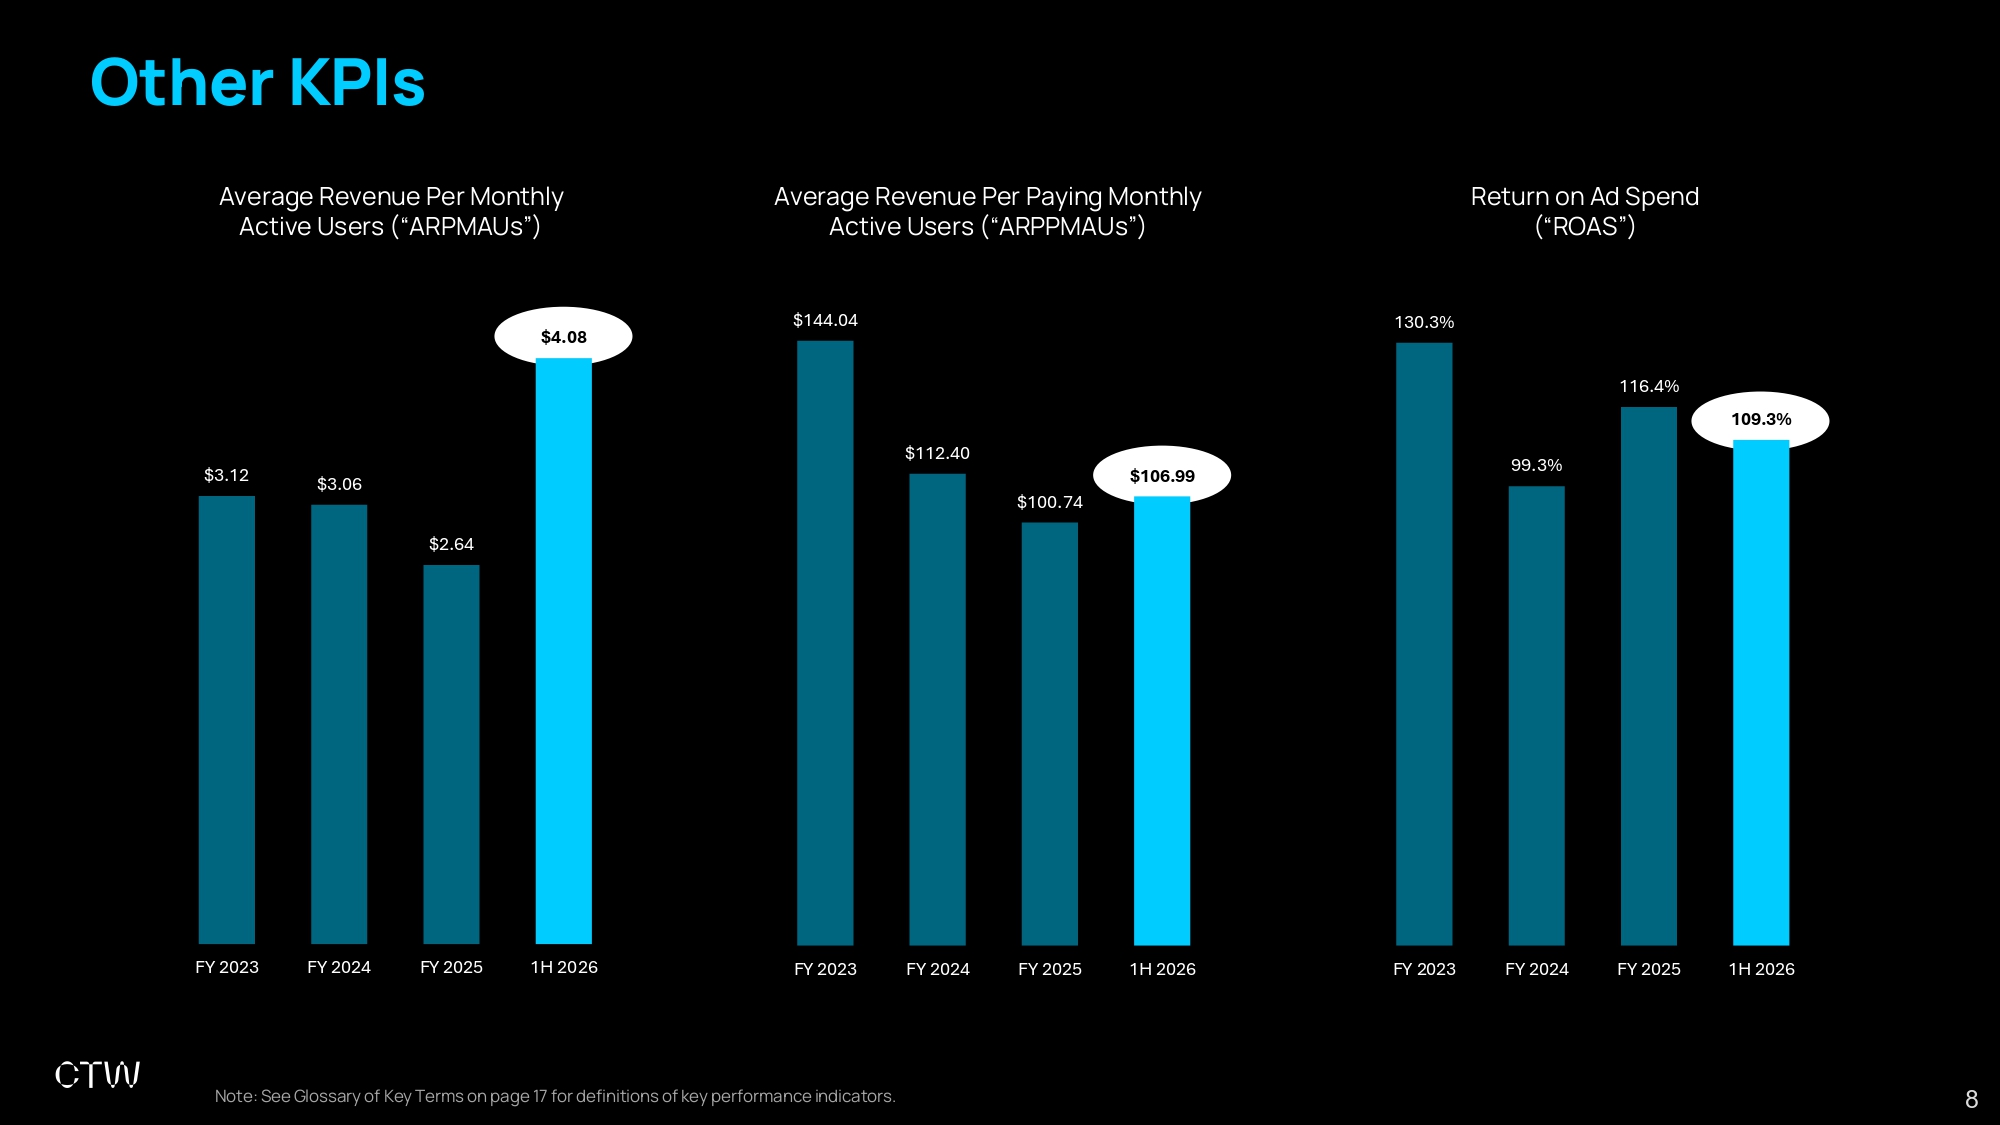
$3.12 $3.06 $2.64 $4.08 FY 2023 FY 2024 FY 2025 1H 2026 $144.04 $112.40 $100.74 $106.99 FY 2023 FY 2024 FY 2025 1H 2026 130.3% 99.3% 116.4% 109.3% FY 2023 FY 2024 FY 2025 1H 2026 8 Other KPIs Average Revenue Per Monthly Active Users (“ARPMAUs”) Average Revenue Per Paying Monthly Active Users (“ARPPMAUs”) Return on Ad Spend (“ROAS”) Note: See Glossary of Key Terms on page 17 for definitions of key performance indicators.
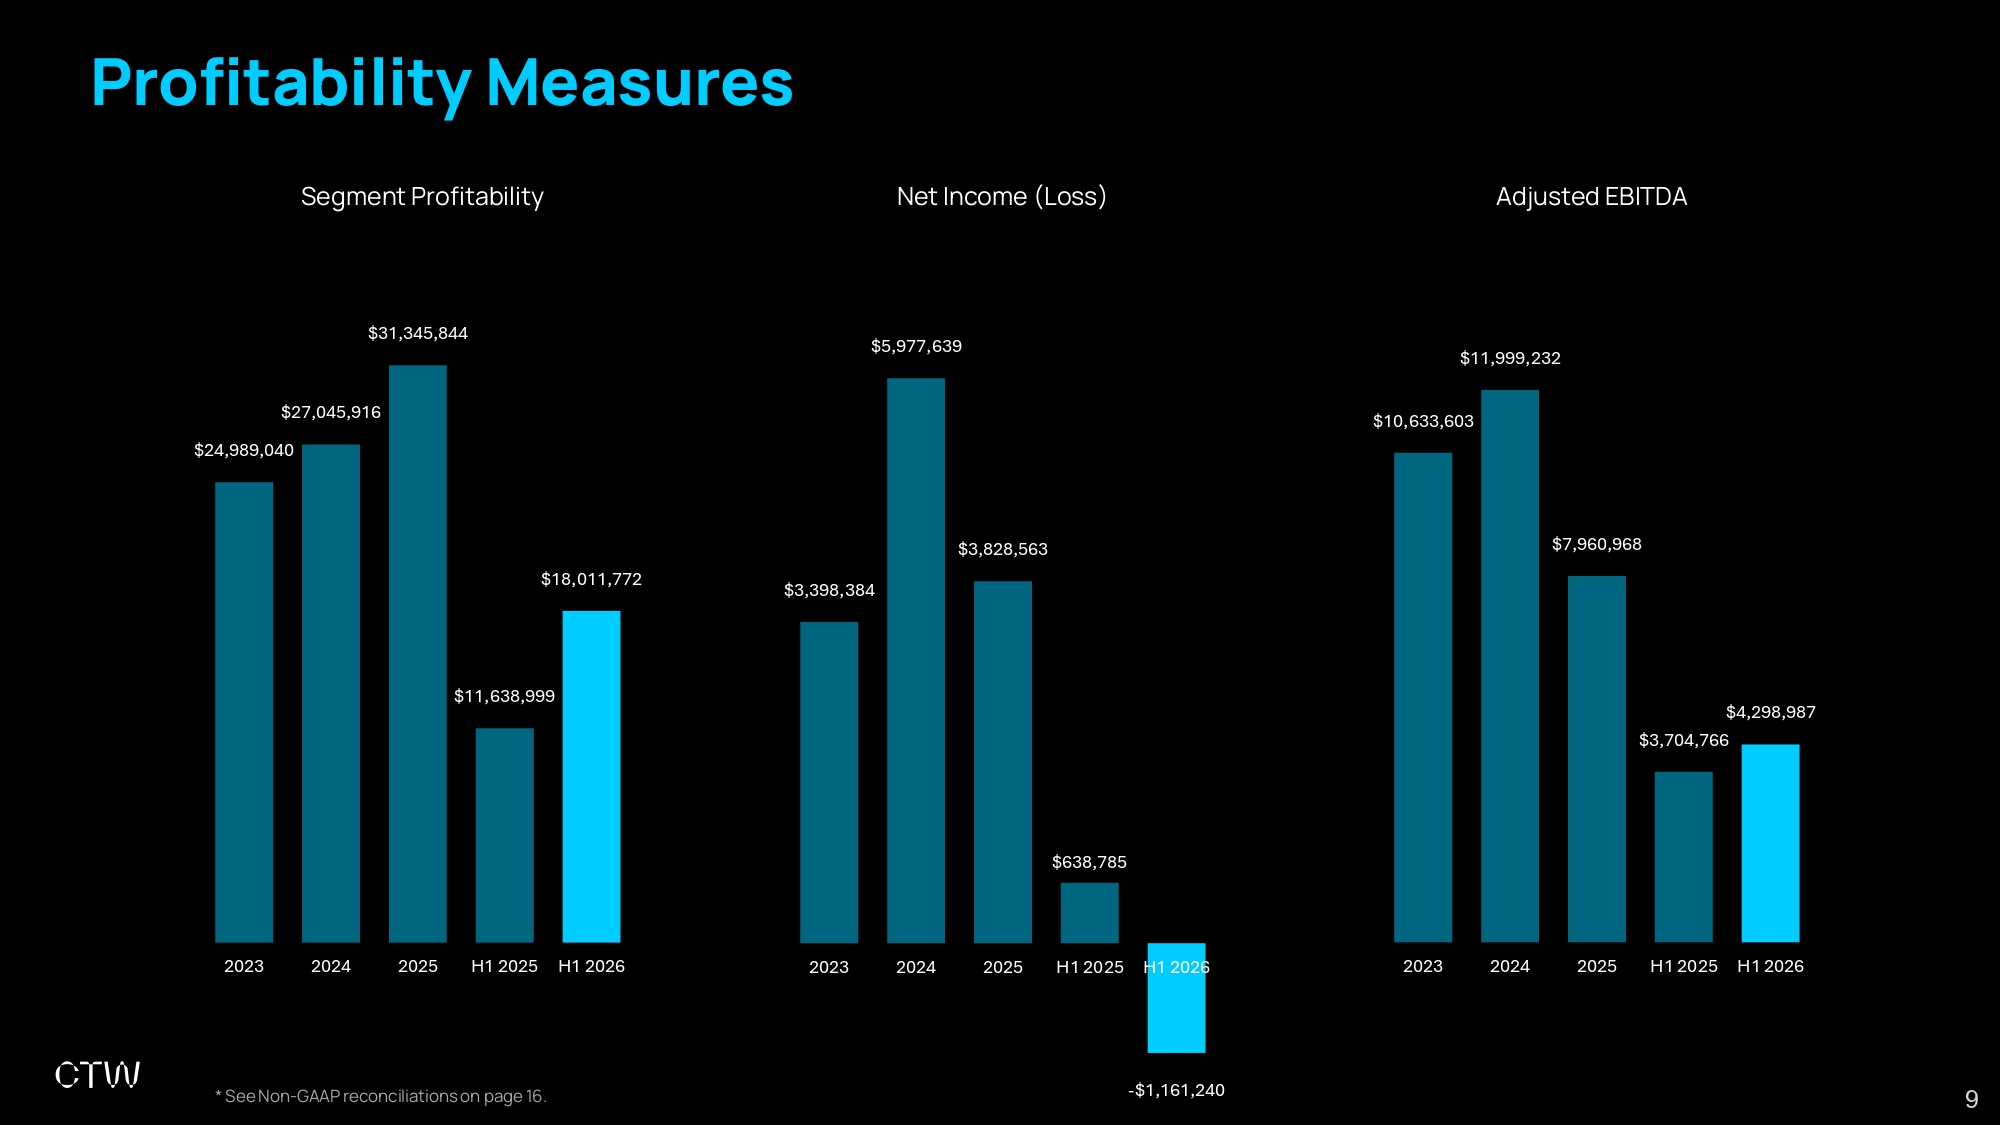
9 Profitability Measures Segment Profitability Adjusted EBITDA Net Income (Loss) * See Non - GAAP reconciliations on page 16. $24,989,040 $27,045,916 $31,345,844 $11,638,999 $18,011,772 2023 2024 2025 H1 2025 H1 2026 $3,398,384 $5,977,639 $3,828,563 $638,785 - $1,161,240 2023 2024 2025 H1 2025 H1 2026 $10,633,603 $11,999,232 $7,960,968 $3,704,766 $4,298,987 2023 2024 2025 H1 2025 H1 2026

Trended Financial Statements and Reconciliations from GAAP to Non - GAAP 10
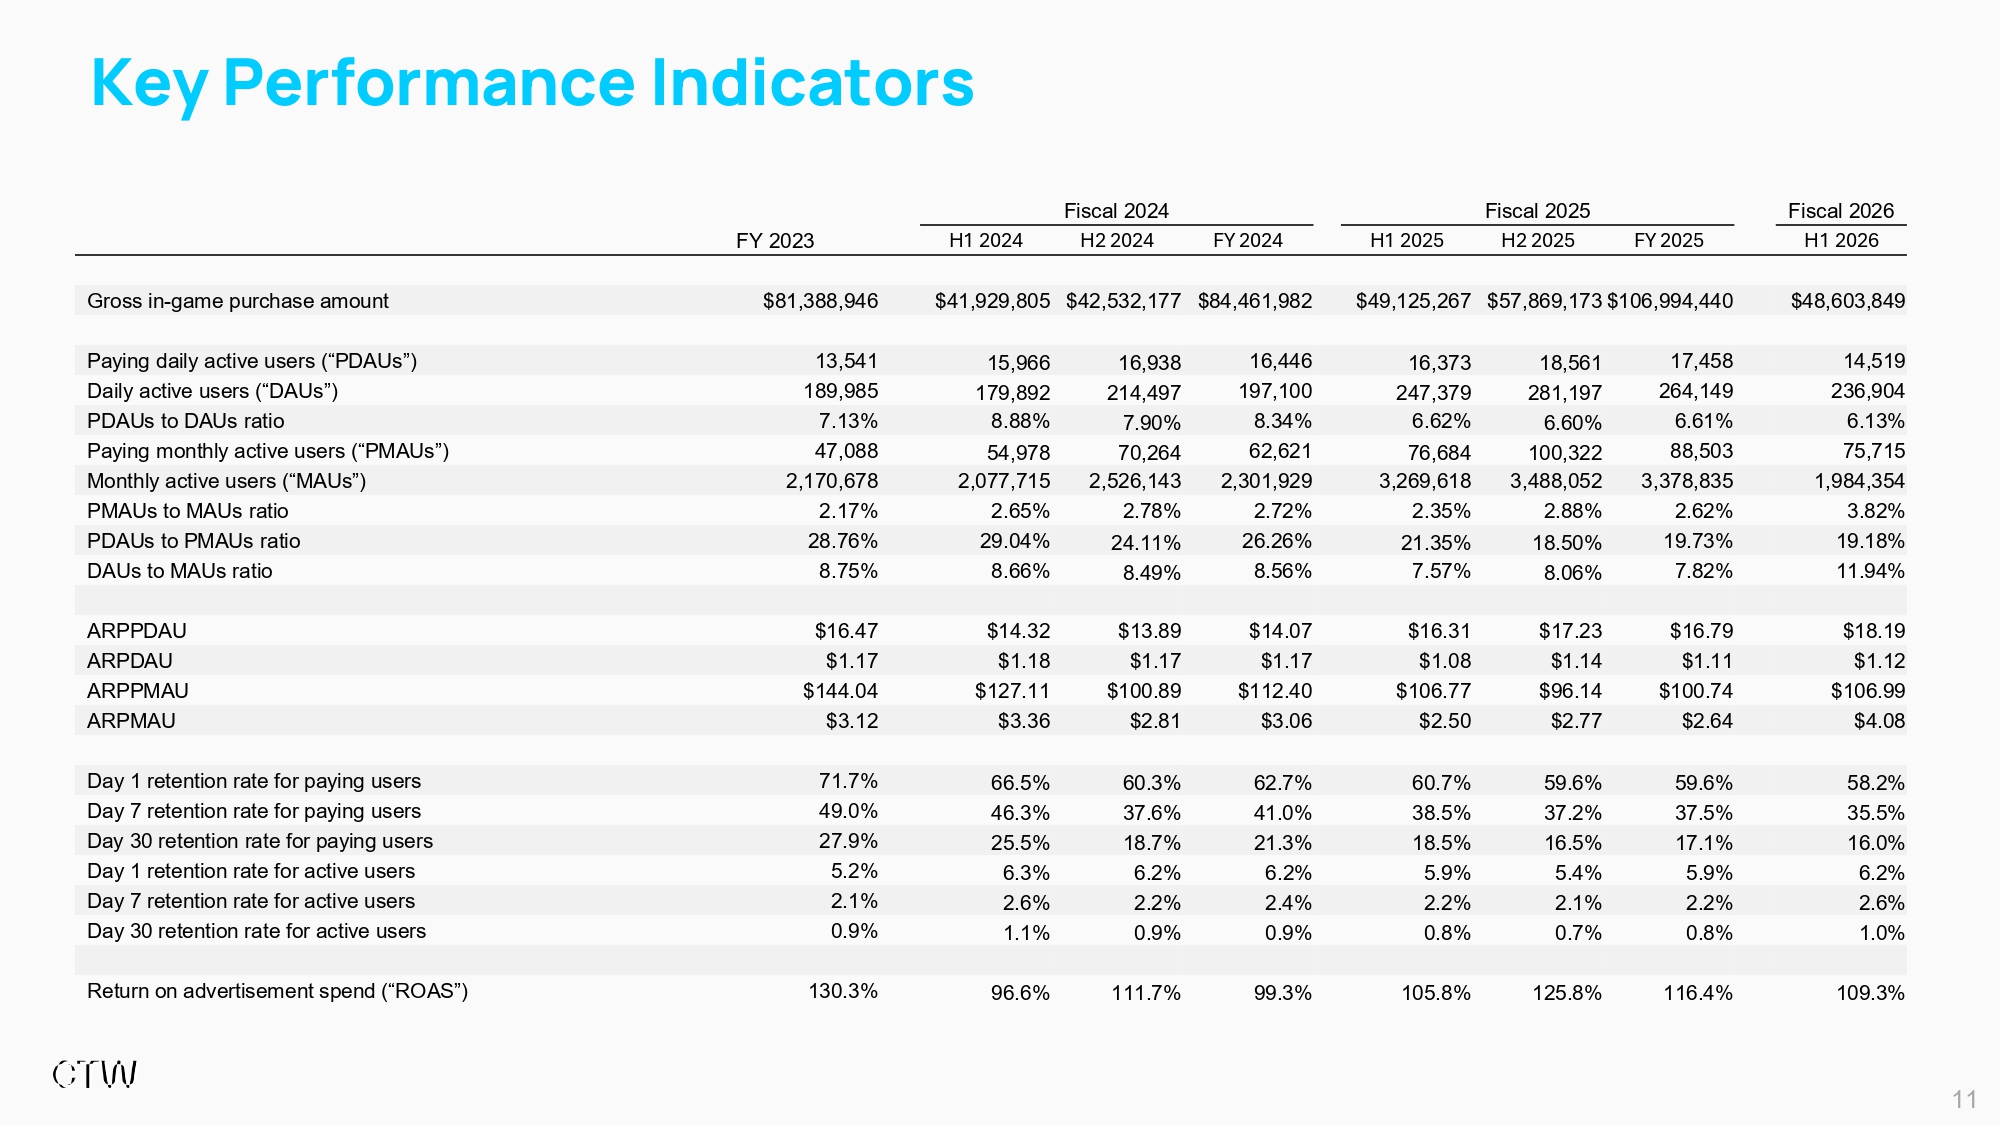
11 Key Performance Indicators Fiscal 2024 Fiscal 2025 Fiscal 2026 FY 2023 H1 2024 H2 2024 FY 2024 H1 2025 H2 2025 FY 2025 H1 2026 Gross in - game purchase amount $81,388,946 $41,929,805 $42,532,177 $84,461,982 $49,125,267 $57,869,173 $106,994,440 $48,603,849 Paying daily active users (“PDAUs”) 13,541 15,966 16,938 16,446 16,373 18,561 17,458 14,519 Daily active users (“DAUs”) 189,985 179,892 214,497 197,100 247,379 281,197 264,149 236,904 PDAUs to DAUs ratio 7.13% 8.88% 7.90% 8.34% 6.62% 6.60% 6.61% 6.13% Paying monthly active users (“PMAUs”) 47,088 54,978 70,264 62,621 76,684 100,322 88,503 75,715 Monthly active users (“MAUs”) 2,170,678 2,077,715 2,526,143 2,301,929 3,269,618 3,488,052 3,378,835 1,984,354 PMAUs to MAUs ratio 2.17% 2.65% 2.78% 2.72% 2.35% 2.88% 2.62% 3.82% PDAUs to PMAUs ratio 28.76% 29.04% 24.11% 26.26% 21.35% 18.50% 19.73% 19.18% DAUs to MAUs ratio 8.75% 8.66% 8.49% 8.56% 7.57% 8.06% 7.82% 11.94% ARPPDAU $16.47 $14.32 $13.89 $14.07 $16.31 $17.23 $16.79 $18.19 ARPDAU $1.17 $1.18 $1.17 $1.17 $1.08 $1.14 $1.11 $1.12 ARPPMAU $144.04 $127.11 $100.89 $112.40 $106.77 $96.14 $100.74 $106.99 ARPMAU $3.12 $3.36 $2.81 $3.06 $2.50 $2.77 $2.64 $4.08 Day 1 retention rate for paying users 71.7% 66.5% 60.3% 62.7% 60.7% 59.6% 59.6% 58.2% Day 7 retention rate for paying users 49.0% 46.3% 37.6% 41.0% 38.5% 37.2% 37.5% 35.5% Day 30 retention rate for paying users 27.9% 25.5% 18.7% 21.3% 18.5% 16.5% 17.1% 16.0% Day 1 retention rate for active users 5.2% 6.3% 6.2% 6.2% 5.9% 5.4% 5.9% 6.2% Day 7 retention rate for active users 2.1% 2.6% 2.2% 2.4% 2.2% 2.1% 2.2% 2.6% Day 30 retention rate for active users 0.9% 1.1% 0.9% 0.9% 0.8% 0.7% 0.8% 1.0% Return on advertisement spend (“ROAS”) 130.3% 96.6% 111.7% 99.3% 105.8% 125.8% 116.4% 109.3%
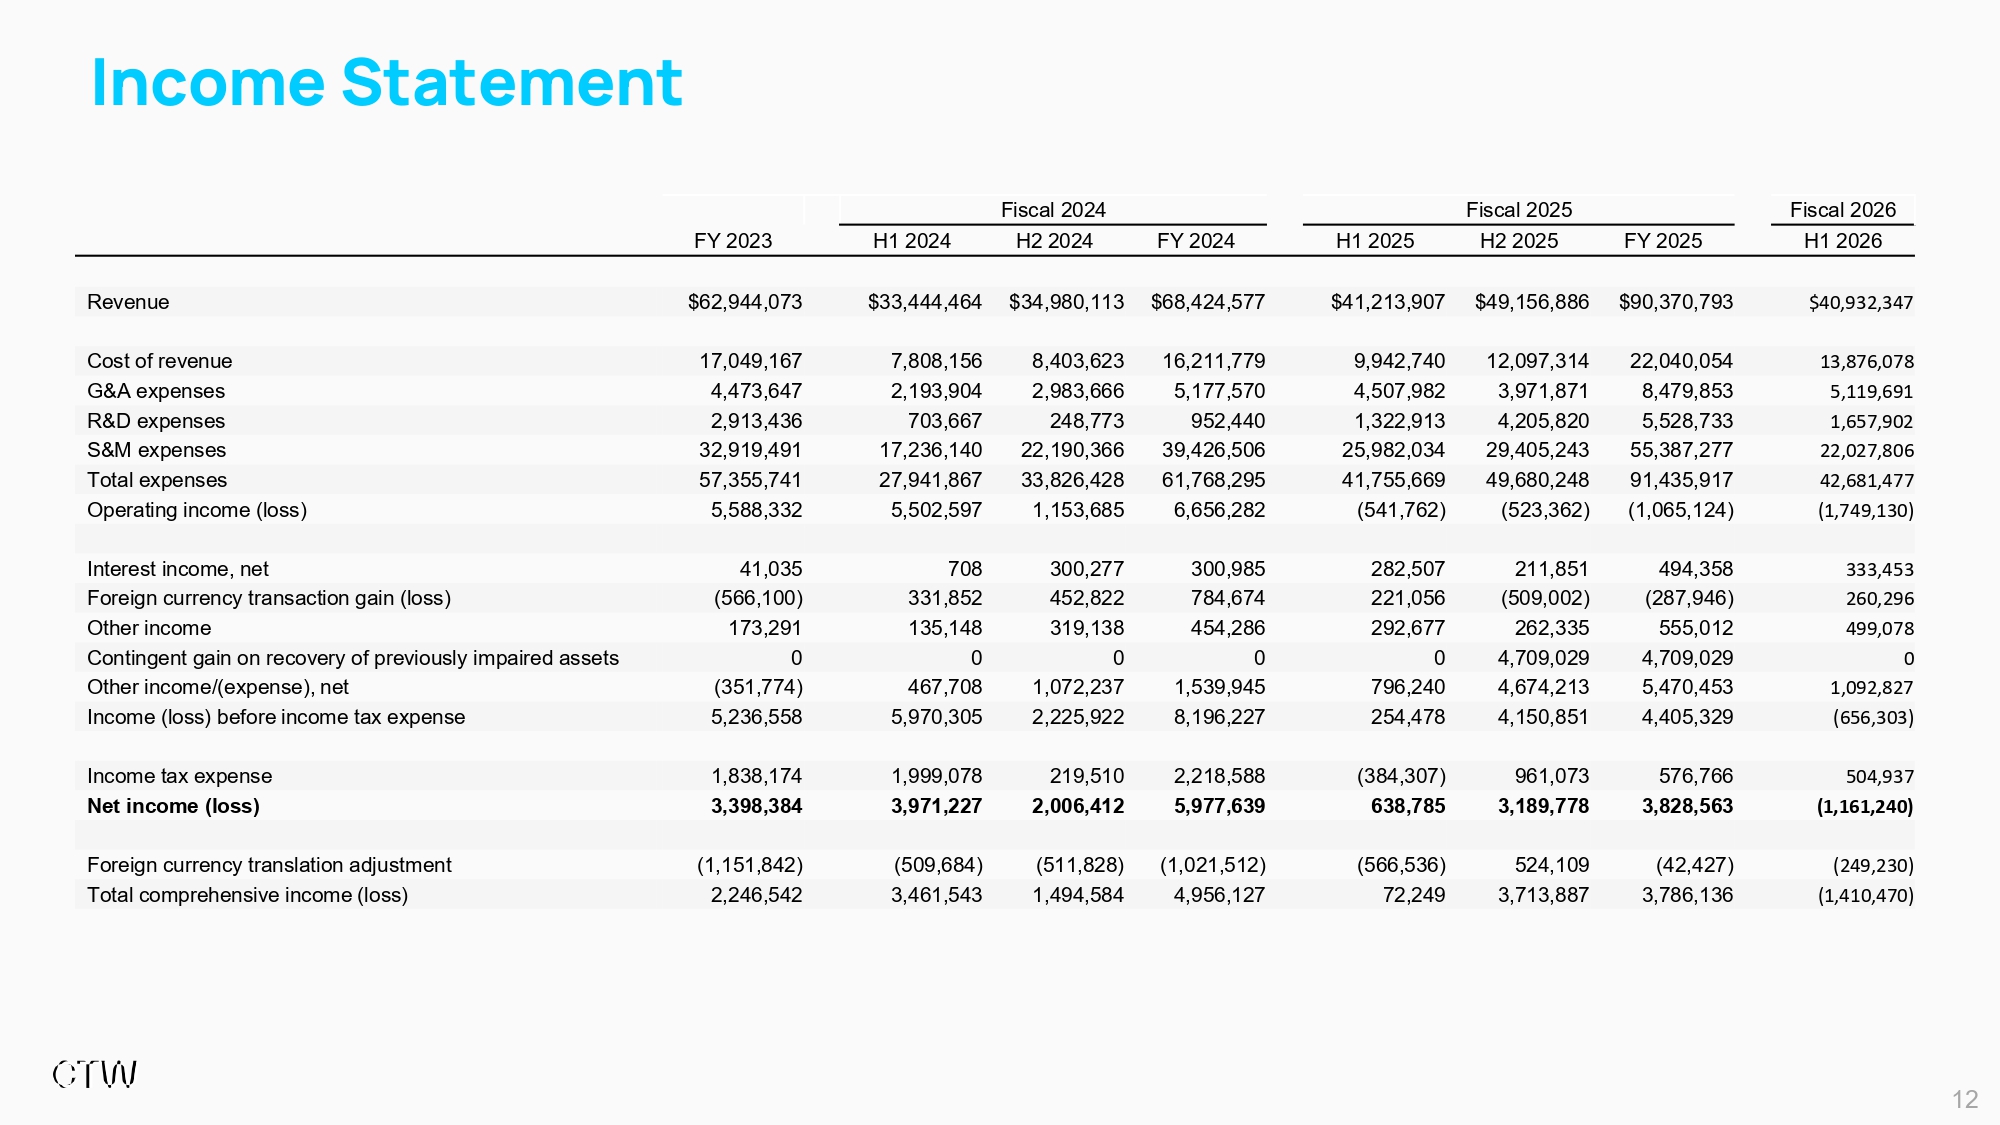
12 Income Statement Fiscal 2024 Fiscal 2025 Fiscal 2026 FY 2023 H1 2024 H2 2024 FY 2024 H1 2025 H2 2025 FY 2025 H1 2026 Revenue $62,944,073 $33,444,464 $34,980,113 $68,424,577 $41,213,907 $49,156,886 $90,370,793 $40,932,347 Cost of revenue 17,049,167 7,808,156 8,403,623 16,211,779 9,942,740 12,097,314 22,040,054 13,876,078 G&A expenses 4,473,647 2,193,904 2,983,666 5,177,570 4,507,982 3,971,871 8,479,853 5,119,691 R&D expenses 2,913,436 703,667 248,773 952,440 1,322,913 4,205,820 5,528,733 1,657,902 S&M expenses 32,919,491 17,236,140 22,190,366 39,426,506 25,982,034 29,405,243 55,387,277 22,027,806 Total expenses 57,355,741 27,941,867 33,826,428 61,768,295 41,755,669 49,680,248 91,435,917 42,681,477 Operating income (loss) 5,588,332 5,502,597 1,153,685 6,656,282 (541,762) (523,362) (1,065,124) (1,749,130) Interest income, net 41,035 708 300,277 300,985 282,507 211,851 494,358 333,453 Foreign currency transaction gain (loss) (566,100) 331,852 452,822 784,674 221,056 (509,002) (287,946) 260,296 Other income 173,291 135,148 319,138 454,286 292,677 262,335 555,012 499,078 Contingent gain on recovery of previously impaired assets 0 0 0 0 0 4,709,029 4,709,029 0 Other income/(expense), net (351,774) 467,708 1,072,237 1,539,945 796,240 4,674,213 5,470,453 1,092,827 Income (loss) before income tax expense 5,236,558 5,970,305 2,225,922 8,196,227 254,478 4,150,851 4,405,329 (656,303) Income tax expense 1,838,174 1,999,078 219,510 2,218,588 (384,307) 961,073 576,766 504,937 Net income (loss) 3,398,384 3,971,227 2,006,412 5,977,639 638,785 3,189,778 3,828,563 (1,161,240) Foreign currency translation adjustment (1,151,842) (509,684) (511,828) (1,021,512) (566,536) 524,109 (42,427) (249,230) Total comprehensive income (loss) 2,246,542 3,461,543 1,494,584 4,956,127 72,249 3,713,887 3,786,136 (1,410,470)
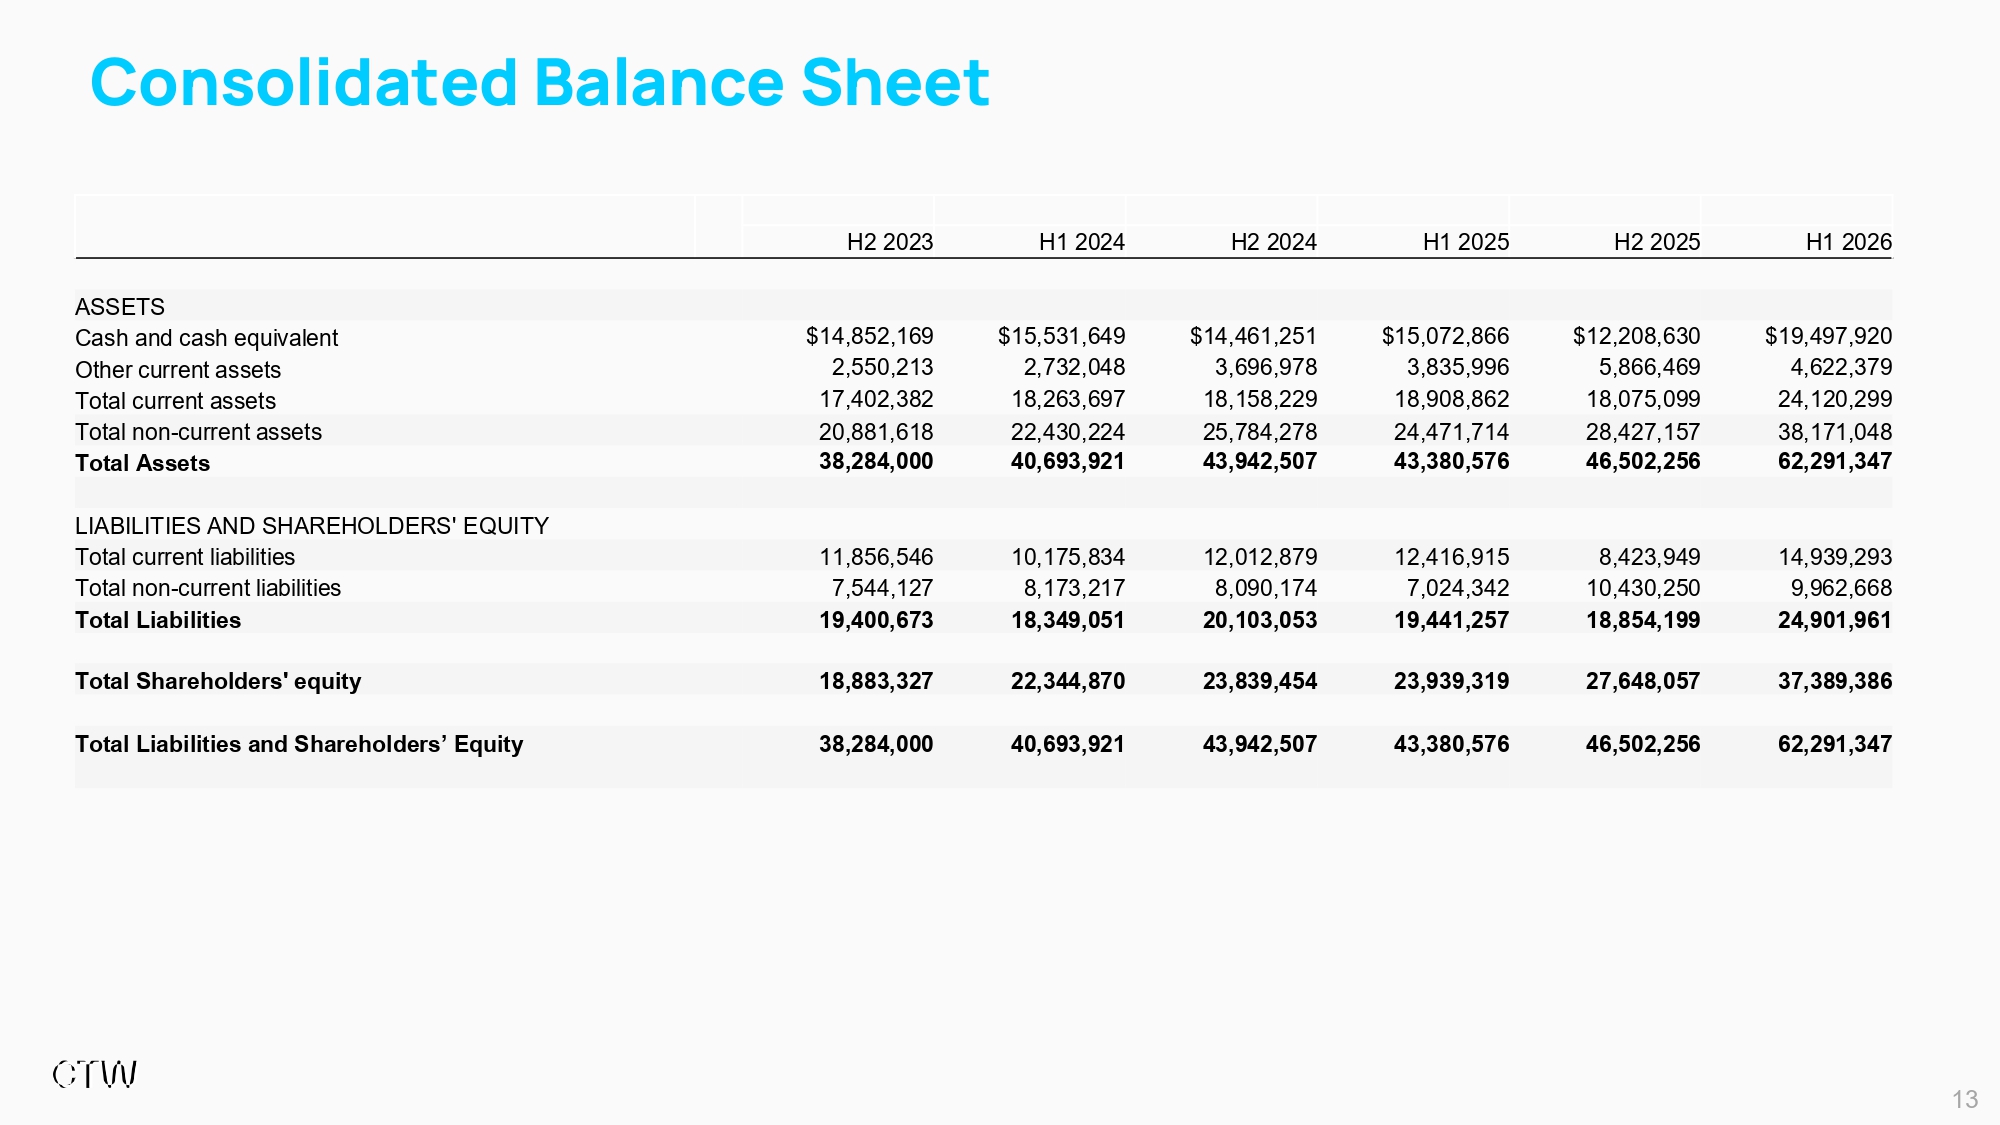
13 Consolidated Balance Sheet H2 2023 H1 2024 H2 2024 H1 2025 H2 2025 H1 2026 ASSETS Cash and cash equivalent $14,852,169 $15,531,649 $14,461,251 $15,072,866 $12,208,630 $19,497,920 Other current assets 2,550,213 2,732,048 3,696,978 3,835,996 5,866,469 4,622,379 Total current assets 17,402,382 18,263,697 18,158,229 18,908,862 18,075,099 24,120,299 Total non - current assets 20,881,618 22,430,224 25,784,278 24,471,714 28,427,157 38,171,048 Total Assets 38,284,000 40,693,921 43,942,507 43,380,576 46,502,256 62,291,347 LIABILITIES AND SHAREHOLDERS' EQUITY Total current liabilities 11,856,546 10,175,834 12,012,879 12,416,915 8,423,949 14,939,293 Total non - current liabilities 7,544,127 8,173,217 8,090,174 7,024,342 10,430,250 9,962,668 Total Liabilities 19,400,673 18,349,051 20,103,053 19,441,257 18,854,199 24,901,961 Total Shareholders' equity 18,883,327 22,344,870 23,839,454 23,939,319 27,648,057 37,389,386 Total Liabilities and Shareholders’ Equity 38,284,000 40,693,921 43,942,507 43,380,576 46,502,256 62,291,347
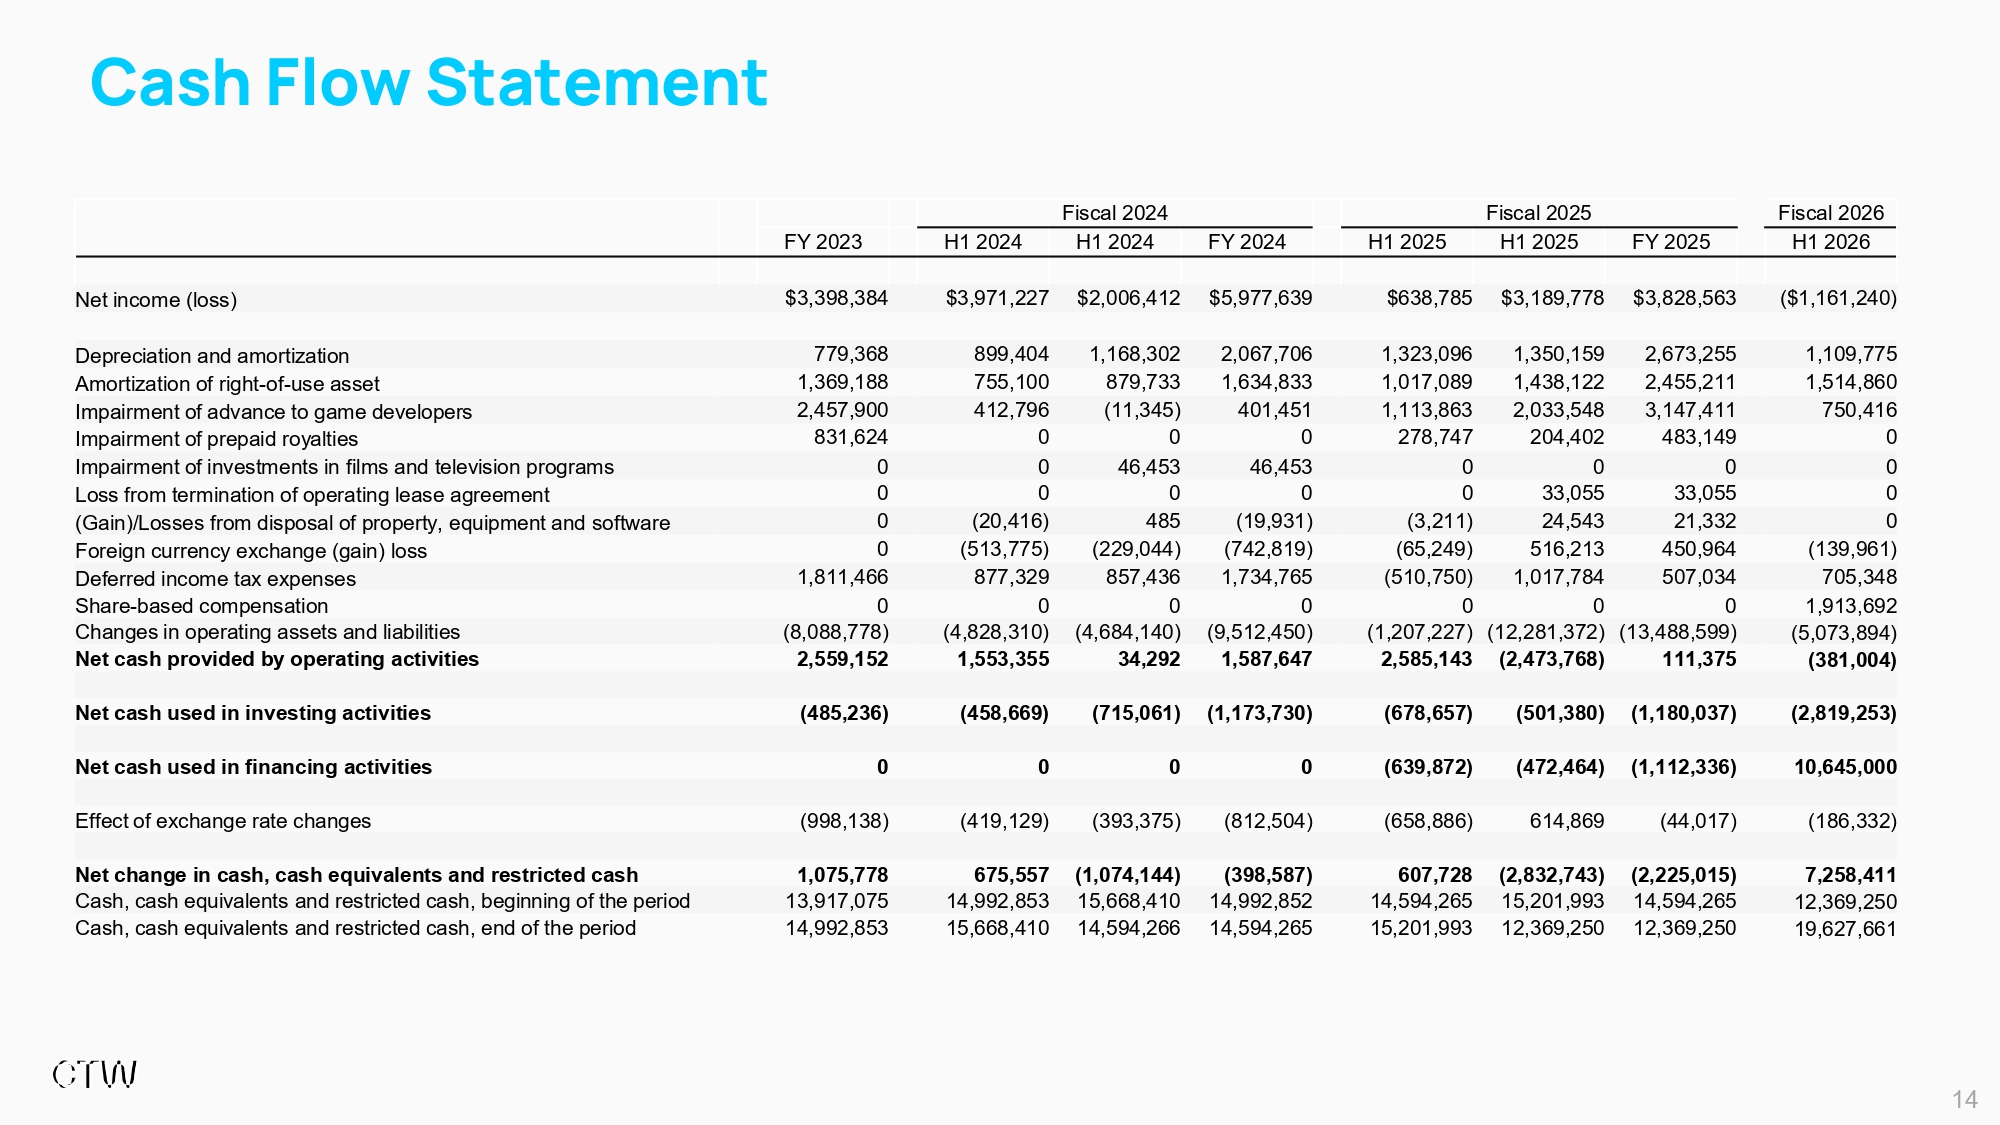
14 Cash Flow Statement Fiscal 2024 Fiscal 2025 Fiscal 2026 FY 2023 H1 2024 H1 2024 FY 2024 H1 2025 H1 2025 FY 2025 H1 2026 Net income (loss) $3,398,384 $3,971,227 $2,006,412 $5,977,639 $638,785 $3,189,778 $3,828,563 ($1,161,240) Depreciation and amortization 779,368 899,404 1,168,302 2,067,706 1,323,096 1,350,159 2,673,255 1,109,775 Amortization of right - of - use asset 1,369,188 755,100 879,733 1,634,833 1,017,089 1,438,122 2,455,211 1,514,860 Impairment of advance to game developers 2,457,900 412,796 (11,345) 401,451 1,113,863 2,033,548 3,147,411 750,416 Impairment of prepaid royalties 831,624 0 0 0 278,747 204,402 483,149 0 Impairment of investments in films and television programs 0 0 46,453 46,453 0 0 0 0 Loss from termination of operating lease agreement 0 0 0 0 0 33,055 33,055 0 (Gain)/Losses from disposal of property, equipment and software 0 (20,416) 485 (19,931) (3,211) 24,543 21,332 0 Foreign currency exchange (gain) loss 0 (513,775) (229,044) (742,819) (65,249) 516,213 450,964 (139,961) Deferred income tax expenses 1,811,466 877,329 857,436 1,734,765 (510,750) 1,017,784 507,034 705,348 Share - based compensation 0 0 0 0 0 0 0 1,913,692 Changes in operating assets and liabilities (8,088,778) (4,828,310) (4,684,140) (9,512,450) (1,207,227) (12,281,372) (13,488,599) (5,073,894) Net cash provided by operating activities 2,559,152 1,553,355 34,292 1,587,647 2,585,143 (2,473,768) 111,375 (381,004) Net cash used in investing activities (485,236) (458,669) (715,061) (1,173,730) (678,657) (501,380) (1,180,037) (2,819,253) Net cash used in financing activities 0 0 0 0 (639,872) (472,464) (1,112,336) 10,645,000 Effect of exchange rate changes (998,138) (419,129) (393,375) (812,504) (658,886) 614,869 (44,017) (186,332) Net change in cash, cash equivalents and restricted cash 1,075,778 675,557 (1,074,144) (398,587) 607,728 (2,832,743) (2,225,015) 7,258,411 Cash, cash equivalents and restricted cash, beginning of the period 13,917,075 14,992,853 15,668,410 14,992,852 14,594,265 15,201,993 14,594,265 12,369,250 Cash, cash equivalents and restricted cash, end of the period 14,992,853 15,668,410 14,594,266 14,594,265 15,201,993 12,369,250 12,369,250 19,627,661
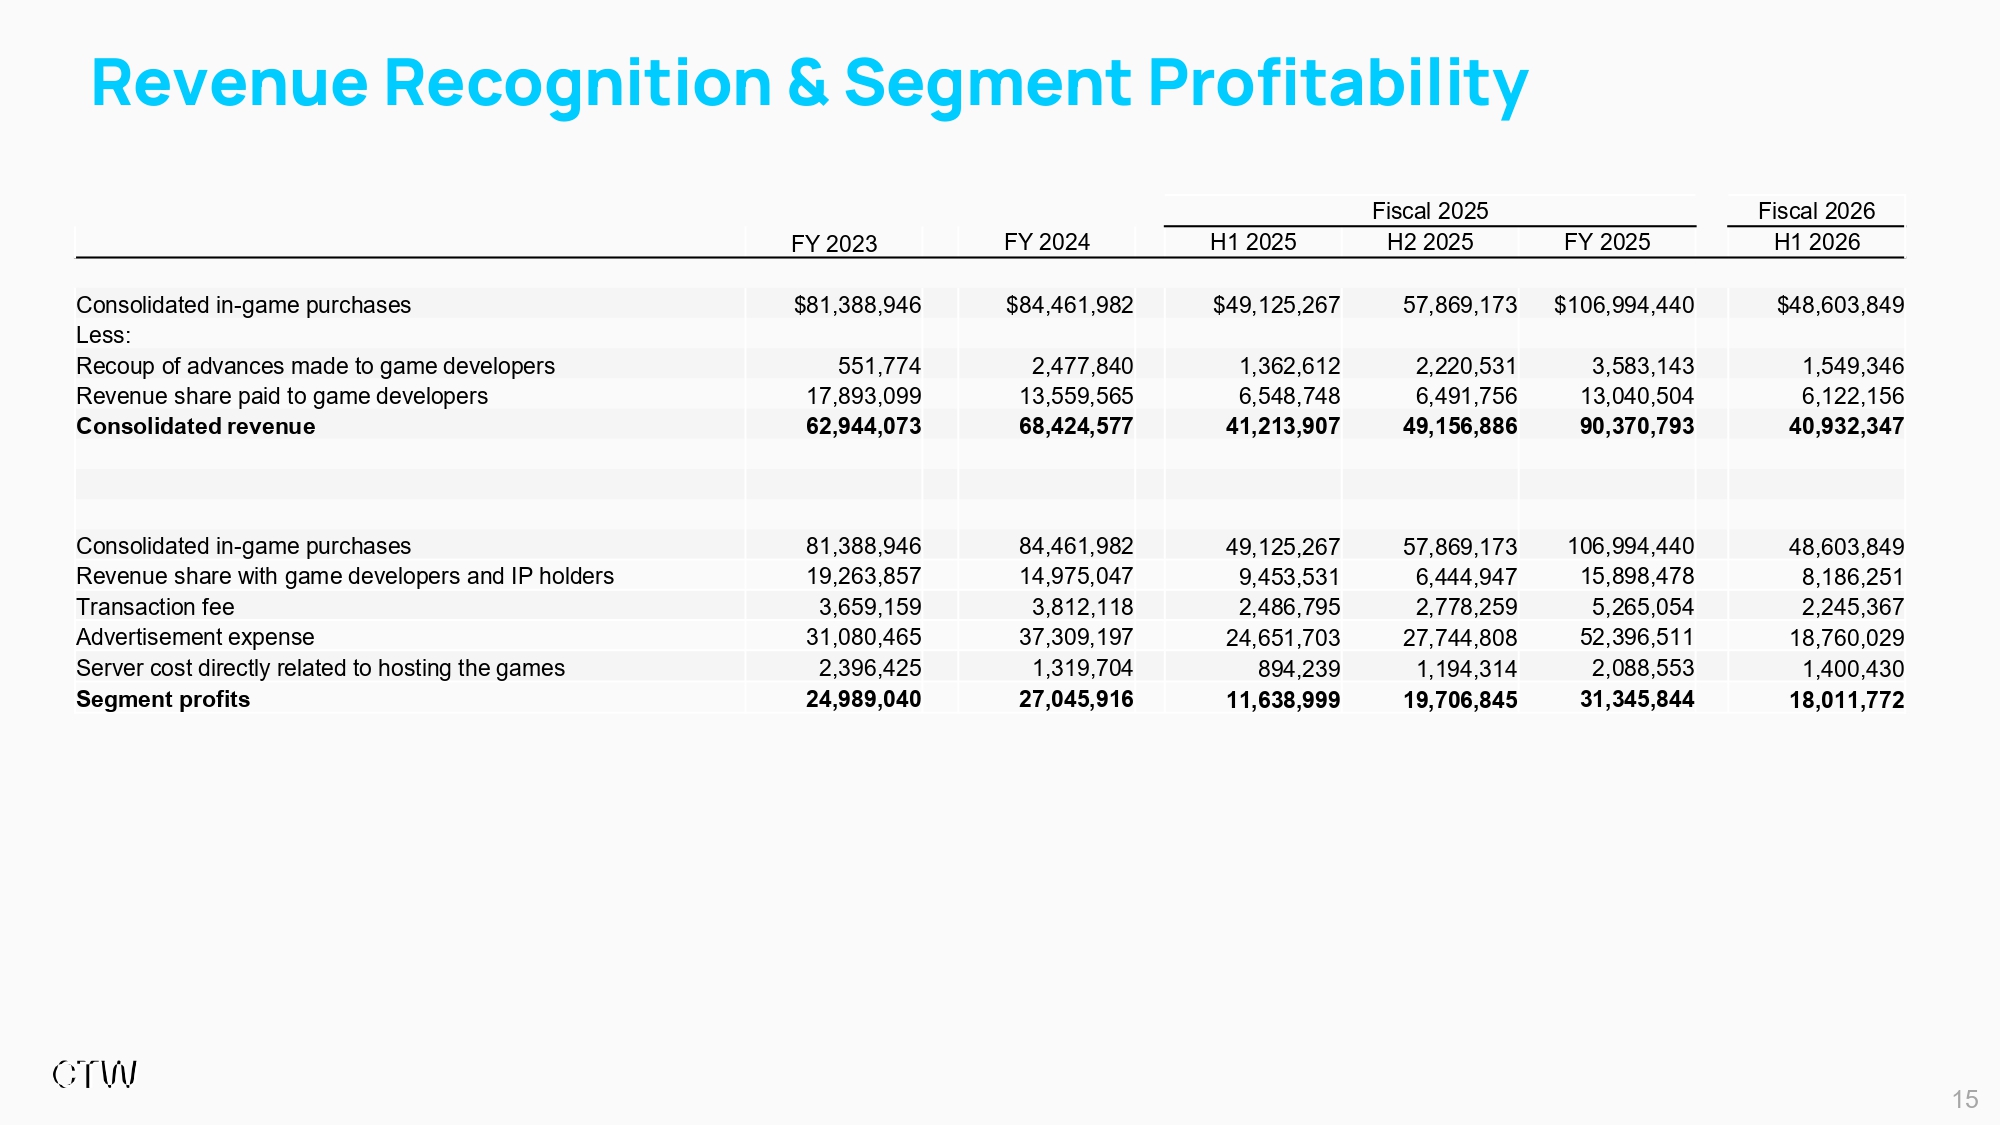
15 Revenue Recognition & Segment Profitability Fiscal 2025 Fiscal 2026 FY 2023 FY 2024 H1 2025 H2 2025 FY 2025 H1 2026 Consolidated in - game purchases $81,388,946 $84,461,982 $49,125,267 57,869,173 $106,994,440 $48,603,849 Less: Recoup of advances made to game developers 551,774 2,477,840 1,362,612 2,220,531 3,583,143 1,549,346 Revenue share paid to game developers 17,893,099 13,559,565 6,548,748 6,491,756 13,040,504 6,122,156 Consolidated revenue 62,944,073 68,424,577 41,213,907 49,156,886 90,370,793 40,932,347 Consolidated in - game purchases 81,388,946 84,461,982 49,125,267 57,869,173 106,994,440 48,603,849 Revenue share with game developers and IP holders 19,263,857 14,975,047 9,453,531 6,444,947 15,898,478 8,186,251 Transaction fee 3,659,159 3,812,118 2,486,795 2,778,259 5,265,054 2,245,367 Advertisement expense 31,080,465 37,309,197 24,651,703 27,744,808 52,396,511 18,760,029 Server cost directly related to hosting the games 2,396,425 1,319,704 894,239 1,194,314 2,088,553 1,400,430 Segment profits 24,989,040 27,045,916 11,638,999 19,706,845 31,345,844 18,011,772
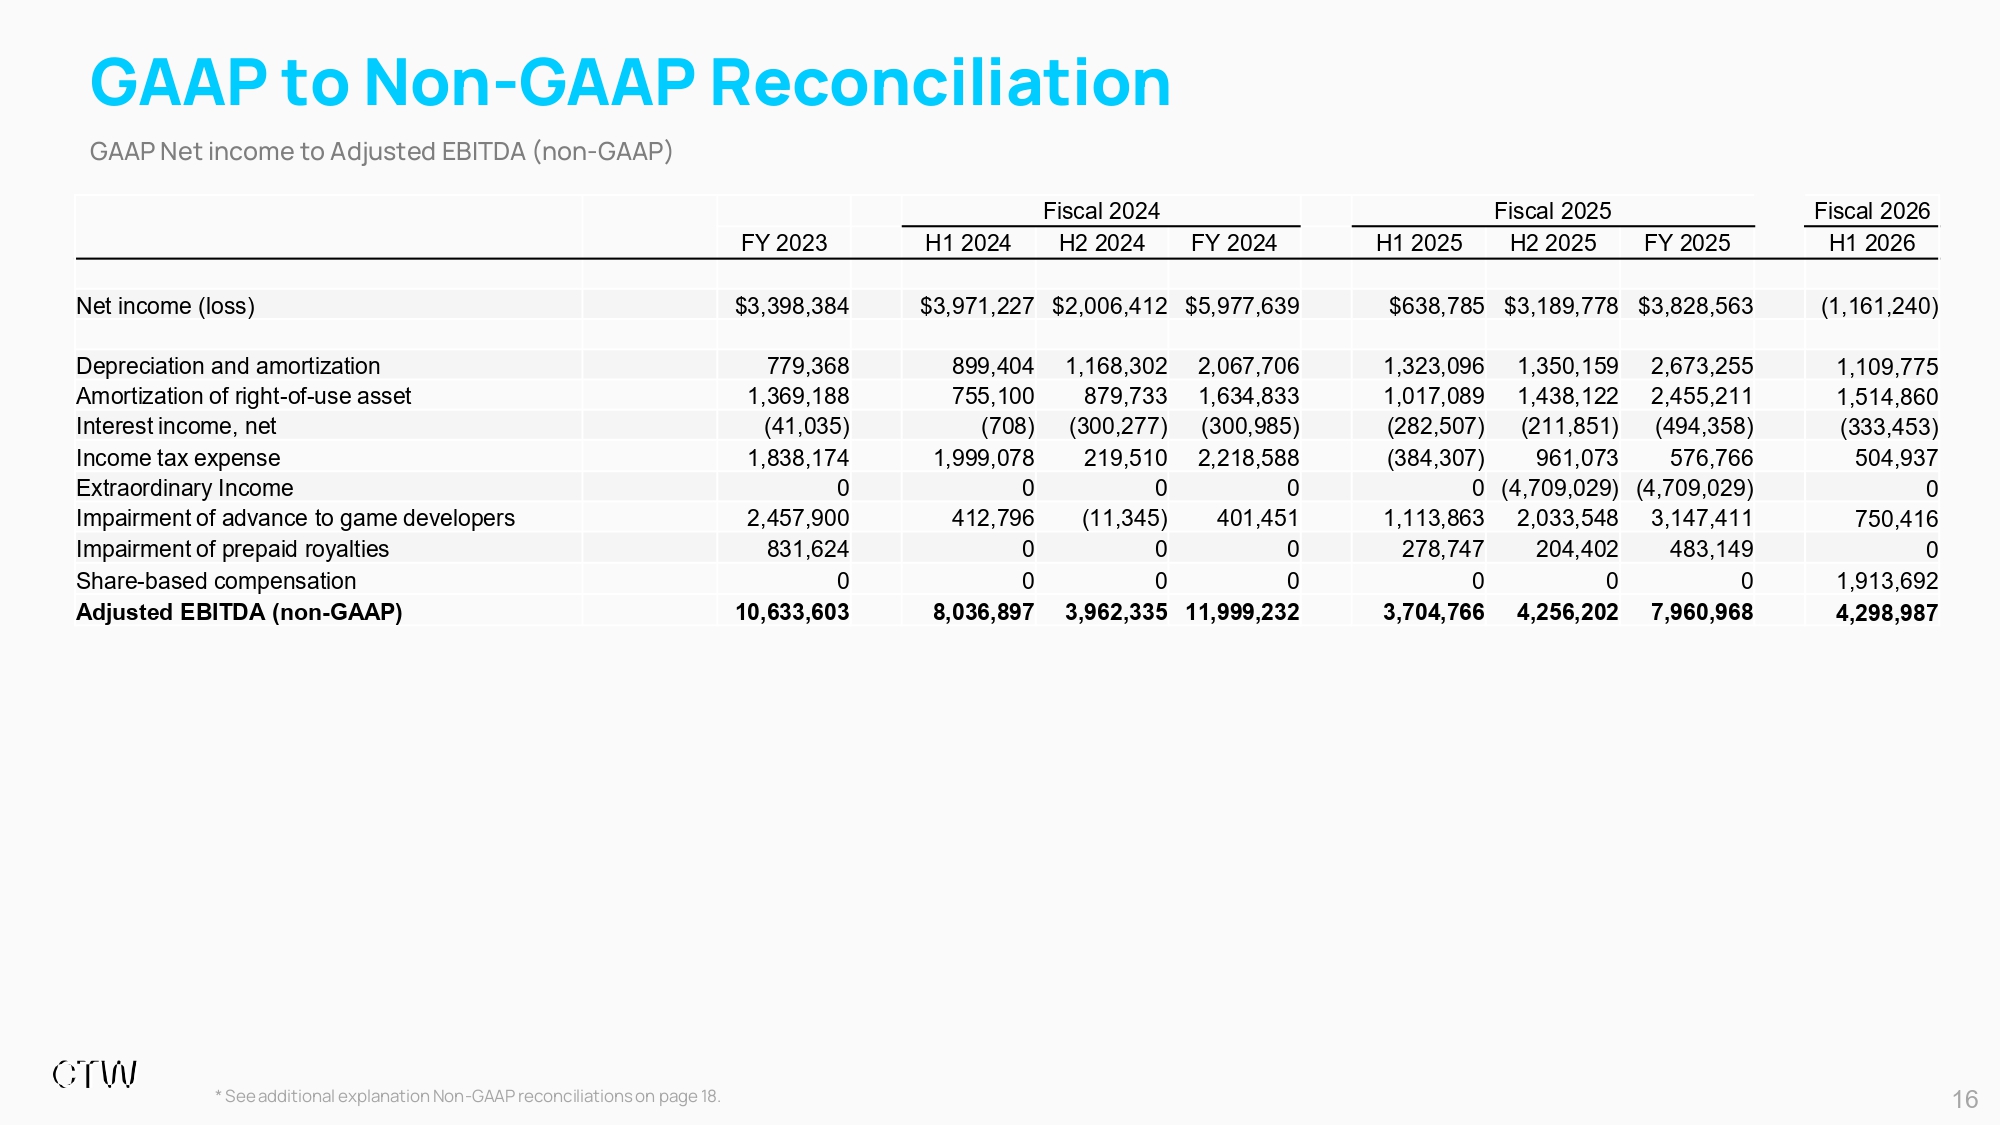
16 GAAP to Non - GAAP Reconciliation Fiscal 2024 Fiscal 2025 Fiscal 2026 FY 2023 H1 2024 H2 2024 FY 2024 H1 2025 H2 2025 FY 2025 H1 2026 Net income (loss) $3,398,384 $3,971,227 $2,006,412 $5,977,639 $638,785 $3,189,778 $3,828,563 (1,161,240) Depreciation and amortization 779,368 899,404 1,168,302 2,067,706 1,323,096 1,350,159 2,673,255 1,109,775 Amortization of right - of - use asset 1,369,188 755,100 879,733 1,634,833 1,017,089 1,438,122 2,455,211 1,514,860 Interest income, net (41,035) (708) (300,277) (300,985) (282,507) (211,851) (494,358) (333,453) Income tax expense 1,838,174 1,999,078 219,510 2,218,588 (384,307) 961,073 576,766 504,937 Extraordinary Income 0 0 0 0 0 (4,709,029) (4,709,029) 0 Impairment of advance to game developers 2,457,900 412,796 (11,345) 401,451 1,113,863 2,033,548 3,147,411 750,416 Impairment of prepaid royalties 831,624 0 0 0 278,747 204,402 483,149 0 Share - based compensation 0 0 0 0 0 0 0 1,913,692 Adjusted EBITDA (non - GAAP) 10,633,603 8,036,897 3,962,335 11,999,232 3,704,766 4,256,202 7,960,968 4,298,987 GAAP Net income to Adjusted EBITDA (non - GAAP) * See additional explanation Non - GAAP reconciliations on page 18.

Glossary of Key Terms 17 “ActiveUser” are to any user that spend at least one (1) minute on G123.jp platform during the applicable period. Active users are calcula te d based on cookie - based uniqueness, meaning that auser who accesses the platform on multiple devices or browsers will be counted as asingle active user “ARPMAU” are to average in - game purchase amount per monthly active user during a given period, calculated by dividing the total in - game purchase amount in a given period generated on our G123.jpplatform by the average number ofmonthly active users, which is averaged over each month byfurther dividing bythe num ber ofmonths in the respective period “ARPPMAU” are to average in - game purchase amount per paying monthly active user during a given fiscal year, calculated by dividing the to tal in - game purchase amount in a given fiscal year bythe average number ofpaying monthly active users, which is averaged over eachmonth by further dividing 12 “MAUs” are to monthly active users, which is a performance indicator that captures the number of Active Users who accessed our G123. jp platform at least once during the preceding 30 - day period. MAUs for a given period is the average MAUs across allmonths in the respective period, which is calculated by summing th e number ofMAUs for each month during the given period and dividing the totalby the number ofmonths in the respective period “PayingUser” are to any user that makes at least one in - game purchase ofno less than US$0.01 during the applicable period; “PMAUs” are to paying monthly active users, which is a performance indicator that captures the number of users who made at least one in - game purchase, and have spent at least one (1) minute on G123.jp platform during the preceding 30 - day period. PMAUs for a given period is the average PMAUs across all months i n the respective period, which is calculated by summing the number ofPMAUs for each month during the given period and dividing the total by the number ofmonths in the respective period; “ROAS” are to return on advertisement spending based on created users, calculated by dividing average in - game purchase amount per crea ted user divided by average advertising expenses per created user during the applicable period “Grossin - gamepurchaseamount” means the total in - purchase amounts, or top - ups, paid byend - users for games on G123.jp platform. “Retentionrate” measures the percentage of users who return to the same game on a specific day (e.g. Day 1, Day 7 and Day 30) after their ini ti al engagement. Platform retention rate is the average ofthe per - game retention rate ofeach dayduring agiven period.

Non - GAAP Financial Measures 18 ReconciliationofNon - GAAPFinancialMeasures In addition to reporting financial results preparedin accordance with U.S. generally accepted accounting principles(“GAAP”), CTW (or the“Company”) presents Adjusted EBITDA (non - GAAP) forthesecondhalfandfullfiscalyears2025and2024. Adjusted EBITDA (non - GAAP) is a non - GAAP financial measure intended to provide management and investors with additional insight into CTW’s underlying operating performance. This measureisunaudited andisnotincluded inCTW’sauditedconsolidatedfinancial statementsorForm20 - F. DefinitionofAdjustedEBITDA(non - GAAP) CTW defines Adjusted EBITDA (non - GAAP) as net income (loss) before: interest income and expense, income tax expense (benefit), d epreciation and amortization, impairment losses (recoveries), and other items that management considers non - core or not reflective of ongoing operations. Management believes Ad justed EBITDA (non - GAAP) highlights operating results that are more comparable across periods by excluding the effects of non - cash charges, financing decisions, and items that can va ry among companies due to capital structure or tax jurisdiction differences. UseandLimitationsofNon - GAAPMeasures Adjusted EBITDA (non - GAAP) should be considered in addition to, and not as a substitute for, GAAP measures such as income from o perations, net income, or cash flows from operating activities.BecausecompaniesmaydefineAdjustedEBITDAdifferently, CTW’spresentationmaynotbedirectlycomparabletosimilarlytitledme asu resusedbyothercompanies.Thismeasure ispresentedsolelytoprovideinvestorswithsupplemental information andshouldnotberegardedasameasureofliquidity, profitability, o rfi nancial condition underGAAP. ManagementusesAdjustedEBITDA(non - GAAP),togetherwithGAAPincomefromoperationsandnetincome,toevaluateCTW’soperatingperformanceandto assistinfinancialandstrategic decision - making. TheCompanybelieves thismeasureprovidesinvestors withaclearerviewofCTW’sabilitytogenerateearningsfromitscoregami ngandplatformoperations.

Segment Profits 19 In November 2023, the FASB issued ASU 2023 - 07, Segment Reporting (Topic 280): Improvements to Reportable Segment Disclosures. Th eASU’s amendments “improve reportable segment disclosure requirements, primarily through enhanced disclosures about significant segment expenses”. In addition, the standar d i ntroduces new disclosure requirements specifically for entities with a single reportable segment, and it aims to help investors better understand a company’s performance and assess po tential future cash flows. The new guidance applies to all public entities subject to segment reporting under ASC 280. This ASU is effective for fiscal years beginning after December 1 5, 2023, and interim periods within fiscal years beginning after December15, 2024. Early adoption is permitted.The Groupadoptedthis ASU fortheyearendedJuly31, 2025.The adoptionofASUdoes notc han ge howsegments are identified,aggregated, ormeasured,itaddsincremental disclosure requirements. An operating segment is a component of the Group that engages in business activities from which it may earn revenues and incu r e xpenses, and is identified on the basis of the internal financial reportsthatareprovidedtoandregularlyreviewedbythe Group’schiefoperatingdecisionmaker(“CODM”)inordertoallocateresour ces andassessperformance ofthesegment. The management of the Group concludes that it has only one reporting segment. The Group provides game distribution and relate d s ervices to game developers. The Group’s services have similar economic characteristics with respectto nature and formofthe services provided. The Group’s chief operating decision mak er has been identified as the Chief Executive Officer, who reviews Consolidated results when making decisions about allocating resources and assessing performance of the Group, rather tha n by geographic area; hence the Group has only one reporting segment. CODM reviews operation results on the consolidated in - game purchase amount, recoup of advances to game develo pers and revenue share with game developers and IP holders,advertising expenses,transactionfees,servercostdirectlyrelatedtothehostofgames,in - house payrollcostdirectlyrelatedtothea rtanddesignsupportservicesprovided.