| (a) | (b) | (c) | (b) | (c) | (d) | (e) | (f) | (g) | (h) | |
Summary |
Compensation |
Summary |
Compensation |
Average |
Average | Value of Initial Fixed $100 Investment Based on |
Net |
Adjusted | ||
| Year | Total Shareholder Return (9) | Peer Group | ||||||||
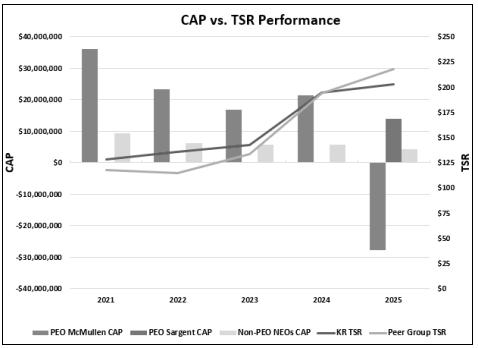
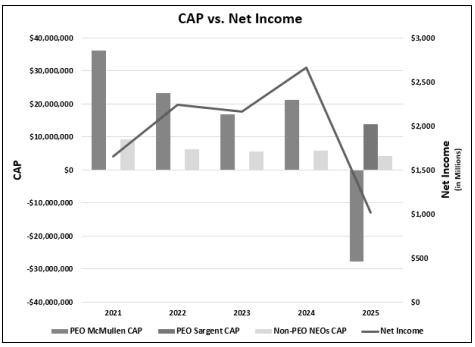
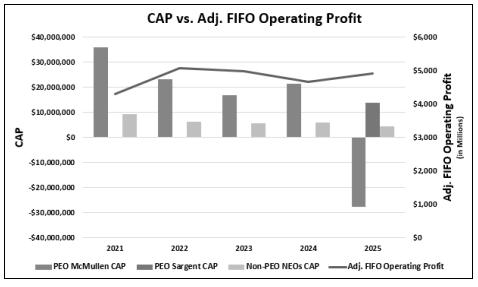
| 2025 | $14,037,608 | $13,883,235 | $843,061 | $(27,697,216) | $6,300,854 | $4,312,446 | $202.66 | $217.65 | $1,016 | $4,905 |
| 2024 | $15,631,028 | $21,332,878 | $4,958,926 | $5,841,074 | $194.50 | $193.49 | $2,665 | $4,674 | ||
| 2023 | $15,710,572 | $16,841,015 | $5,373,738 | $5,669,814 | $142.48 | $133.33 | $2,164 | $4,986 | ||
| 2022 | $19,209,843 | $23,325,794 | $6,117,423 | $6,281,085 | $135.86 | $114.43 | $2,244 | $5,079 | ||
| 2021 | $18,168,730 | $36,111,316 | $5,644,957 | $9,323,327 | $128.57 | $118.08 | $1,665 | $4,310 | ||
*Totals in the above table might not equal the summation of the columns due to rounding.
| 1. | Mr. Sargent served as the Company’s principal executive officer (“PEO”) beginning March 2, 2025. |
| 2. | Represents the amount of total compensation reported for our Interim CEO, Mr. Sargent, in the “Total” column of the Summary Compensation Table (“SCT”)) for fiscal year 2025. |
| 3. | The dollar amount reported for Mr. Sargent in this column has been calculated in accordance with Item 402(v) of Regulation S-K and does not reflect compensation actually earned, realized or received by the Interim CEO during the fiscal year. In accordance with the requirements of Item 402(v) of Regulation S-K, the following adjustments were made to Mr. Sargent’s total compensation for fiscal year 2025 to determine the CAP: |
Mr. Sargent SCT Total to CAP Reconciliation
| ||||||
| Year | Reported Summary Compensation Table for PEO ($) | Minus: Reported Summary Compensation Table Value of Equity Awards (a) ($) | Plus/Minus: Equity Award Adjustments (b) ($) | Plus/Minus: Reported Change in the APV of Pension Benefits in Summary Compensation Table ($) | Plus: Pension Benefit Adjustments ($) | Compensation ($) |
| 2025 | 14,037,608 | 10,000,077 | 9,845,704 | 13,883,235 | ||
| a) | The amounts included in this column are the amounts reported in “Stock Awards” and “Option Awards” columns of the SCT for fiscal 2025 and are subtracted from the Reported Summary Compensation Table “SCT” for PEO. |
| b) | The equity award adjustments for fiscal 2025 were calculated in accordance with the methodology required by Item 402(v) of Regulation S-K as follows: the equity award adjustments for each applicable year include the following: (i) addition of the year-end fair value of any equity awards granted in fiscal 2025 that are outstanding and unvested as of the end of the year; (ii) addition or subtraction of the amount equal to the change as of the end of fiscal 2025 (from the end of the prior fiscal year) in the fair value of any awards granted in prior years that are outstanding and unvested as of the end of fiscal 2025; (iii) for equity awards that were granted and vested in fiscal 2025, addition of the fair value as of the vesting date; (iv) for equity awards granted in prior years that vested in fiscal 2025, the amount equal to the change as of the vesting date (from the end of the prior fiscal year) in fair value; (v) for equity awards granted in prior years that are determined to fail to meet the applicable vesting conditions during fiscal 2025, subtraction of the fair value at the end of the prior fiscal year; and (vi) addition of the dollar value of any dividends or other earnings paid on stock or option awards in fiscal 2025 prior to the vesting date that are not otherwise reflected in the fair value of such award or included in any other component of total compensation for fiscal 2025. The valuation assumptions used to calculate fair values did not materially differ from those disclosed at the time of grant. The amounts deducted or added in calculating the equity award adjustments for the PEOs are provided in the table below: |
| Mr. Sargent Equity Awards Adjustments | |||||
| Year | Plus/Minus: ($) | Plus/Minus: Change in Fair Value of Outstanding & Unvested Awards ($) | Plus: Fair Value as of Vesting Date of Awards Granted and Vested in the Year ($) | Change in Fair ($) | Total Equity ($) |
| 2025 | 9,845,704 | 9,845,704 | |||
| c) | The amounts included in this column are the amounts reported in “Change in Pension and Nonqualified Deferred Compensation” of the SCT for fiscal 2025. Total Pension Benefit Adjustments are equal to the Pension Service Costs incurred during the relevant period. No Prior Service Costs were incurred as no modifications were made to the pension plan during the relevant period. |
| 4. | Mr. McMullen served as the Company’s PEO during fiscal 2021, 2022, 2023, and 2024 and during fiscal 2025 until his resignation on March 2, 2025. |
| 5. | Represents the amount of total compensation reported for the Company’s former PEO, Mr. McMullen, in the “Total” column of the Summary Compensation Table for the applicable fiscal years. |
| 6. | The dollar amounts reported for Mr. McMullen in this column has been calculated in accordance with Item 402(v) of Regulation S-K and do not reflect compensation actually earned, realized or received by the CEO during the fiscal year. In accordance with the requirements of Item 402(v) of Regulation S-K, the following adjustments were made to Mr. McMullen’s total compensation for fiscal year 2025 to determine the CAP using the same methodology as described in footnote 3: |
| Mr. McMullen SCT Total to CAP Reconciliation | ||||||
| Year | Reported Summary Compensation Table for PEO ($) | Minus: Reported Summary Compensation Table Value of Equity Awards ($) | Plus/Minus: Equity Award Adjustments ($) | Plus/Minus: Reported Change in the APV of Pension Benefits in Summary Compensation Table ($) | Plus/Minus: Pension Benefit Adjustments(a) ($) | Compensation Actually Paid to ($) |
| 2025 | 843,061 | – | 334,914 | 508,147 | ||
| Mr. McMullen Equity Awards Adjustments | |||||
| Year | Year End Fair ($) | YoY Change in Fair Value of Outstanding & Unvested Awards ($) | Fair Value as of Vesting Date of Awards Granted and Vested in the Year ($) | Year over Year ($) | Total Equity ($) |
| 2025 | (28,205,363) | (28,205,363) | |||
| 7. | The amounts in this column are the amounts reported in “Change in Pension and Non-Qualified Deferred Compensation of the SCT” for fiscal 2025. Total Pension Benefits Adjustments are equal to the Pension Service Costs incurred during the relevant period. No Prior Service Costs were incurred as no modifications were made to the pension plan during the relevant period. |
| 8. | The dollar amounts reported in column (d) represent the average of the amounts reported for our non-PEO NEOs as a group in the Total column of the SCT in the applicable fiscal years. For 2025, our non-PEO NEOs were David J.C. Kennerley, Mary Ellen Adcock, Yael Cosset, Timothy A. Massa, and Todd A. Foley. For 2024, our non-PEO NEOs were Todd A. Foley, Mary Ellen Adcock, Yael Cosset, Timothy A. Massa, and Gary Millerchip. For 2023, our non-PEO NEOs were Gary Millerchip, Stuart W. Aitken, Yael Cosset, and Timothy A. Massa. For 2022, our non-PEO NEOs were Gary Millerchip, Stuart W. Aitken, Yael Cosset, and Timothy A. Massa. For 2021, our non-PEO NEOs were Gary Millerchip, Stuart W. Aitken, Yael Cosset, and Michael J. Donnelly. |
| 9. | The dollar amounts reported in column (e) represent the average amount of CAP to the Non-PEO NEOs as a group, as computed in accordance with Item 402(v) of Regulation S-K. The dollar amounts do not reflect the actual average amount of compensation earned by or paid to these NEOs as a group during the applicable fiscal years. In accordance with the requirements of Item 402(v) of Regulation S-K, the following adjustments were made to the average total compensation for the non-PEO NEOs as a group for fiscal 2025 to determine the CAP using the same methodology as described in footnote 3: |
Average Non-PEO NEOs Summary Compensation Table Total to CAP Reconciliation
| ||||||
| Year | Average Reported Summary Compensation Table for Non-PEO NEOs ($) | Minus: Average Reported Summary Compensation Table Value for Equity Awards for Non- PEO NEOs ($) | Plus/Minus: Average Equity Award Adjustments(a) ($) | Plus/Minus: Average Reported Change in the APV of Pension Benefits in SCT(b) ($) | Plus/Minus: Average Pension Benefit Adjustments ($) | Average Compensation Actually Paid to non-PEO NEOs ($) |
| 2025 | 6,300,854 | 4,404,136 | 2,415,728 | 4,312,446 | ||
| (a) | The amounts deducted or added in calculating the total average equity award adjustments are provided in the table below: |
Equity Award Adjustments for Non-PEO NEOs
| |||||
| Year |
Plus/Minus: ($) | Plus/Minus: Average Change in Fair Value of Outstanding & Unvested Awards ($) | Plus/Minus: Average Fair Value as of Vesting Date of Awards Granted and Vested in the Year ($) | Plus/Minus: Average Change in Fair Value of Awards Granted in Prior Years that Vested in the Year ($) | Total Average Adjustment |
| 2025 | 3,386,895 | (1,130,477) | 2,887 | 156,422 | 2,415,728 |
| 10. | Cumulative TSR is calculated by dividing (a) the sum of the cumulative amount of dividends for the measurement period, assuming dividend reinvestment, and the difference between the Company’s share price at the end and the beginning of the measurement period by (b) the Company’s share price at the beginning of the measurement period. The peer group selected by the Company for purposes of the TSR benchmarking for the pay versus performance disclosures is the same peer group the Company uses for its performance graph in the Annual Report on Form 10-K pursuant to Item 201(e) of Regulation S-K. The Peer Group consists of Albertsons Companies, Inc. (included from June 26, 2020 when it began trading), Costco Wholesale Corporation, CVS Health Corporation, Koninklijke Ahold Delhaize N.V., Target Corp., Walgreens Boots Alliance Inc. and Walmart Inc. The cumulative TSR depicts a hypothetical $100 investment in Kroger common shares on January 30, 2021, and shows the value of that investment over time (assuming the reinvestment of dividends) for each calendar year. A hypothetical $100 investment in the Peer Group using the same methodology is shown for comparison. Because fiscal years are presented in the table in reverse chronological order (from top to bottom), the table should be read from bottom to top for purposes of understanding cumulative returns over time. |
| 11. | Net income is as reported in the Company’s audited financial statements for the applicable year in accordance with U.S. GAAP. |
| 12. | Adjusted FIFO Operating Profit equals gross profit, excluding the LIFO charge, minus OG&A, minus rent, and minus depreciation and amortization. For a reconciliation of non-GAAP information, see pages 28-36 of our Annual Report on Form 10-K for the fiscal year ended January 31, 2026, filed with the SEC on March 31, 2026. |
| 1. | Mr. Sargent served as the Company’s principal executive officer (“PEO”) beginning March 2, 2025. |
| 4. | Mr. McMullen served as the Company’s PEO during fiscal 2021, 2022, 2023, and 2024 and during fiscal 2025 until his resignation on March 2, 2025. |
| 8. | The dollar amounts reported in column (d) represent the average of the amounts reported for our non-PEO NEOs as a group in the Total column of the SCT in the applicable fiscal years. For 2025, our non-PEO NEOs were David J.C. Kennerley, Mary Ellen Adcock, Yael Cosset, Timothy A. Massa, and Todd A. Foley. For 2024, our non-PEO NEOs were Todd A. Foley, Mary Ellen Adcock, Yael Cosset, Timothy A. Massa, and Gary Millerchip. For 2023, our non-PEO NEOs were Gary Millerchip, Stuart W. Aitken, Yael Cosset, and Timothy A. Massa. For 2022, our non-PEO NEOs were Gary Millerchip, Stuart W. Aitken, Yael Cosset, and Timothy A. Massa. For 2021, our non-PEO NEOs were Gary Millerchip, Stuart W. Aitken, Yael Cosset, and Michael J. Donnelly. |
| 10. | Cumulative TSR is calculated by dividing (a) the sum of the cumulative amount of dividends for the measurement period, assuming dividend reinvestment, and the difference between the Company’s share price at the end and the beginning of the measurement period by (b) the Company’s share price at the beginning of the measurement period. The peer group selected by the Company for purposes of the TSR benchmarking for the pay versus performance disclosures is the same peer group the Company uses for its performance graph in the Annual Report on Form 10-K pursuant to Item 201(e) of Regulation S-K. The Peer Group consists of Albertsons Companies, Inc. (included from June 26, 2020 when it began trading), Costco Wholesale Corporation, CVS Health Corporation, Koninklijke Ahold Delhaize N.V., Target Corp., Walgreens Boots Alliance Inc. and Walmart Inc. The cumulative TSR depicts a hypothetical $100 investment in Kroger common shares on January 30, 2021, and shows the value of that investment over time (assuming the reinvestment of dividends) for each calendar year. A hypothetical $100 investment in the Peer Group using the same methodology is shown for comparison. Because fiscal years are presented in the table in reverse chronological order (from top to bottom), the table should be read from bottom to top for purposes of understanding cumulative returns over time. |
| 3. | The dollar amount reported for Mr. Sargent in this column has been calculated in accordance with Item 402(v) of Regulation S-K and does not reflect compensation actually earned, realized or received by the Interim CEO during the fiscal year. In accordance with the requirements of Item 402(v) of Regulation S-K, the following adjustments were made to Mr. Sargent’s total compensation for fiscal year 2025 to determine the CAP: |
Mr. Sargent SCT Total to CAP Reconciliation
| ||||||
| Year | Reported Summary Compensation Table for PEO ($) | Minus: Reported Summary Compensation Table Value of Equity Awards (a) ($) | Plus/Minus: Equity Award Adjustments (b) ($) | Plus/Minus: Reported Change in the APV of Pension Benefits in Summary Compensation Table ($) | Plus: Pension Benefit Adjustments ($) | Compensation ($) |
| 2025 | 14,037,608 | 10,000,077 | 9,845,704 | 13,883,235 | ||
| a) | The amounts included in this column are the amounts reported in “Stock Awards” and “Option Awards” columns of the SCT for fiscal 2025 and are subtracted from the Reported Summary Compensation Table “SCT” for PEO. |
| b) | The equity award adjustments for fiscal 2025 were calculated in accordance with the methodology required by Item 402(v) of Regulation S-K as follows: the equity award adjustments for each applicable year include the following: (i) addition of the year-end fair value of any equity awards granted in fiscal 2025 that are outstanding and unvested as of the end of the year; (ii) addition or subtraction of the amount equal to the change as of the end of fiscal 2025 (from the end of the prior fiscal year) in the fair value of any awards granted in prior years that are outstanding and unvested as of the end of fiscal 2025; (iii) for equity awards that were granted and vested in fiscal 2025, addition of the fair value as of the vesting date; (iv) for equity awards granted in prior years that vested in fiscal 2025, the amount equal to the change as of the vesting date (from the end of the prior fiscal year) in fair value; (v) for equity awards granted in prior years that are determined to fail to meet the applicable vesting conditions during fiscal 2025, subtraction of the fair value at the end of the prior fiscal year; and (vi) addition of the dollar value of any dividends or other earnings paid on stock or option awards in fiscal 2025 prior to the vesting date that are not otherwise reflected in the fair value of such award or included in any other component of total compensation for fiscal 2025. The valuation assumptions used to calculate fair values did not materially differ from those disclosed at the time of grant. The amounts deducted or added in calculating the equity award adjustments for the PEOs are provided in the table below: |
| Mr. Sargent Equity Awards Adjustments | |||||
| Year | Plus/Minus: ($) | Plus/Minus: Change in Fair Value of Outstanding & Unvested Awards ($) | Plus: Fair Value as of Vesting Date of Awards Granted and Vested in the Year ($) | Change in Fair ($) | Total Equity ($) |
| 2025 | 9,845,704 | 9,845,704 | |||
| 6. | The dollar amounts reported for Mr. McMullen in this column has been calculated in accordance with Item 402(v) of Regulation S-K and do not reflect compensation actually earned, realized or received by the CEO during the fiscal year. In accordance with the requirements of Item 402(v) of Regulation S-K, the following adjustments were made to Mr. McMullen’s total compensation for fiscal year 2025 to determine the CAP using the same methodology as described in footnote 3: |
| Mr. McMullen SCT Total to CAP Reconciliation | ||||||
| Year | Reported Summary Compensation Table for PEO ($) | Minus: Reported Summary Compensation Table Value of Equity Awards ($) | Plus/Minus: Equity Award Adjustments ($) | Plus/Minus: Reported Change in the APV of Pension Benefits in Summary Compensation Table ($) | Plus/Minus: Pension Benefit Adjustments(a) ($) | Compensation Actually Paid to ($) |
| 2025 | 843,061 | – | 334,914 | 508,147 | ||
| Mr. McMullen Equity Awards Adjustments | |||||
| Year | Year End Fair ($) | YoY Change in Fair Value of Outstanding & Unvested Awards ($) | Fair Value as of Vesting Date of Awards Granted and Vested in the Year ($) | Year over Year ($) | Total Equity ($) |
| 2025 | (28,205,363) | (28,205,363) | |||
| 9. | The dollar amounts reported in column (e) represent the average amount of CAP to the Non-PEO NEOs as a group, as computed in accordance with Item 402(v) of Regulation S-K. The dollar amounts do not reflect the actual average amount of compensation earned by or paid to these NEOs as a group during the applicable fiscal years. In accordance with the requirements of Item 402(v) of Regulation S-K, the following adjustments were made to the average total compensation for the non-PEO NEOs as a group for fiscal 2025 to determine the CAP using the same methodology as described in footnote 3: |
Average Non-PEO NEOs Summary Compensation Table Total to CAP Reconciliation
| ||||||
| Year | Average Reported Summary Compensation Table for Non-PEO NEOs ($) | Minus: Average Reported Summary Compensation Table Value for Equity Awards for Non- PEO NEOs ($) | Plus/Minus: Average Equity Award Adjustments(a) ($) | Plus/Minus: Average Reported Change in the APV of Pension Benefits in SCT(b) ($) | Plus/Minus: Average Pension Benefit Adjustments ($) | Average Compensation Actually Paid to non-PEO NEOs ($) |
| 2025 | 6,300,854 | 4,404,136 | 2,415,728 | 4,312,446 | ||
| (a) | The amounts deducted or added in calculating the total average equity award adjustments are provided in the table below: |
Equity Award Adjustments for Non-PEO NEOs
| |||||
| Year |
Plus/Minus: ($) | Plus/Minus: Average Change in Fair Value of Outstanding & Unvested Awards ($) | Plus/Minus: Average Fair Value as of Vesting Date of Awards Granted and Vested in the Year ($) | Plus/Minus: Average Change in Fair Value of Awards Granted in Prior Years that Vested in the Year ($) | Total Average Adjustment |
| 2025 | 3,386,895 | (1,130,477) | 2,887 | 156,422 | 2,415,728 |
Most Important Performance Measures
The three measures listed below represent the most important financial performance measures used by the Company to link CAP to Company performance for the 2025 fiscal year:
| ● | Adjusted FIFO Operating Profit |
| ● | ID sales, without fuel |
| ● | Adjusted net earnings per diluted share attributable to The Kroger Co. |
For a reconciliation of non-GAAP information, see pages 28-36 of our Annual Report on Form 10-K for the fiscal year ended January 31, 2026, filed with the SEC on March 31, 2026.
| b) | The equity award adjustments for fiscal 2025 were calculated in accordance with the methodology required by Item 402(v) of Regulation S-K as follows: the equity award adjustments for each applicable year include the following: (i) addition of the year-end fair value of any equity awards granted in fiscal 2025 that are outstanding and unvested as of the end of the year; (ii) addition or subtraction of the amount equal to the change as of the end of fiscal 2025 (from the end of the prior fiscal year) in the fair value of any awards granted in prior years that are outstanding and unvested as of the end of fiscal 2025; (iii) for equity awards that were granted and vested in fiscal 2025, addition of the fair value as of the vesting date; (iv) for equity awards granted in prior years that vested in fiscal 2025, the amount equal to the change as of the vesting date (from the end of the prior fiscal year) in fair value; (v) for equity awards granted in prior years that are determined to fail to meet the applicable vesting conditions during fiscal 2025, subtraction of the fair value at the end of the prior fiscal year; and (vi) addition of the dollar value of any dividends or other earnings paid on stock or option awards in fiscal 2025 prior to the vesting date that are not otherwise reflected in the fair value of such award or included in any other component of total compensation for fiscal 2025. The valuation assumptions used to calculate fair values did not materially differ from those disclosed at the time of grant. The amounts deducted or added in calculating the equity award adjustments for the PEOs are provided in the table below: |
| Mr. Sargent Equity Awards Adjustments | |||||
| Year | Plus/Minus: ($) | Plus/Minus: Change in Fair Value of Outstanding & Unvested Awards ($) | Plus: Fair Value as of Vesting Date of Awards Granted and Vested in the Year ($) | Change in Fair ($) | Total Equity ($) |
| 2025 | 9,845,704 | 9,845,704 | |||
| Mr. McMullen Equity Awards Adjustments | |||||
| Year | Year End Fair ($) | YoY Change in Fair Value of Outstanding & Unvested Awards ($) | Fair Value as of Vesting Date of Awards Granted and Vested in the Year ($) | Year over Year ($) | Total Equity ($) |
| 2025 | (28,205,363) | (28,205,363) | |||
| (a) | The amounts deducted or added in calculating the total average equity award adjustments are provided in the table below: |
Equity Award Adjustments for Non-PEO NEOs
| |||||
| Year |
Plus/Minus: ($) | Plus/Minus: Average Change in Fair Value of Outstanding & Unvested Awards ($) | Plus/Minus: Average Fair Value as of Vesting Date of Awards Granted and Vested in the Year ($) | Plus/Minus: Average Change in Fair Value of Awards Granted in Prior Years that Vested in the Year ($) | Total Average Adjustment |
| 2025 | 3,386,895 | (1,130,477) | 2,887 | 156,422 | 2,415,728 |
| 12. | Adjusted FIFO Operating Profit equals gross profit, excluding the LIFO charge, minus OG&A, minus rent, and minus depreciation and amortization. For a reconciliation of non-GAAP information, see pages 28-36 of our Annual Report on Form 10-K for the fiscal year ended January 31, 2026, filed with the SEC on March 31, 2026. |