Pay vs Performance Disclosure - USD ($)
Jan. 31, 2026
Jan. 31, 2025
Jan. 31, 2024
Jan. 31, 2023
Jan. 31, 2022
Fiscal Year(1) | Summary Compensation Table Total for Scott Cutler ($) | Compensation Actually Paid to Scott Cutler(2)(3) ($) | Summary Compensation Table Total for Jon Kessler ($) | Compensation Actually Paid to Jon Kessler(2)(3) ($) | Average Summary Compensation Table Total for Non-PEOs ($) | Average Compensation Actually Paid to Non-PEOs(2)(3) ($) | Value of Initial Fixed $100 Investment Based on: | Net Income ($ in Thousands)(5) | Adjusted EBITDA ($ in Thousands)(6) | |||||||||||||||||||||||
Total Stockholder Return(4) ($) | Peer Group Total Stockholder Return(4) ($) | |||||||||||||||||||||||||||||||
| 2026 | 13,582,105 | 10,419,811 | — | — | 4,373,230 | 587,212 | 102.54 | 80.96 | 215,201 | 565,984 | ||||||||||||||||||||||
| 2025 | 8,277,080 | 9,305,917 | 12,610,368 | 36,768,404 | 4,996,890 | 8,152,797 | 132.16 | 101.94 | 96,703 | 471,751 | ||||||||||||||||||||||
| 2024 | — | — | 13,448,018 | 22,912,953 | 3,877,526 | 2,838,659 | 90.46 | 76.35 | 55,712 | 369,173 | ||||||||||||||||||||||
| 2023 | — | — | 13,400,167 | 14,441,532 | 5,607,831 | 4,042,284 | 72.83 | 72.55 | (26,143) | 272,348 | ||||||||||||||||||||||
| 2022 | — | — | 9,947,622 | (5,492,707) | 2,398,514 | (623,189) | 63.96 | 93.40 | (44,289) | 236,015 | ||||||||||||||||||||||
| Fiscal Year | PEO | Non-PEOs | |||||||||
| 2026 | Scott Cutler | James Lucania; Elimelech Rosner; Michael Fiore; Delano Ladd | |||||||||
| 2025 | Scott Cutler, Jon Kessler | James Lucania; Michael Fiore; Elimelech Rosner; Delano Ladd; Selim Aissi | |||||||||
| 2024 | Jon Kessler | James Lucania; Stephen Neeleman, M.D.; Elimelech Rosner; Delano Ladd; Tyson Murdock; Larry Trittschuh | |||||||||
| 2023 | Jon Kessler | Stephen Neeleman, M.D.; Tyson Murdock; Elimelech Rosner; Edward Bloomberg; Larry Trittschuh | |||||||||
| 2022 | Jon Kessler | Stephen Neeleman, M.D.; Tyson Murdock; Darcy Mott; Edward Bloomberg; Larry Trittschuh | |||||||||
Fiscal Year | HealthEquity ($) | Compensation Peer Group ($) | Prior Compensation Peer Group ($) | |||||||||||
| 2026 | 102.54 | 80.96 | 72.10 | |||||||||||
| 2025 | 132.16 | 101.94 | 100.66 | |||||||||||
| 2024 | 90.46 | 76.35 | 82.32 | |||||||||||
| 2023 | 72.83 | 72.55 | 83.09 | |||||||||||
| 2022 | 63.96 | 93.40 | 97.29 | |||||||||||
Fiscal year 2026 Compensation Actually Paid to our PEO and the average Compensation Actually Paid to non-PEOs reflects the following adjustments from the compensation reported in the “Total” column of the Summary Compensation Table:
| Scott Cutler ($) | Average Non-PEO ($) | |||||||||||||||||||
| Total Reported in Fiscal 2026 Summary Compensation Table | 13,582,105 | 4,373,230 | ||||||||||||||||||
| Less, value of awards reported in Summary Compensation Table | (12,038,563) | (3,436,529) | ||||||||||||||||||
Plus, year-end value of awards granted in fiscal year that are unvested and outstanding at the end of the fiscal year | 10,536,154 | 3,051,754 | ||||||||||||||||||
Plus, change in fair value of prior year awards that are unvested and outstanding at end of fiscal year | (1,274,452) | (2,240,572) | ||||||||||||||||||
| Plus, fair value of awards granted in fiscal year and that vested this fiscal year | — | — | ||||||||||||||||||
| Plus, change in fair value of prior year awards that vested this fiscal year | (385,433) | (1,160,671) | ||||||||||||||||||
| Less, fair value of prior year awards that failed to vest this fiscal year | — | — | ||||||||||||||||||
| Total Adjustments | (3,162,294) | (3,786,018) | ||||||||||||||||||
| Compensation Actually Paid | 10,419,811 | 587,212 | ||||||||||||||||||
Fiscal year 2025 Compensation Actually Paid to our PEO and the average Compensation Actually Paid to non-PEOs reflects the following adjustments from the compensation reported in the “Total” column of the Summary Compensation Table:
| Scott Cutler ($) | Jon Kessler ($) | Average Non-PEO ($) | |||||||||||||||||||||
| Total Reported in Fiscal 2025 Summary Compensation Table | 8,277,080 | 12,610,368 | 4,996,890 | ||||||||||||||||||||
| Less, value of awards reported in Summary Compensation Table | (7,500,004) | (12,020,015) | (3,897,412) | ||||||||||||||||||||
Plus, year-end value of awards granted in fiscal year that are unvested and outstanding at the end of the fiscal year | 8,528,841 | 17,545,309 | 4,684,464 | ||||||||||||||||||||
Plus, change in fair value of prior year awards that are unvested and outstanding at end of fiscal year | — | 18,202,985 | 2,267,910 | ||||||||||||||||||||
| Plus, fair value of awards granted in fiscal year and that vested this fiscal year | — | — | — | ||||||||||||||||||||
| Plus, change in fair value of prior year awards that vested this fiscal year | — | 429,757 | 100,945 | ||||||||||||||||||||
| Less, fair value of prior year awards that failed to vest this fiscal year | — | — | — | ||||||||||||||||||||
| Total Adjustments | 1,028,837 | 24,158,036 | 3,155,907 | ||||||||||||||||||||
| Compensation Actually Paid | 9,305,917 | 36,768,404 | 8,152,797 | ||||||||||||||||||||
Fiscal year 2024 Compensation Actually Paid to our PEO and the average Compensation Actually Paid to non-PEOs reflects the following adjustments from the compensation reported in the “Total” column of the Summary Compensation Table:
| Jon Kessler ($) | Average Non-PEO ($) | |||||||||||||||||||
| Total Reported in Fiscal 2024 Summary Compensation Table | 13,448,018 | 3,877,526 | ||||||||||||||||||
| Less, value of awards reported in Summary Compensation Table | (11,926,568) | (2,998,267) | ||||||||||||||||||
Plus, year-end value of awards granted in fiscal year that are unvested and outstanding at the end of the fiscal year | 16,786,344 | 2,599,161 | ||||||||||||||||||
Plus, change in fair value of prior year awards that are unvested and outstanding at end of fiscal year | 4,864,518 | 644,799 | ||||||||||||||||||
| Plus, fair value of awards granted in fiscal year and that vested this fiscal year | — | — | ||||||||||||||||||
| Plus, change in fair value of prior year awards that vested this fiscal year | (259,359) | (18,191) | ||||||||||||||||||
| Less, fair value of prior year awards that failed to vest this fiscal year | — | (1,266,369) | ||||||||||||||||||
| Total Adjustments | 9,464,935 | 1,038,867 | ||||||||||||||||||
| Compensation Actually Paid | 22,912,953 | 2,838,659 | ||||||||||||||||||
Fiscal year 2023 Compensation Actually Paid to our PEO and the average Compensation Actually Paid to non-PEOs reflects the following adjustments from the compensation reported in the “Total” column of the Summary Compensation Table:
| Jon Kessler ($) | Average Non-PEO ($) | |||||||||||||||||||
| Total Reported in Fiscal 2023 Summary Compensation Table | 13,400,167 | 5,607,831 | ||||||||||||||||||
| Less, value of awards reported in Summary Compensation Table | (11,849,492) | (4,577,738) | ||||||||||||||||||
Plus, year-end value of awards granted in fiscal year that are unvested and outstanding at the end of the fiscal year | 10,550,461 | 3,376,855 | ||||||||||||||||||
Plus, change in fair value of prior year awards that are unvested and outstanding at end of fiscal year | 1,724,240 | 190,057 | ||||||||||||||||||
| Plus, fair value of awards granted in fiscal year and that vested this fiscal year | — | — | ||||||||||||||||||
| Plus, change in fair value of prior year awards that vested this fiscal year | 616,156 | 171,524 | ||||||||||||||||||
| Less, fair value of prior year awards that failed to vest this fiscal year | — | (726,245) | ||||||||||||||||||
| Total Adjustments | 1,041,365 | (1,565,547) | ||||||||||||||||||
| Compensation Actually Paid | 14,441,532 | 4,042,284 | ||||||||||||||||||
Fiscal year 2022 Compensation Actually Paid to our PEO and the average Compensation Actually Paid to Non-PEOs reflects the following adjustments from the compensation reported in the “Total” column of the Summary Compensation Table:
| Jon Kessler ($) | Average Non-PEO ($) | |||||||||||||||||||
| Total Reported in Fiscal 2022 Summary Compensation Table | 9,947,622 | 2,398,514 | ||||||||||||||||||
| Less, value of awards reported in Summary Compensation Table | (8,711,947) | (1,815,747) | ||||||||||||||||||
Plus, year-end value of awards granted in fiscal year that are unvested and outstanding at the end of the fiscal year | 5,685,079 | 1,256,445 | ||||||||||||||||||
Plus, change in fair value of prior year awards that are unvested and outstanding at end of fiscal year | (9,966,440) | (1,906,814) | ||||||||||||||||||
| Plus, fair value of awards granted in fiscal year and that vested this fiscal year | — | — | ||||||||||||||||||
| Plus, change in fair value of prior year awards that vested this fiscal year | (1,236,382) | (289,279) | ||||||||||||||||||
| Less, fair value of prior year awards that failed to vest this fiscal year | (1,210,639) | (266,308) | ||||||||||||||||||
| Total Adjustments | (15,440,329) | (3,021,703) | ||||||||||||||||||
| Compensation Actually Paid | (5,492,707) | (623,189) | ||||||||||||||||||
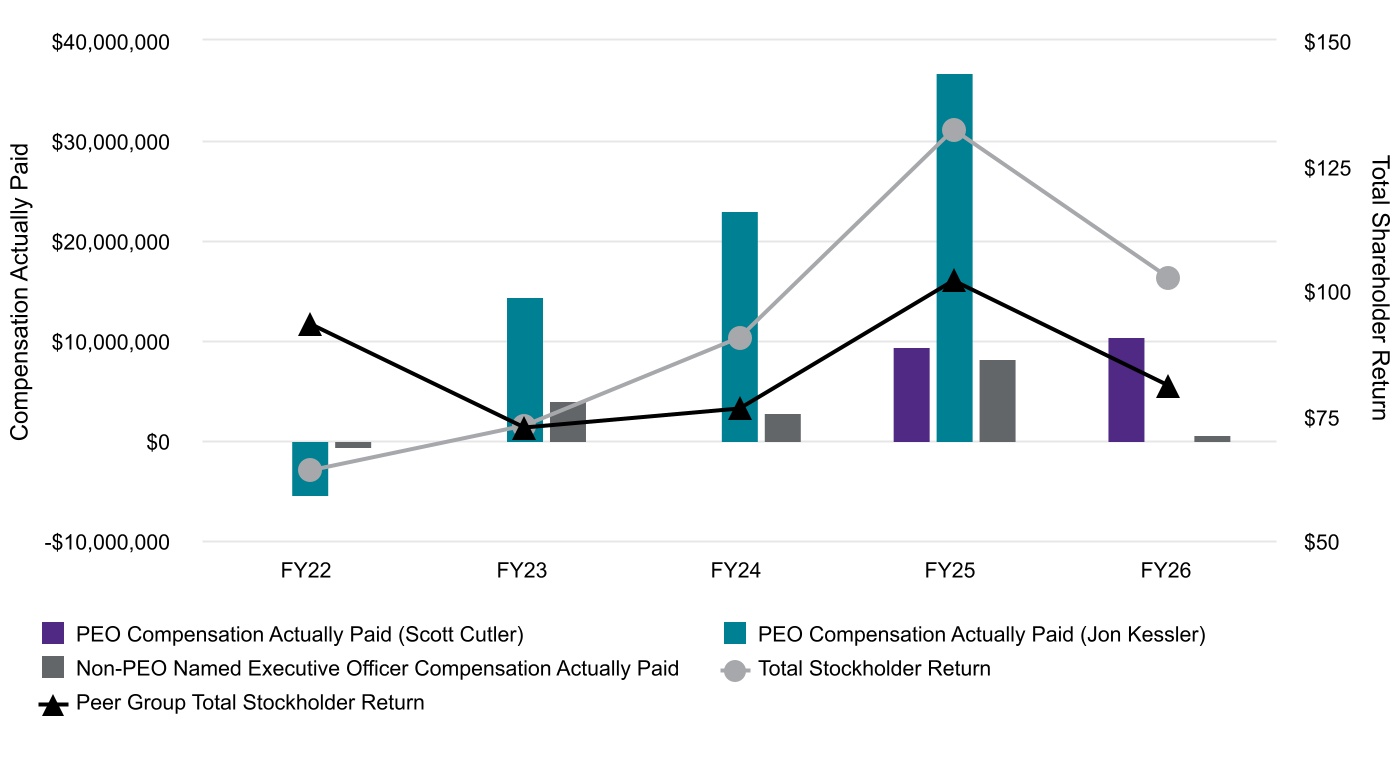
Compensation Actually Paid versus Total Stockholders’ Return
Compensation Actually Paid versus Net Income (Loss) and Adjusted EBITDA
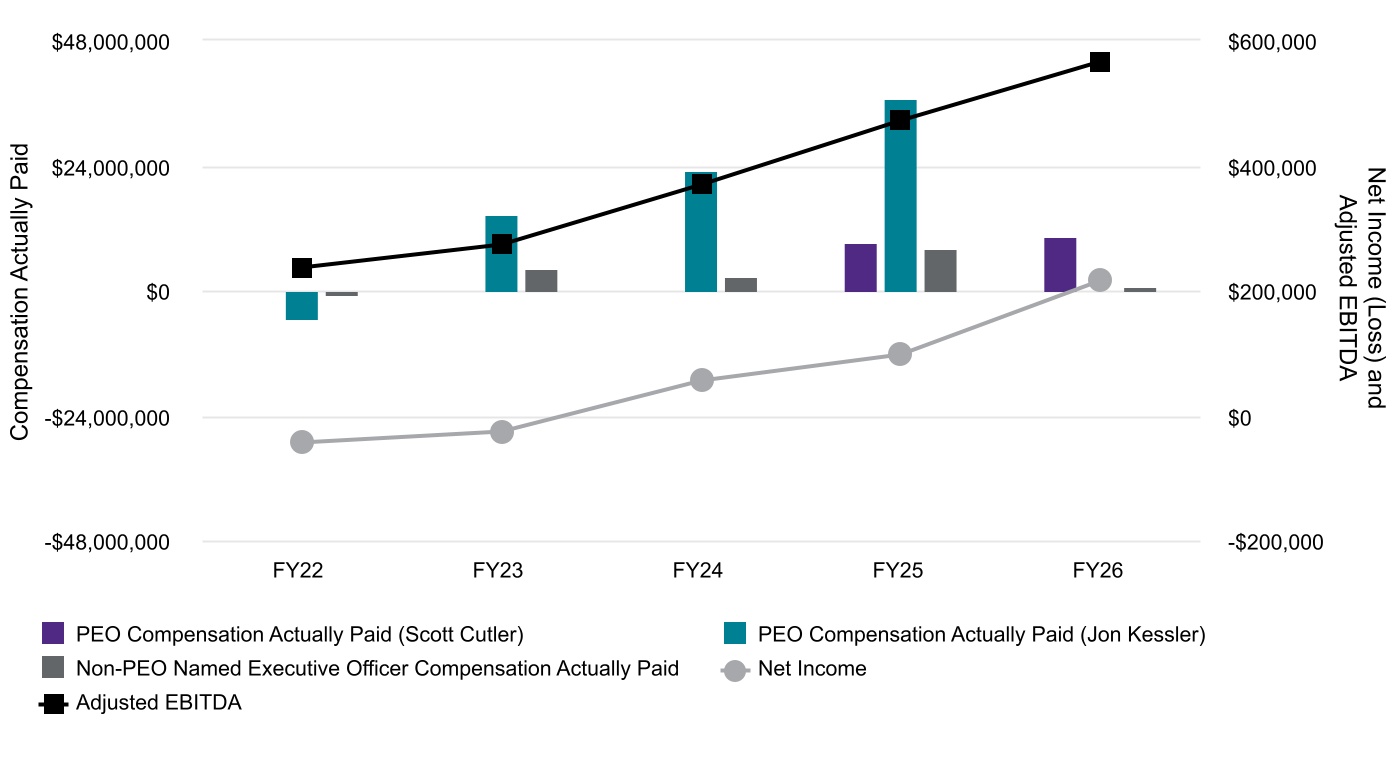
Compensation Actually Paid versus Net Income (Loss) and Adjusted EBITDA
Compensation Actually Paid versus Total Stockholders’ Return
Most Important Performance Measures for Fiscal 2026 | •Revenue | ||||||||||
•Adjusted EBITDA | |||||||||||
•New HSA sales | |||||||||||