Pay vs Performance Disclosure - USD ($)
Jan. 31, 2026
Jan. 31, 2025
Jan. 31, 2024
Jan. 31, 2023
Jan. 31, 2022
Value of Initial Fixed $100 Investment Based on: | ||||||||||||||||
Fiscal Year | Summary Compensation Table Total for CEO(1)(2) ($) | Compensation Actually Paid to CEO(3) ($) | Average Summary Compensation Table Total for Non-CEO NEOs(4) ($) | Average Summary Actually Paid to Non-CEO NEOs(5) ($) | Total Stockholder Return(6) ($) | Peer Group Total Stockholder Return(7) ($) | Net Income (Loss)(8) ($ millions) | ARR(9) ($ millions) | ||||||||
2026 ....... | 16,934,559 | (19,108,236) | 8,938,839 | 841,425 | 32.89 | 115.79 | (450.7) | 1,119.1 | ||||||||
2025 ....... | 18,965,466 | (7,254,842) | 8,046,082 | 1,646,566 | 56.35 | 131.92 | (288.4) | 920.1 | ||||||||
2024 ........ | 16,544,088 | 83,237,906 | 7,600,744 | 21,594,219 | 63.06 | 107.80 | (338.7) | 724.4 | ||||||||
2023 ....... | 13,522,362 | (183,133,426) | 8,746,750 | (11,381,739) | 35.51 | 72.30 | (378.7) | 521.7 | ||||||||
2022 ........ | 95,395,534 | 352,126,254 | 9,324,321 | 17,064,767 | 105.29 | 91.03 | (271.1) | 278.0 | ||||||||
fiscal 2022. Our Non-CEO NEOs for fiscal 2026 were Ms. Pinczuk, Ms. Larson and Messrs. Padgett, Conder, and Smith; for fiscal 2025 were
Ms. Larson, Messrs. Smith and Conder, Narayanan Srivatsan, and David Bernhardt; for fiscal 2024 were Messrs. Bernhardt, Smith, Conder, and
Srivatsan; and for fiscal 2023, were Messrs. Bernhardt, Smith, Conder, and Srivatsan, and Nicholas Warner; and for fiscal 2022, Messrs. Smith
and Conder.
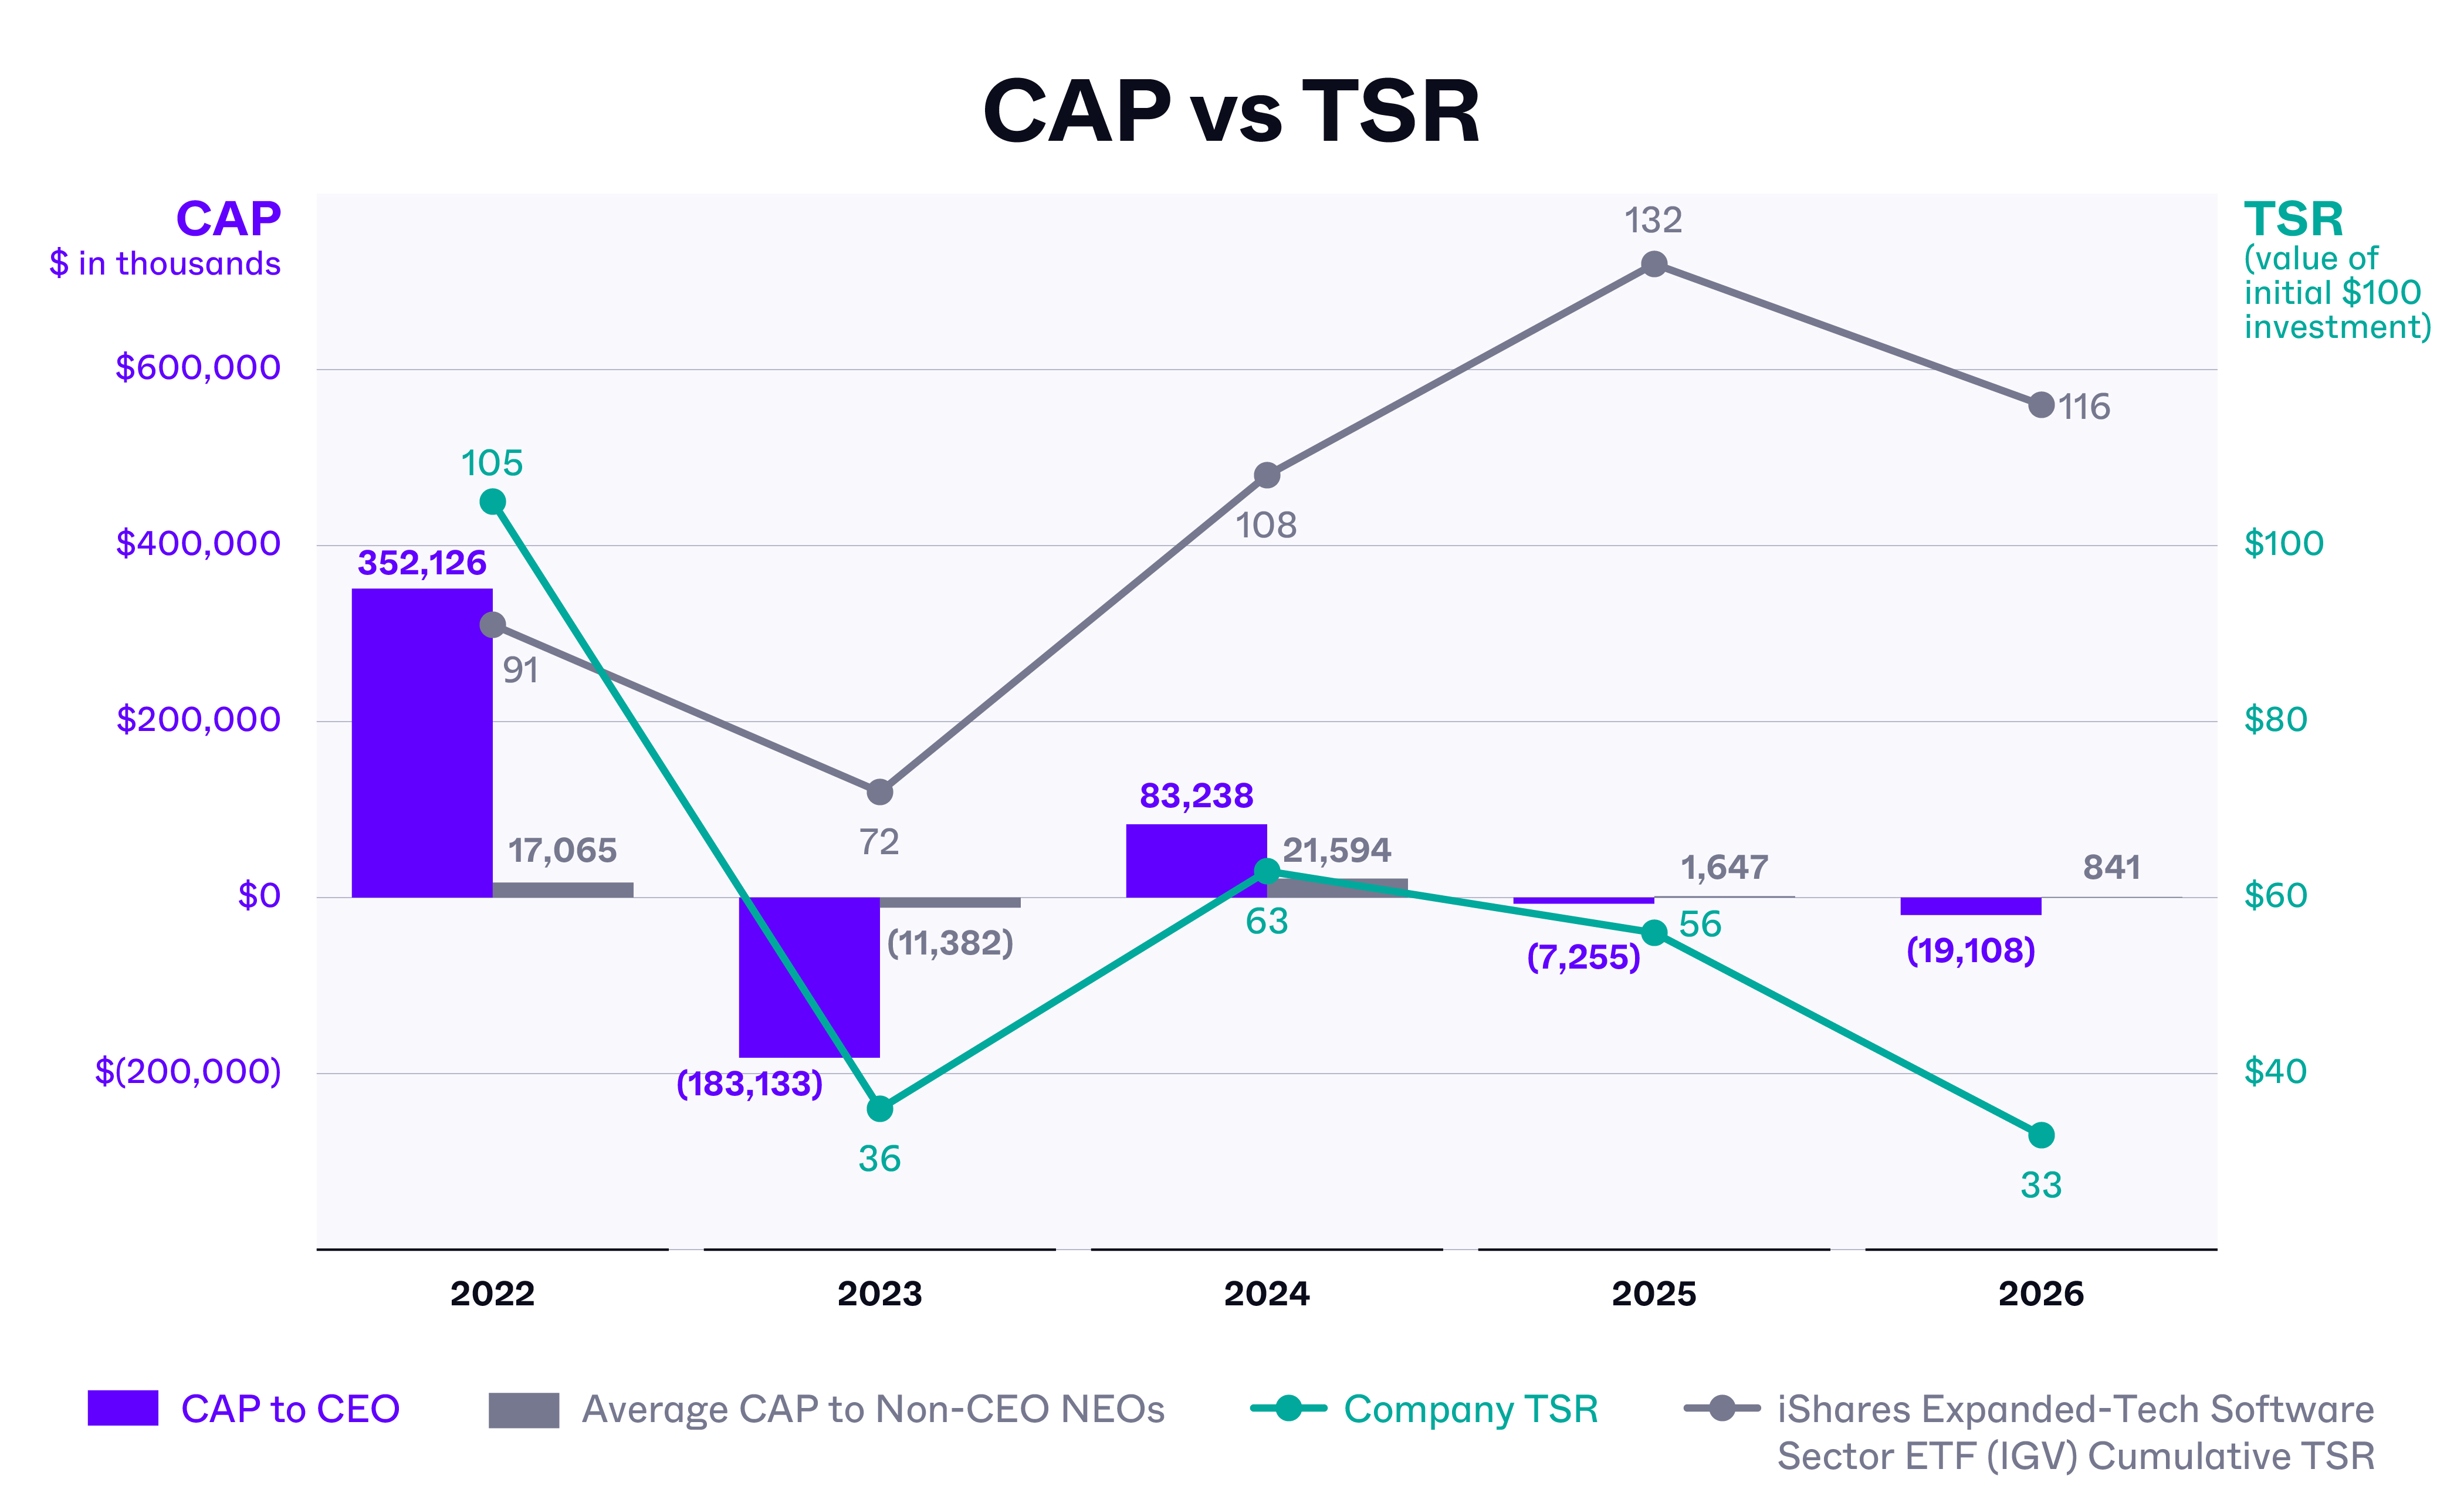
iShares Expanded-Tech Software Sector ETF (IGV) because we believe IGV more closely reflects the software sector in which we compete for
business and talent, and the substantial majority of our compensation peer group companies are constituents of IGV, while only a small number
are constituents of the S&P 500 Information Technology Index. The table above reflects IGV performance for all years presented, IGV is also
used in the stock performance graph required by Item 201(e) of Regulation S-K included in our Annual Report. This column assumes $100.00
was invested in this peer group on June 30, 2021 (same period as used for footnote (6) above). For comparison, under the S&P 500 Information
Technology Index which was previously used in the stock performance graph of our Annual Report and in the pay versus performance disclosure
in our 2025 proxy statement, the peer group total stockholder return would have been: $110.11 for fiscal 2022; $92.83 for fiscal 2023; $139.33
for fiscal 2024; $177.78 for fiscal 2025; and $223.35 for fiscal 2026.
year. The amounts reported in this column for fiscal 2026 were calculated by making the following adjustments to amounts reported for
Mr. Weingarten in the “Summary Compensation Table” in the “Total” column, in accordance with Item 402(v) of Regulation S-K:
a.We deducted $14.6 million reported in the Summary Compensation Table, reflecting the grant date fair value of awards.
b.We added $10.5 million reflecting the fair value of awards granted in the fiscal year that were outstanding and unvested as of the end of
the fiscal year.
c.We deducted $22.6 million representing the change in fair value of any awards granted in prior years that were outstanding and
unvested as of the end of the fiscal year.
d.We added $1.4 million representing the change in fair value of awards that were granted and vested in the same fiscal year.
e.We deducted $10.9 million representing the change in fair value for awards granted in prior years that vested in the fiscal year.
PSU awards granted in fiscal 2024 failed to meet vesting conditions as of January 31, 2024 and therefore are not included in the table above. No
dividends or earnings were paid, and there were no changes in pension values as we do not sponsor any pensions.
during the applicable year. The amounts reported in this column for fiscal 2026 were calculated by making the following adjustments to average
total compensation for the Non-CEO NEOs, using the same methodology described above in footnote (3):
a.We deducted $8.2 million reported in the Summary Compensation Table, reflecting the grant date fair value of awards.
b.We added $3.8 million reflecting the fair value of awards granted in the fiscal year that were outstanding and unvested as of the end of
the fiscal year.
c.We deducted $0.3 million representing the change in fair value of any awards granted in prior years that were outstanding and unvested
as of the end of the fiscal year.
d.We added $0.7 million representing the change in fair value of awards that were granted and vested in the same fiscal year.
e.We deducted $0.6 million representing the change in fair value for awards granted in prior years that vested in the fiscal year.
f.We deducted $3.5 million representing the fair value of awards as of the end of the prior fiscal year that were forfeited in the fiscal year.
No dividends or earnings were paid, and there were no changes in pension values as we do not sponsor any pensions.
Below is a graph showing the relationship of compensation actually paid to our CEO and Non-CEO NEOs for
fiscal 2022, fiscal 2023, fiscal 2024, fiscal 2025, and fiscal 2026 to total stockholder return (“TSR”) of both our
Class A common stock and the iShares Expanded-Tech Software Sector ETF.
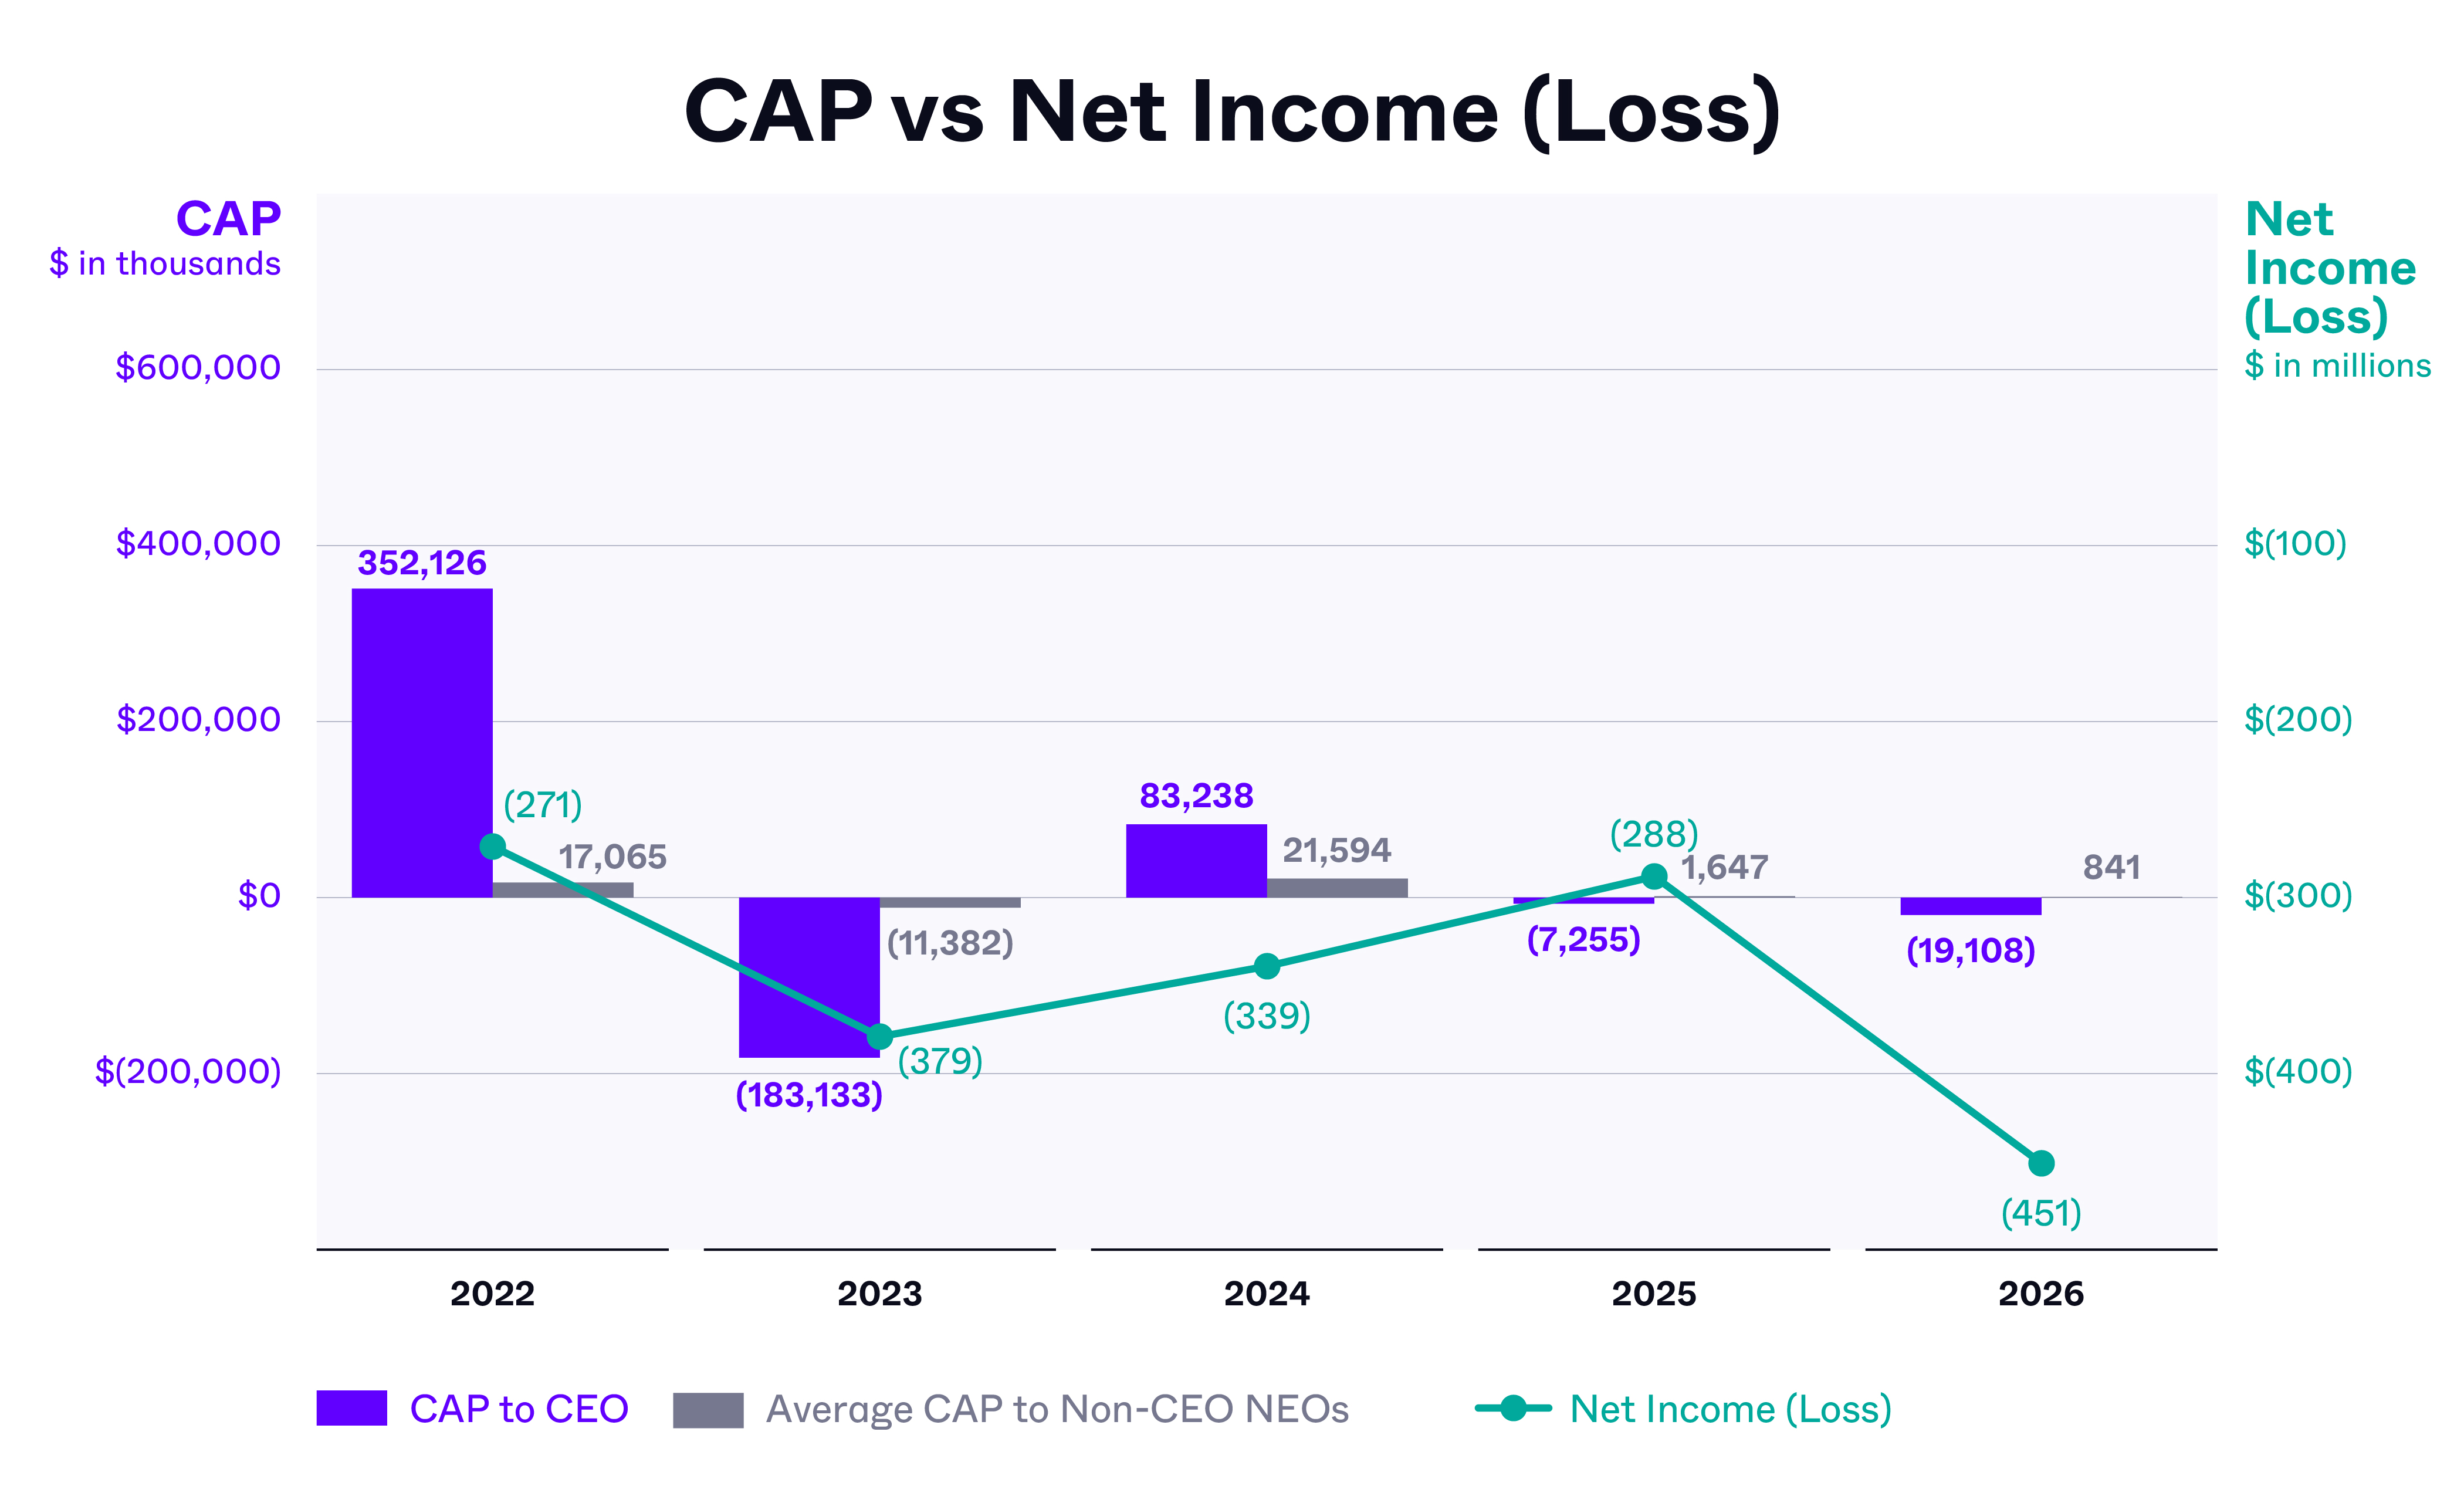
Below is a graph showing the relationship of compensation actually paid to our CEO and Non-CEO NEOs for
fiscal 2022, fiscal 2023, fiscal 2024, fiscal 2025, and fiscal 2026 to our net income (loss).
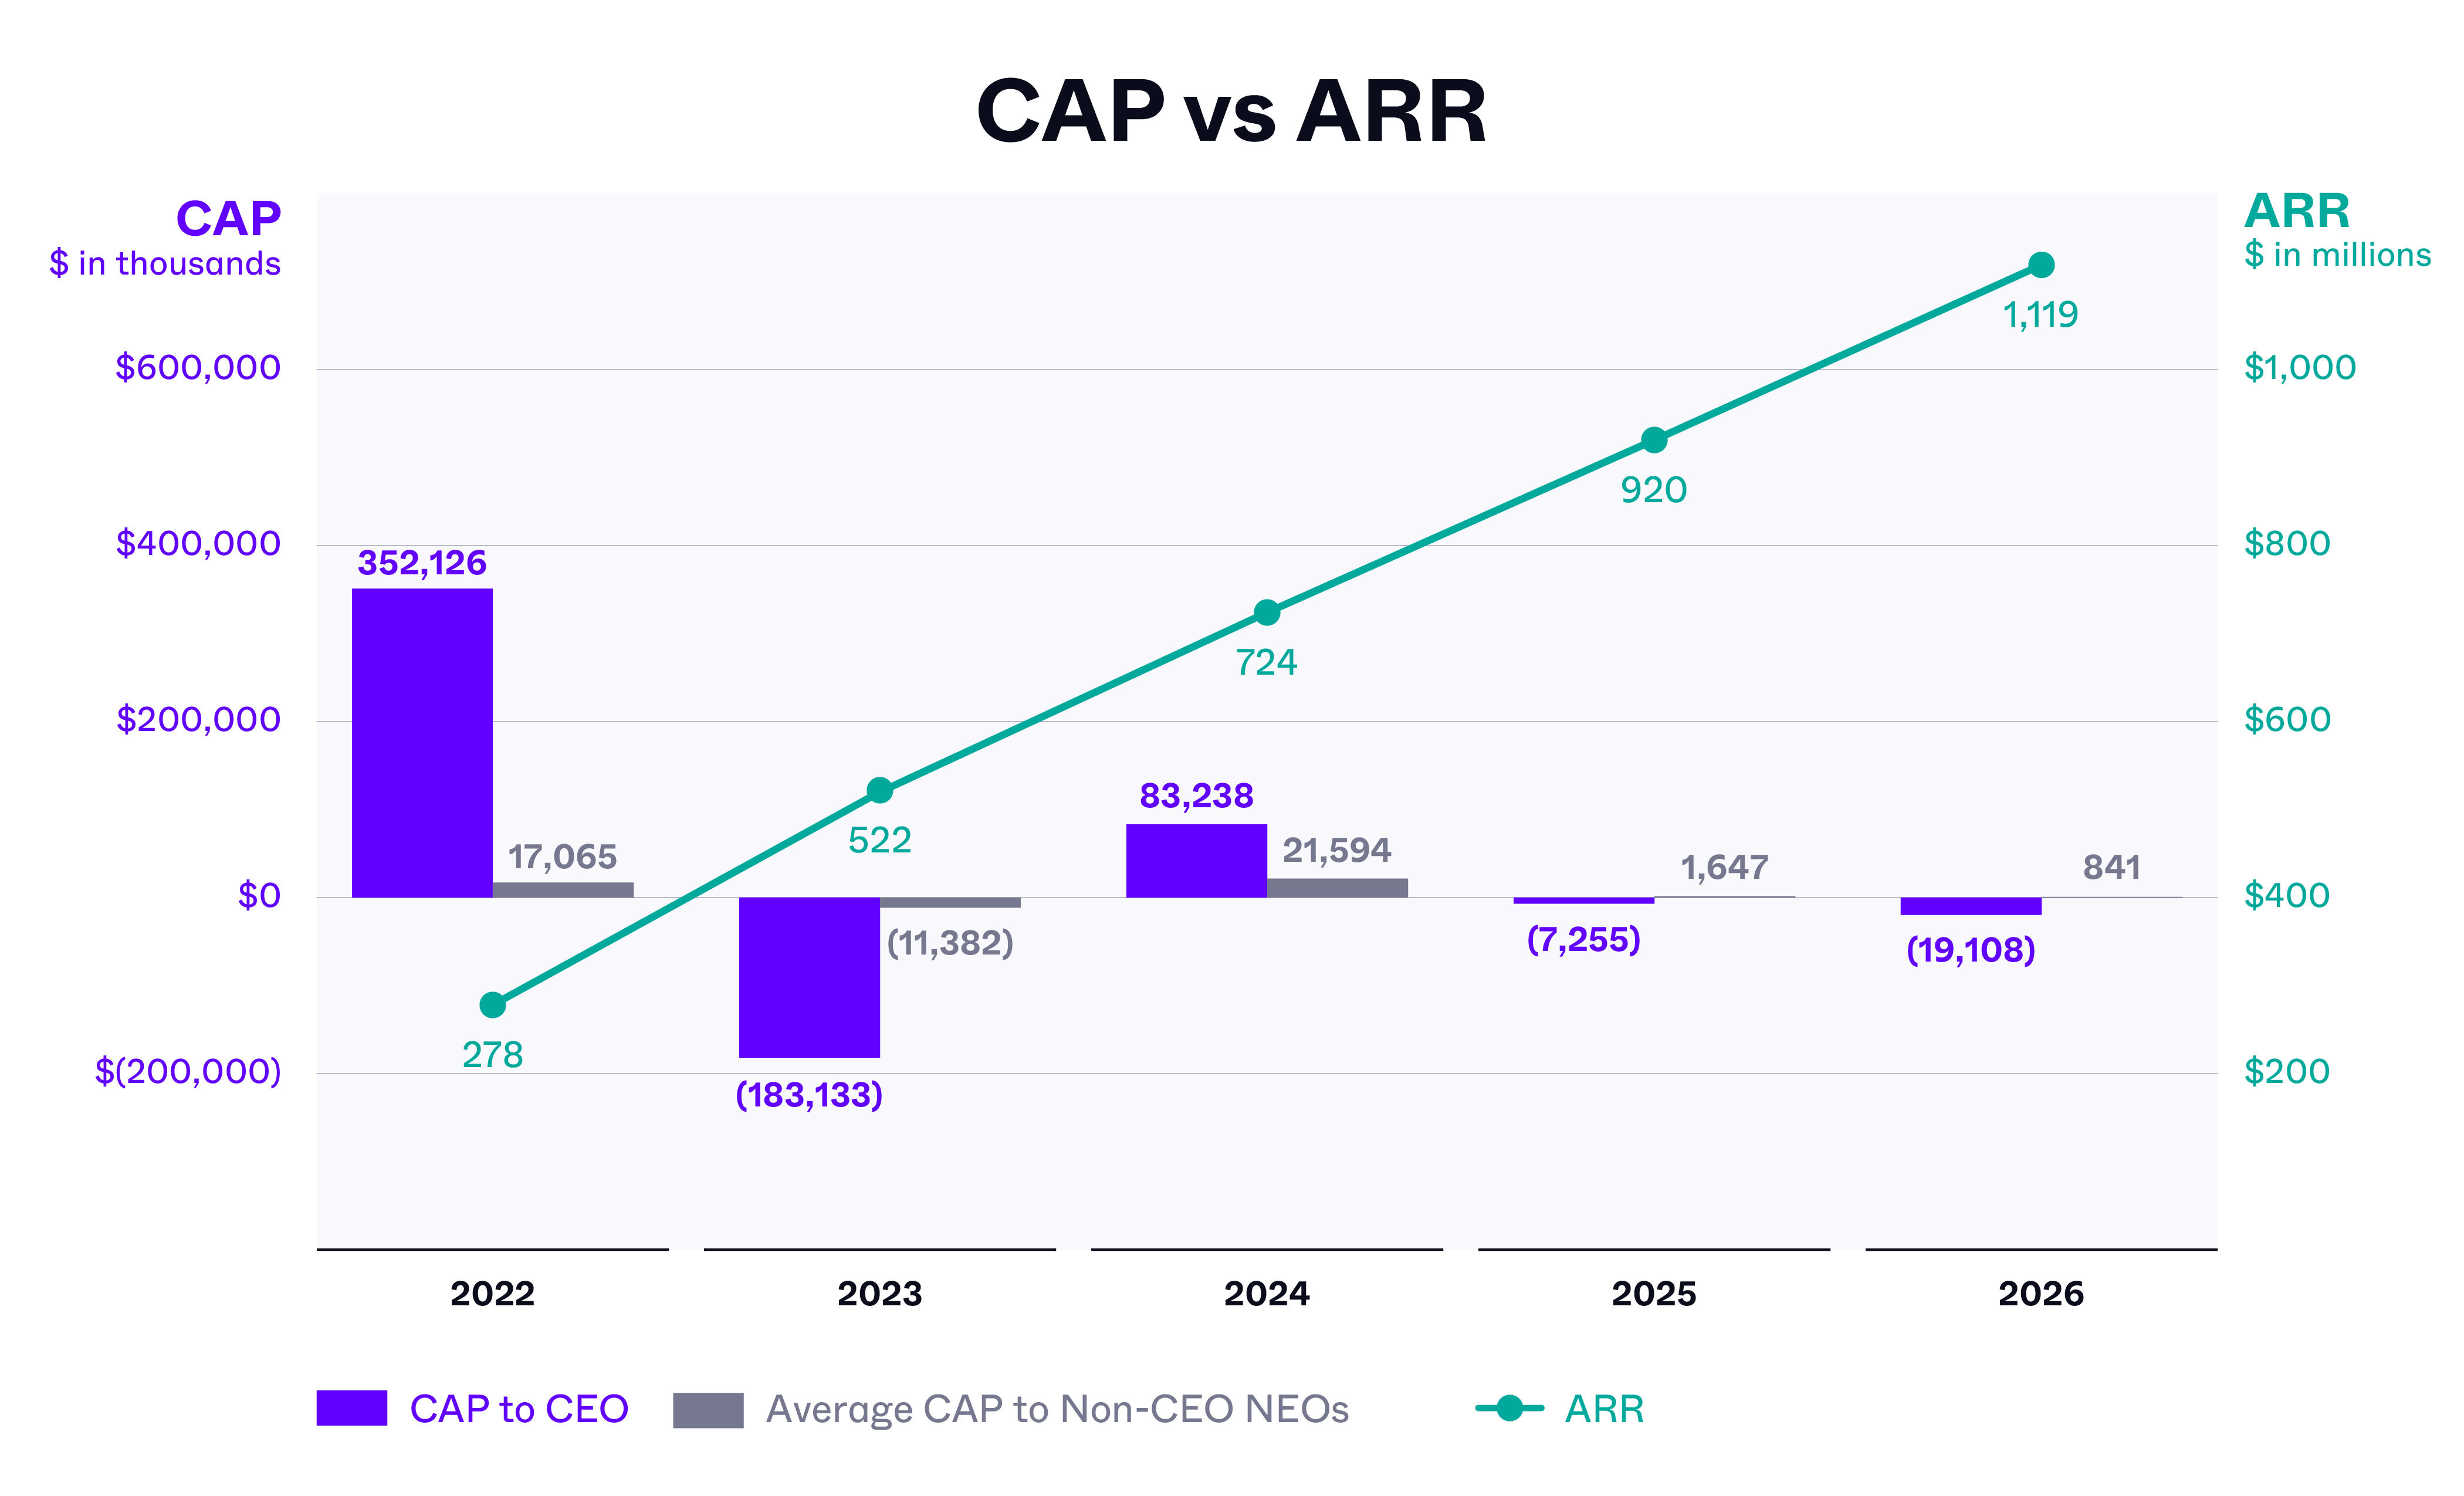
Below is a graph showing the relationship of compensation actually paid to our CEO and Non-CEO NEOs for fiscal
2022, fiscal 2023, fiscal 2024, fiscal 2025, and fiscal 2026 to our ARR.
Below is a graph showing the relationship of compensation actually paid to our CEO and Non-CEO NEOs for
fiscal 2022, fiscal 2023, fiscal 2024, fiscal 2025, and fiscal 2026 to total stockholder return (“TSR”) of both our
Class A common stock and the iShares Expanded-Tech Software Sector ETF.
Financial Performance Measures |
ARR |
Revenue |
Non-GAAP Operating Margin |
Stock Price |
for our CEO and (ii) the average of the total compensation reported in the Summary Compensation Table for the applicable year for our Non-
CEO NEOs.
Represents, for each applicable year, the average of the amounts reported in the “Summary Compensation Table” in the “Total” column for the Non-CEO NEOs as a group. The Non-CEO NEOs included for purposes of calculating the average amounts in each applicable year are as
follows: for fiscal 2026, Ms. Pinczuk, Ms. Larson and Messrs. Padgett, Conder and Smith; for fiscal 2025 Messrs. Bernhardt, Conder, Smith, and
Srivatsan and Ms. Larson; for fiscal 2024, Messrs. Bernhardt, Conder, Smith, and Srivatsan; for fiscal 2023, Messrs. Bernhardt, Conder, Smith,
Srivatsan, and Warner; and for fiscal 2022, Messrs. Smith and Conder. Mr. Warner received a lump sum severance payment of $225,000 in fiscal
2023 in connection with his resignation on November 7, 2022.
Assumes an initial investment of $100.00 in our Class A common stock on June 30, 2021, the date of our initial public offering. Historic stock price performance is not necessarily indicative of future stock price performance. There were no dividends or other earnings paid in the covered
fiscal years.
The amounts shown reflect the net loss reported in our audited financial statements for the applicable fiscal year.We selected ARR as our company-selected measure because in fiscal 2026, the annual cash incentive was linked to ARR. We view ARR as the key indicator of the growth and momentum of our business, providing forward visibility into recurring revenue and reflecting customer
retention and expansion, and we believe it is among the most closely followed metrics by investors and analysts in evaluating our performance
and long-term value.