Pay vs Performance Disclosure - USD ($)
|
12 Months Ended |
Dec. 31, 2025 |
Dec. 31, 2024 |
Dec. 31, 2023 |
| Pay vs Performance Disclosure [Table] |
|
|
|
|
| Pay vs Performance [Table Text Block] |
|
| Year | |
Summary
Compensation Table Total
for
PEO(1) | | |
Compensation
Actually Paid to
PEO(3) | | |
Average
Summary
Compensation
Table
Total for
non-PEO
Named
Executive
Officers(2) | | |
Average
Compensation
Actually Paid to
non-PEO
Named
Executive
Officers(2)(3) | | |
Value
of Initial
Fixed $100
Investment
Based On
Total
Shareholder Return (4) | | |
Net Loss | |
| 2025 | |
$ | 1,005,113 | | |
$ | 518,546 | | |
$ | 448,247 | | |
$ | 239,267 | | |
$ | 76.42 | | |
$ | 7,364,628 | |
| 2024 | |
$ | 1,039,797 | | |
$ | 1,077,080 | | |
$ | 448,670 | | |
$ | 434,734 | | |
$ | 39.77 | | |
$ | 5,809,159 | |
| 2023 | |
$ | 1,044,244 | | |
$ | 1,112,177 | | |
$ | 424,939 | | |
$ | 472,382 | | |
$ | 29.93 | | |
$ | 6,795,461 | |
|
|
|
| Named Executive Officers, Footnote [Text Block] |
|
| (1) |
For
each of the years presented, the principal executive officer (“PEO”) is Mark Emalfarb. |
|
|
|
| PEO Total Compensation Amount |
[1] |
$ 1,005,113
|
$ 1,039,797
|
$ 1,044,244
|
| PEO Actually Paid Compensation Amount |
[2] |
$ 518,546
|
1,077,080
|
1,112,177
|
| Adjustment To PEO Compensation, Footnote [Text Block] |
|
| | |
PEO | | |
Average for Non-PEO NEOs | |
| | |
2025 | |
| | |
PEO | | |
Average for Non-PEO NEOs | |
| Deduction for amounts reported under the “Stock Awards” column in the Summary Compensation Table | |
| | | |
| | |
| Deduction for amounts reported under the “Option Awards” column in the Summary Compensation Table | |
$ | (192,220 | ) | |
$ | (86,194 | ) |
| Increase for fair value of awards granted during covered year that remain outstanding and unvested as of covered year end | |
| 82,567 | | |
| 41,018 | |
| Increase for fair value of awards granted during covered year that vested during covered year | |
| - | | |
| - | |
| Increase/deduction for change in fair value from prior year-end to covered year-end of awards granted prior to covered year that were outstanding and unvested as of year-end | |
| (176,132 | ) | |
| (70,956 | ) |
| Increase/deduction for change in fair value from prior year-end to vesting date of awards granted prior to covered year that vested during covered year | |
| (200,782 | ) | |
| (61,903 | ) |
| Deduction of fair value of awards granted prior to covered year that were forfeited during covered year | |
| - | | |
| (30,945 | ) |
| Increase based upon incremental fair value of awards modified during year | |
| - | | |
| - | |
| Total Adjustments | |
| (486,567 | ) | |
| (208,980 | ) |
| Summary Compensation Table Total Compensation | |
| 1,005,113 | | |
| 448,247 | |
| PEO Total Compensation Amount | |
| 1,005,113 | | |
| 448,247 | |
| Compensation Actually Paid | |
$ | 518,546 | | |
$ | 239,267 | |
| PEO Actually Paid Compensation Amount | |
| 518,546 | | |
| 239,267 | |
|
|
|
| Non-PEO NEO Average Total Compensation Amount |
[3] |
$ 448,247
|
448,670
|
424,939
|
| Non-PEO NEO Average Compensation Actually Paid Amount |
[2],[3] |
$ 239,267
|
434,734
|
472,382
|
| Compensation Actually Paid vs. Total Shareholder Return |
|
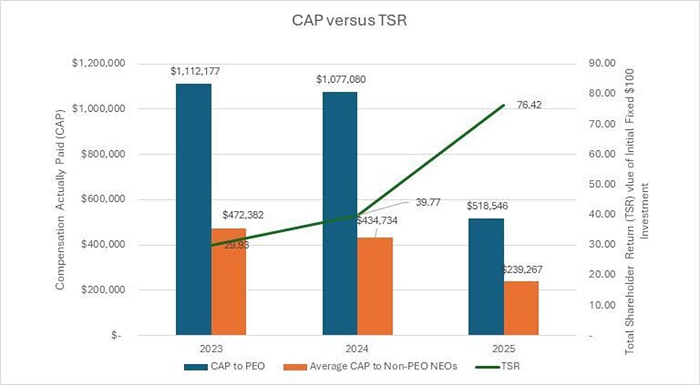
Relationship
Between “Compensation Actually Paid” and Total Shareholder Return
The
following chart below addresses the relationship between compensation “actually paid” as disclosed in the Pay vs. Performance
Table and the Company’s cumulative total shareholder return (“TSR”).
|
|
|
| Compensation Actually Paid vs. Net Income |
|
Relationship
Between “Compensation Actually Paid” and Net Loss
As
an early-stage growth company that has only generated net losses, we do not view our net income (loss) as a meaningful measure of our
performance that is relevant to our executive compensation program. Dyadic’s net loss was approximately $6.8 million
in 2023, $5.8 million
in 2024 and $7.4 million
in 2025. Mr. Emalfarb’s “compensation actually paid” was $1,112,177,
$1,077,080,
and $518,546 in
the corresponding years and the average “compensation actually paid” to Dyadic’s non-PEO NEOs was $472,382,
$434,734 and
$239,267.
|
|
|
| Total Shareholder Return Amount |
[4] |
$ 76.42
|
39.77
|
29.93
|
| Net Income (Loss) Attributable to Parent |
|
$ 7,364,628
|
$ 5,809,159
|
$ 6,795,461
|
| PEO Name |
|
Mark Emalfarb
|
Mark Emalfarb
|
Mark Emalfarb
|
| Additional 402(v) Disclosure [Text Block] |
|
Compensation
“actually paid” is calculated in accordance with Item 402(v) of Regulation S-K.
|
|
|
| PEO [Member] |
|
|
|
|
| Pay vs Performance Disclosure [Table] |
|
|
|
|
| PEO Total Compensation Amount |
|
|
$ 1,005,113
|
|
| PEO Actually Paid Compensation Amount |
|
|
518,546
|
|
| Total Adjustments |
|
|
(486,567)
|
|
| PEO [Member] | Deduction For Amounts Reported Under The Option Awards Column In The Summary Compensation Table [Member] |
|
|
|
|
| Pay vs Performance Disclosure [Table] |
|
|
|
|
| Total Adjustments |
|
|
(192,220)
|
|
| PEO [Member] | Increase For Fair Value Of Awards Granted During Covered Year That Remain Outstanding And Unvested As Of Covered Year End [Member] |
|
|
|
|
| Pay vs Performance Disclosure [Table] |
|
|
|
|
| Total Adjustments |
|
|
82,567
|
|
| PEO [Member] | Increase For Fair Value Of Awards Granted During Covered Year That Vested During Covered Year [Member] |
|
|
|
|
| Pay vs Performance Disclosure [Table] |
|
|
|
|
| Total Adjustments |
|
|
|
|
| PEO [Member] | Increase Deduction For Change In Fair Value From Prior Year End To Covered Year End Of Awards Granted Prior To Covered Year That Were Outstanding And Unvested As Of Year End [Member] |
|
|
|
|
| Pay vs Performance Disclosure [Table] |
|
|
|
|
| Total Adjustments |
|
|
(176,132)
|
|
| PEO [Member] | Increase Deduction For Change In Fair Value From Prior Year End To Vesting Date Of Awards Granted Prior To Covered Year That Vested During Covered Year [Member] |
|
|
|
|
| Pay vs Performance Disclosure [Table] |
|
|
|
|
| Total Adjustments |
|
|
(200,782)
|
|
| PEO [Member] | Deduction Of Fair Value Of Awards Granted Prior To Covered Year That Were Forfeited During Covered Year [Member] |
|
|
|
|
| Pay vs Performance Disclosure [Table] |
|
|
|
|
| Total Adjustments |
|
|
|
|
| PEO [Member] | Increase Based Upon Incremental Fair Value Of Awards Modified During Year [Member] |
|
|
|
|
| Pay vs Performance Disclosure [Table] |
|
|
|
|
| Total Adjustments |
|
|
|
|
| Non-PEO NEO [Member] |
|
|
|
|
| Pay vs Performance Disclosure [Table] |
|
|
|
|
| PEO Total Compensation Amount |
|
|
448,247
|
|
| PEO Actually Paid Compensation Amount |
|
|
239,267
|
|
| Total Adjustments |
|
|
(208,980)
|
|
| Non-PEO NEO [Member] | Deduction For Amounts Reported Under The Option Awards Column In The Summary Compensation Table [Member] |
|
|
|
|
| Pay vs Performance Disclosure [Table] |
|
|
|
|
| Total Adjustments |
|
|
(86,194)
|
|
| Non-PEO NEO [Member] | Increase For Fair Value Of Awards Granted During Covered Year That Remain Outstanding And Unvested As Of Covered Year End [Member] |
|
|
|
|
| Pay vs Performance Disclosure [Table] |
|
|
|
|
| Total Adjustments |
|
|
41,018
|
|
| Non-PEO NEO [Member] | Increase For Fair Value Of Awards Granted During Covered Year That Vested During Covered Year [Member] |
|
|
|
|
| Pay vs Performance Disclosure [Table] |
|
|
|
|
| Total Adjustments |
|
|
|
|
| Non-PEO NEO [Member] | Increase Deduction For Change In Fair Value From Prior Year End To Covered Year End Of Awards Granted Prior To Covered Year That Were Outstanding And Unvested As Of Year End [Member] |
|
|
|
|
| Pay vs Performance Disclosure [Table] |
|
|
|
|
| Total Adjustments |
|
|
(70,956)
|
|
| Non-PEO NEO [Member] | Increase Deduction For Change In Fair Value From Prior Year End To Vesting Date Of Awards Granted Prior To Covered Year That Vested During Covered Year [Member] |
|
|
|
|
| Pay vs Performance Disclosure [Table] |
|
|
|
|
| Total Adjustments |
|
|
(61,903)
|
|
| Non-PEO NEO [Member] | Deduction Of Fair Value Of Awards Granted Prior To Covered Year That Were Forfeited During Covered Year [Member] |
|
|
|
|
| Pay vs Performance Disclosure [Table] |
|
|
|
|
| Total Adjustments |
|
|
(30,945)
|
|
| Non-PEO NEO [Member] | Increase Based Upon Incremental Fair Value Of Awards Modified During Year [Member] |
|
|
|
|
| Pay vs Performance Disclosure [Table] |
|
|
|
|
| Total Adjustments |
|
|
|
|
|
|