Exhibit 99.2 INVESTOR DAY 2026 May 12, 2026 1 midera.com Keep in touch
Forward-Looking and Non-GAAP Statements Safe Harbor Statement This presentation contains “forward-looking statements” subject to the Private Securities Litigation Reform Act of 1995, including statements regarding The Middleby Corporation’s (“Middleby”) and Midera Food Processing, Inc.’s (“Midera” and taken together with Middleby, the “Company”) expectations with respect to the Company’s future performance. The Company cautions investors that such statements are estimates of future performance and are highly dependent upon a variety of factors. These forward-looking statements involve known and unknown risks, uncertainties and other factors, which could cause the Company’s actual results, performance or outcomes to differ materially from those expressed or implied in the forward-looking statements. The following are some of the important factors that could cause the Company’s actual results, performance or outcomes to differ materially from those discussed in the forward-looking statements: changing market conditions; volatility in earnings resulting from goodwill impairment losses, which may occur irregularly and in varying amounts; variability in financing costs and interest rates; quarterly variations in operating results; dependence on key customers; risks associated with the Company’s foreign operations, including international exposure, political risks affecting international sales, market acceptance and demand for the Company's products and the Company’s ability to manage the risk associated with the exposure to foreign currency exchange rate fluctuations; the Company’s ability to protect its trademarks, copyrights and other intellectual property; changing market conditions, including inflation; the impact of competitive products and pricing; the impact of announced management and organizational changes; intense competition in the Company's business segments including the impact of both new and established global competitors; unfavorable tax law changes and tax authority rulings; cybersecurity attacks and other breaches in security; the continued ability to realize profitable growth through the sourcing and completion of strategic acquisitions; the timely development and market acceptance of the Company's products; the availability and cost of raw materials; the possibility that the proposed spin-off of Midera will not be consummated within the anticipated time period or at all, including as the result of regulatory, market or other factors, including the possibility that various closing conditions for the spin-off may not be satisfied; the potential disruption to the Company’s business in connection with the proposed spin-off; the potential that the Company does not realize all of the expected benefits of the spin-off; that the spin-off may be more difficult, time consuming or costly than expected; the failure of the spin-off to qualify for the expected tax treatment; potential adverse effects of the announcement of the proposed spin-off of Midera or the results thereof, including on the market price of the Company's common stock, the ability of the Company to develop and maintain relationships with personnel, customers, suppliers and others with whom it does business or the Company’s business, financial condition, results of operations and financial performance; risks related to diversion of the Company’s management's attention from its ongoing business operations due to the proposed spin-off of Midera; and other risks detailed in the Company’s U.S. Securities and Exchange Commission (“SEC”) filings. All forward-looking statements are expressly qualified in their entirety by these cautionary statements. The forward-looking statements included in this presentation are made only as of the date hereof and, except as required by federal securities laws and rules and regulations of the SEC, the Company undertakes no obligation to publicly update or revise any forward-looking statements, whether as a result of new information, future events or otherwise. Non-GAAP Financial Measures This presentation contains information about the Company’s financial results which is not presented in accordance with accounting principles generally accepted in the United States (“GAAP”). The Company refers to these measures as “non-GAAP” financial measures. The Appendix provides definitions and historical reconciliations to the most directly comparable GAAP financial measures for the non-GAAP financial measures included in this presentation. Reconciliations of forward-looking non-GAAP financial measures to the most directly comparable GAAP financial measures are not available because the timing and magnitude of certain items cannot be reasonably estimated at this time without unreasonable effort. The non-GAAP financial measures disclosed by the Company should not be considered a substitute for, or superior to, financial measures prepared in accordance with GAAP, and the financial results prepared in accordance with GAAP. In addition, the non-GAAP financial measures included in this presentation do not have standard meanings and may vary from similarly titled non-GAAP financial measures used by other companies. The Company believes that its presentation of non-GAAP financial measures is useful because it provides investors and securities analysts with the same information that it uses internally for purposes of assessing its core operating and financial performance. 2

Agenda Mark Salman Chief Executive Officer Midera Strategy 1:00pm Aftermarket & 1:30pm Mark Bowie Chief Operating Officer Operations Peter Jongen Protein Overview of Market 1:45pm Andrea Colussi Bakery Categories Scott Ruhe Snack Matt Fuchsen Chief Strategy Officer 2:15pm M&A Strategy Amy Campbell Chief Financial Officer 2:30pm Financial Overview 3:00pm Q&A Session 3

1 Company Overview 4
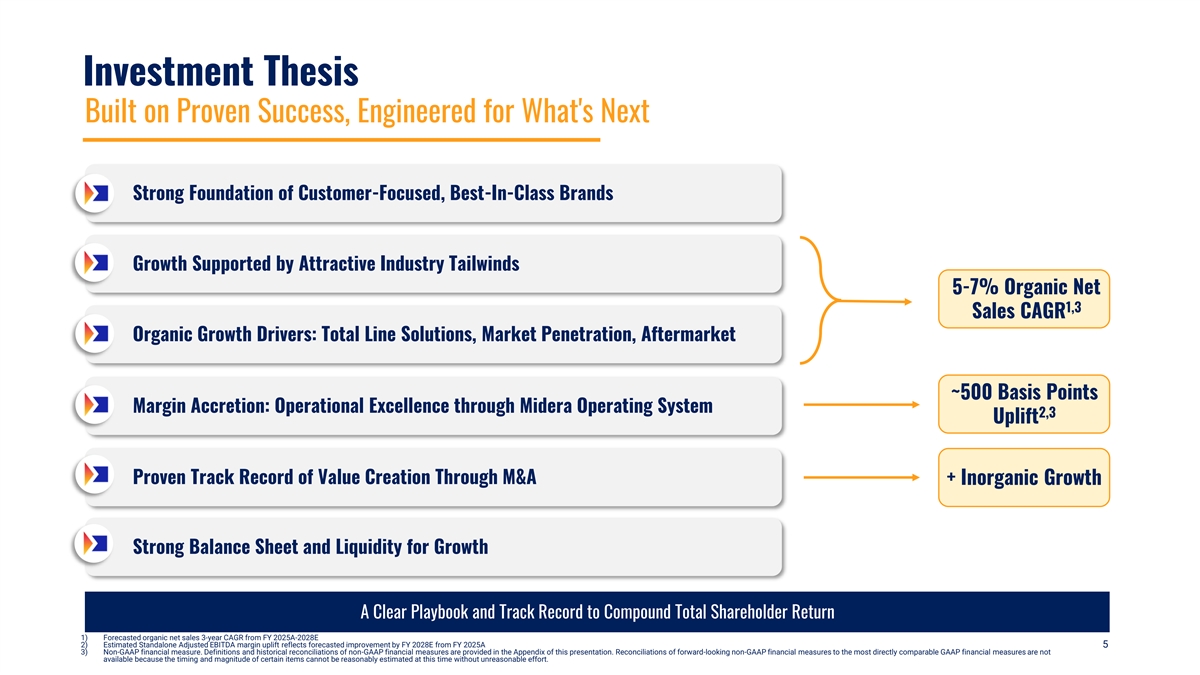
Investment Thesis Built on Proven Success, Engineered for What's Next Strong Foundation of Customer-Focused, Best-In-Class Brands Growth Supported by Attractive Industry Tailwinds 5-7% Organic Net 1,3 Sales CAGR Organic Growth Drivers: Total Line Solutions, Market Penetration, Aftermarket ~500 Basis Points Margin Accretion: Operational Excellence through Midera Operating System 2,3 Uplift Proven Track Record of Value Creation Through M&A + Inorganic Growth Strong Balance Sheet and Liquidity for Growth A Clear Playbook and Track Record to Compound Total Shareholder Return 1) Forecasted organic net sales 3-year CAGR from FY 2025A-2028E 2) Estimated Standalone Adjusted EBITDA margin uplift reflects forecasted improvement by FY 2028E from FY 2025A 5 3) Non-GAAP financial measure. Definitions and historical reconciliations of non-GAAP financial measures are provided in the Appendix of this presentation. Reconciliations of forward-looking non-GAAP financial measures to the most directly comparable GAAP financial measures are not available because the timing and magnitude of certain items cannot be reasonably estimated at this time without unreasonable effort.
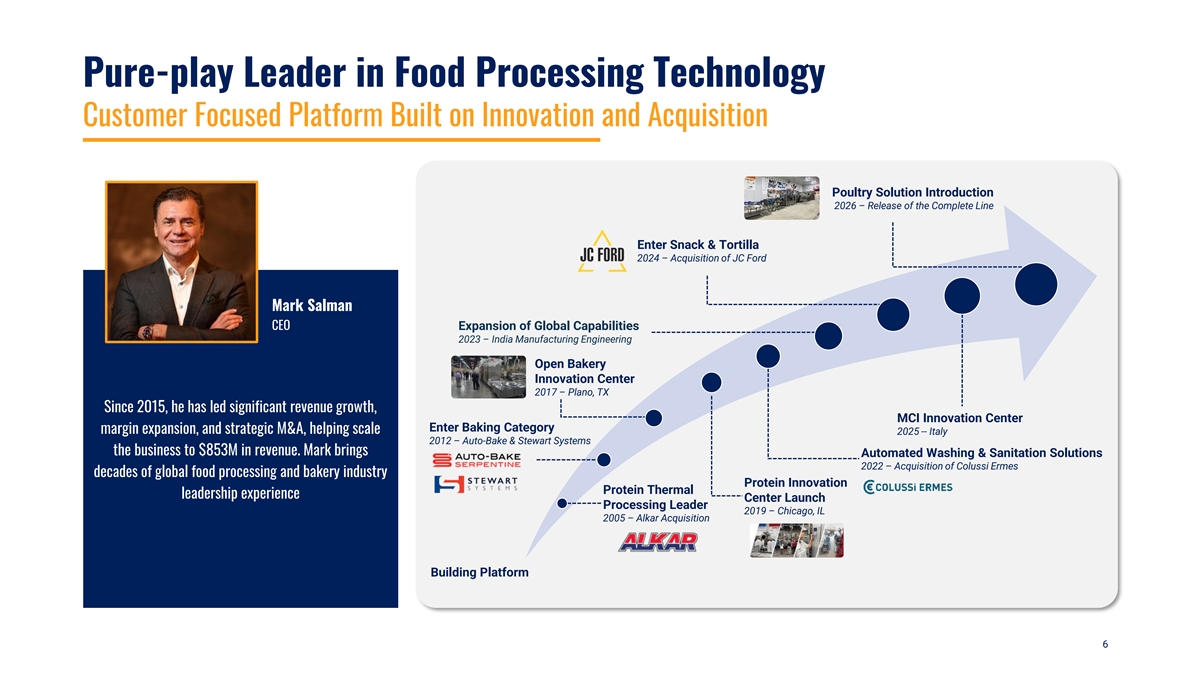
Pure-play Leader in Food Processing Technology Customer Focused Platform Built on Innovation and Acquisition Poultry Solution Introduction 2026 – Release of the Complete Line Enter Snack & Tortilla 2024 – Acquisition of JC Ford Mark Salman CEO Expansion of Global Capabilities 2023 – India Manufacturing Engineering Open Bakery Innovation Center 2017 – Plano, TX Since 2015, he has led significant revenue growth, MCI Innovation Center Enter Baking Category margin expansion, and strategic M&A, helping scale 2025 -- Italy 2012 – Auto-Bake & Stewart Systems the business to $853M in revenue. Mark brings Automated Washing & Sanitation Solutions 2022 – Acquisition of Colussi Ermes decades of global food processing and bakery industry Protein Innovation Protein Thermal leadership experience Center Launch Processing Leader 2019 – Chicago, IL 2005 – Alkar Acquisition Building Platform 6
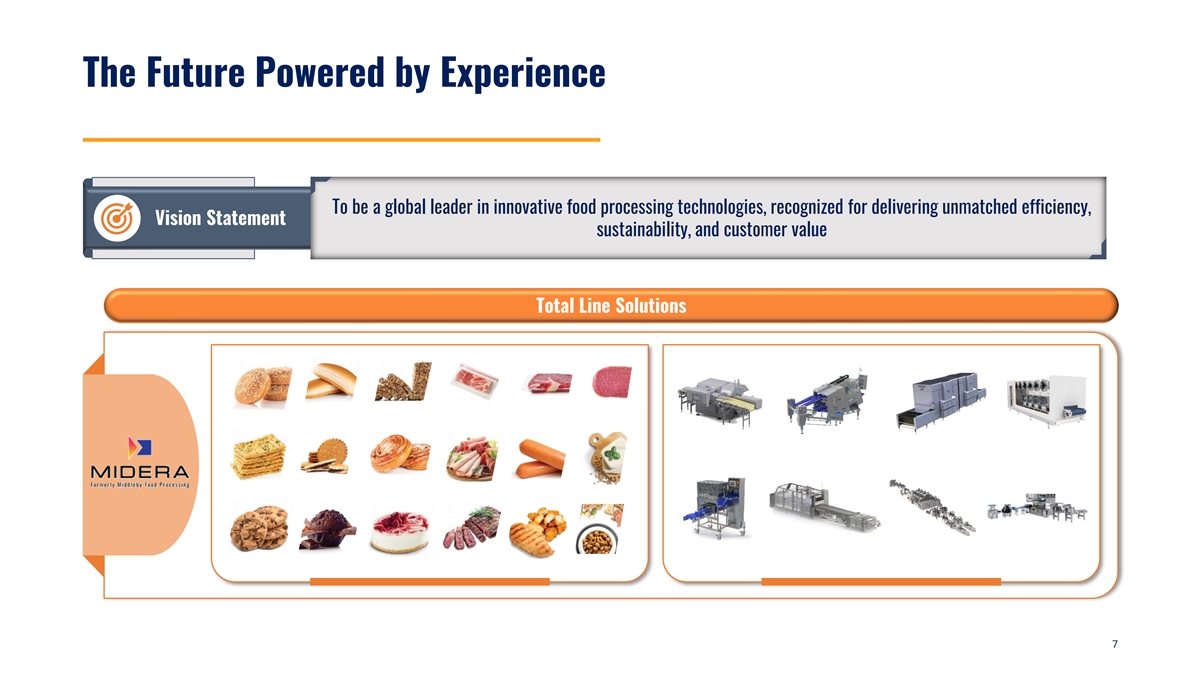
The Future Powered by Experience To be a global leader in innovative food processing technologies, recognized for delivering unmatched efficiency, Vision Statement sustainability, and customer value Total Line Solutions 7
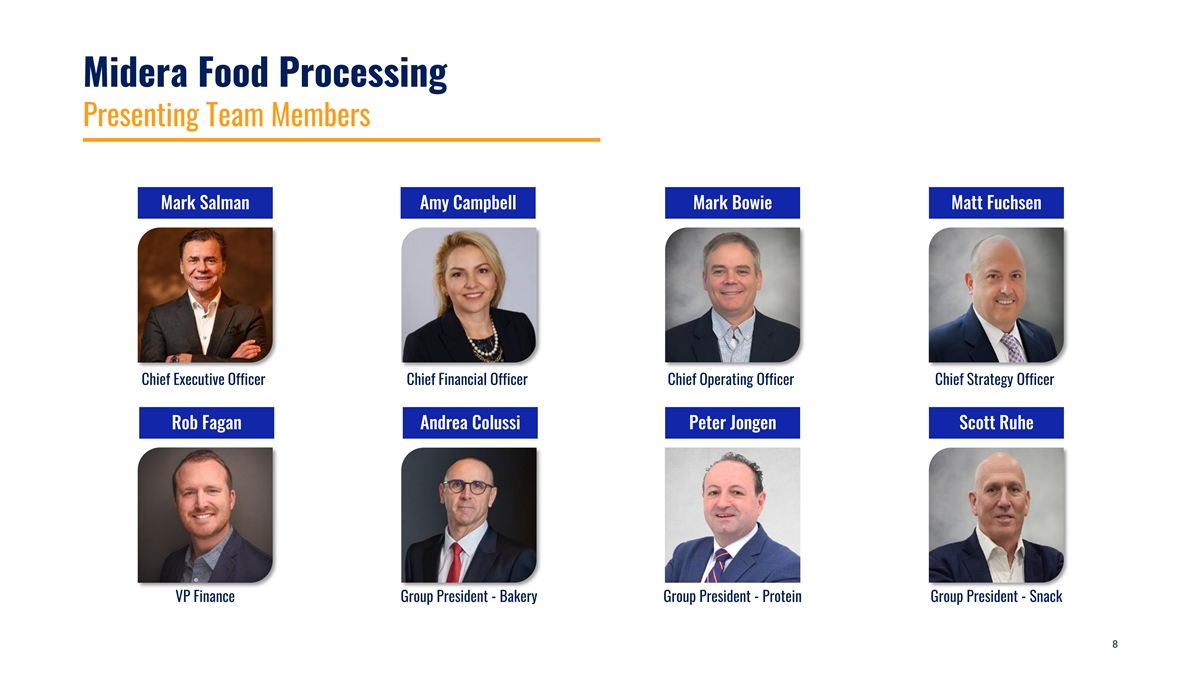
Midera Food Processing Presenting Team Members Mark Salman Amy Campbell Mark Bowie Matt Fuchsen Chief Executive Officer Chief Financial Officer Chief Operating Officer Chief Strategy Officer Rob Fagan Andrea Colussi Peter Jongen Scott Ruhe VP Finance Group President - Bakery Group President - Protein Group President - Snack 8
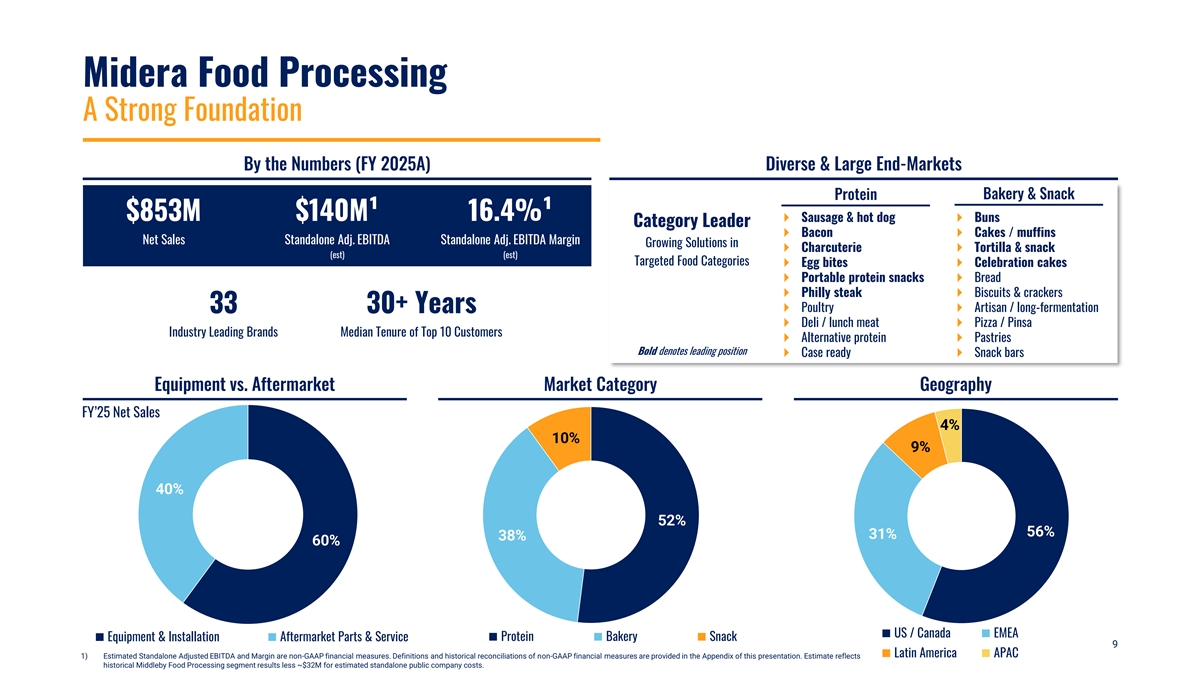
Midera Food Processing A Strong Foundation By the Numbers (FY 2025A) Diverse & Large End-Markets Protein Bakery & Snack $853M $140M¹ 16.4%¹ } Sausage & hot dog} Buns Category Leader } Bacon} Cakes / muffins Net Sales Standalone Adj. EBITDA Standalone Adj. EBITDA Margin Growing Solutions in } Charcuterie} Tortilla & snack (est) (est) Targeted Food Categories } Egg bites} Celebration cakes } Portable protein snacks } Bread } Philly steak} Biscuits & crackers } Poultry} Artisan / long-fermentation 33 30+ Years } Deli / lunch meat} Pizza / Pinsa Industry Leading Brands Median Tenure of Top 10 Customers } Alternative protein } Pastries Bold denotes leading position } Case ready} Snack bars Equipment vs. Aftermarket Market Category Geography FY’25 Net Sales 4% 10% 9% 40% 52% 56% 31% 38% 60% US / Canada EMEA Equipment & Installation Aftermarket Parts & Service Protein Bakery Snack 9 Latin America APAC 1) Estimated Standalone Adjusted EBITDA and Margin are non-GAAP financial measures. Definitions and historical reconciliations of non-GAAP financial measures are provided in the Appendix of this presentation. Estimate reflects historical Middleby Food Processing segment results less ~$32M for estimated standalone public company costs.
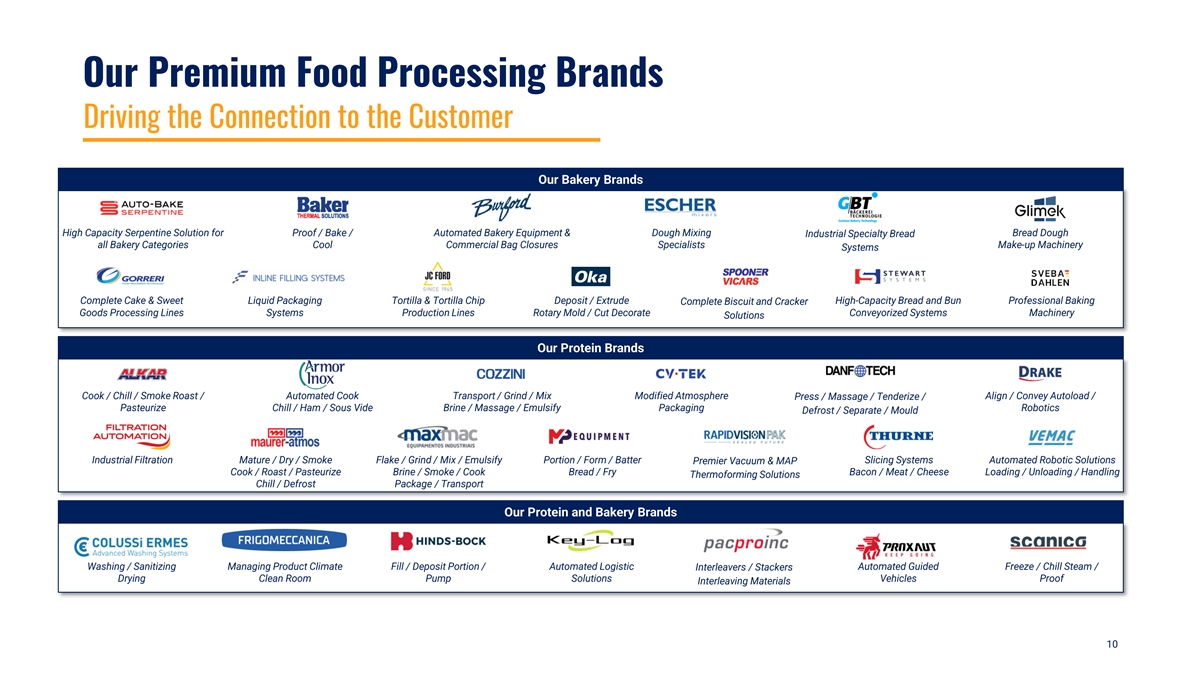
Our Premium Food Processing Brands Driving the Connection to the Customer Our Bakery Brands High Capacity Serpentine Solution for Proof / Bake / Automated Bakery Equipment & Dough Mixing Bread Dough Industrial Specialty Bread all Bakery Categories Cool Commercial Bag Closures Specialists Make-up Machinery Systems Complete Cake & Sweet Liquid Packaging Tortilla & Tortilla Chip Deposit / Extrude High-Capacity Bread and Bun Professional Baking Complete Biscuit and Cracker Goods Processing Lines Systems Production Lines Rotary Mold / Cut Decorate Conveyorized Systems Machinery Solutions Our Protein Brands Cook / Chill / Smoke Roast / Automated Cook Transport / Grind / Mix Modified Atmosphere Align / Convey Autoload / Press / Massage / Tenderize / Pasteurize Chill / Ham / Sous Vide Brine / Massage / Emulsify Packaging Robotics Defrost / Separate / Mould Industrial Filtration Mature / Dry / Smoke Flake / Grind / Mix / Emulsify Portion / Form / Batter Slicing Systems Automated Robotic Solutions Premier Vacuum & MAP Cook / Roast / Pasteurize Brine / Smoke / Cook Bread / Fry Bacon / Meat / Cheese Loading / Unloading / Handling Thermoforming Solutions Chill / Defrost Package / Transport Our Protein and Bakery Brands Washing / Sanitizing Managing Product Climate Fill / Deposit Portion / Automated Logistic Automated Guided Freeze / Chill Steam / Interleavers / Stackers Drying Clean Room Pump Solutions Vehicles Proof Interleaving Materials 10
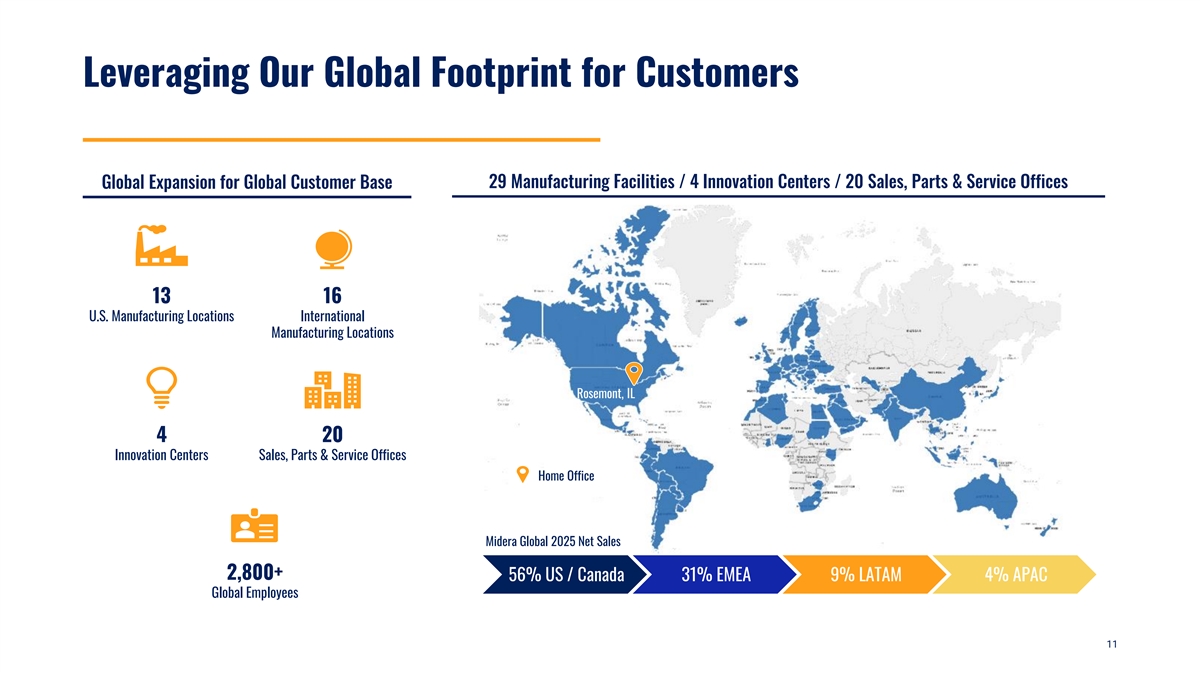
Leveraging Our Global Footprint for Customers Global Expansion for Global Customer Base 29 Manufacturing Facilities / 4 Innovation Centers / 20 Sales, Parts & Service Offices 13 16 U.S. Manufacturing Locations International Manufacturing Locations Rosemont, IL 4 20 Innovation Centers Sales, Parts & Service Offices Home Office Midera Global 2025 Net Sales 2,800+ 56% US / Canada 31% EMEA 9% LATAM 4% APAC Global Employees 11
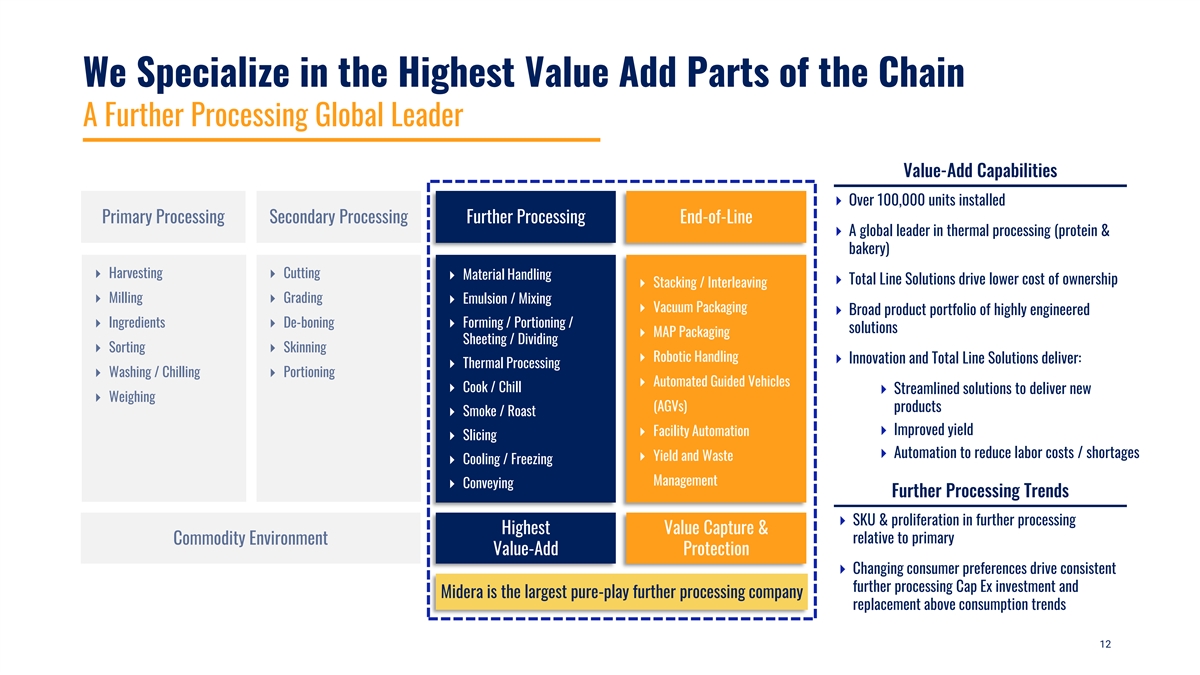
We Specialize in the Highest Value Add Parts of the Chain A Further Processing Global Leader Value-Add Capabilities ⏵ Over 100,000 units installed Primary Processing Secondary Processing Further Processing End-of-Line ⏵ A global leader in thermal processing (protein & bakery) ⏵ Harvesting ⏵ Cutting ⏵ Material Handling ⏵ Total Line Solutions drive lower cost of ownership ⏵ Stacking / Interleaving ⏵ Milling ⏵ Grading ⏵ Emulsion / Mixing ⏵ Vacuum Packaging ⏵ Broad product portfolio of highly engineered ⏵ Ingredients ⏵ De-boning ⏵ Forming / Portioning / solutions ⏵ MAP Packaging Sheeting / Dividing ⏵ Sorting ⏵ Skinning ⏵ Robotic Handling ⏵ Innovation and Total Line Solutions deliver: ⏵ Thermal Processing ⏵ Washing / Chilling⏵ Portioning ⏵ Automated Guided Vehicles ⏵ Cook / Chill ⏵ Streamlined solutions to deliver new ⏵ Weighing (AGVs) products ⏵ Smoke / Roast ⏵ Improved yield ⏵ Facility Automation ⏵ Slicing ⏵ Automation to reduce labor costs / shortages ⏵ Yield and Waste ⏵ Cooling / Freezing Management ⏵ Conveying Further Processing Trends ⏵ SKU & proliferation in further processing Highest Value Capture & relative to primary Commodity Environment Value-Add Protection ⏵ Changing consumer preferences drive consistent further processing Cap Ex investment and Midera is the largest pure-play further processing company replacement above consumption trends 12

2 Value Creation Algorithm 13
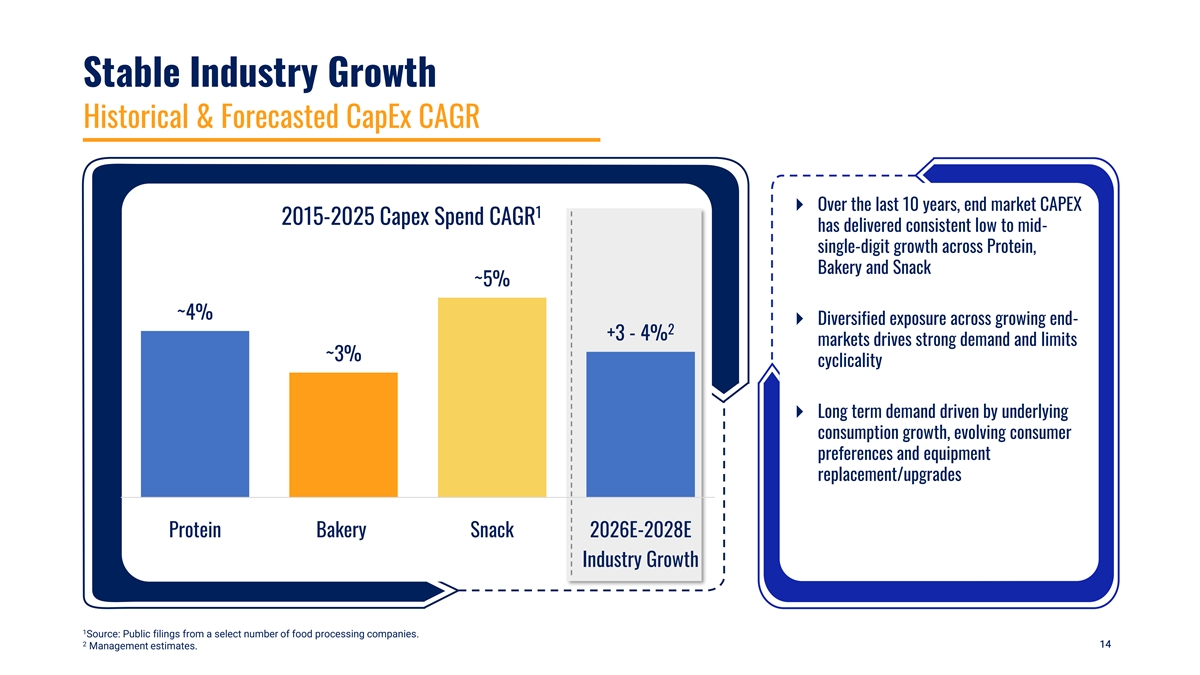
Stable Industry Growth Historical & Forecasted CapEx CAGR } Over the last 10 years, end market CAPEX 1 2015-2025 Capex Spend CAGR has delivered consistent low to mid- single-digit growth across Protein, Bakery and Snack ~5% ~4% } Diversified exposure across growing end- 2 +3 - 4% markets drives strong demand and limits ~3% cyclicality } Long term demand driven by underlying consumption growth, evolving consumer preferences and equipment replacement/upgrades Protein Bakery Snack 2026E-2028E Industry Growth 1 Source: Public filings from a select number of food processing companies. 2 14 14 14 Management estimates.
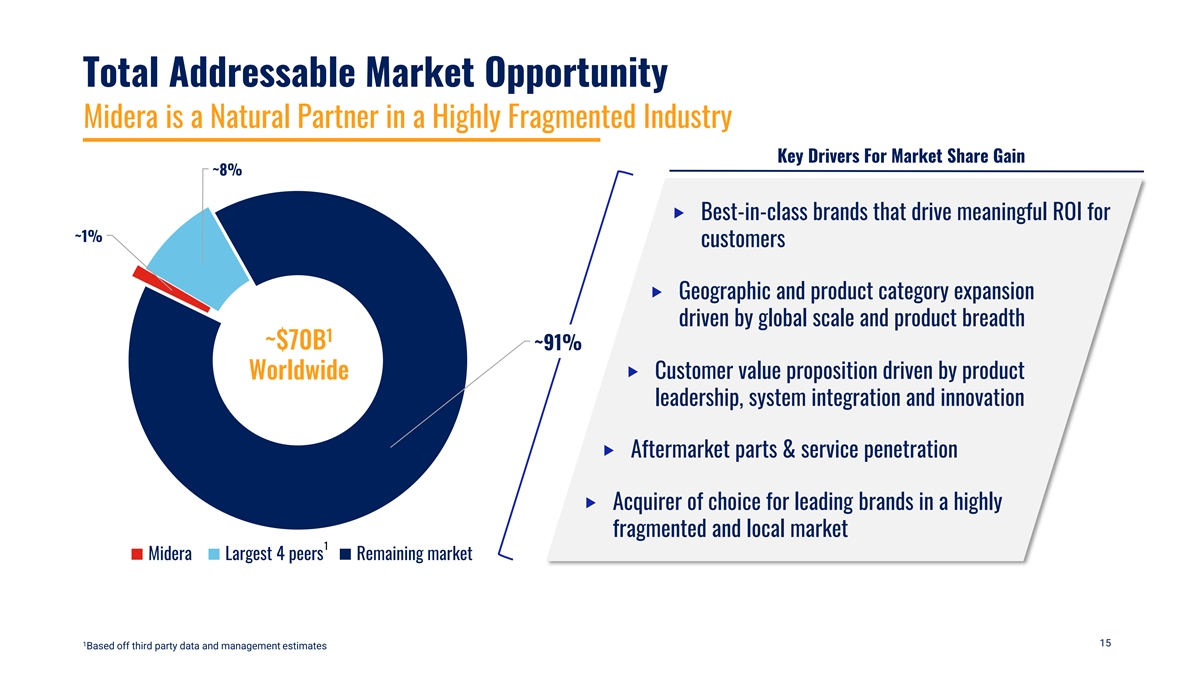
Total Addressable Market Opportunity Midera is a Natural Partner in a Highly Fragmented Industry Key Drivers For Market Share Gain ~8% ‣ Best-in-class brands that drive meaningful ROI for ~1% customers ‣ Geographic and product category expansion driven by global scale and product breadth 1 ~$70B ~91% ‣ Customer value proposition driven by product Worldwide leadership, system integration and innovation ‣ Aftermarket parts & service penetration ‣ Acquirer of choice for leading brands in a highly fragmented and local market 1 Midera Largest 4 peers Remaining market 1 15 Based off third party data and management estimates
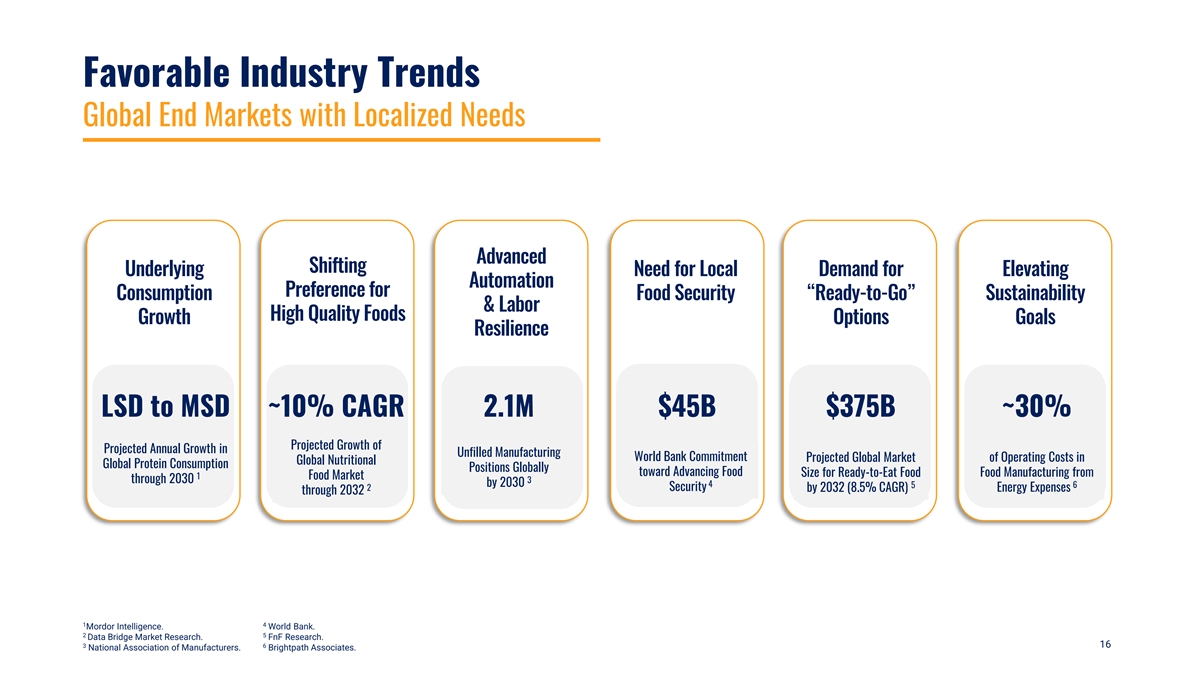
Favorable Industry Trends Global End Markets with Localized Needs Advanced Shifting Underlying Need for Local Demand for Elevating Automation Preference for Consumption Food Security “Ready-to-Go” Sustainability & Labor High Quality Foods Growth Options Goals Resilience LSD to MSD ~10% CAGR 2.1M $45B $375B ~30% Projected Growth of Projected Annual Growth in Unfilled Manufacturing World Bank Commitment Projected Global Market of Operating Costs in Global Nutritional Global Protein Consumption Positions Globally toward Advancing Food Size for Ready-to-Eat Food Food Manufacturing from 1 Food Market through 2030 3 by 2030 4 5 6 2 Security by 2032 (8.5% CAGR) Energy Expenses through 2032 1 4 Mordor Intelligence. World Bank. 2 5 Data Bridge Market Research. FnF Research. 3 6 16 National Association of Manufacturers. Brightpath Associates.
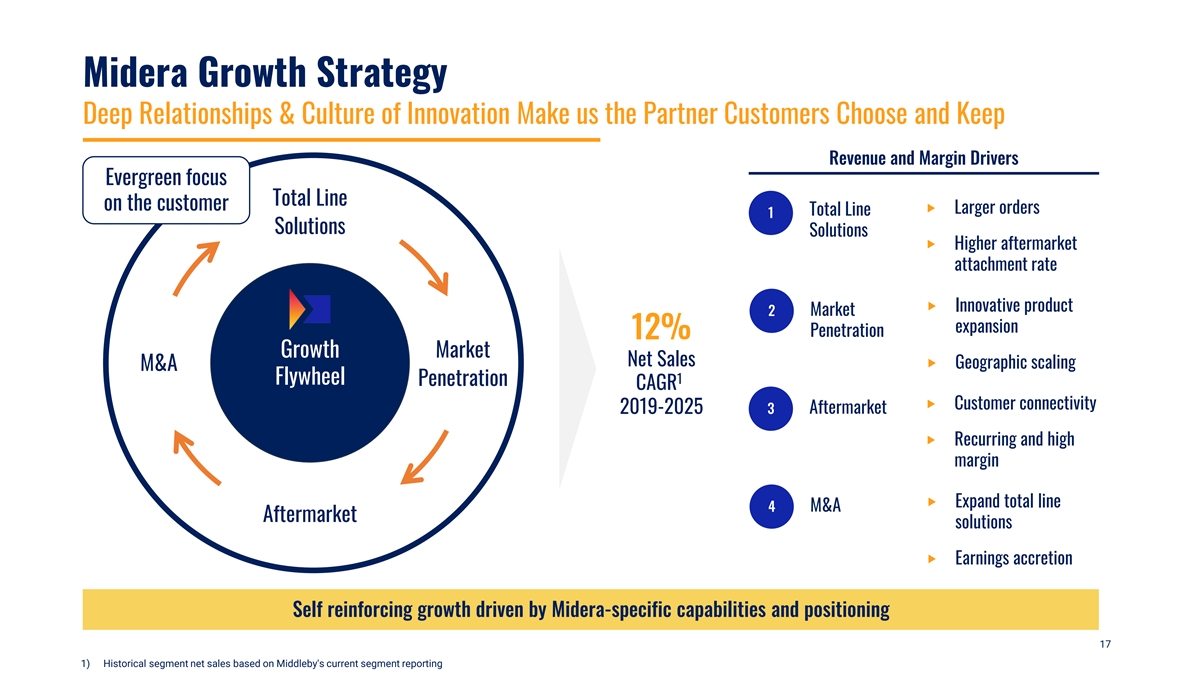
Midera Growth Strategy Deep Relationships & Culture of Innovation Make us the Partner Customers Choose and Keep Revenue and Margin Drivers Evergreen focus Total Line on the customer ‣ Larger orders Total Line 1 Solutions Solutions ‣ Higher aftermarket attachment rate ‣ Innovative product 2 Market expansion Penetration 12% Growth Market Net Sales ‣ Geographic scaling M&A 1 Flywheel Penetration CAGR ‣ Customer connectivity 2019-2025 3 Aftermarket ‣ Recurring and high margin ‣ Expand total line 4 M&A Aftermarket solutions ‣ Earnings accretion Self reinforcing growth driven by Midera-specific capabilities and positioning 17 1) Historical segment net sales based on Middleby's current segment reporting
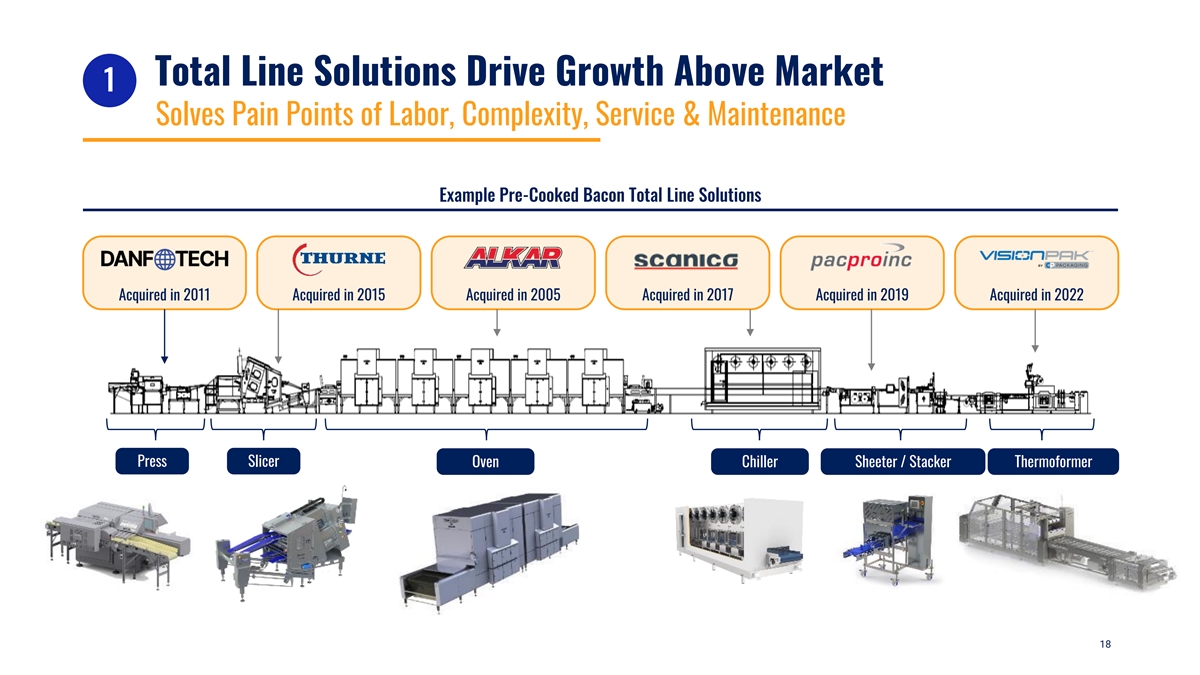
Total Line Solutions Drive Growth Above Market 1 Solves Pain Points of Labor, Complexity, Service & Maintenance Example Pre-Cooked Bacon Total Line Solutions Acquired in 2011 Acquired in 2015 Acquired in 2005 Acquired in 2017 Acquired in 2019 Acquired in 2022 Press Slicer Oven Chiller Sheeter / Stacker Thermoformer 18
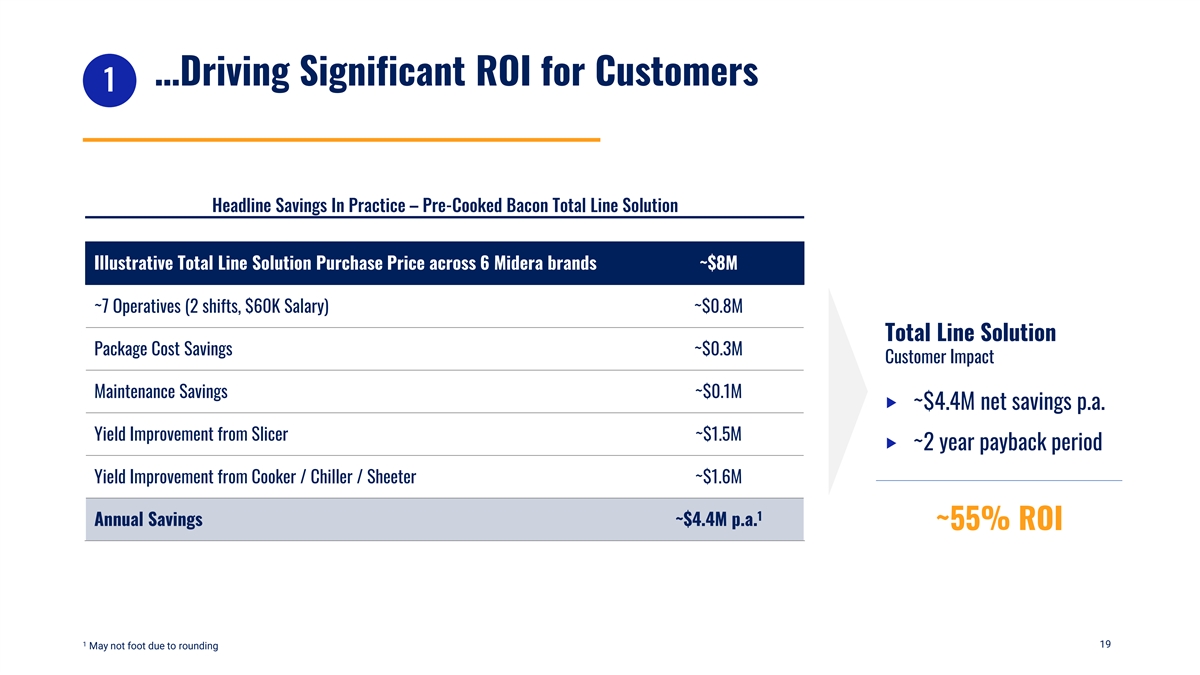
…Driving Significant ROI for Customers 1 Headline Savings In Practice – Pre-Cooked Bacon Total Line Solution Illustrative Total Line Solution Purchase Price across 6 Midera brands ~$8M ~7 Operatives (2 shifts, $60K Salary) ~$0.8M Total Line Solution Package Cost Savings ~$0.3M Customer Impact Maintenance Savings ~$0.1M ‣ ~$4.4M net savings p.a. Yield Improvement from Slicer ~$1.5M ‣ ~2 year payback period Yield Improvement from Cooker / Chiller / Sheeter ~$1.6M 1 Annual Savings ~$4.4M p.a. ~55% ROI 1 19 May not foot due to rounding
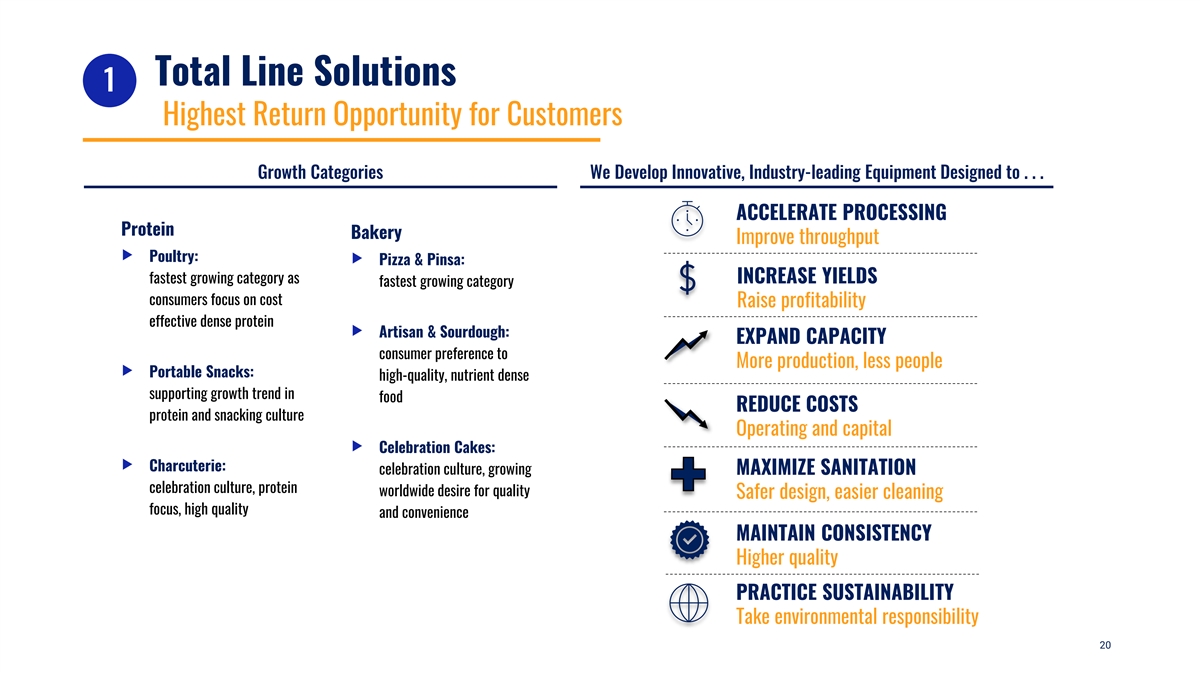
Total Line Solutions 1 Highest Return Opportunity for Customers Growth Categories We Develop Innovative, Industry-leading Equipment Designed to . . . ACCELERATE PROCESSING Protein Bakery Improve throughput ‣ Poultry: ‣ Pizza & Pinsa: fastest growing category as INCREASE YIELDS fastest growing category consumers focus on cost Raise profitability effective dense protein ‣ Artisan & Sourdough: EXPAND CAPACITY consumer preference to More production, less people ‣ Portable Snacks: high-quality, nutrient dense supporting growth trend in food REDUCE COSTS protein and snacking culture Operating and capital ‣ Celebration Cakes: ‣ Charcuterie: celebration culture, growing MAXIMIZE SANITATION celebration culture, protein worldwide desire for quality Safer design, easier cleaning focus, high quality and convenience MAINTAIN CONSISTENCY Higher quality PRACTICE SUSTAINABILITY Take environmental responsibility 20
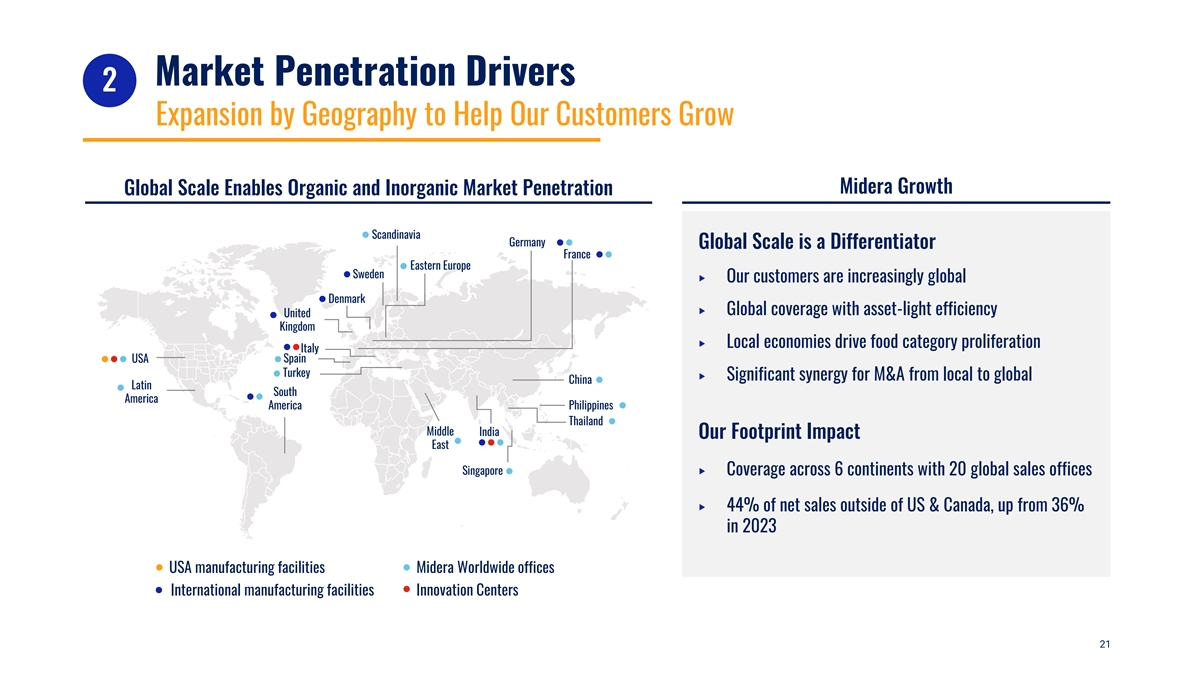
Market Penetration Drivers 2 Expansion by Geography to Help Our Customers Grow Midera Growth Global Scale Enables Organic and Inorganic Market Penetration Scandinavia Germany Global Scale is a Differentiator France Eastern Europe Sweden ‣ Our customers are increasingly global Denmark ‣ Global coverage with asset-light efficiency United Kingdom ‣ Local economies drive food category proliferation Italy USA Spain Turkey ‣ Significant synergy for M&A from local to global China Latin South America America Philippines Thailand Middle India Our Footprint Impact East Singapore ‣ Coverage across 6 continents with 20 global sales offices ‣ 44% of net sales outside of US & Canada, up from 36% in 2023 USA manufacturing facilities Midera Worldwide offices International manufacturing facilities Innovation Centers 21
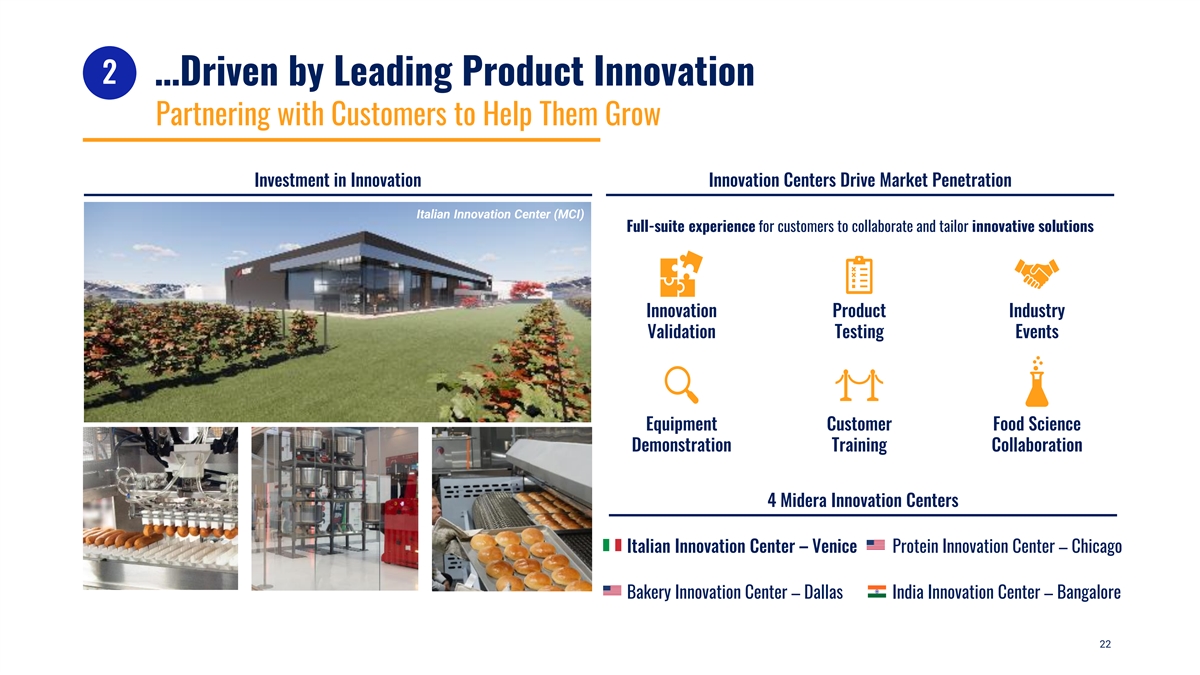
2 …Driven by Leading Product Innovation Partnering with Customers to Help Them Grow Investment in Innovation Innovation Centers Drive Market Penetration Italian Innovation Center (MCI) Full-suite experience for customers to collaborate and tailor innovative solutions Innovation Product Industry Validation Testing Events Equipment Customer Food Science Demonstration Training Collaboration 4 Midera Innovation Centers Italian Innovation Center – Venice Protein Innovation Center – Chicago Bakery Innovation Center – Dallas India Innovation Center – Bangalore 22
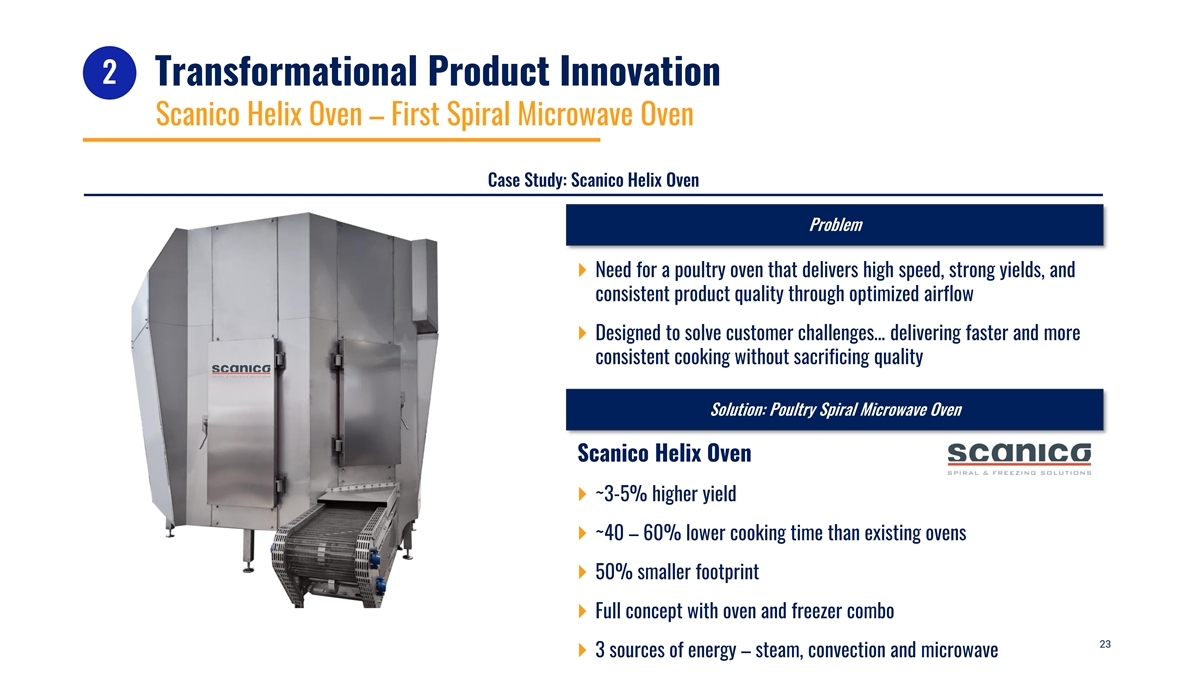
2 Transformational Product Innovation Scanico Helix Oven – First Spiral Microwave Oven Case Study: Scanico Helix Oven Problem } Need for a poultry oven that delivers high speed, strong yields, and consistent product quality through optimized airflow } Designed to solve customer challenges… delivering faster and more consistent cooking without sacrificing quality Solution: Poultry Spiral Microwave Oven Scanico Helix Oven } ~3-5% higher yield } ~40 – 60% lower cooking time than existing ovens } 50% smaller footprint } Full concept with oven and freezer combo 23 } 3 sources of energy – steam, convection and microwave
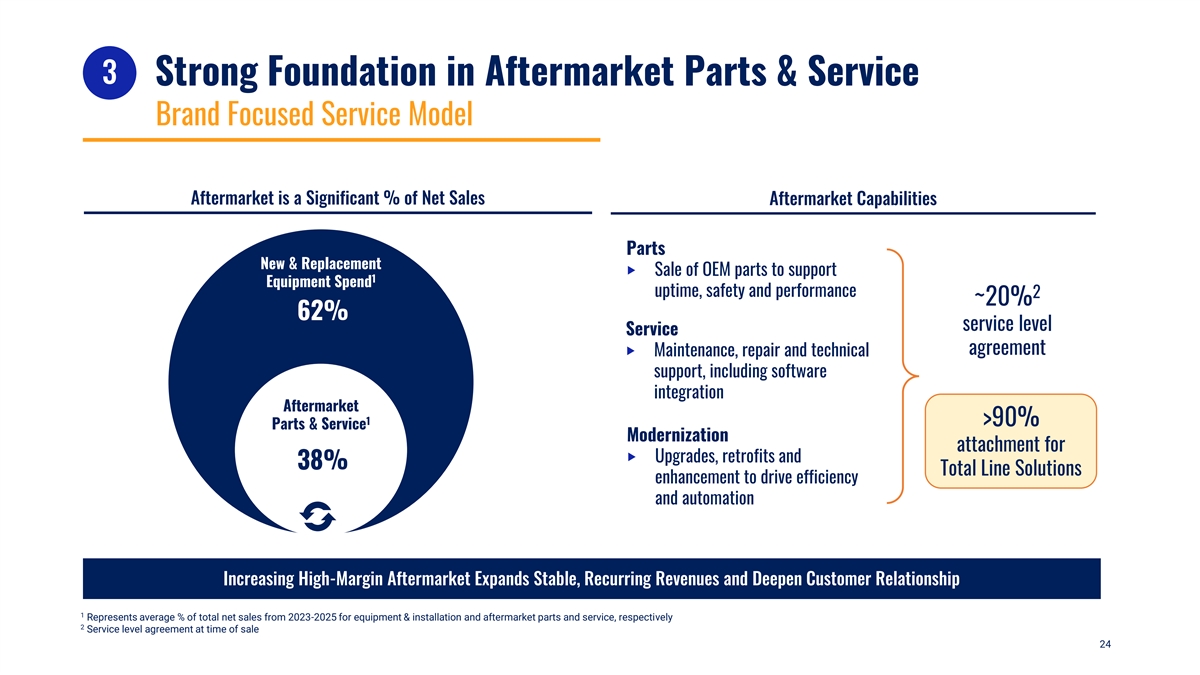
3 Strong Foundation in Aftermarket Parts & Service Brand Focused Service Model Aftermarket is a Significant % of Net Sales Aftermarket Capabilities Parts New & Replacement ‣ Sale of OEM parts to support 1 Equipment Spend uptime, safety and performance 2 ~20% 62% service level Service agreement ‣ Maintenance, repair and technical support, including software integration Aftermarket 1 >90% Parts & Service Modernization attachment for ‣ Upgrades, retrofits and 38% Total Line Solutions enhancement to drive efficiency and automation Increasing High-Margin Aftermarket Expands Stable, Recurring Revenues and Deepen Customer Relationship 1 Represents average % of total net sales from 2023-2025 for equipment & installation and aftermarket parts and service, respectively 2 Service level agreement at time of sale 24

Midera Food Processing Playbook An Industry Leading Platform Favorable Industry Trends Organic Growth Enablers Inorganic Growth Enablers Improving Living Standards in Developing Countries 30+ Best in Large, Global Total Line Market Disciplined M&A Synergy Class Brands Install Base Solutions Penetration Execution Proficiency Industrialization of Food Production + + + Food Safety Requirements Fragmented Aftermarket Diversified Innovation Industry End Markets Centers Sustainability x Midera Operating System Results Driven Culture Customer Centric Speed of Innovation Entrepreneurial Mindset = Premier Growth Margin Accretion High FCF Conversion Compounder 25
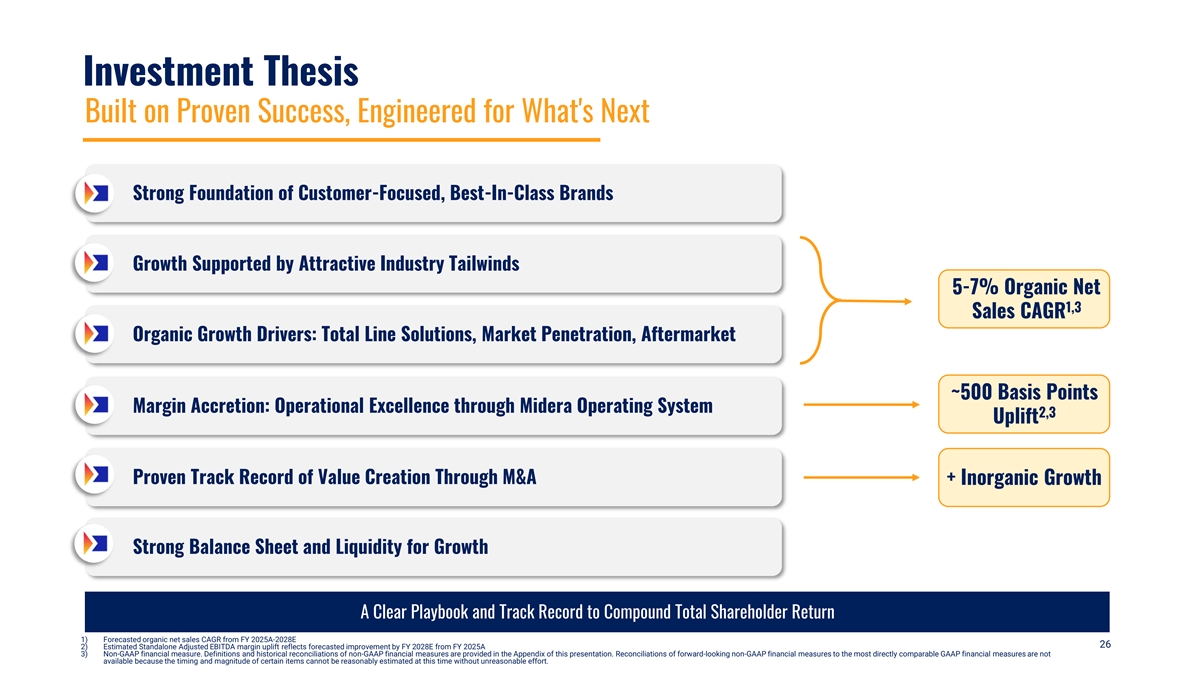
Investment Thesis Built on Proven Success, Engineered for What's Next Strong Foundation of Customer-Focused, Best-In-Class Brands Growth Supported by Attractive Industry Tailwinds 5-7% Organic Net 1,3 Sales CAGR Organic Growth Drivers: Total Line Solutions, Market Penetration, Aftermarket ~500 Basis Points Margin Accretion: Operational Excellence through Midera Operating System 2,3 Uplift Proven Track Record of Value Creation Through M&A + Inorganic Growth Strong Balance Sheet and Liquidity for Growth A Clear Playbook and Track Record to Compound Total Shareholder Return 1) Forecasted organic net sales CAGR from FY 2025A-2028E 26 2) Estimated Standalone Adjusted EBITDA margin uplift reflects forecasted improvement by FY 2028E from FY 2025A 3) Non-GAAP financial measure. Definitions and historical reconciliations of non-GAAP financial measures are provided in the Appendix of this presentation. Reconciliations of forward-looking non-GAAP financial measures to the most directly comparable GAAP financial measures are not available because the timing and magnitude of certain items cannot be reasonably estimated at this time without unreasonable effort.

3 Aftermarket Expansion 27
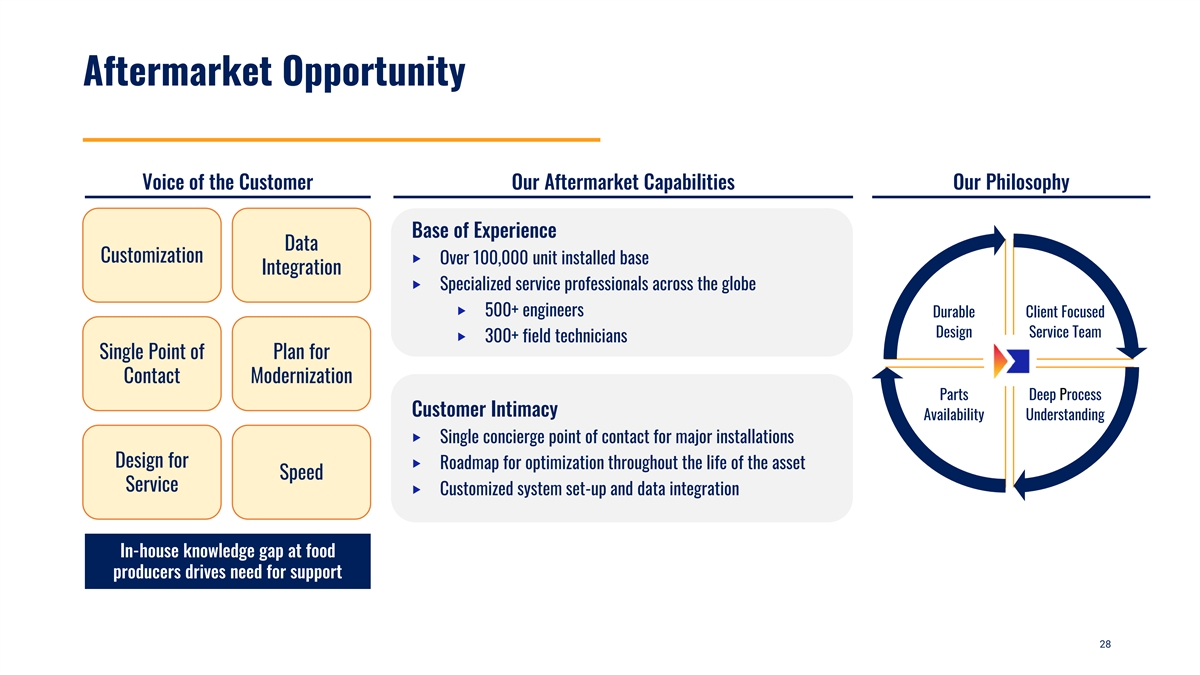
Aftermarket Opportunity Voice of the Customer Our Aftermarket Capabilities Our Philosophy Base of Experience Data Customization ‣ Over 100,000 unit installed base Integration ‣ Specialized service professionals across the globe ‣ 500+ engineers Durable Client Focused Design Service Team ‣ 300+ field technicians Single Point of Plan for Contact Modernization Parts Deep Process Customer Intimacy Availability Understanding ‣ Single concierge point of contact for major installations Design for ‣ Roadmap for optimization throughout the life of the asset Speed Service ‣ Customized system set-up and data integration In-house knowledge gap at food producers drives need for support 28
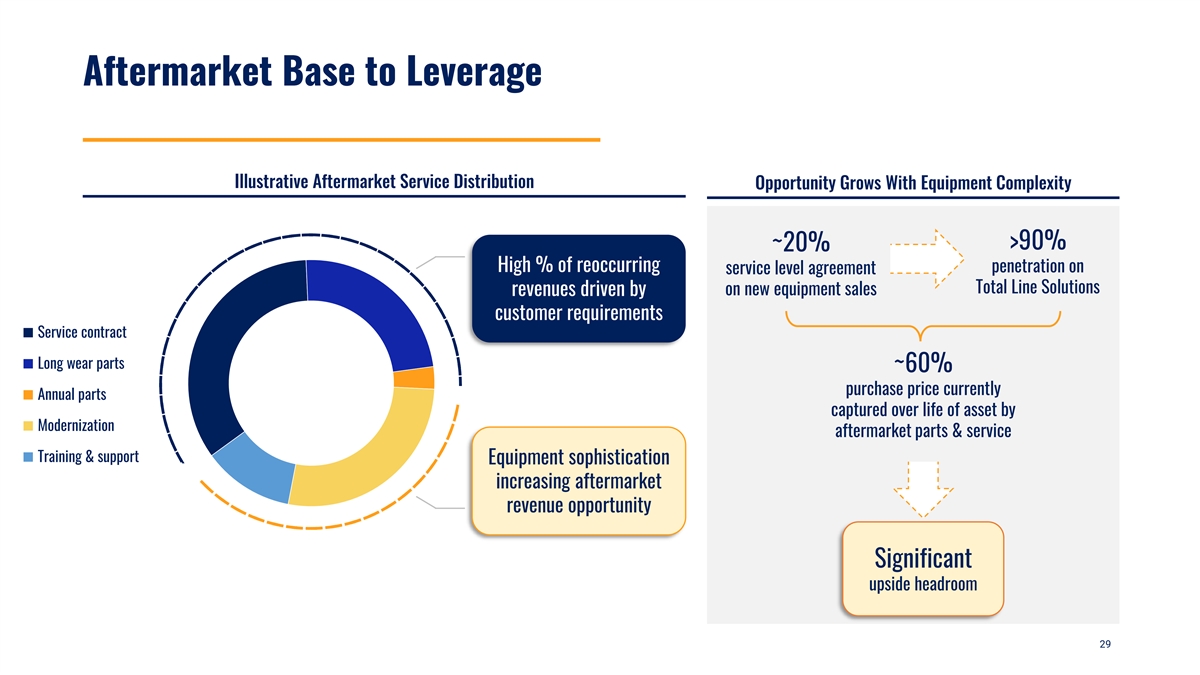
Aftermarket Base to Leverage Illustrative Aftermarket Service Distribution Opportunity Grows With Equipment Complexity >90% ~20% High % of reoccurring penetration on service level agreement Total Line Solutions on new equipment sales revenues driven by customer requirements Service contract Long wear parts ~60% purchase price currently Annual parts captured over life of asset by Modernization aftermarket parts & service Training & support Equipment sophistication increasing aftermarket revenue opportunity Significant upside headroom 29
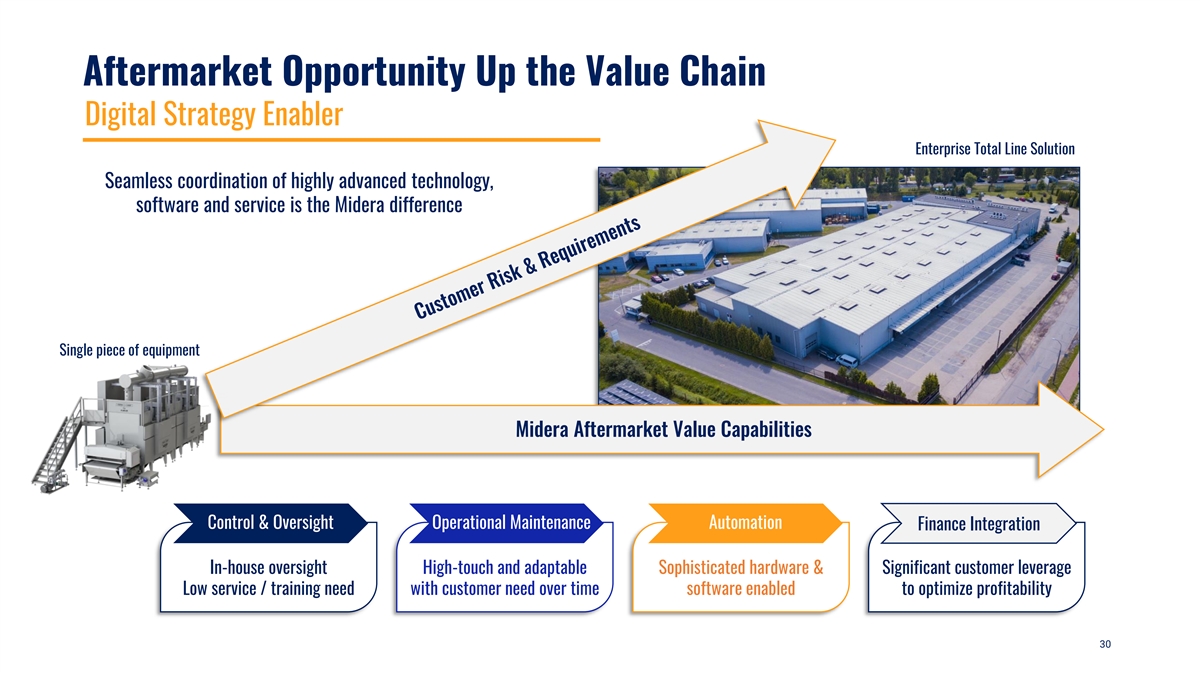
Aftermarket Opportunity Up the Value Chain Digital Strategy Enabler Enterprise Total Line Solution Seamless coordination of highly advanced technology, software and service is the Midera difference Single piece of equipment Midera Aftermarket Value Capabilities Control & Oversight Operational Maintenance Automation Finance Integration In-house oversight High-touch and adaptable Sophisticated hardware & Significant customer leverage Low service / training need with customer need over time software enabled to optimize profitability 30
4 Innovation and Operational Excellence 31
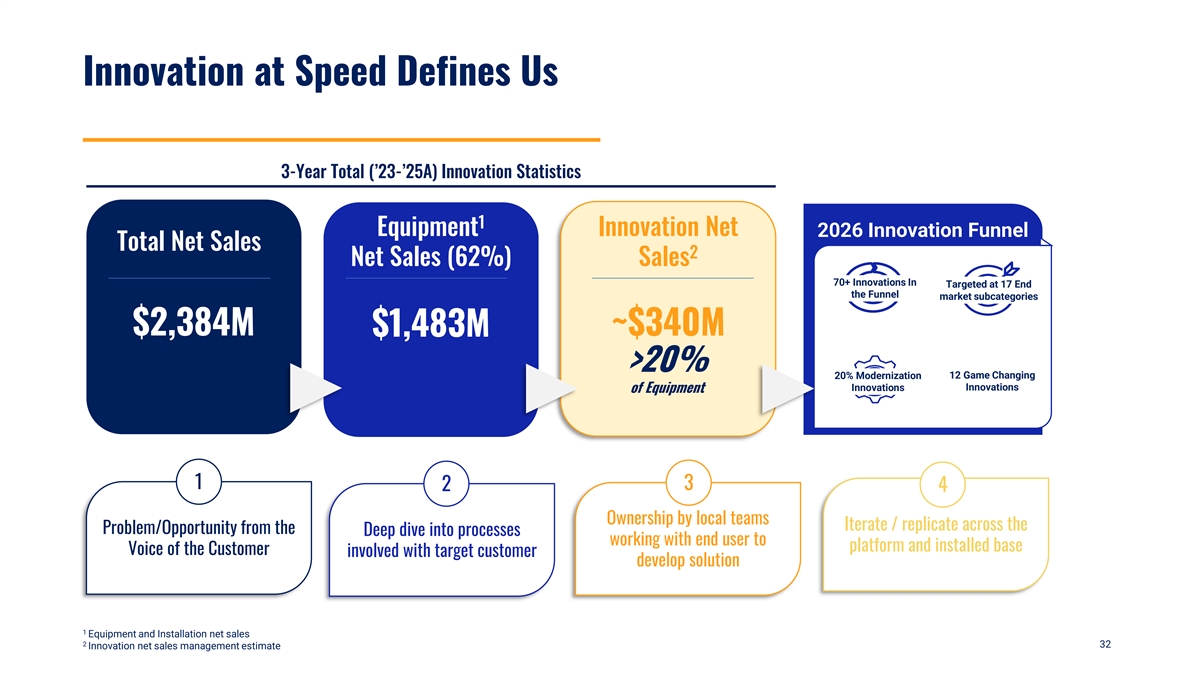
Innovation at Speed Defines Us 3-Year Total (’23-’25A) Innovation Statistics 1 Equipment Innovation Net 2026 Innovation Funnel Total Net Sales 2 Net Sales (62%) Sales 70+ Innovations In Targeted at 17 End the Funnel market subcategories $2,384M ~$340M $1,483M >20% 20% Modernization 12 Game Changing Innovations Innovations of Equipment 1 3 2 4 Ownership by local teams Iterate / replicate across the Problem/Opportunity from the Deep dive into processes working with end user to platform and installed base Voice of the Customer involved with target customer develop solution 1 Equipment and Installation net sales 2 32 Innovation net sales management estimate
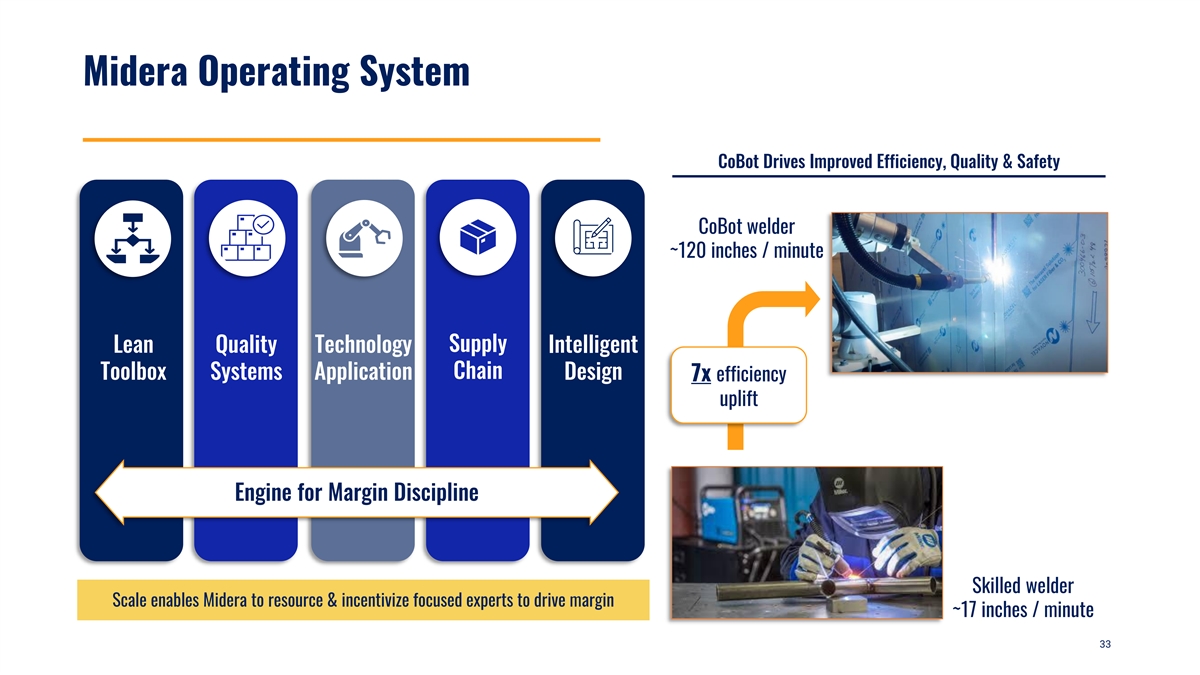
Midera Operating System CoBot Drives Improved Efficiency, Quality & Safety CoBot welder ~120 inches / minute Lean Quality Technology Supply Intelligent Chain Toolbox Systems Application Design 7x efficiency uplift Engine for Margin Discipline Skilled welder Scale enables Midera to resource & incentivize focused experts to drive margin ~17 inches / minute 33
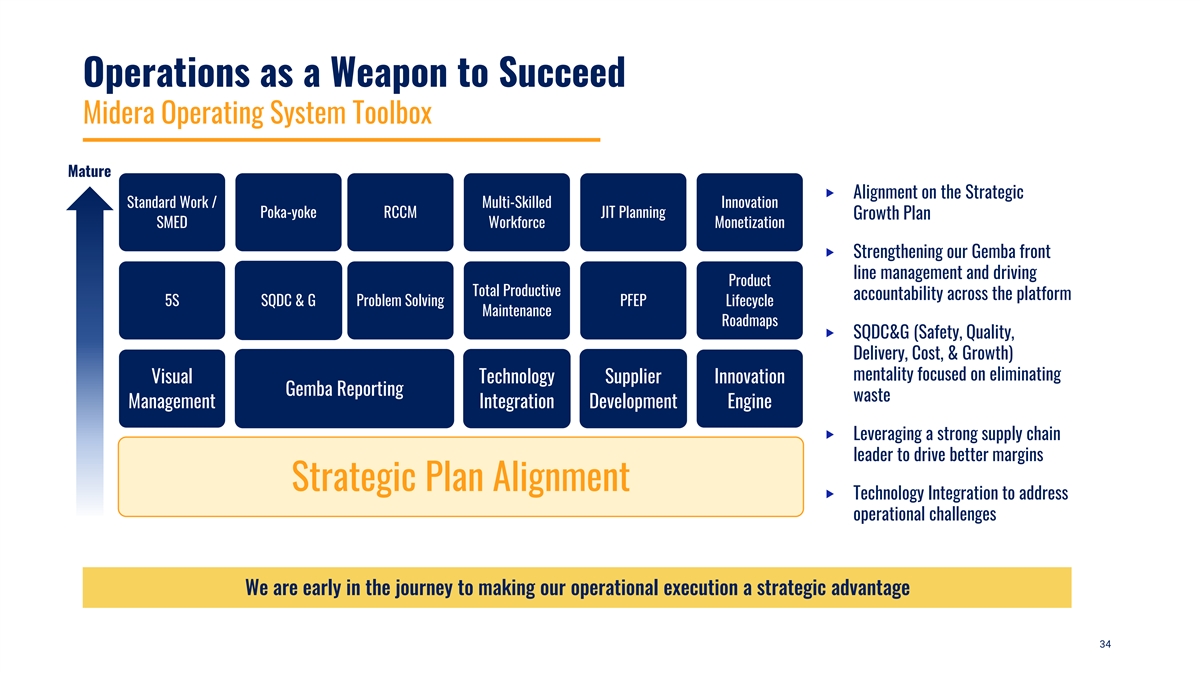
Operations as a Weapon to Succeed Midera Operating System Toolbox Mature ‣ Alignment on the Strategic Standard Work / Multi-Skilled Innovation Poka-yoke RCCM JIT Planning Growth Plan SMED Workforce Monetization ‣ Strengthening our Gemba front line management and driving Product Total Productive accountability across the platform 5S SQDC & G Problem Solving PFEP Lifecycle Maintenance Roadmaps ‣ SQDC&G (Safety, Quality, Delivery, Cost, & Growth) mentality focused on eliminating Visual Technology Supplier Innovation Gemba Reporting waste Management Integration Development Engine ‣ Leveraging a strong supply chain leader to drive better margins Strategic Plan Alignment ‣ Technology Integration to address operational challenges We are early in the journey to making our operational execution a strategic advantage 34
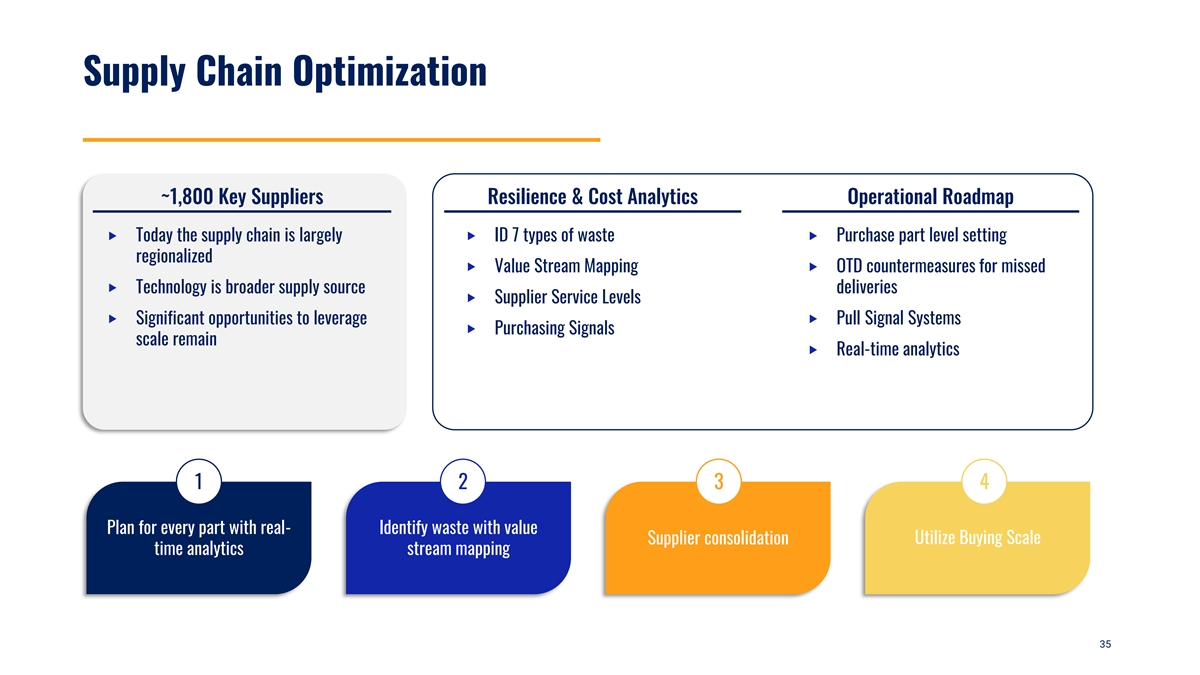
Supply Chain Optimization ~1,800 Key Suppliers Resilience & Cost Analytics Operational Roadmap ‣ Today the supply chain is largely ‣ ID 7 types of waste ‣ Purchase part level setting regionalized ‣ Value Stream Mapping ‣ OTD countermeasures for missed ‣ Technology is broader supply source deliveries ‣ Supplier Service Levels ‣ Significant opportunities to leverage ‣ Pull Signal Systems ‣ Purchasing Signals scale remain ‣ Real-time analytics 1 2 3 4 Plan for every part with real- Identify waste with value Utilize Buying Scale Supplier consolidation time analytics stream mapping 35

5 Midera Group Presidents 36
PROTEIN Peter Jongen Group President 37 z
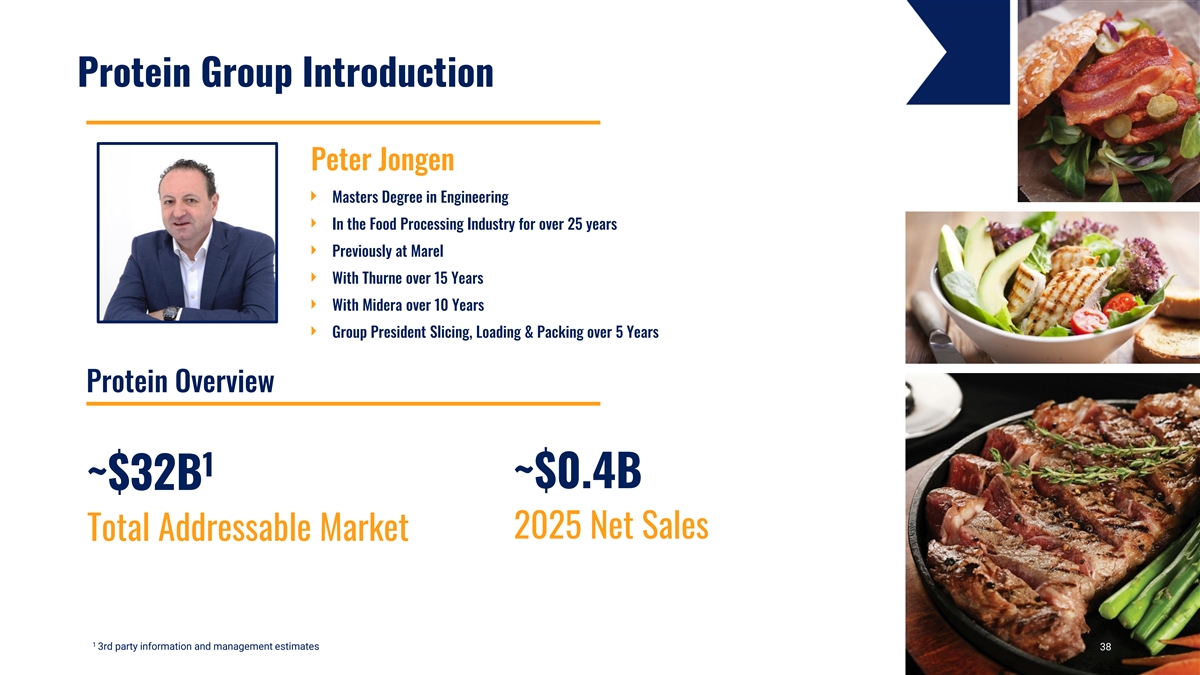
Protein Group Introduction Peter Jongen Masters Degree in Engineering In the Food Processing Industry for over 25 years Previously at Marel With Thurne over 15 Years With Midera over 10 Years Group President Slicing, Loading & Packing over 5 Years Protein Overview 1 ~$0.4B ~$32B 2025 Net Sales Total Addressable Market 1 3rd party information and management estimates 38
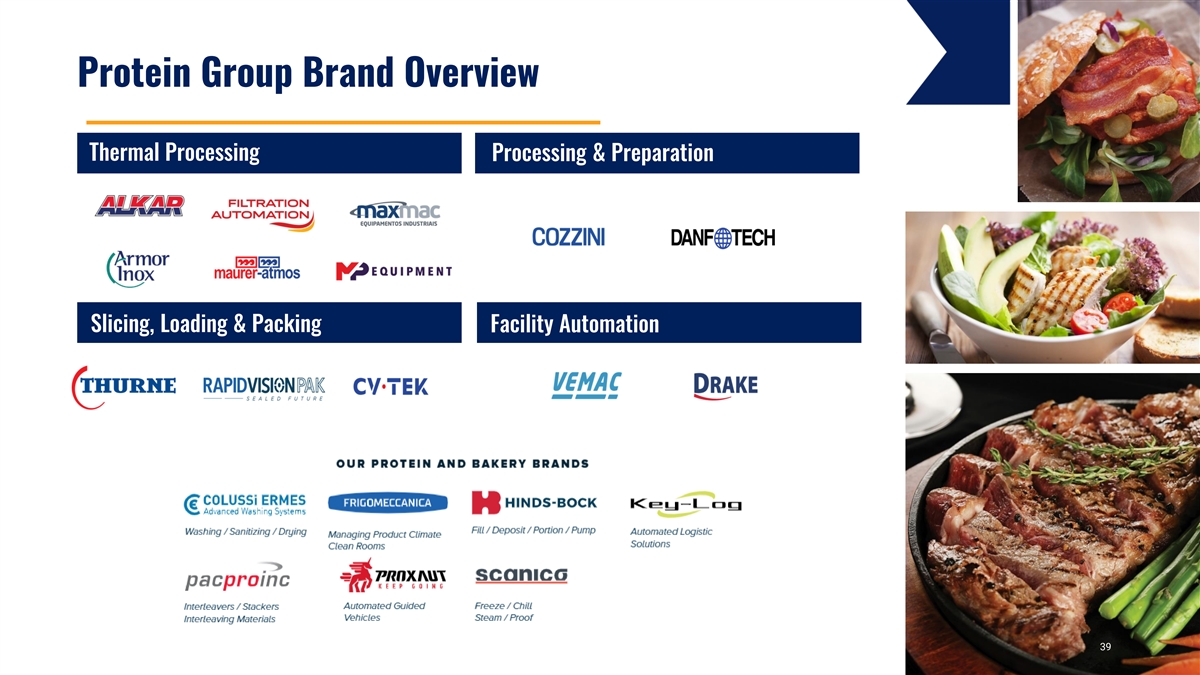
Protein Group Brand Overview Thermal Processing Processing & Preparation Slicing, Loading & Packing Facility Automation 39
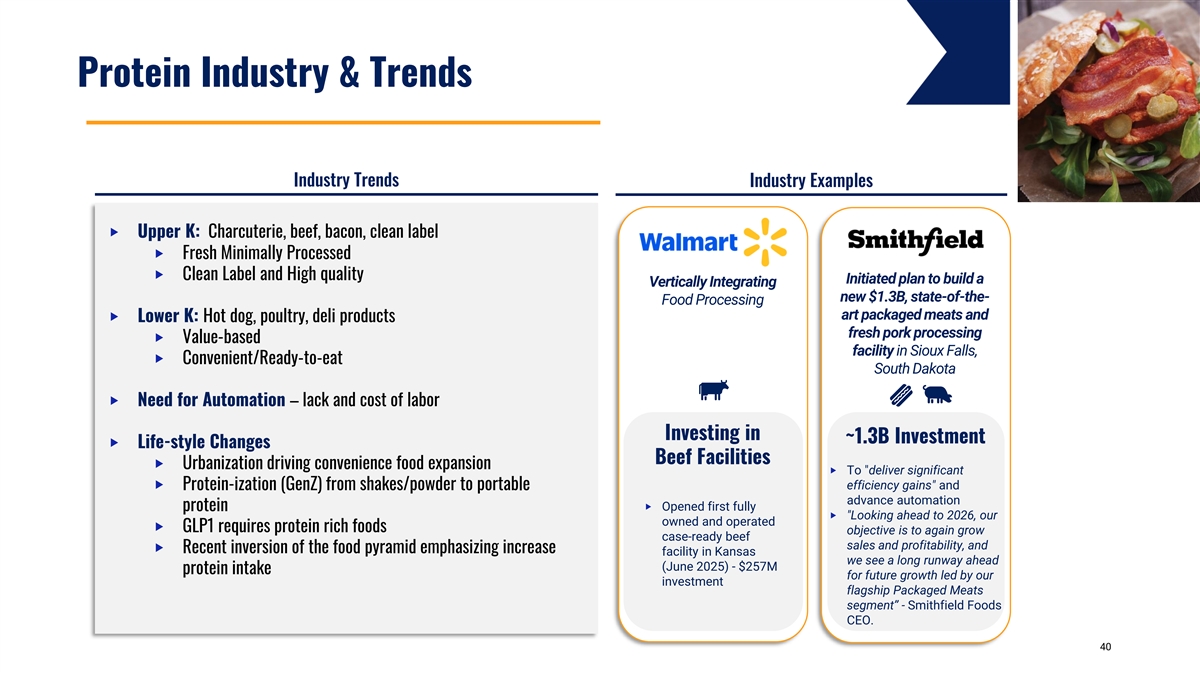
Protein Industry & Trends Industry Trends Industry Examples ‣ Upper K: Charcuterie, beef, bacon, clean label ‣ Fresh Minimally Processed ‣ Clean Label and High quality Initiated plan to build a Vertically Integrating new $1.3B, state-of-the- Food Processing art packaged meats and ‣ Lower K: Hot dog, poultry, deli products fresh pork processing ‣ Value-based facility in Sioux Falls, ‣ Convenient/Ready-to-eat South Dakota ‣ Need for Automation – lack and cost of labor Investing in ~1.3B Investment ‣ Life-style Changes Beef Facilities ‣ Urbanization driving convenience food expansion ‣ To deliver significant ‣ Protein-ization (GenZ) from shakes/powder to portable efficiency gains and advance automation protein ‣ Opened first fully ‣ Looking ahead to 2026, our owned and operated ‣ GLP1 requires protein rich foods objective is to again grow case-ready beef sales and profitability, and ‣ Recent inversion of the food pyramid emphasizing increase facility in Kansas we see a long runway ahead (June 2025) - $257M protein intake for future growth led by our investment flagship Packaged Meats segment” - Smithfield Foods CEO. 40 40
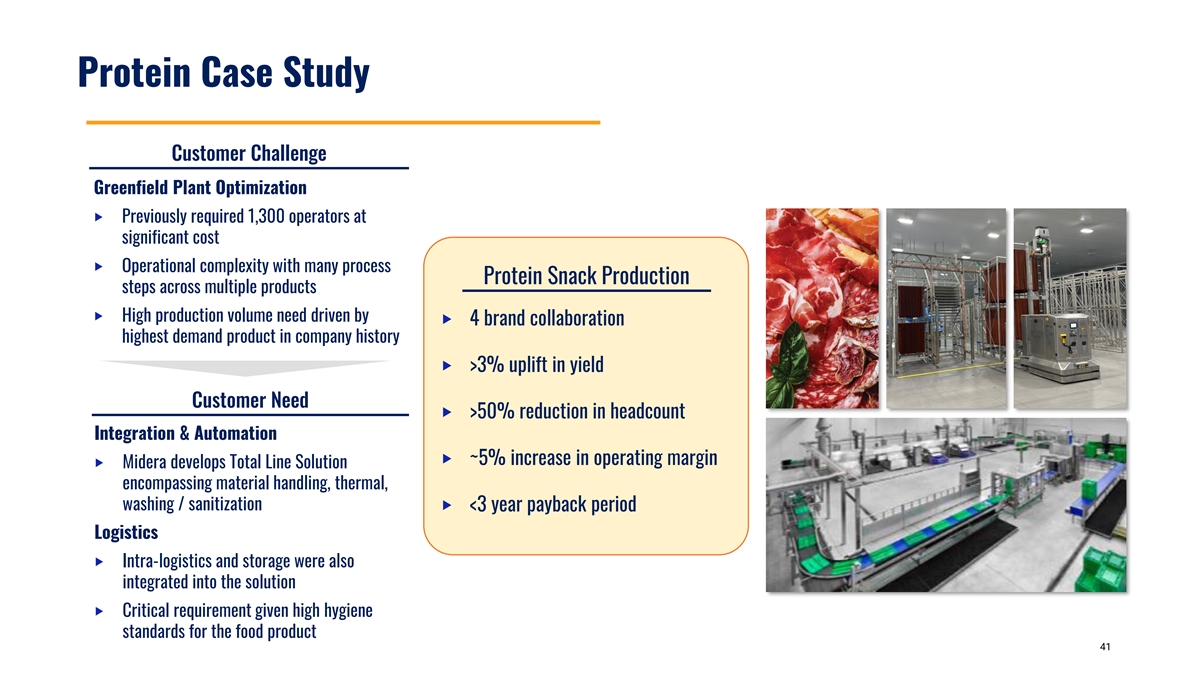
Protein Case Study Customer Challenge Greenfield Plant Optimization ‣ Previously required 1,300 operators at significant cost ‣ Operational complexity with many process Protein Snack Production steps across multiple products ‣ High production volume need driven by ‣ 4 brand collaboration highest demand product in company history ‣ >3% uplift in yield Customer Need ‣ >50% reduction in headcount Integration & Automation ‣ ~5% increase in operating margin ‣ Midera develops Total Line Solution encompassing material handling, thermal, washing / sanitization ‣ <3 year payback period Logistics ‣ Intra-logistics and storage were also integrated into the solution ‣ Critical requirement given high hygiene standards for the food product 41
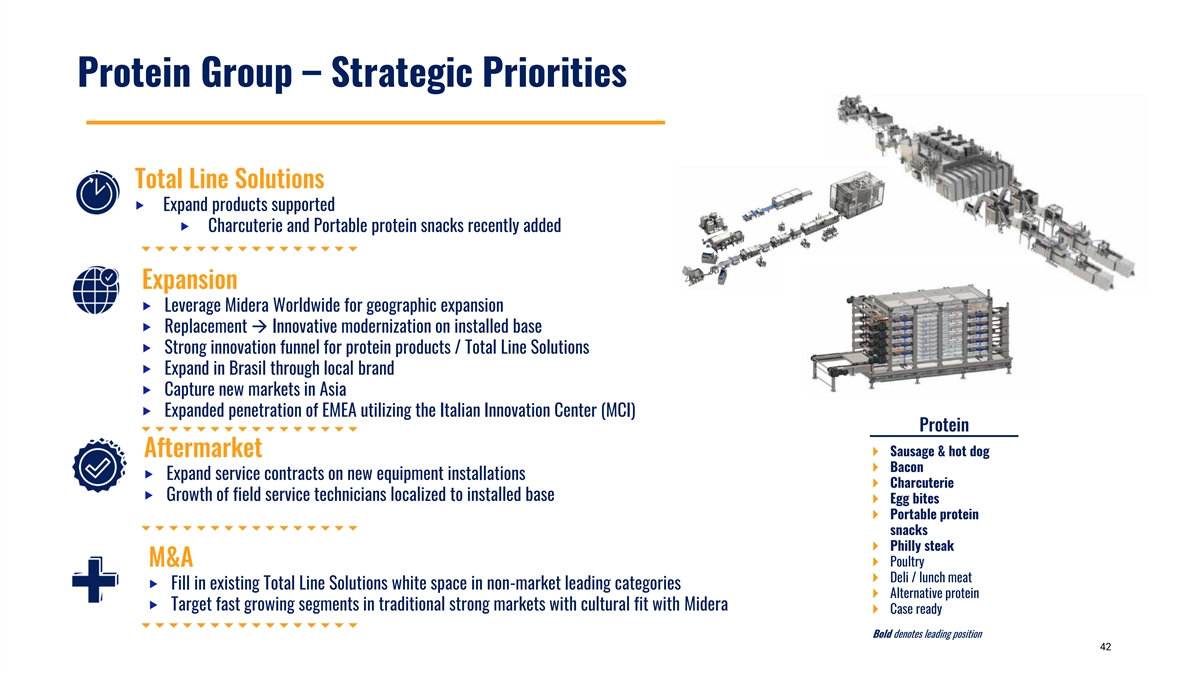
Protein Group – Strategic Priorities Total Line Solutions ‣ Expand products supported ‣ Charcuterie and Portable protein snacks recently added Expansion ‣ Leverage Midera Worldwide for geographic expansion ‣ Replacement → Innovative modernization on installed base ‣ Strong innovation funnel for protein products / Total Line Solutions ‣ Expand in Brasil through local brand ‣ Capture new markets in Asia ‣ Expanded penetration of EMEA utilizing the Italian Innovation Center (MCI) Protein } Sausage & hot dog Aftermarket } Bacon ‣ Expand service contracts on new equipment installations } Charcuterie ‣ Growth of field service technicians localized to installed base } Egg bites } Portable protein snacks } Philly steak } Poultry M&A } Deli / lunch meat ‣ Fill in existing Total Line Solutions white space in non-market leading categories } Alternative protein ‣ Target fast growing segments in traditional strong markets with cultural fit with Midera } Case ready Bold denotes leading position 42
BAKERY Andrea Colussi Group President 43 z
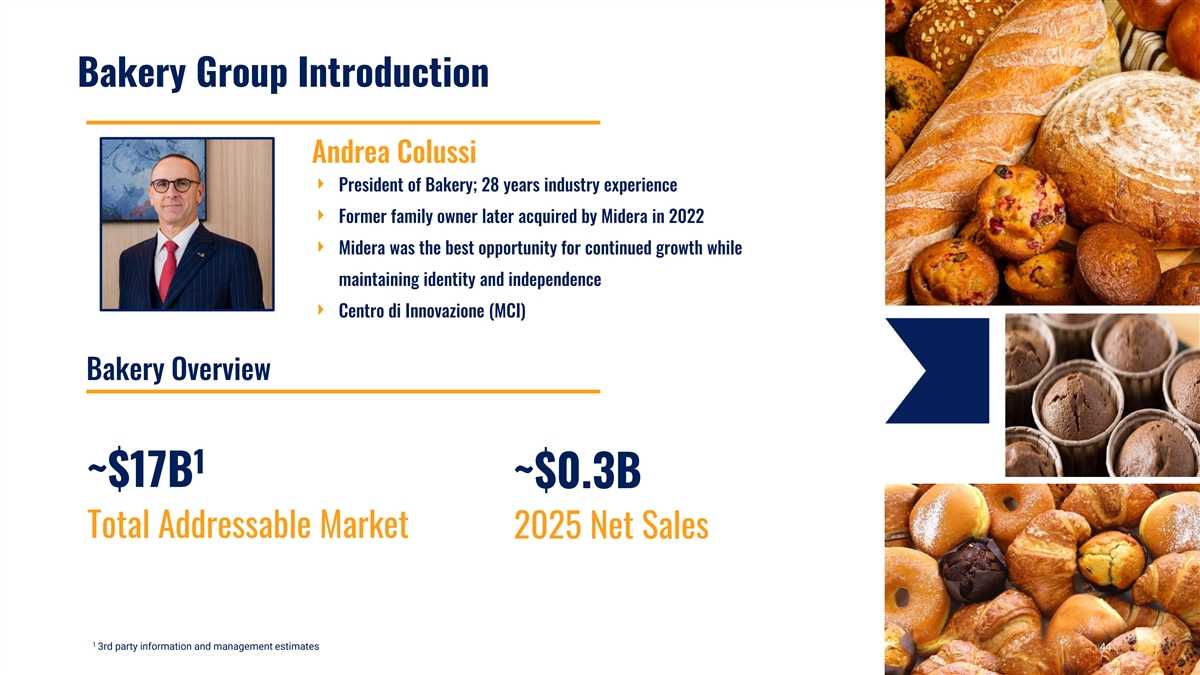
Bakery Group Introduction Andrea Colussi President of Bakery; 28 years industry experience Former family owner later acquired by Midera in 2022 Midera was the best opportunity for continued growth while maintaining identity and independence Centro di Innovazione (MCI) Bakery Overview 1 ~$17B ~$0.3B Total Addressable Market 2025 Net Sales 1 3rd party information and management estimates 44
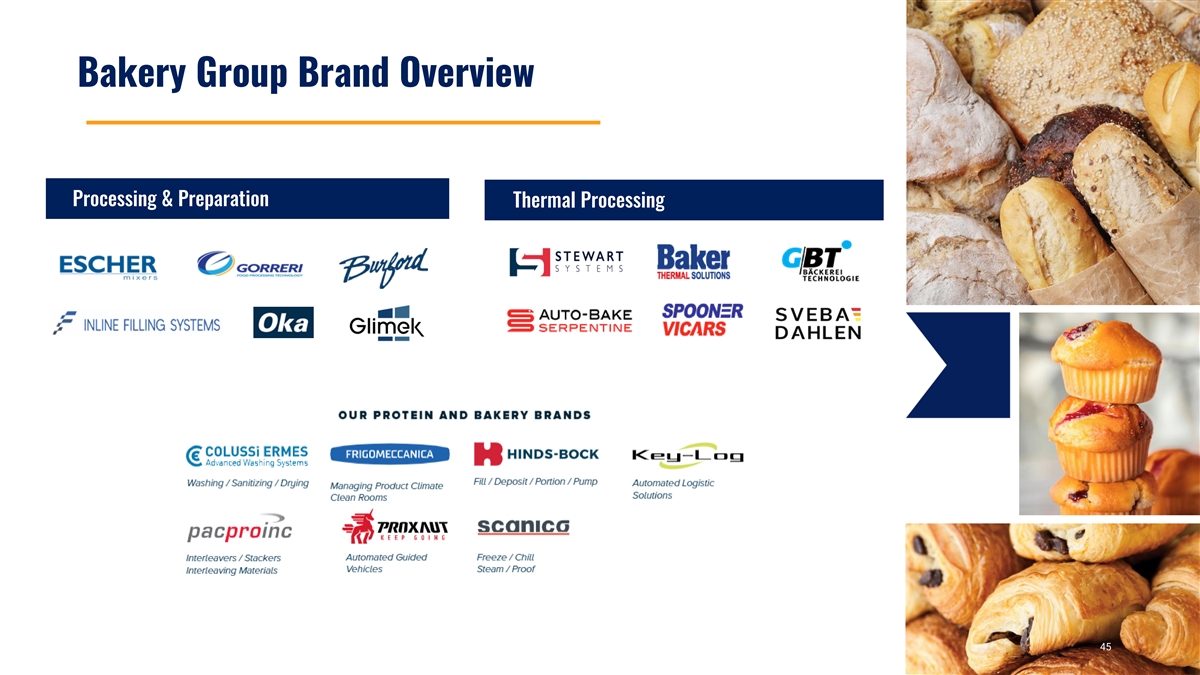
Bakery Group Brand Overview Processing & Preparation Thermal Processing 45
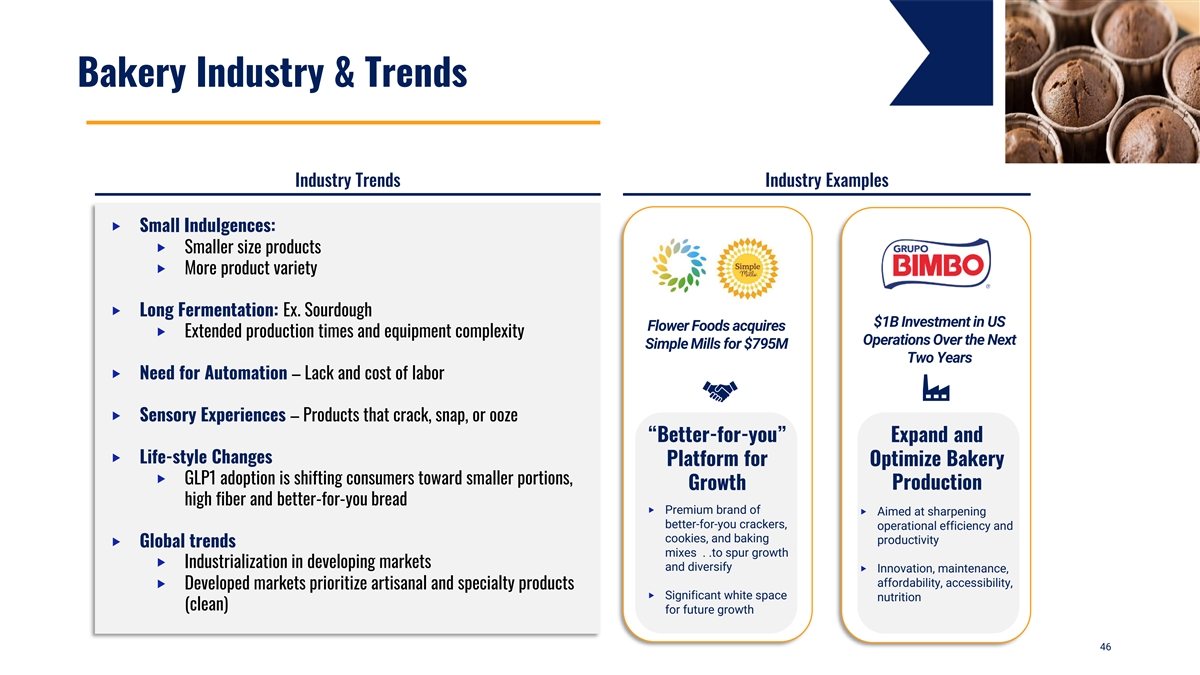
Bakery Industry & Trends Industry Trends Industry Examples ‣ Small Indulgences: ‣ Smaller size products ‣ More product variety ‣ Long Fermentation: Ex. Sourdough $1B Investment in US Flower Foods acquires ‣ Extended production times and equipment complexity Operations Over the Next Simple Mills for $795M Two Years ‣ Need for Automation – Lack and cost of labor ‣ Sensory Experiences – Products that crack, snap, or ooze “Better-for-you” Expand and ‣ Life-style Changes Platform for Optimize Bakery ‣ GLP1 adoption is shifting consumers toward smaller portions, Growth Production high fiber and better-for-you bread ‣ Premium brand of ‣ Aimed at sharpening better-for-you crackers, operational efficiency and cookies, and baking productivity ‣ Global trends mixes . .to spur growth ‣ Industrialization in developing markets and diversify ‣ Innovation, maintenance, affordability, accessibility, ‣ Developed markets prioritize artisanal and specialty products ‣ Significant white space nutrition (clean) for future growth 46 46 46
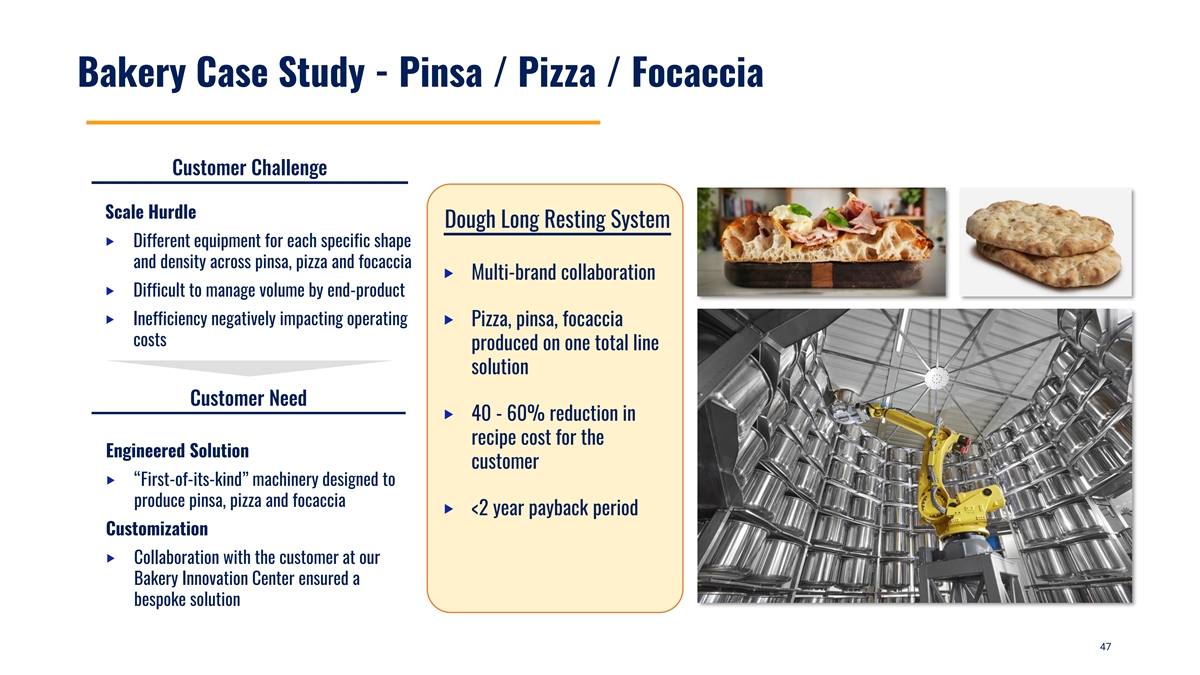
Bakery Case Study - Pinsa / Pizza / Focaccia Customer Challenge Scale Hurdle Dough Long Resting System ‣ Different equipment for each specific shape and density across pinsa, pizza and focaccia ‣ Multi-brand collaboration ‣ Difficult to manage volume by end-product ‣ Inefficiency negatively impacting operating ‣ Pizza, pinsa, focaccia costs produced on one total line solution Customer Need ‣ 40 - 60% reduction in recipe cost for the Engineered Solution customer ‣ “First-of-its-kind” machinery designed to produce pinsa, pizza and focaccia ‣ <2 year payback period Customization ‣ Collaboration with the customer at our Bakery Innovation Center ensured a bespoke solution 47
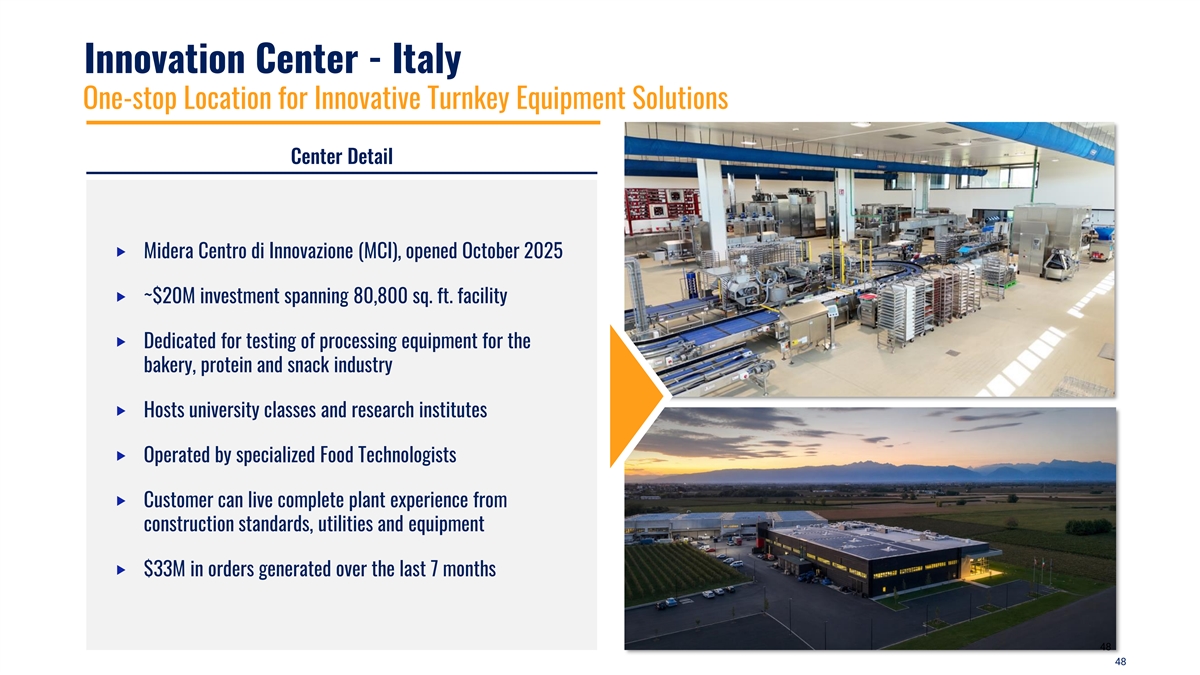
Innovation Center - Italy One-stop Location for Innovative Turnkey Equipment Solutions Center Detail ‣ Midera Centro di Innovazione (MCI), opened October 2025 ‣ ~$20M investment spanning 80,800 sq. ft. facility ‣ Dedicated for testing of processing equipment for the bakery, protein and snack industry ‣ Hosts university classes and research institutes ‣ Operated by specialized Food Technologists ‣ Customer can live complete plant experience from construction standards, utilities and equipment ‣ $33M in orders generated over the last 7 months 48 48
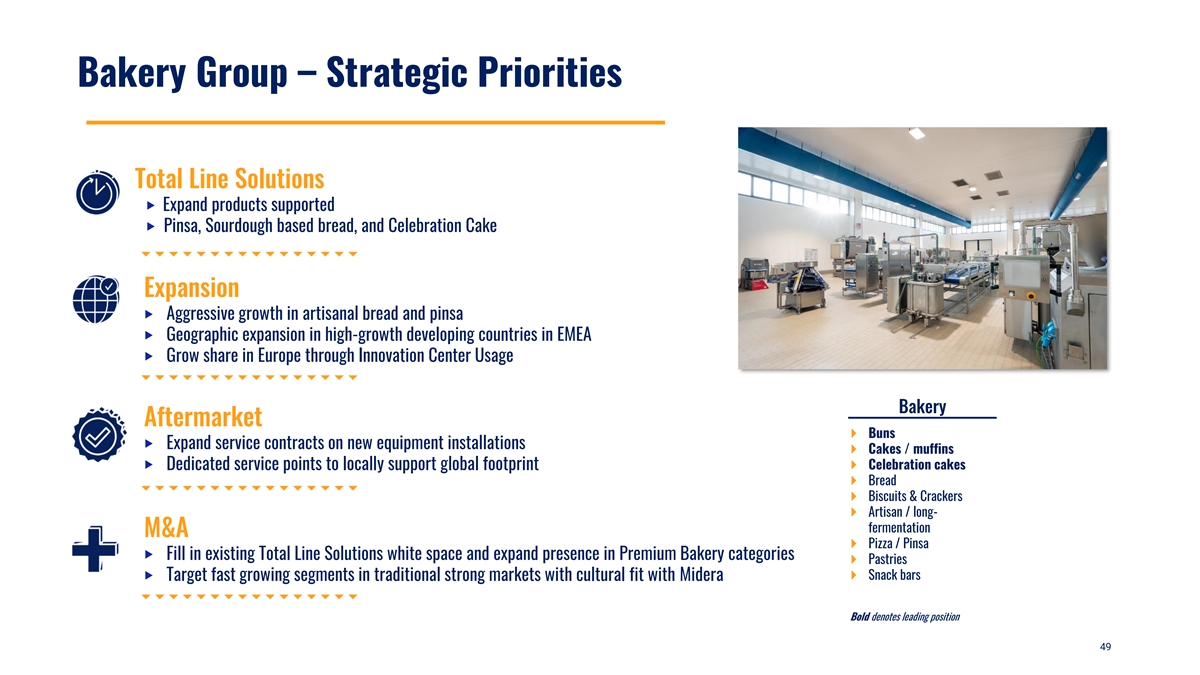
Bakery Group – Strategic Priorities Total Line Solutions ‣ Expand products supported ‣ Pinsa, Sourdough based bread, and Celebration Cake Expansion ‣ Aggressive growth in artisanal bread and pinsa ‣ Geographic expansion in high-growth developing countries in EMEA ‣ Grow share in Europe through Innovation Center Usage Bakery Aftermarket } Buns ‣ Expand service contracts on new equipment installations } Cakes / muffins ‣ Dedicated service points to locally support global footprint} Celebration cakes } Bread } Biscuits & Crackers } Artisan / long- fermentation M&A } Pizza / Pinsa ‣ Fill in existing Total Line Solutions white space and expand presence in Premium Bakery categories } Pastries } Snack bars ‣ Target fast growing segments in traditional strong markets with cultural fit with Midera Bold denotes leading position 49
SNACK Scott Ruhe Group President 50
Snack Group Introduction Scott Ruhe Owner of JC Ford for 35 years and CEO for 20 36 years industry experience Active President, JC Ford Respected food industry professional Inductee Tortilla Industry Association Hall of Fame in 2026 Snack Overview 1 ~$18B ~$0.1B Total Addressable Market 2025 Net Sales 1 3rd party information and management estimates 51
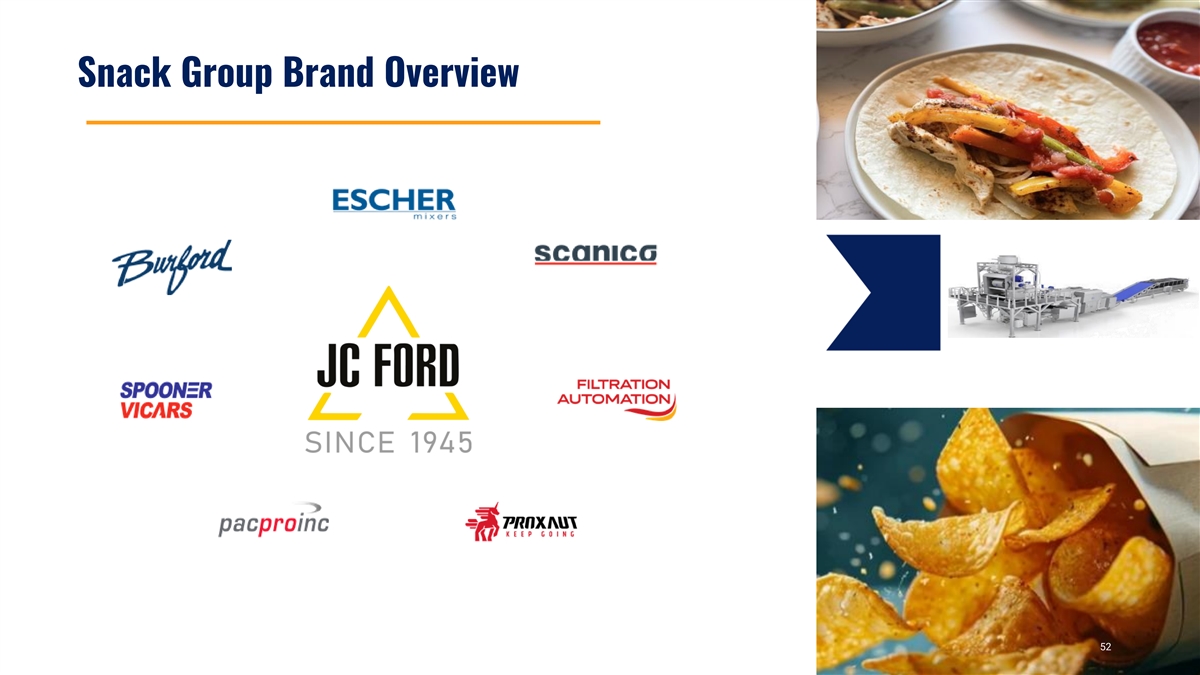
Snack Group Brand Overview 52
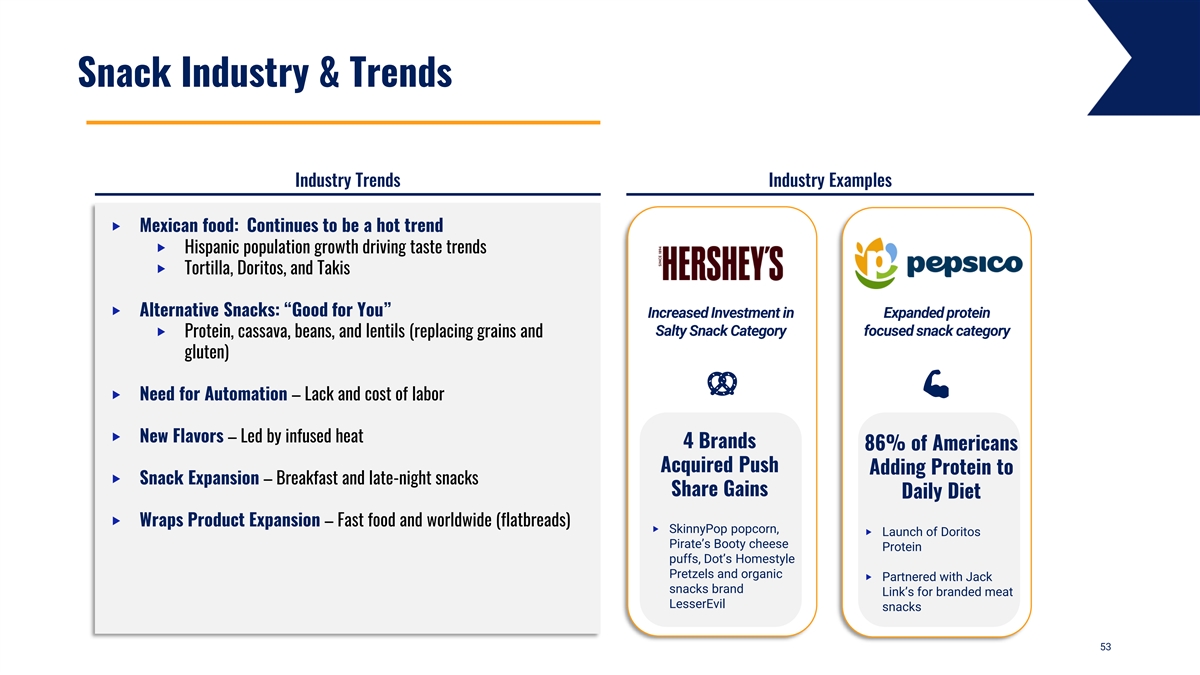
Snack Industry & Trends Industry Trends Industry Examples ‣ Mexican food: Continues to be a hot trend ‣ Hispanic population growth driving taste trends ‣ Tortilla, Doritos, and Takis ‣ Alternative Snacks: “Good for You” Increased Investment in Expanded protein Salty Snack Category focused snack category ‣ Protein, cassava, beans, and lentils (replacing grains and gluten) ‣ Need for Automation – Lack and cost of labor ‣ New Flavors – Led by infused heat 4 Brands 86% of Americans Acquired Push Adding Protein to ‣ Snack Expansion – Breakfast and late-night snacks Share Gains Daily Diet ‣ Wraps Product Expansion – Fast food and worldwide (flatbreads) ‣ SkinnyPop popcorn, ‣ Launch of Doritos Pirate’s Booty cheese Protein puffs, Dot’s Homestyle Pretzels and organic ‣ Partnered with Jack snacks brand Link’s for branded meat LesserEvil snacks 53 53 53 53
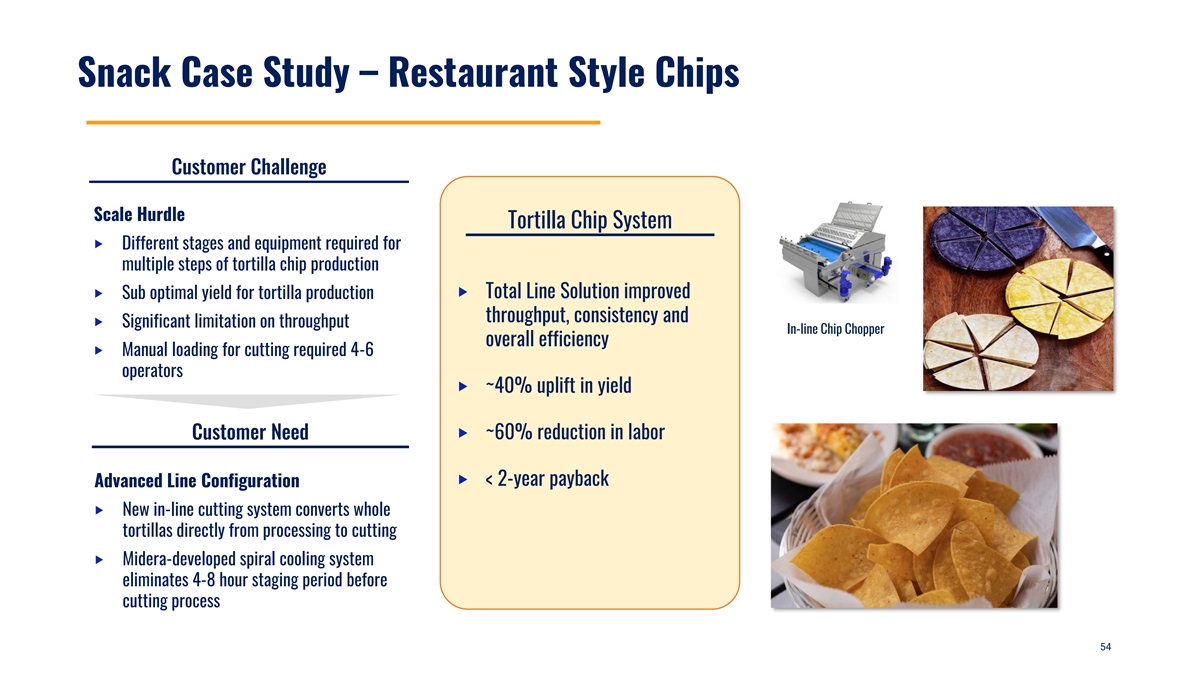
Snack Case Study – Restaurant Style Chips Customer Challenge Scale Hurdle Tortilla Chip System ‣ Different stages and equipment required for multiple steps of tortilla chip production ‣ Sub optimal yield for tortilla production ‣ Total Line Solution improved throughput, consistency and ‣ Significant limitation on throughput In-line Chip Chopper overall efficiency ‣ Manual loading for cutting required 4-6 operators ‣ ~40% uplift in yield Customer Need ‣ ~60% reduction in labor ‣ < 2-year payback Advanced Line Configuration ‣ New in-line cutting system converts whole tortillas directly from processing to cutting ‣ Midera-developed spiral cooling system eliminates 4-8 hour staging period before cutting process 54
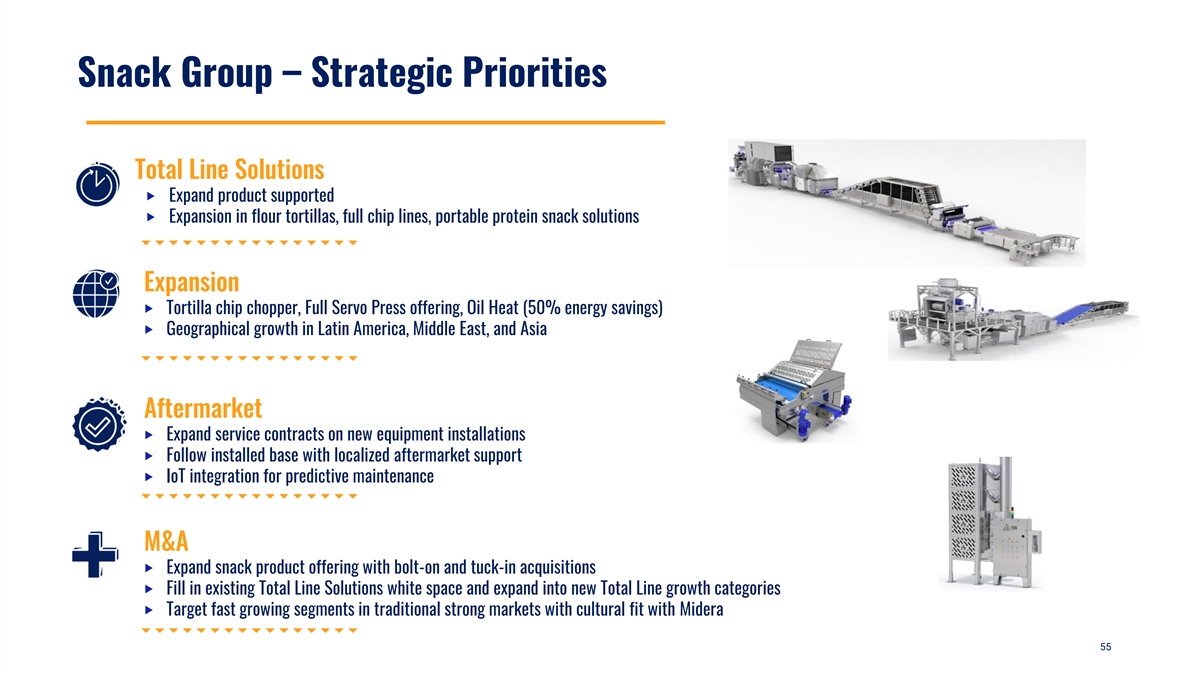
Snack Group – Strategic Priorities Total Line Solutions ‣ Expand product supported ‣ Expansion in flour tortillas, full chip lines, portable protein snack solutions Expansion ‣ Tortilla chip chopper, Full Servo Press offering, Oil Heat (50% energy savings) ‣ Geographical growth in Latin America, Middle East, and Asia Aftermarket ‣ Expand service contracts on new equipment installations ‣ Follow installed base with localized aftermarket support ‣ IoT integration for predictive maintenance M&A ‣ Expand snack product offering with bolt-on and tuck-in acquisitions ‣ Fill in existing Total Line Solutions white space and expand into new Total Line growth categories ‣ Target fast growing segments in traditional strong markets with cultural fit with Midera 55

6 M&A Framework 56
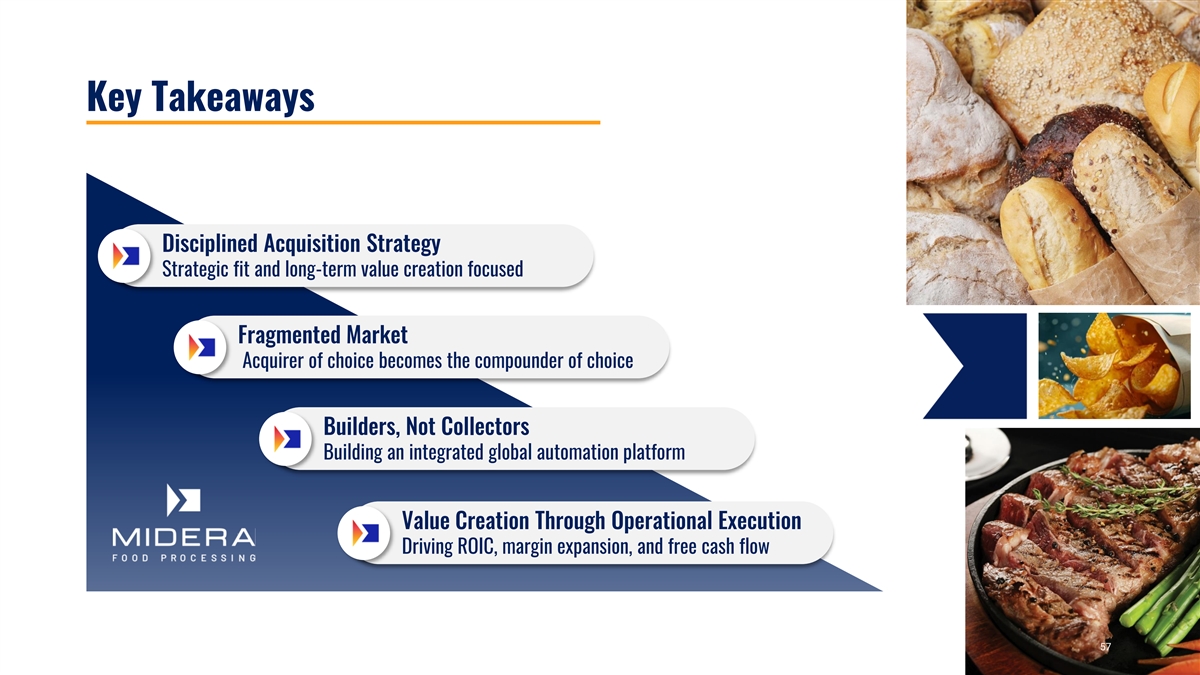
Key Takeaways Disciplined Acquisition Strategy Strategic fit and long-term value creation focused Fragmented Market Acquirer of choice becomes the compounder of choice Builders, Not Collectors Building an integrated global automation platform Value Creation Through Operational Execution Driving ROIC, margin expansion, and free cash flow 57
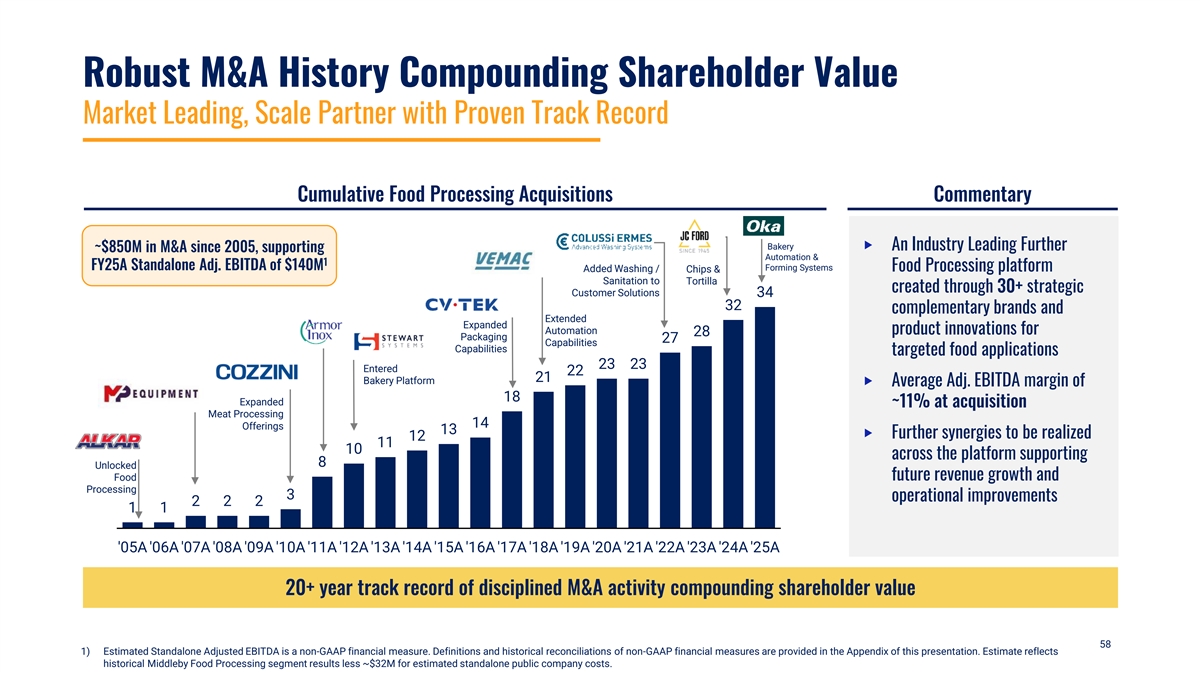
Robust M&A History Compounding Shareholder Value Market Leading, Scale Partner with Proven Track Record Cumulative Food Processing Acquisitions Commentary Bakery ‣ An Industry Leading Further ~$850M in M&A since 2005, supporting Automation & 1 FY25A Standalone Adj. EBITDA of $140M Forming Systems Food Processing platform Added Washing / Chips & Sanitation to Tortilla created through 30+ strategic Customer Solutions 34 32 complementary brands and Extended Expanded Automation product innovations for 28 Packaging 27 Capabilities Capabilities targeted food applications 23 23 Entered 22 21 Bakery Platform ‣ Average Adj. EBITDA margin of 18 Expanded ~11% at acquisition Meat Processing 14 Offerings 13 ‣ Further synergies to be realized 12 11 10 across the platform supporting 8 Unlocked Food future revenue growth and Processing 3 operational improvements 2 2 2 1 1 '05A '06A '07A '08A '09A '10A '11A '12A '13A '14A '15A '16A '17A '18A '19A '20A '21A '22A '23A '24A '25A 20+ year track record of disciplined M&A activity compounding shareholder value 58 1) Estimated Standalone Adjusted EBITDA is a non-GAAP financial measure. Definitions and historical reconciliations of non-GAAP financial measures are provided in the Appendix of this presentation. Estimate reflects historical Middleby Food Processing segment results less ~$32M for estimated standalone public company costs.
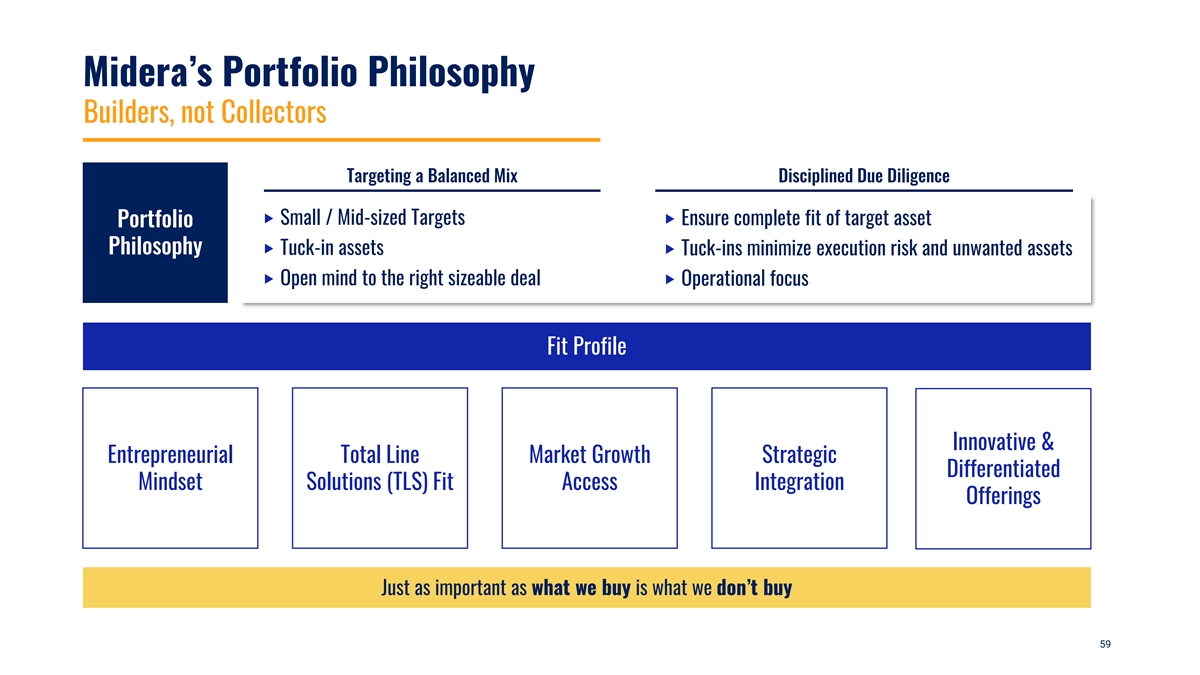
Midera’s Portfolio Philosophy Builders, not Collectors Targeting a Balanced Mix Disciplined Due Diligence ‣ Small / Mid-sized Targets ‣ Ensure complete fit of target asset Portfolio Philosophy ‣ Tuck-in assets ‣ Tuck-ins minimize execution risk and unwanted assets ‣ Open mind to the right sizeable deal ‣ Operational focus Fit Profile Innovative & Entrepreneurial Total Line Market Growth Strategic Differentiated Mindset Solutions (TLS) Fit Access Integration Offerings Just as important as what we buy is what we don’t buy 59
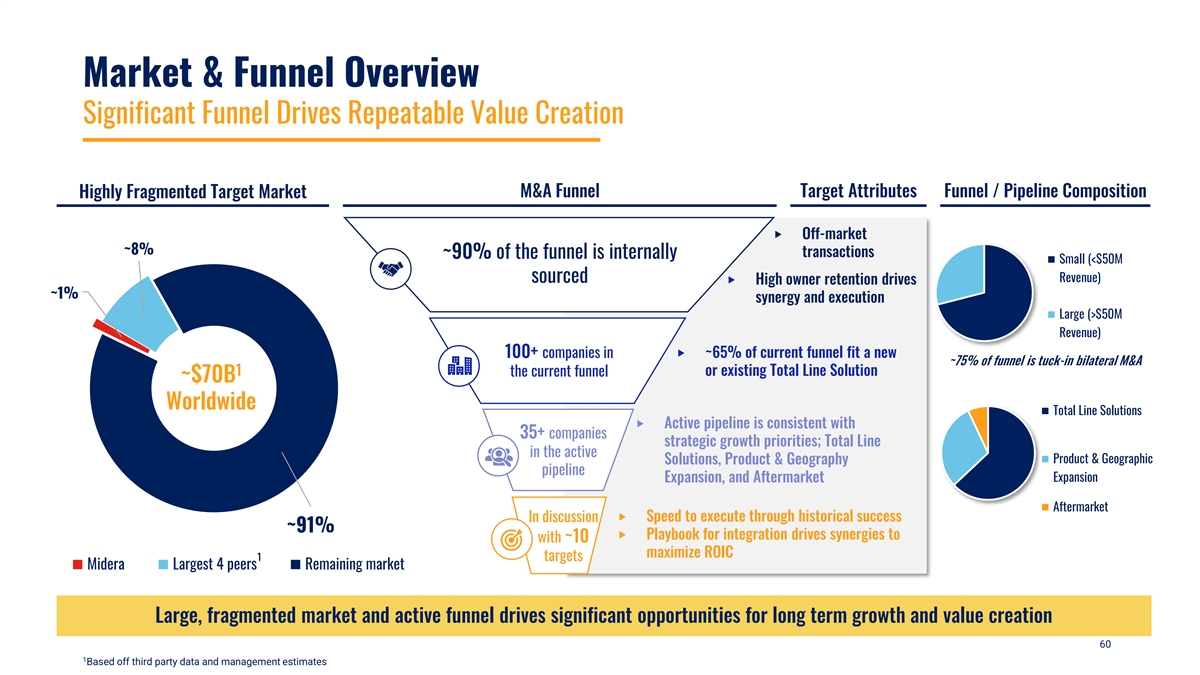
Market & Funnel Overview Significant Funnel Drives Repeatable Value Creation M&A Funnel Target Attributes Funnel / Pipeline Composition Highly Fragmented Target Market ‣ Off-market ~8% transactions ~90% of the funnel is internally Small (<$50M sourced Revenue) ‣ High owner retention drives ~1% synergy and execution Large (>$50M Revenue) ‣ ~65% of current funnel fit a new 100+ companies in ~75% of funnel is tuck-in bilateral M&A 1 the current funnel or existing Total Line Solution ~$70B Worldwide Total Line Solutions ‣ Active pipeline is consistent with 35+ companies strategic growth priorities; Total Line in the active Product & Geographic Solutions, Product & Geography pipeline Expansion, and Aftermarket Expansion Aftermarket ‣ Speed to execute through historical success In discussion ~91% ‣ Playbook for integration drives synergies to with ~10 maximize ROIC 1 targets Midera Largest 4 peers Remaining market Large, fragmented market and active funnel drives significant opportunities for long term growth and value creation 60 1 Based off third party data and management estimates
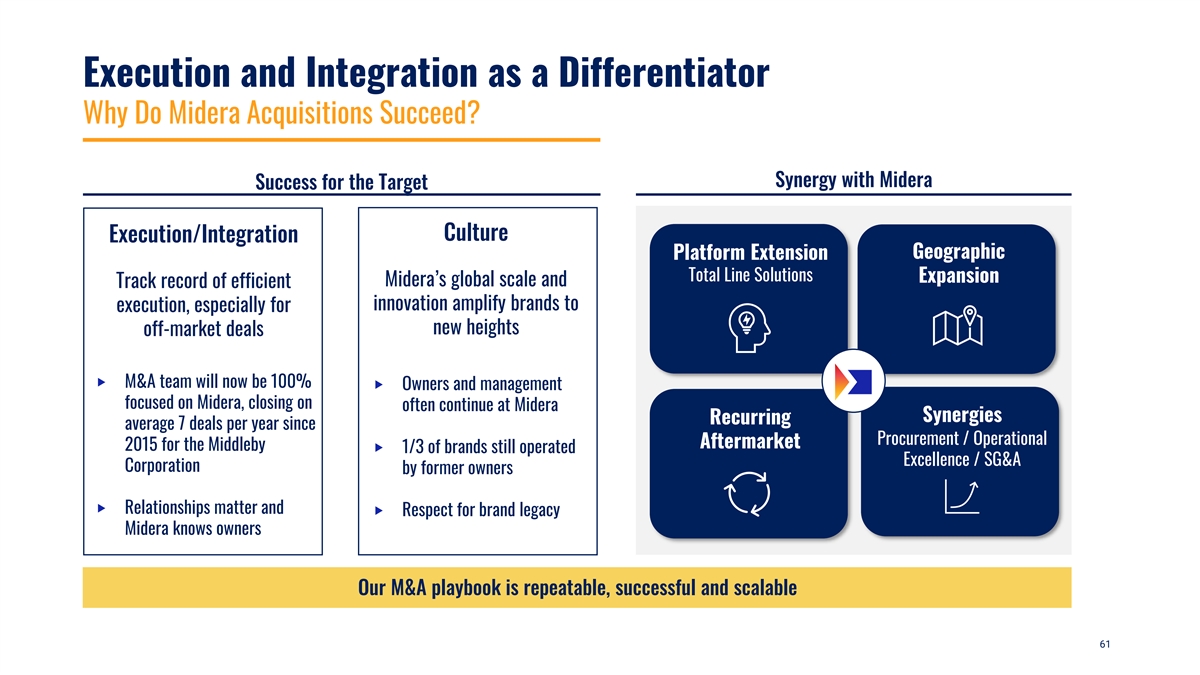
Execution and Integration as a Differentiator Why Do Midera Acquisitions Succeed? Synergy with Midera Success for the Target Culture Execution/Integration Geographic Platform Extension Total Line Solutions Expansion Midera’s global scale and Track record of efficient innovation amplify brands to execution, especially for new heights off-market deals ‣ M&A team will now be 100% ‣ Owners and management focused on Midera, closing on often continue at Midera Synergies Recurring average 7 deals per year since Procurement / Operational Aftermarket 2015 for the Middleby ‣ 1/3 of brands still operated Excellence / SG&A Corporation by former owners ‣ Relationships matter and ‣ Respect for brand legacy Midera knows owners Our M&A playbook is repeatable, successful and scalable 61
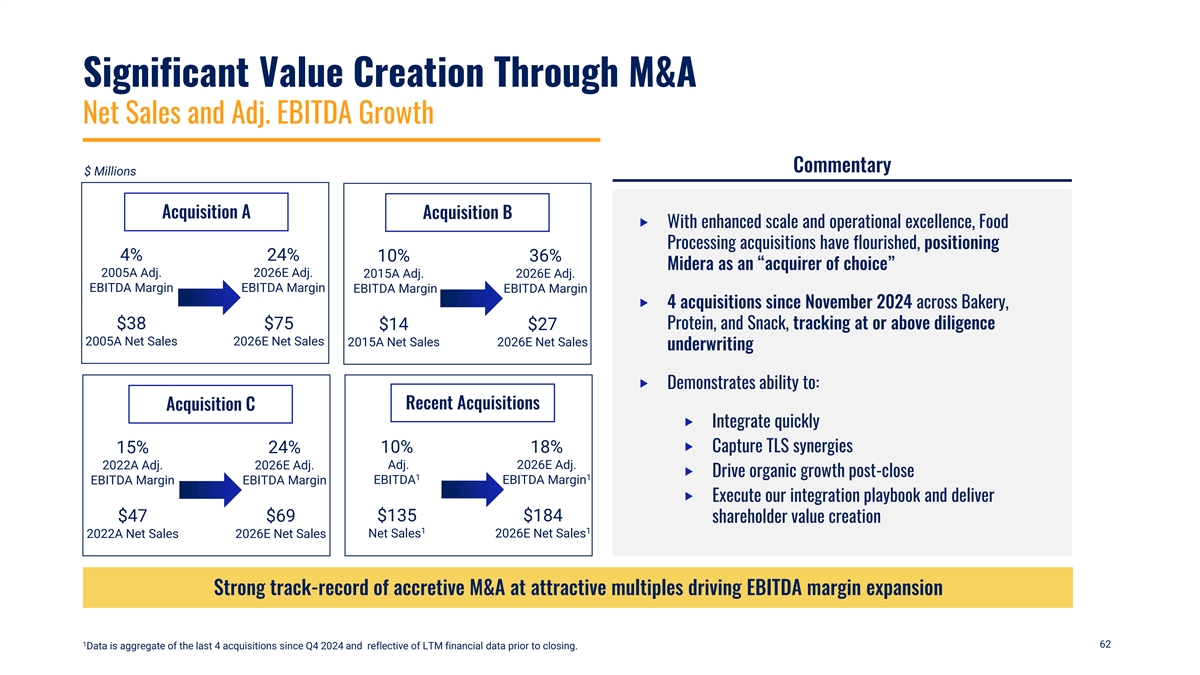
Significant Value Creation Through M&A Net Sales and Adj. EBITDA Growth Commentary $ Millions Acquisition A Acquisition B ‣ With enhanced scale and operational excellence, Food Processing acquisitions have flourished, positioning 4% 24% 10% 36% Midera as an “acquirer of choice” 2005A Adj. 2026E Adj. 2015A Adj. 2026E Adj. EBITDA Margin EBITDA Margin EBITDA Margin EBITDA Margin ‣ 4 acquisitions since November 2024 across Bakery, $38 $75 $14 $27 Protein, and Snack, tracking at or above diligence 2005A Net Sales 2026E Net Sales 2015A Net Sales 2026E Net Sales underwriting ‣ Demonstrates ability to: Recent Acquisitions Acquisition C ‣ Integrate quickly 10% 18% ‣ Capture TLS synergies 15% 24% Adj. 2026E Adj. 2022A Adj. 2026E Adj. ‣ Drive organic growth post-close 1 1 EBITDA EBITDA Margin EBITDA Margin EBITDA Margin ‣ Execute our integration playbook and deliver $135 $184 $47 $69 shareholder value creation 1 1 Net Sales 2026E Net Sales 2022A Net Sales 2026E Net Sales Strong track-record of accretive M&A at attractive multiples driving EBITDA margin expansion 1 62 Data is aggregate of the last 4 acquisitions since Q4 2024 and reflective of LTM financial data prior to closing.
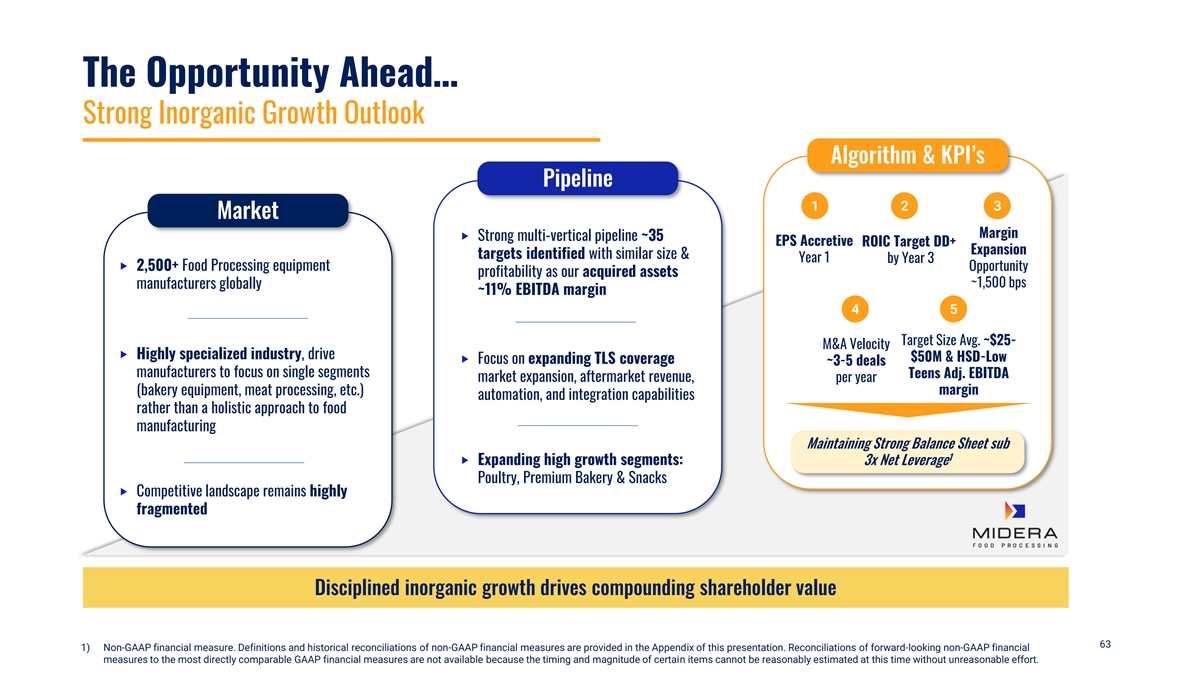
The Opportunity Ahead… Strong Inorganic Growth Outlook Algorithm & KPI’s Pipeline 1 2 3 Market Margin ‣ Strong multi-vertical pipeline ~35 EPS Accretive ROIC Target DD+ Expansion targets identified with similar size & Year 1 by Year 3 ‣ 2,500+ Food Processing equipment Opportunity profitability as our acquired assets ~1,500 bps manufacturers globally ~11% EBITDA margin 4 5 Target Size Avg. ~$25- M&A Velocity ‣ Highly specialized industry, drive $50M & HSD-Low ‣ Focus on expanding TLS coverage ~3-5 deals manufacturers to focus on single segments Teens Adj. EBITDA market expansion, aftermarket revenue, per year (bakery equipment, meat processing, etc.) margin automation, and integration capabilities rather than a holistic approach to food manufacturing Maintaining Strong Balance Sheet sub 1 ‣ Expanding high growth segments: 3x Net Leverage Poultry, Premium Bakery & Snacks ‣ Competitive landscape remains highly fragmented Disciplined inorganic growth drives compounding shareholder value 63 1) Non-GAAP financial measure. Definitions and historical reconciliations of non-GAAP financial measures are provided in the Appendix of this presentation. Reconciliations of forward-looking non-GAAP financial measures to the most directly comparable GAAP financial measures are not available because the timing and magnitude of certain items cannot be reasonably estimated at this time without unreasonable effort.

7 Financial Review 64

Key Takeaways Market Leading Brands Global growing industries Clear Path to Maintain Best-in-Class Margins With above market topline growth Clean Balance Sheet & Strong Free Cash Flow Built to grow Fragmented Market Acquirer of choice becomes the compounder of choice 65
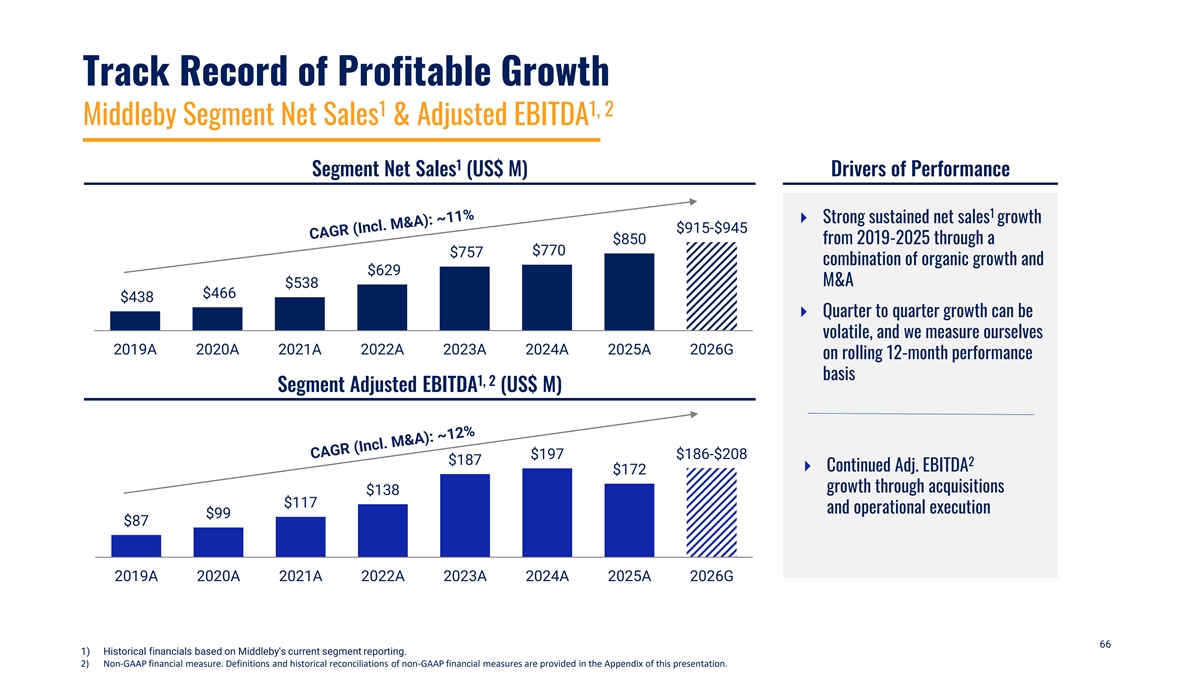
Track Record of Profitable Growth 1 1, 2 Middleby Segment Net Sales & Adjusted EBITDA 1 Segment Net Sales (US$ M) Drivers of Performance 1 ⏵ Strong sustained net sales growth $915-$945 $850 from 2019-2025 through a $770 $757 combination of organic growth and $629 M&A $538 $466 $438 ⏵ Quarter to quarter growth can be volatile, and we measure ourselves 2019A 2020A 2021A 2022A 2023A 2024A 2025A 2026G on rolling 12-month performance basis 1, 2 Segment Adjusted EBITDA (US$ M) $186-$208 $197 $187 2 ⏵ Continued Adj. EBITDA $172 growth through acquisitions $138 $117 and operational execution $99 $87 2019A 2020A 2021A 2022A 2023A 2024A 2025A 2026G 66 1) Historical financials based on Middleby's current segment reporting. 2) Non-GAAP financial measure. Definitions and historical reconciliations of non-GAAP financial measures are provided in the Appendix of this presentation.
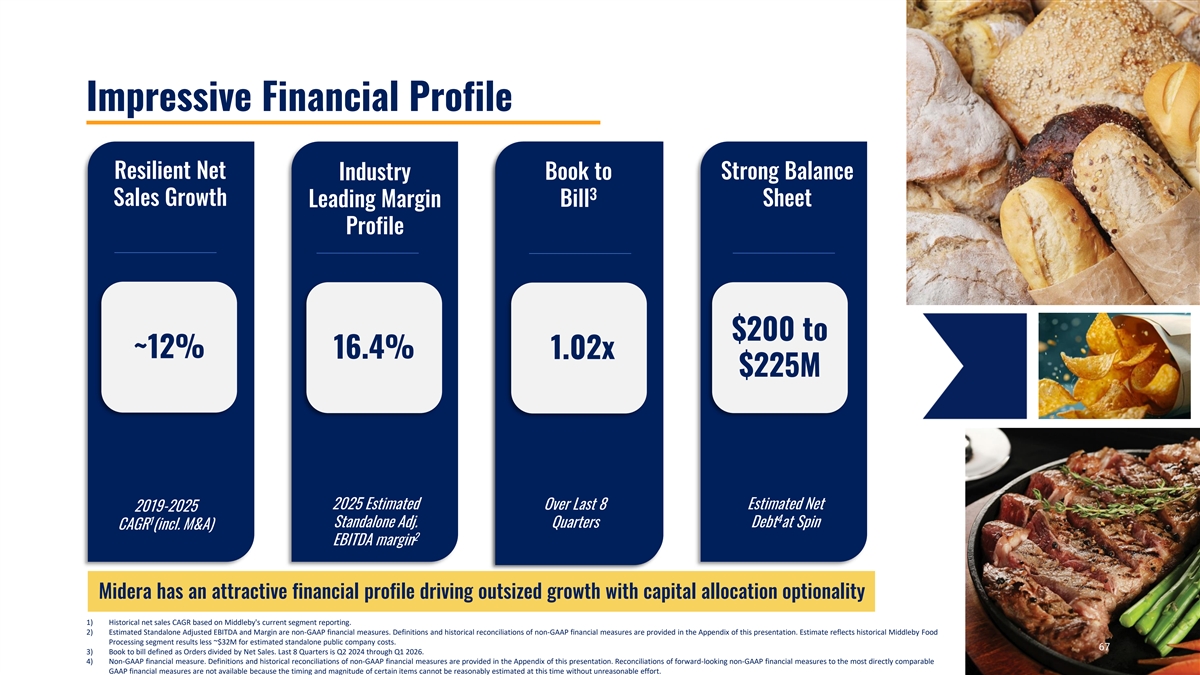
Impressive Financial Profile Resilient Net Industry Book to Strong Balance 3 Sales Growth Sheet Leading Margin Bill Profile $200 to ~12% 16.4% 1.02x $225M 2025 Estimated Over Last 8 Estimated Net 2019-2025 4 1 Standalone Adj. Quarters Debt at Spin CAGR (incl. M&A) 2 EBITDA margin Midera has an attractive financial profile driving outsized growth with capital allocation optionality 1) Historical net sales CAGR based on Middleby's current segment reporting. 2) Estimated Standalone Adjusted EBITDA and Margin are non-GAAP financial measures. Definitions and historical reconciliations of non-GAAP financial measures are provided in the Appendix of this presentation. Estimate reflects historical Middleby Food Processing segment results less ~$32M for estimated standalone public company costs. 67 67 3) Book to bill defined as Orders divided by Net Sales. Last 8 Quarters is Q2 2024 through Q1 2026. 4) Non-GAAP financial measure. Definitions and historical reconciliations of non-GAAP financial measures are provided in the Appendix of this presentation. Reconciliations of forward-looking non-GAAP financial measures to the most directly comparable GAAP financial measures are not available because the timing and magnitude of certain items cannot be reasonably estimated at this time without unreasonable effort.
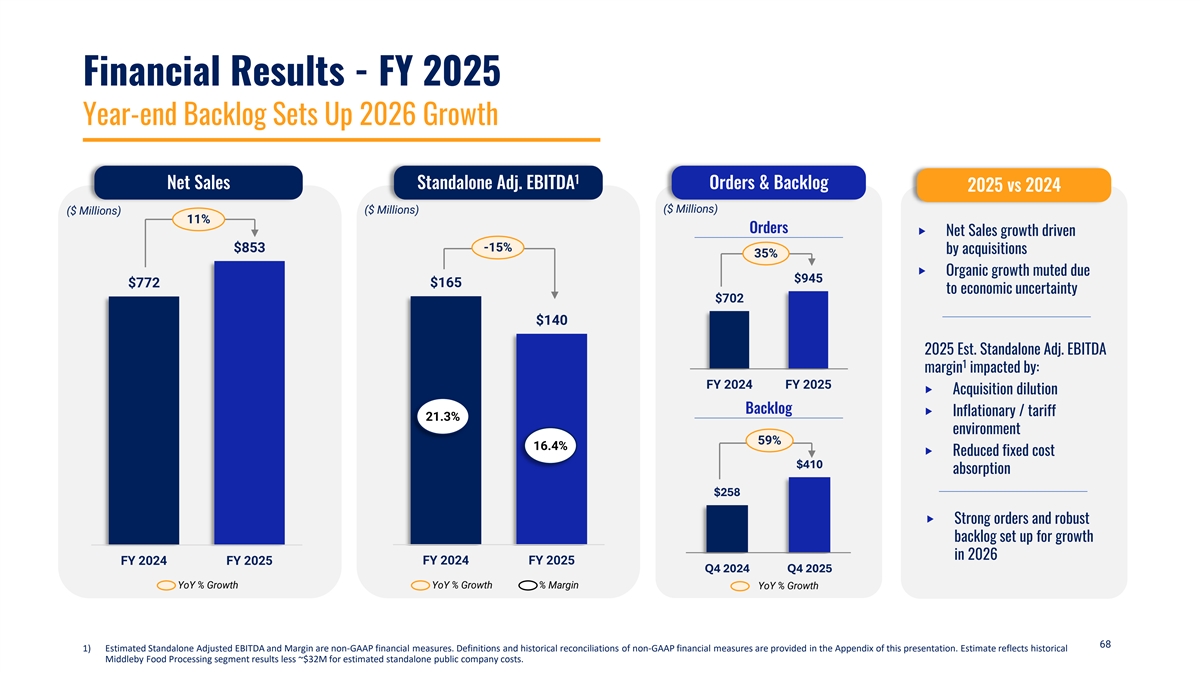
Financial Results - FY 2025 Year-end Backlog Sets Up 2026 Growth 1 Net Sales Standalone Adj. EBITDA Orders & Backlog 2025 vs 2024 ($ Millions) ($ Millions) ($ Millions) 11% Orders ‣ Net Sales growth driven -15% $853 by acquisitions 35% ‣ Organic growth muted due $945 $772 $165 to economic uncertainty $702 $140 2025 Est. Standalone Adj. EBITDA 1 margin impacted by: FY 2024 FY 2025 ‣ Acquisition dilution Backlog ‣ Inflationary / tariff 21.3% environment 59% 16.4% ‣ Reduced fixed cost $410 absorption $258 ‣ Strong orders and robust backlog set up for growth in 2026 FY 2024 FY 2025 FY 2024 FY 2025 Q4 2024 Q4 2025 YoY % Growth YoY % Growth % Margin YoY % Growth 68 1) Estimated Standalone Adjusted EBITDA and Margin are non-GAAP financial measures. Definitions and historical reconciliations of non-GAAP financial measures are provided in the Appendix of this presentation. Estimate reflects historical Middleby Food Processing segment results less ~$32M for estimated standalone public company costs.
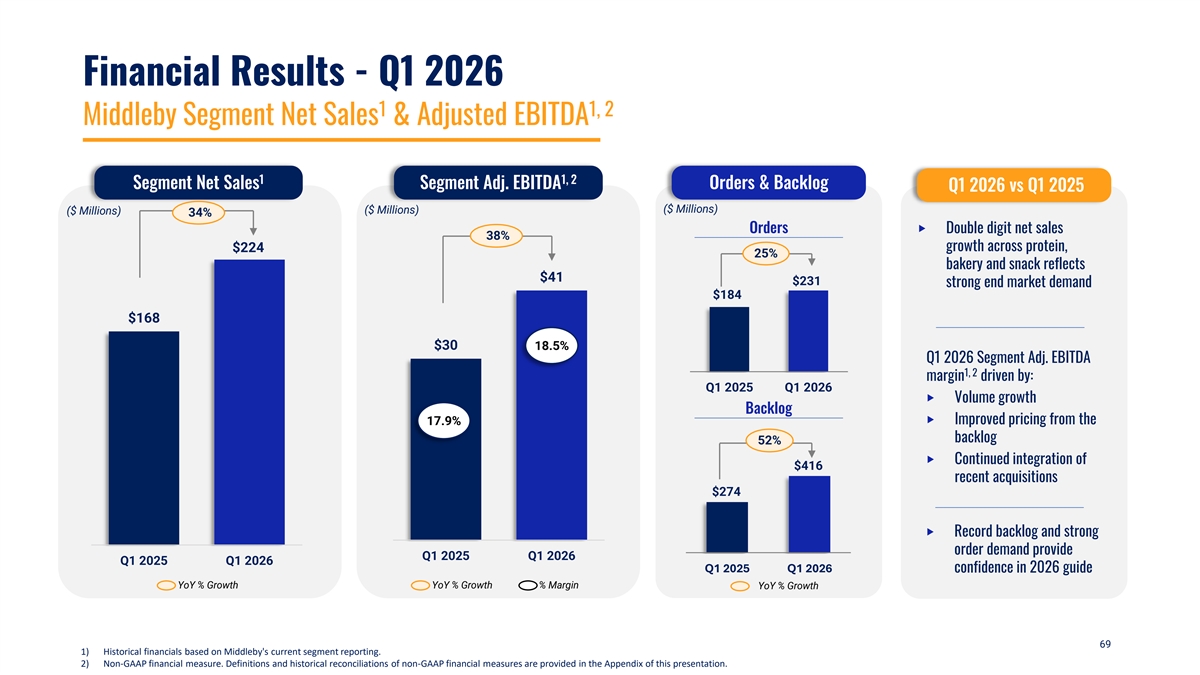
Financial Results - Q1 2026 1 1, 2 Middleby Segment Net Sales & Adjusted EBITDA 1 1, 2 Segment Net Sales Segment Adj. EBITDA Orders & Backlog Q1 2026 vs Q1 2025 ($ Millions) ($ Millions) ($ Millions) 34% Orders ‣ Double digit net sales 38% growth across protein, $224 25% bakery and snack reflects $41 $231 strong end market demand $184 $168 $30 18.5% Q1 2026 Segment Adj. EBITDA 1, 2 margin driven by: Q1 2025 Q1 2026 ‣ Volume growth Backlog 17.9% ‣ Improved pricing from the backlog 52% ‣ Continued integration of $416 recent acquisitions $274 ‣ Record backlog and strong order demand provide Q1 2025 Q1 2026 Q1 2025 Q1 2026 Q1 2025 Q1 2026 confidence in 2026 guide YoY % Growth YoY % Growth % Margin YoY % Growth 69 1) Historical financials based on Middleby's current segment reporting. 2) Non-GAAP financial measure. Definitions and historical reconciliations of non-GAAP financial measures are provided in the Appendix of this presentation.
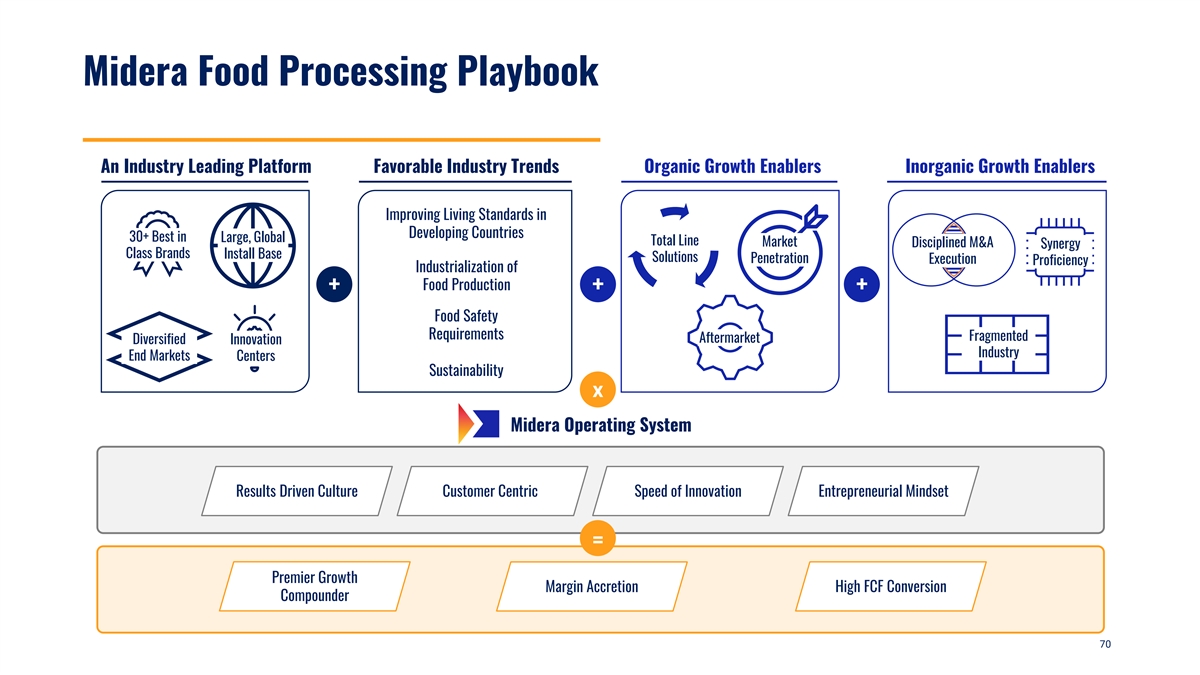
Midera Food Processing Playbook An Industry Leading Platform Favorable Industry Trends Organic Growth Enablers Inorganic Growth Enablers Improving Living Standards in Developing Countries 30+ Best in Large, Global Total Line Market Disciplined M&A Synergy Class Brands Install Base Solutions Penetration Execution Proficiency Industrialization of Food Production + + + Food Safety Requirements Fragmented Aftermarket Diversified Innovation Industry End Markets Centers Sustainability x Midera Operating System Results Driven Culture Customer Centric Speed of Innovation Entrepreneurial Mindset = Premier Growth Margin Accretion High FCF Conversion Compounder 70
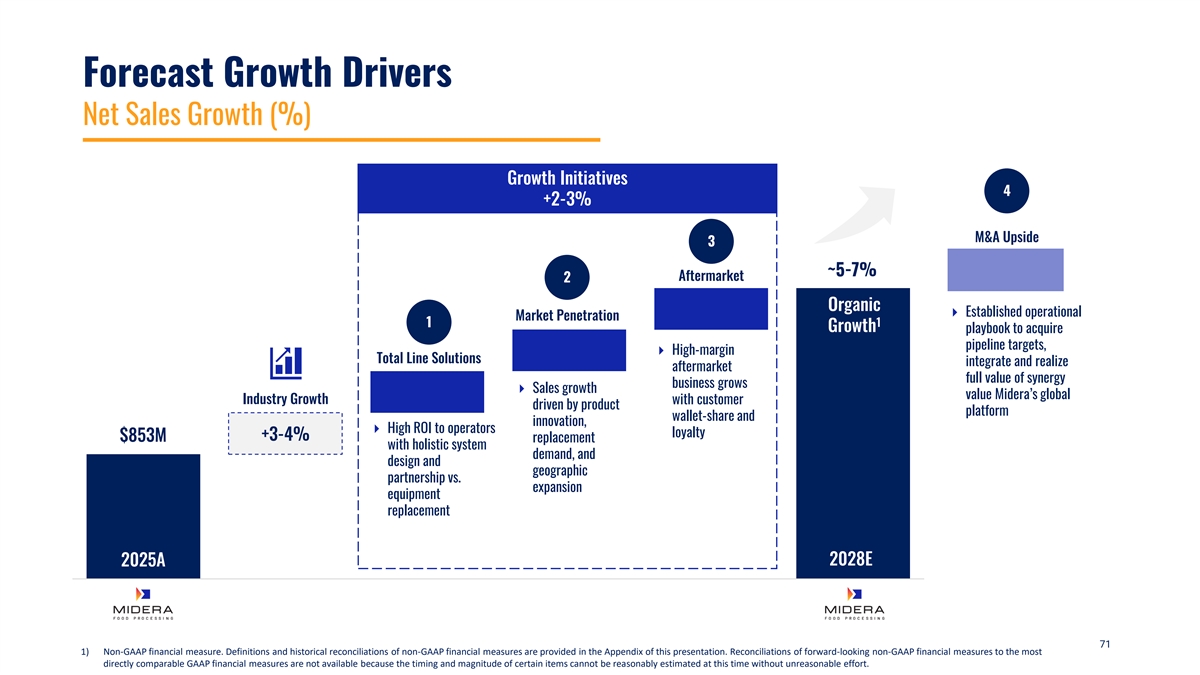
Forecast Growth Drivers Net Sales Growth (%) Growth Initiatives 4 +2-3% M&A Upside 3 2.5-3.5% ~5-7% Aftermarket 2 Organic ⏵ Established operational Market Penetration 1 1 Growth playbook to acquire pipeline targets, ⏵ High-margin Total Line Solutions integrate and realize aftermarket full value of synergy business grows ⏵ Sales growth value Midera’s global Industry Growth with customer driven by product platform wallet-share and innovation, ⏵ High ROI to operators loyalty +3-4% $853M replacement with holistic system demand, and design and geographic partnership vs. expansion equipment replacement 2025A 2028E 71 1) Non-GAAP financial measure. Definitions and historical reconciliations of non-GAAP financial measures are provided in the Appendix of this presentation. Reconciliations of forward-looking non-GAAP financial measures to the most directly comparable GAAP financial measures are not available because the timing and magnitude of certain items cannot be reasonably estimated at this time without unreasonable effort.
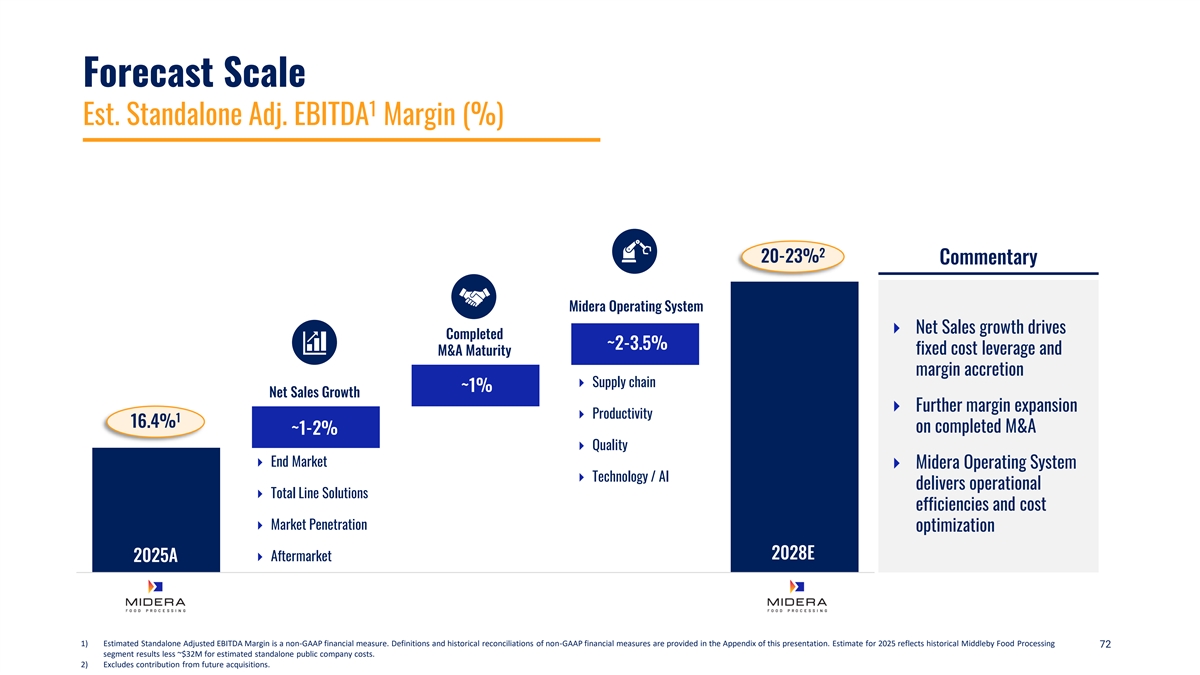
Forecast Scale 1 Est. Standalone Adj. EBITDA Margin (%) 2 2.5-3.5% 20-23% Commentary Midera Operating System ⏵ Net Sales growth drives Completed ~2-3.5% fixed cost leverage and M&A Maturity margin accretion ⏵ Supply chain ~1% Net Sales Growth ⏵ Further margin expansion ⏵ Productivity 1 16.4% on completed M&A ~1-2% ⏵ Quality ⏵ End Market ⏵ Midera Operating System ⏵ Technology / AI delivers operational ⏵ Total Line Solutions efficiencies and cost ⏵ Market Penetration optimization 2028E 2028E ⏵ Aftermarket 2025A 1) Estimated Standalone Adjusted EBITDA Margin is a non-GAAP financial measure. Definitions and historical reconciliations of non-GAAP financial measures are provided in the Appendix of this presentation. Estimate for 2025 reflects historical Middleby Food Processing 72 segment results less ~$32M for estimated standalone public company costs. 2) Excludes contribution from future acquisitions.
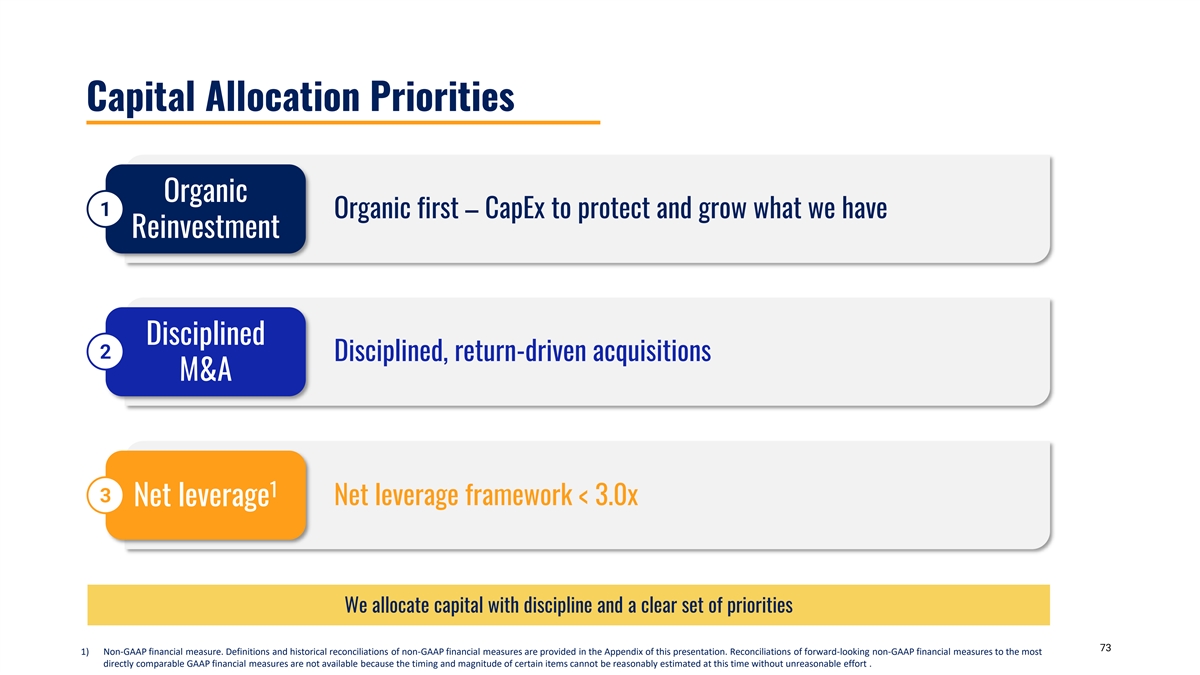
Capital Allocation Priorities Organic 1 Organic first – CapEx to protect and grow what we have Reinvestment Disciplined 2 Disciplined, return-driven acquisitions M&A 1 3 Net leverage framework < 3.0x Net leverage We allocate capital with discipline and a clear set of priorities 73 1) Non-GAAP financial measure. Definitions and historical reconciliations of non-GAAP financial measures are provided in the Appendix of this presentation. Reconciliations of forward-looking non-GAAP financial measures to the most directly comparable GAAP financial measures are not available because the timing and magnitude of certain items cannot be reasonably estimated at this time without unreasonable effort .
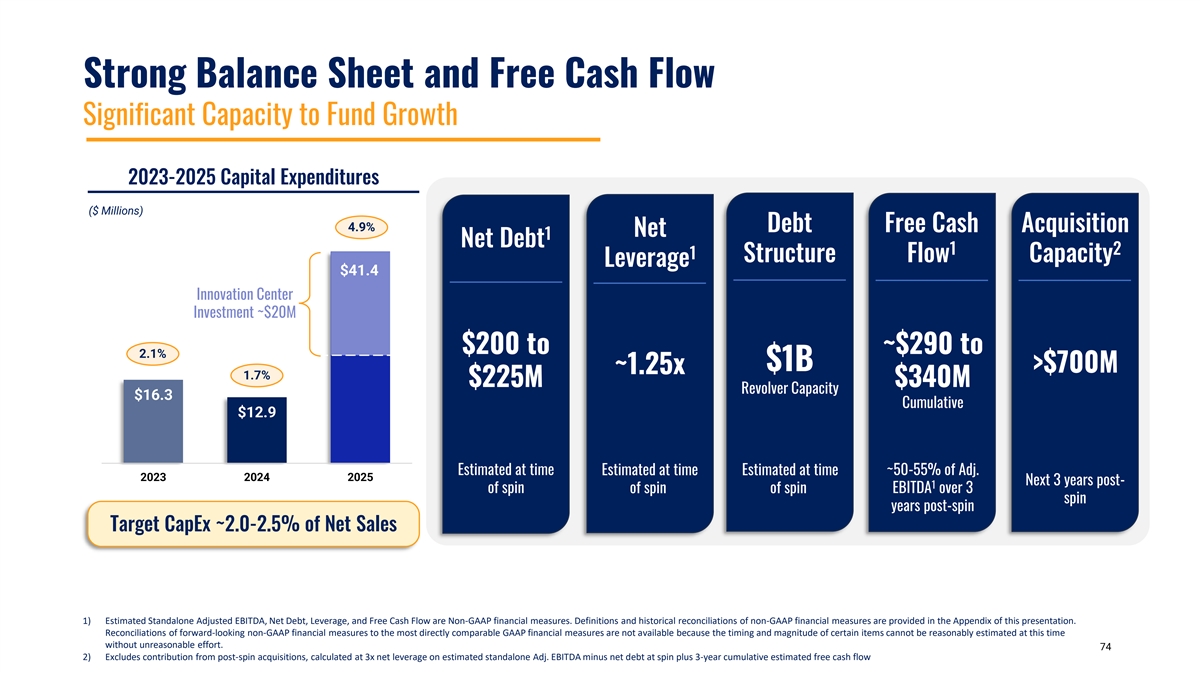
Strong Balance Sheet and Free Cash Flow Significant Capacity to Fund Growth 2023-2025 Capital Expenditures ($ Millions) 4.9% Debt Free Cash Acquisition Net 1 Net Debt 1 2 1 Structure Flow Capacity Leverage $41.4 Innovation Center Investment ~$20M $200 to ~$290 to 2.1% $1B >$700M ~1.25x 1.7% $225M $340M Revolver Capacity $16.3 Cumulative $12.9 Estimated at time Estimated at time Estimated at time ~50-55% of Adj. 2023 2024 2025 Next 3 years post- 1 of spin of spin of spin EBITDA over 3 spin years post-spin Target CapEx ~2.0-2.5% of Net Sales 1) Estimated Standalone Adjusted EBITDA, Net Debt, Leverage, and Free Cash Flow are Non-GAAP financial measures. Definitions and historical reconciliations of non-GAAP financial measures are provided in the Appendix of this presentation. Reconciliations of forward-looking non-GAAP financial measures to the most directly comparable GAAP financial measures are not available because the timing and magnitude of certain items cannot be reasonably estimated at this time without unreasonable effort. 74 2) Excludes contribution from post-spin acquisitions, calculated at 3x net leverage on estimated standalone Adj. EBITDA minus net debt at spin plus 3-year cumulative estimated free cash flow
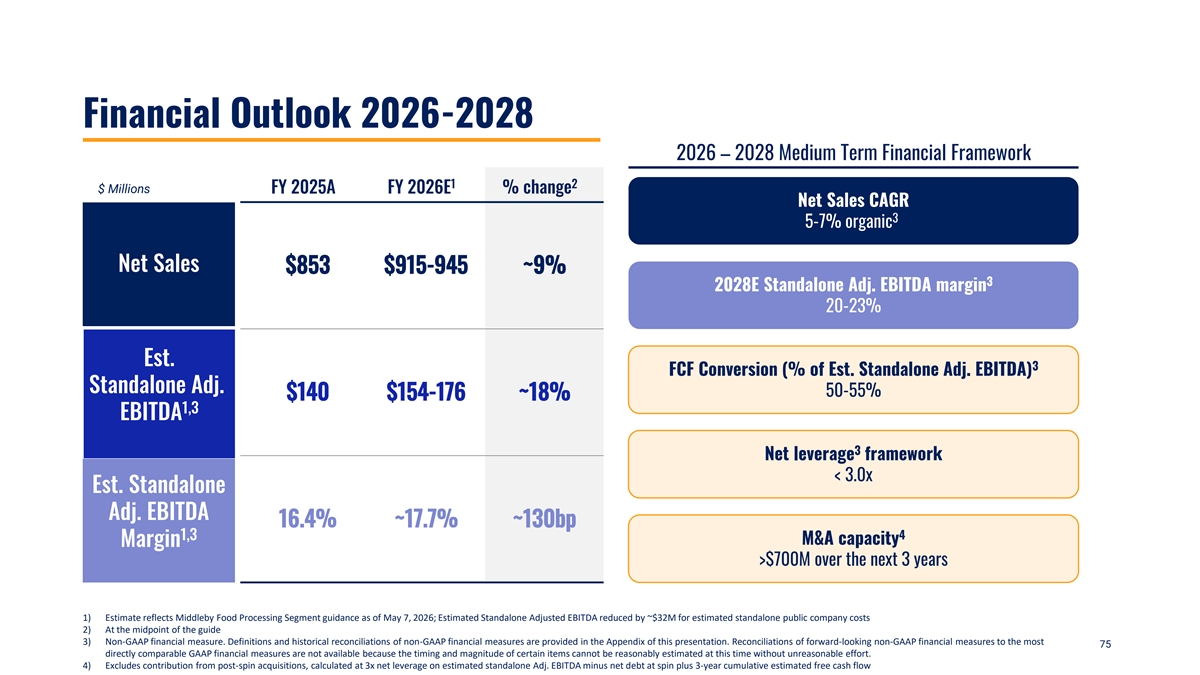
Financial Outlook 2026-2028 2026 – 2028 Medium Term Financial Framework 1 2 $ Millions FY 2025A FY 2026E % change Net Sales CAGR 3 5-7% organic Net Sales $853 $915-945 ~9% 3 2028E Standalone Adj. EBITDA margin 20-23% Est. 3 FCF Conversion (% of Est. Standalone Adj. EBITDA) Standalone Adj. 50-55% $140 $154-176 ~18% 1,3 EBITDA 3 Net leverage framework < 3.0x Est. Standalone Adj. EBITDA 16.4% ~17.7% ~130bp 1,3 4 M&A capacity Margin >$700M over the next 3 years 1) Estimate reflects Middleby Food Processing Segment guidance as of May 7, 2026; Estimated Standalone Adjusted EBITDA reduced by ~$32M for estimated standalone public company costs 2) At the midpoint of the guide 3) Non-GAAP financial measure. Definitions and historical reconciliations of non-GAAP financial measures are provided in the Appendix of this presentation. Reconciliations of forward-looking non-GAAP financial measures to the most 75 directly comparable GAAP financial measures are not available because the timing and magnitude of certain items cannot be reasonably estimated at this time without unreasonable effort. 4) Excludes contribution from post-spin acquisitions, calculated at 3x net leverage on estimated standalone Adj. EBITDA minus net debt at spin plus 3-year cumulative estimated free cash flow
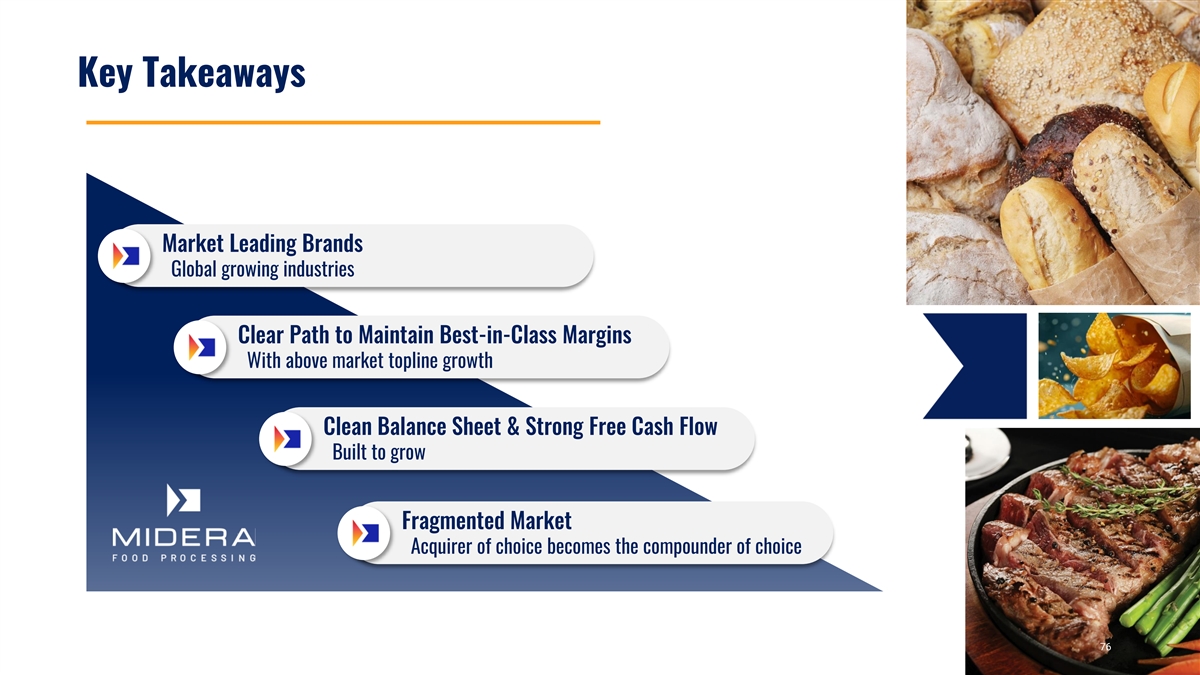
Key Takeaways Market Leading Brands Global growing industries Clear Path to Maintain Best-in-Class Margins With above market topline growth Clean Balance Sheet & Strong Free Cash Flow Built to grow Fragmented Market Acquirer of choice becomes the compounder of choice 76

Q&A 77

Investment Thesis Built on Proven Success, Engineered for What's Next Strong Foundation of Customer-Focused, Best-In-Class Brands Growth Supported by Attractive Industry Tailwinds 5-7% Organic Net 1,3 Sales CAGR Organic Growth Drivers: Total Line Solutions, Market Penetration, Aftermarket ~500 Basis Points Margin Accretion: Operational Excellence through Midera Operating System 2,3 Uplift Proven Track Record of Value Creation Through M&A + Inorganic Growth Strong Balance Sheet and Liquidity for Growth A Clear Playbook and Track Record to Compound Total Shareholder Return 1) Forecasted organic net sales CAGR from FY 2025A-2028E 78 2) Estimated Standalone Adjusted EBITDA margin uplift reflects forecasted improvement by FY 2028E from FY 2025A 3) Non-GAAP financial measure. Definitions and historical reconciliations of non-GAAP financial measures are provided in the Appendix of this presentation. Reconciliations of forward-looking non-GAAP financial measures to the most directly comparable GAAP financial measures are not available because the timing and magnitude of certain items cannot be reasonably estimated at this time without unreasonable effort.

Appendix 79
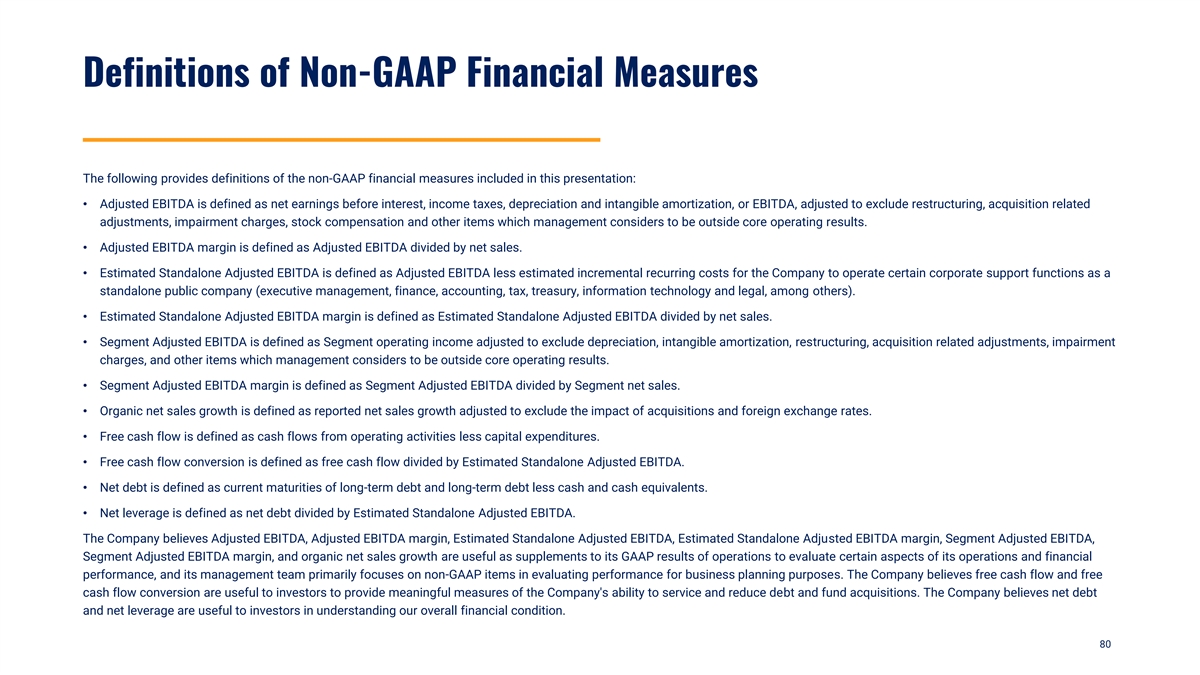
Definitions of Non-GAAP Financial Measures The following provides definitions of the non-GAAP financial measures included in this presentation: • Adjusted EBITDA is defined as net earnings before interest, income taxes, depreciation and intangible amortization, or EBITDA, adjusted to exclude restructuring, acquisition related adjustments, impairment charges, stock compensation and other items which management considers to be outside core operating results. • Adjusted EBITDA margin is defined as Adjusted EBITDA divided by net sales. • Estimated Standalone Adjusted EBITDA is defined as Adjusted EBITDA less estimated incremental recurring costs for the Company to operate certain corporate support functions as a standalone public company (executive management, finance, accounting, tax, treasury, information technology and legal, among others). • Estimated Standalone Adjusted EBITDA margin is defined as Estimated Standalone Adjusted EBITDA divided by net sales. • Segment Adjusted EBITDA is defined as Segment operating income adjusted to exclude depreciation, intangible amortization, restructuring, acquisition related adjustments, impairment charges, and other items which management considers to be outside core operating results. • Segment Adjusted EBITDA margin is defined as Segment Adjusted EBITDA divided by Segment net sales. • Organic net sales growth is defined as reported net sales growth adjusted to exclude the impact of acquisitions and foreign exchange rates. • Free cash flow is defined as cash flows from operating activities less capital expenditures. • Free cash flow conversion is defined as free cash flow divided by Estimated Standalone Adjusted EBITDA. • Net debt is defined as current maturities of long-term debt and long-term debt less cash and cash equivalents. • Net leverage is defined as net debt divided by Estimated Standalone Adjusted EBITDA. The Company believes Adjusted EBITDA, Adjusted EBITDA margin, Estimated Standalone Adjusted EBITDA, Estimated Standalone Adjusted EBITDA margin, Segment Adjusted EBITDA, Segment Adjusted EBITDA margin, and organic net sales growth are useful as supplements to its GAAP results of operations to evaluate certain aspects of its operations and financial performance, and its management team primarily focuses on non-GAAP items in evaluating performance for business planning purposes. The Company believes free cash flow and free cash flow conversion are useful to investors to provide meaningful measures of the Company's ability to service and reduce debt and fund acquisitions. The Company believes net debt and net leverage are useful to investors in understanding our overall financial condition. 80
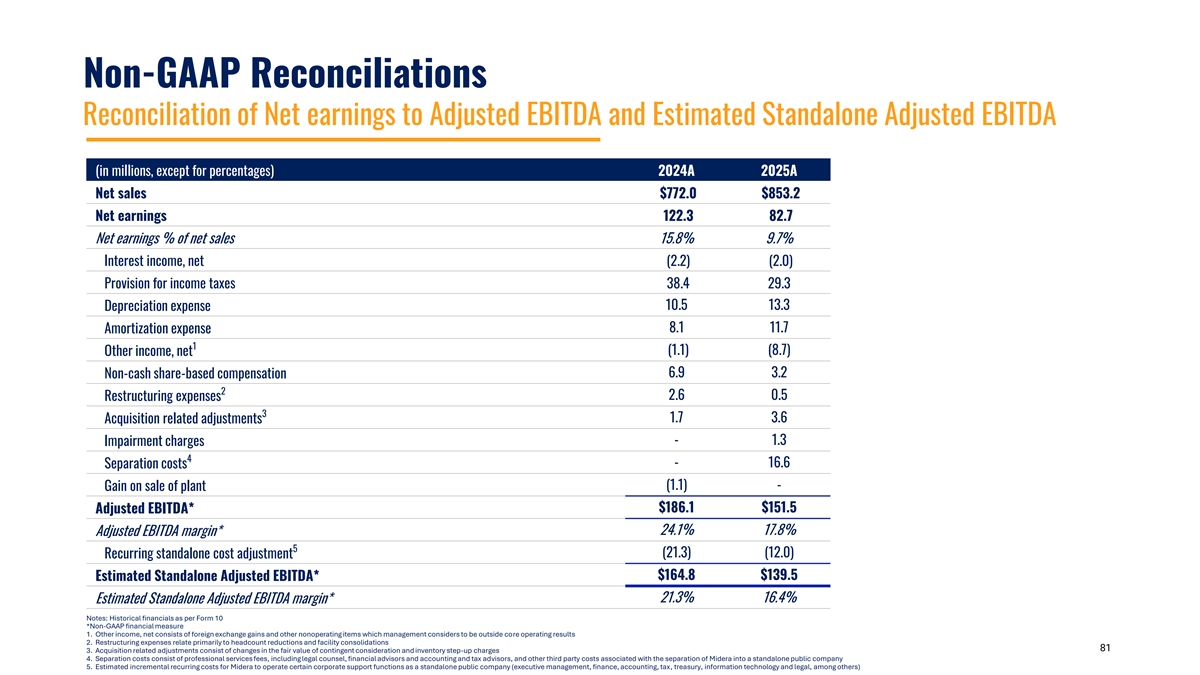
Non-GAAP Reconciliations Reconciliation of Net earnings to Adjusted EBITDA and Estimated Standalone Adjusted EBITDA (in millions, except for percentages) 2024A 2025A Net sales $772.0 $853.2 Net earnings 122.3 82.7 Net earnings % of net sales 15.8% 9.7% Interest income, net (2.2) (2.0) Provision for income taxes 38.4 29.3 10.5 13.3 Depreciation expense 8.1 11.7 Amortization expense 1 (1.1) (8.7) Other income, net 6.9 3.2 Non-cash share-based compensation 2 2.6 0.5 Restructuring expenses 3 1.7 3.6 Acquisition related adjustments - 1.3 Impairment charges 4 - 16.6 Separation costs (1.1) - Gain on sale of plant $186.1 $151.5 Adjusted EBITDA* 24.1% 17.8% Adjusted EBITDA margin* 5 (21.3) (12.0) Recurring standalone cost adjustment $164.8 $139.5 Estimated Standalone Adjusted EBITDA* 21.3% 16.4% Estimated Standalone Adjusted EBITDA margin* Notes: Historical financials as per Form 10 *Non-GAAP financial measure 1. Other income, net consists of foreign exchange gains and other nonoperating items which management considers to be outside core operating results 2. Restructuring expenses relate primarily to headcount reductions and facility consolidations 81 3. Acquisition related adjustments consist of changes in the fair value of contingent consideration and inventory step-up charges 4. Separation costs consist of professional services fees, including legal counsel, financial advisors and accounting and tax advisors, and other third party costs associated with the separation of Midera into a standalone public company 5. Estimated incremental recurring costs for Midera to operate certain corporate support functions as a standalone public company (executive management, finance, accounting, tax, treasury, information technology and legal, among others)
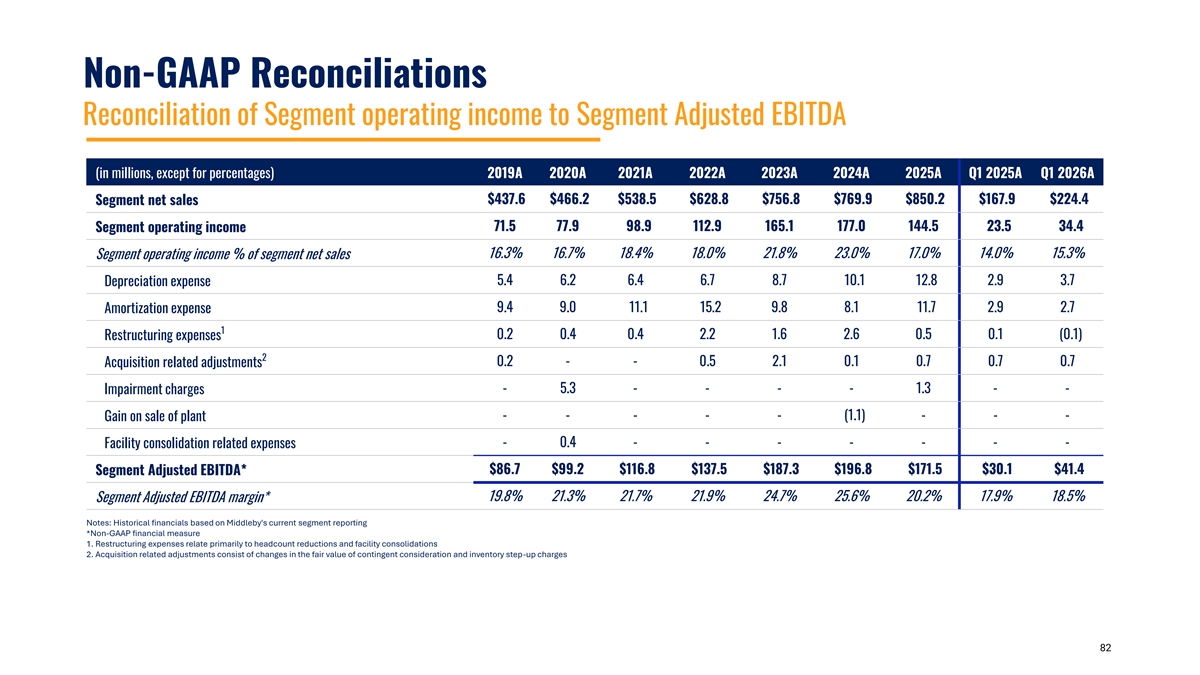
Non-GAAP Reconciliations Reconciliation of Segment operating income to Segment Adjusted EBITDA (in millions, except for percentages) 2019A 2020A 2021A 2022A 2023A 2024A 2025A Q1 2025A Q1 2026A $437.6 $466.2 $538.5 $628.8 $756.8 $769.9 $850.2 $167.9 $224.4 Segment net sales 71.5 77.9 98.9 112.9 165.1 177.0 144.5 23.5 34.4 Segment operating income 16.3% 16.7% 18.4% 18.0% 21.8% 23.0% 17.0% 14.0% 15.3% Segment operating income % of segment net sales 5.4 6.2 6.4 6.7 8.7 10.1 12.8 2.9 3.7 Depreciation expense 9.4 9.0 11.1 15.2 9.8 8.1 11.7 2.9 2.7 Amortization expense 1 Restructuring expenses 0.2 0.4 0.4 2.2 1.6 2.6 0.5 0.1 (0.1) 2 0.2 - - 0.5 2.1 0.1 0.7 0.7 0.7 Acquisition related adjustments - 5.3 - - - - 1.3 - - Impairment charges - - - - - (1.1) - - - Gain on sale of plant - 0.4 - - - - - - - Facility consolidation related expenses Segment Adjusted EBITDA* $86.7 $99.2 $116.8 $137.5 $187.3 $196.8 $171.5 $30.1 $41.4 19.8% 21.3% 21.7% 21.9% 24.7% 25.6% 20.2% 17.9% 18.5% Segment Adjusted EBITDA margin* Notes: Historical financials based on Middleby's current segment reporting *Non-GAAP financial measure 1. Restructuring expenses relate primarily to headcount reductions and facility consolidations 2. Acquisition related adjustments consist of changes in the fair value of contingent consideration and inventory step-up charges 82