Exhibit 99.1 MIDDLEBY INVESTOR DAY New York, New York | May 12, 2026
Company Logos Colours 255:255:255 Background FORWARD LOOKING STATEMENTS 0:0:0 Text Colour 23:60:93 Page Heading Safe Harbor Statement 23:60:93 Subheading This presentation contains “forward-looking statements” subject to the Private Securities Litigation Reform Act of 1995, including statements regarding The Middleby Corporation’s (“Middleby”) and Midera Food Styles Charts – Charts – Processing, Inc.’s (“Midera” and taken together with Middleby, the “Company”) expectations with respect to the Company’s future performance. The Company cautions investors that such statements are estimates Primary Secondary Colours Colours of future performance and are highly dependent upon a variety of factors. These forward-looking statements involve known and unknown risks, uncertainties and other factors, which could cause the Company’s Rounded actual results, performance or outcomes to differ materially from those expressed or implied in the forward-looking statements. The following are some of the important factors that could cause the Company’s Y 0:47:80 205:219:224 Corners actual results, performance or outcomes to differ materially from those discussed in the forward-looking statements: changing market conditions; volatility in earnings resulting from goodwill impairment losses, 0:110:182 161:188:196 which may occur irregularly and in varying amounts; variability in financing costs and interest rates; quarterly variations in operating results; dependence on key customers; risks associated with the Company’s Shadows N foreign operations, including international exposure, political risks affecting international sales, market acceptance and demand for the Company's products and the Company’s ability to manage the risk 226:45:63 129:179:224 associated with the exposure to foreign currency exchange rate fluctuations; the Company’s ability to protect its trademarks, copyrights and other intellectual property; changing market conditions, including inflation; the impact of competitive products and pricing; the impact of announced management and organizational changes; intense competition in the Company's business segments including the impact of both 228:222:212 244:242:238 Gradients N new and established global competitors; unfavorable tax law changes and tax authority rulings; cybersecurity attacks and other breaches in security; the continued ability to realize profitable growth through the sourcing and completion of strategic acquisitions; the timely development and market acceptance of the Company's products; the availability and cost of raw materials; the possibility that the proposed spin-off of 139:178:221 217:217:217 Midera will not be consummated within the anticipated time period or at all, including as the result of regulatory, market or other factors, including the possibility that various closing conditions for the spin-off may not be satisfied; the potential disruption to the Company’s business in connection with the proposed spin-off; the potential that the Company does not realize all of the expected benefits of the spin-off; that the spin- 191:191:191 229:229:229 off may be more difficult, time consuming or costly than expected; the failure of the spin-off to qualify for the expected tax treatment; potential adverse effects of the announcement of the proposed spin-off of Midera or the results thereof, including on the market price of the Company's common stock, the ability of the Company to develop and maintain relationships with personnel, customers, suppliers and others with Headings on page Hierarchy of Highlights whom it does business or the Company’s business, financial condition, results of operations and financial performance; risks related to diversion of the Company’s management's attention from its ongoing business operations due to the proposed spin-off of Midera; and other risks detailed in the Company’s SEC filings. All forward-looking statements are expressly qualified in their entirety by these cautionary Lines Y statements. The forward-looking statements included in this presentation are made only as of the date hereof and, except as required by federal securities laws and rules and regulations of the SEC, the Company Message Box (RGB and weight) undertakes no obligation to publicly update or revise any forward-looking statements, whether as a result of new information, future events or otherwise. N Boxes Highlighted Boxes Non-GAAP Financial Measures on the Page This presentation contains information about the Company’s financial results which is not presented in accordance with accounting principles generally accepted in the United States (“GAAP”). The Company refers Lines Highlight Table to these measures as “non-GAAP” financial measures. The Appendix provides definitions and historical reconciliations to the most directly comparable GAAP financial measures for non-GAAP financial measures Rows / Maps Tables - Headings included in this presentation. Reconciliations of forward-looking Non-GAAP financial measures to the most directly comparable GAAP financial measures are not available because the timing and magnitude of RGB 0,0,0 | Wgt: 1pt certain items cannot be reasonably estimated at this time without unreasonable effort. The non-GAAP financial measures disclosed by the Company should not be considered a substitute for, or superior to, Row Heading Tables - Rows financial measures prepared in accordance with GAAP, and the financial results prepared in accordance with GAAP. In addition, the non-GAAP financial measures included in this presentation do not have standard Cells in Tables RGB 185,185,185 | Wgt: 0.5pt meanings and may vary from similarly titled non-GAAP financial measures used by other companies. The Company believes that its presentation of non-GAAP financial measures is useful because it provides investors and securities analysts with the same information that it uses internally for purposes of assessing its core operating and financial performance. Charts - Axes RGB 127,127,127 | Wgt: 0.75pt Charts - Lines Between Series: None Link to template Pages Setup 2 Width: 33.867 cm Add doctop here Height: 19.05 cm
Company Logos Colours 255:255:255 Background 0:0:0 Text Colour 23:60:93 Page Heading 23:60:93 Subheading Styles Charts – Charts – Primary Secondary Colours Colours Rounded Y 0:47:80 205:219:224 Corners 0:110:182 161:188:196 Shadows N 226:45:63 129:179:224 228:222:212 244:242:238 Gradients N 139:178:221 217:217:217 191:191:191 229:229:229 WELCOME TO Headings on page Hierarchy of Highlights Lines Y Message Box (RGB and weight) INVESTOR DAY 01 N Boxes Highlighted Boxes on the Page Lines Highlight Table Rows / Maps Tables - Headings RGB 0,0,0 | Wgt: 1pt Row Heading Tables - Rows Cells in Tables RGB 185,185,185 | Wgt: 0.5pt Charts - Axes RGB 127,127,127 | Wgt: 0.75pt Charts - Lines Between Series: None Link to template Pages Setup 3 Width: 33.867 cm Add doctop here Height: 19.05 cm

Company Logos Colours 255:255:255 Background TODAY’S 0:0:0 Text Colour REBECCA ELLIN 23:60:93 WELCOME TO INVESTOR DAY Page Heading SVP, Investor Strategy & Corporate Development AGENDA 23:60:93 Subheading Styles Charts – Charts – Primary Secondary MIDDLEBY & INDUSTRY OVERVIEW Colours Colours TIM FITZGERALD Rounded Y 0:47:80 205:219:224 Chief Executive Officer Corners GROWTH ENGINE & VALUE DRIVERS 0:110:182 161:188:196 Shadows N 226:45:63 129:179:224 GO-TO-MARKET & COMMERCIAL STEVE SPITTLE 228:222:212 244:242:238 Gradients N Chief Commercial Officer EXECUTION 139:178:221 217:217:217 191:191:191 229:229:229 TECHNOLOGY, INNOVATION, & JAMES K. POOL III Headings on page Hierarchy of Highlights Chief Technology and Operations Officer SERVICE PLATFORMS Lines Y Message Box (RGB and weight) N Boxes Highlighted Boxes KOREY KOHL on the Page OPERATIONAL EXCELLENCE Group President, Ice & Beverage Lines Highlight Table Rows / Maps Tables - Headings RGB 0,0,0 | Wgt: 1pt Row Heading Tables - Rows Cells in Tables FINANCIAL FRAMEWORK & BRITTANY CERWIN RGB 185,185,185 | Wgt: 0.5pt Chief Financial Officer CAPITAL ALLOCATION Charts - Axes RGB 127,127,127 | Wgt: 0.75pt Charts - Lines Between Series: None CLOSE & Q&A Link to template Pages Setup 4 Width: 33.867 cm Add doctop here Height: 19.05 cm
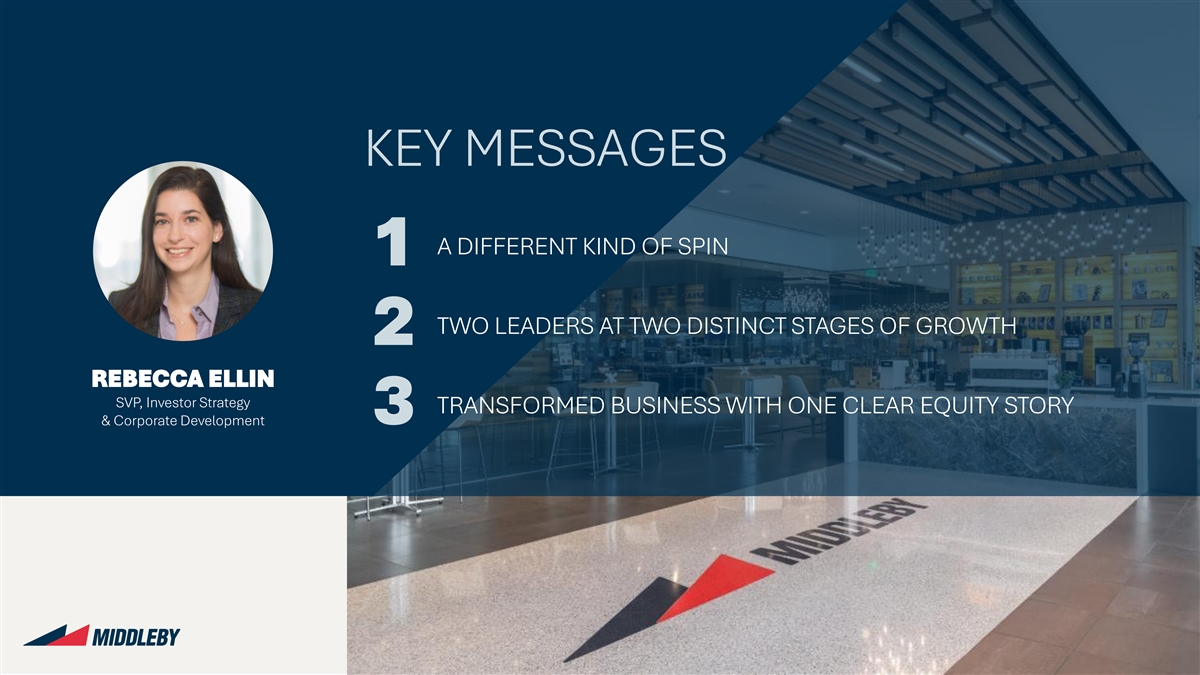
Company Logos Colours 255:255:255 Background 0:0:0 Text Colour 23:60:93 Page Heading 23:60:93 Subheading Styles Charts – Charts – Primary Secondary KEY MESSAGES Colours Colours Rounded Y 0:47:80 205:219:224 Corners 0:110:182 161:188:196 Shadows N 226:45:63 129:179:224 A DIFFERENT KIND OF SPIN 1 228:222:212 244:242:238 Gradients N 139:178:221 217:217:217 191:191:191 229:229:229 TWO LEADERS AT TWO DISTINCT STAGES OF GROWTH 2 Headings on page Hierarchy of Highlights REBECCA ELLIN Lines Y Message Box (RGB and weight) SVP, Investor Strategy TRANSFORMED BUSINESS WITH ONE CLEAR EQUITY STORY & Corporate Development 3 N Boxes Highlighted Boxes on the Page Lines Highlight Table Rows / Maps Tables - Headings RGB 0,0,0 | Wgt: 1pt Row Heading Tables - Rows Cells in Tables RGB 185,185,185 | Wgt: 0.5pt Charts - Axes RGB 127,127,127 | Wgt: 0.75pt Charts - Lines Between Series: None Link to template Pages Setup 5 Width: 33.867 cm Add doctop here Height: 19.05 cm
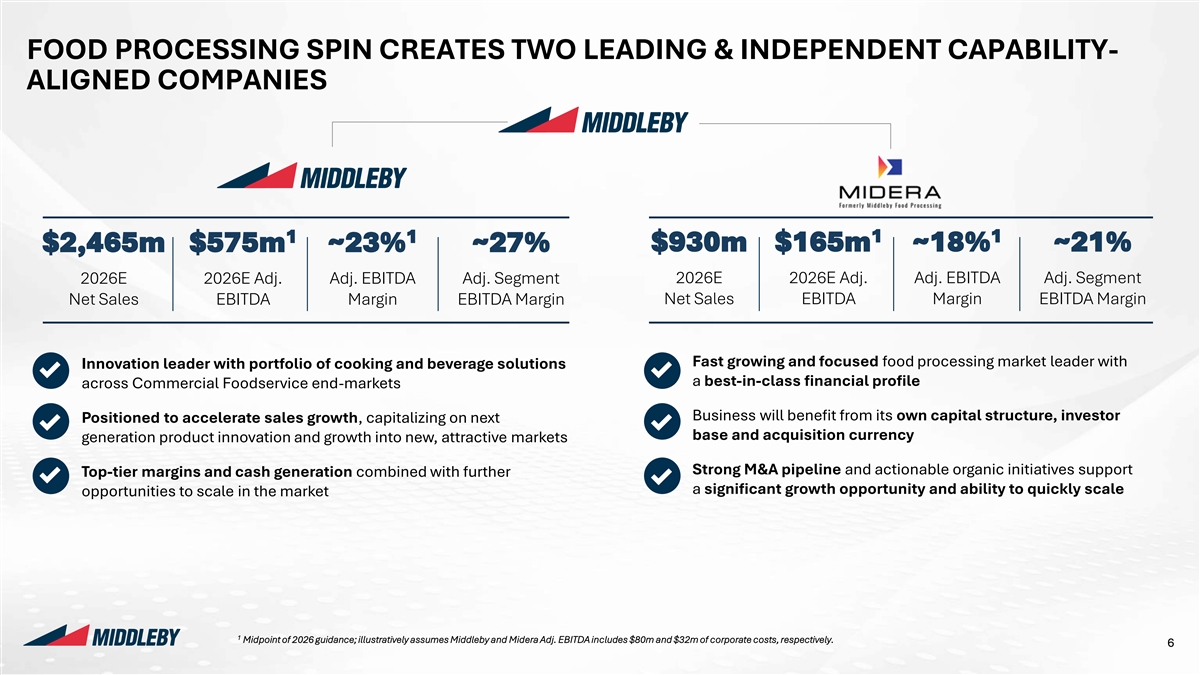
Company Logos Colours 255:255:255 Background FOOD PROCESSING SPIN CREATES TWO LEADING & INDEPENDENT CAPABILITY- 0:0:0 Text Colour ALIGNED COMPANIES 23:60:93 Page Heading 23:60:93 Subheading Styles Charts – Charts – Primary Secondary Colours Colours Rounded Y 0:47:80 205:219:224 Corners 0:110:182 161:188:196 Shadows N 1 1 1 1 226:45:63 129:179:224 $930m $165m ~18% ~21% $2,465m $575m ~23% ~27% 228:222:212 244:242:238 Gradients N 2026E 2026E Adj. Adj. EBITDA Adj. Segment 2026E 2026E Adj. Adj. EBITDA Adj. Segment 139:178:221 217:217:217 Net Sales EBITDA Margin EBITDA Margin Net Sales EBITDA Margin EBITDA Margin 191:191:191 229:229:229 Headings on page Fast growing and focused food processing market leader with Hierarchy of Highlights Innovation leader with portfolio of cooking and beverage solutions a best-in-class financial profile across Commercial Foodservice end-markets Lines Y Message Box (RGB and weight) Business will benefit from its own capital structure, investor Positioned to accelerate sales growth, capitalizing on next N Boxes Highlighted Boxes base and acquisition currency generation product innovation and growth into new, attractive markets on the Page Lines Highlight Table Strong M&A pipeline and actionable organic initiatives support Top-tier margins and cash generation combined with further Rows / Maps Tables - Headings a significant growth opportunity and ability to quickly scale RGB 0,0,0 | Wgt: 1pt opportunities to scale in the market Row Heading Tables - Rows Cells in Tables RGB 185,185,185 | Wgt: 0.5pt Charts - Axes RGB 127,127,127 | Wgt: 0.75pt Charts - Lines Between Series: None Link to template Pages Setup 1 Midpoint of 2026 guidance; illustratively assumes Middleby and Midera Adj. EBITDA includes $80m and $32m of corporate costs, respectively. 6 Width: 33.867 cm Add doctop here Height: 19.05 cm
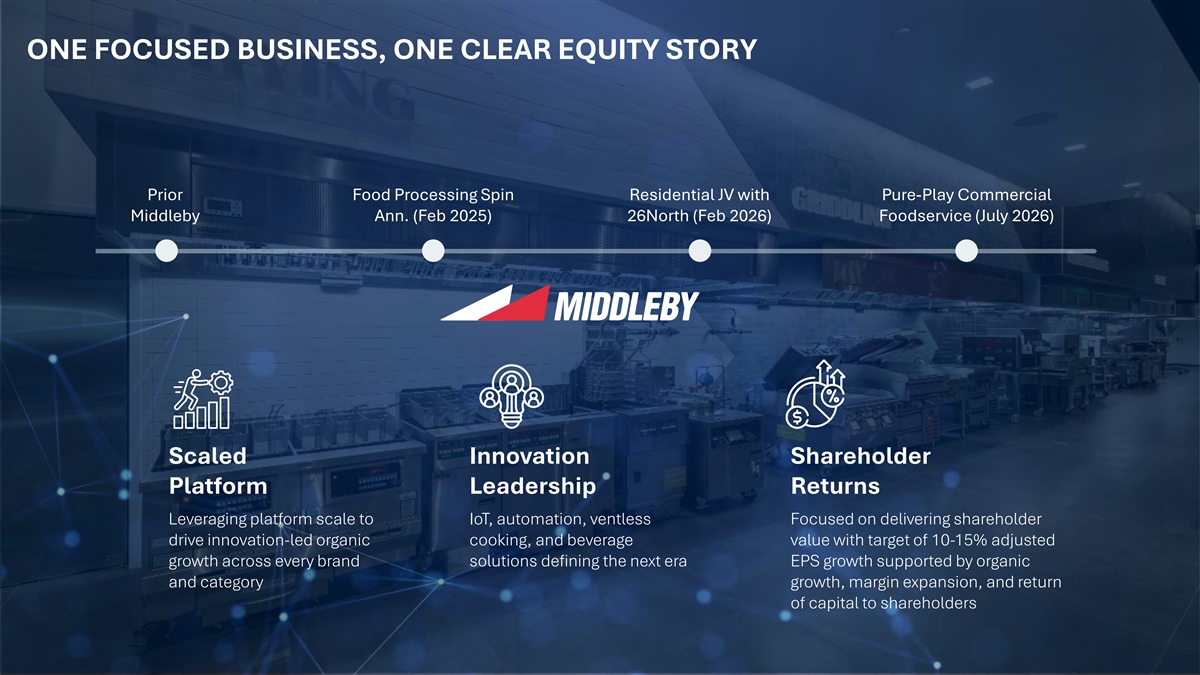
Company Logos Colours 255:255:255 Background ONE FOCUSED BUSINESS, ONE CLEAR EQUITY STORY 0:0:0 Text Colour 23:60:93 Page Heading 23:60:93 Subheading Styles Charts – Charts – Primary Secondary Colours Colours Rounded Y 0:47:80 205:219:224 Prior Food Processing Spin Residential JV with Pure-Play Commercial Corners 0:110:182 161:188:196 Middleby Ann. (Feb 2025) 26North (Feb 2026) Foodservice (July 2026) Shadows N 226:45:63 129:179:224 228:222:212 244:242:238 Gradients N 139:178:221 217:217:217 191:191:191 229:229:229 Headings on page Hierarchy of Highlights Lines Y Message Box (RGB and weight) N Boxes Highlighted Boxes on the Page Lines Scaled Innovation Shareholder Highlight Table Rows / Maps Tables - Headings Platform Leadership Returns RGB 0,0,0 | Wgt: 1pt Row Heading Tables - Rows Cells in Tables Leveraging platform scale to IoT, automation, ventless Focused on delivering shareholder RGB 185,185,185 | Wgt: 0.5pt drive innovation-led organic cooking, and beverage value with target of 10-15% adjusted Charts - Axes RGB 127,127,127 | Wgt: 0.75pt growth across every brand solutions defining the next era EPS growth supported by organic Charts - Lines Between Series: and category growth, margin expansion, and return None of capital to shareholders Link to template Pages Setup 7 Width: 33.867 cm Add doctop here Height: 19.05 cm

Company Logos Colours 255:255:255 Background 0:0:0 Text Colour 23:60:93 Page Heading 23:60:93 Subheading Styles Charts – Charts – Primary Secondary Colours Colours Rounded Y 0:47:80 205:219:224 Corners 0:110:182 161:188:196 Shadows N 226:45:63 129:179:224 228:222:212 244:242:238 Gradients N 139:178:221 217:217:217 191:191:191 229:229:229 MIDDLEBY & Headings on page Hierarchy of Highlights Lines Y INDUSTRY OVERVIEW Message Box (RGB and weight) 02 N Boxes Highlighted Boxes on the Page Lines Highlight Table Rows / Maps Tables - Headings RGB 0,0,0 | Wgt: 1pt Row Heading Tables - Rows Cells in Tables RGB 185,185,185 | Wgt: 0.5pt Charts - Axes RGB 127,127,127 | Wgt: 0.75pt Charts - Lines Between Series: None Link to template Pages Setup 8 Width: 33.867 cm Add doctop here Height: 19.05 cm
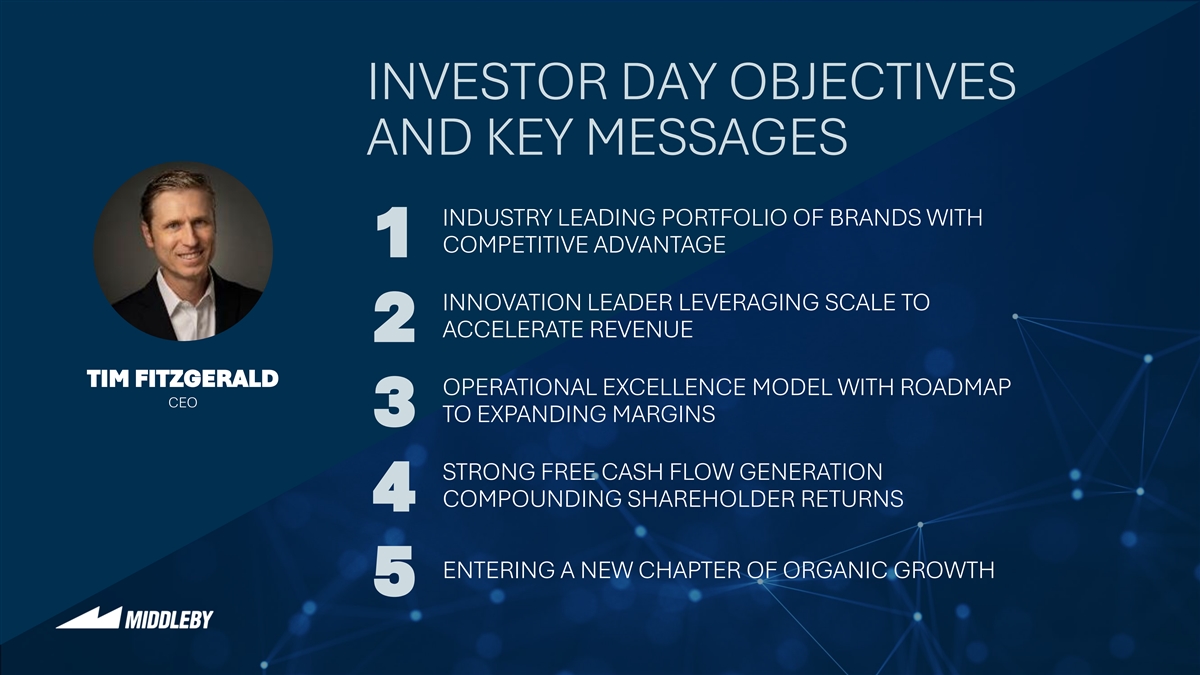
Company Logos Colours 255:255:255 Background 0:0:0 Text Colour INVESTOR DAY OBJECTIVES 23:60:93 Page Heading 23:60:93 Subheading Styles Charts – Charts – AND KEY MESSAGES Primary Secondary Colours Colours Rounded Y 0:47:80 205:219:224 Corners 0:110:182 161:188:196 INDUSTRY LEADING PORTFOLIO OF BRANDS WITH Shadows N 226:45:63 129:179:224 COMPETITIVE ADVANTAGE 1 228:222:212 244:242:238 Gradients N 139:178:221 217:217:217 INNOVATION LEADER LEVERAGING SCALE TO 191:191:191 229:229:229 ACCELERATE REVENUE 2 Headings on page Hierarchy of Highlights TIM FITZGERALD Lines OPERATIONAL EXCELLENCE MODEL WITH ROADMAP Y Message Box (RGB and weight) CEO TO EXPANDING MARGINS 3 N Boxes Highlighted Boxes on the Page Lines Highlight Table STRONG FREE CASH FLOW GENERATION Rows / Maps Tables - Headings RGB 0,0,0 | Wgt: 1pt Row Heading COMPOUNDING SHAREHOLDER RETURNS 4 Tables - Rows Cells in Tables RGB 185,185,185 | Wgt: 0.5pt Charts - Axes RGB 127,127,127 | Wgt: 0.75pt Charts - Lines Between Series: ENTERING A NEW CHAPTER OF ORGANIC GROWTH None 5 Link to template Pages Setup 9 Width: 33.867 cm Add doctop here Height: 19.05 cm

Company Logos Colours 255:255:255 Background 0:0:0 Text Colour 23:60:93 Page Heading 23:60:93 Subheading Styles Charts – Charts – Primary Secondary Colours Colours Rounded Y 0:47:80 205:219:224 Corners 0:110:182 161:188:196 WE ARE THE LEADING INNOVATOR AND SOLUTIONS PROVIDER Shadows N 226:45:63 129:179:224 OF COMMERCIAL FOODSERVICE EQUIPMENT 228:222:212 244:242:238 Gradients N 139:178:221 217:217:217 191:191:191 229:229:229 Headings on page Hierarchy of Highlights Lines Y Message Box (RGB and weight) N Boxes Highlighted Boxes on the Page Lines Highlight Table ENABLING OUR CUSTOMERS’ SUCCESS Rows / Maps Tables - Headings RGB 0,0,0 | Wgt: 1pt Row Heading Tables - Rows Cells in Tables RGB 185,185,185 | Wgt: 0.5pt Charts - Axes RGB 127,127,127 | Wgt: 0.75pt Charts - Lines Between Series: None Link to template Pages Setup 10 10 Width: 33.867 cm Add doctop here Height: 19.05 cm
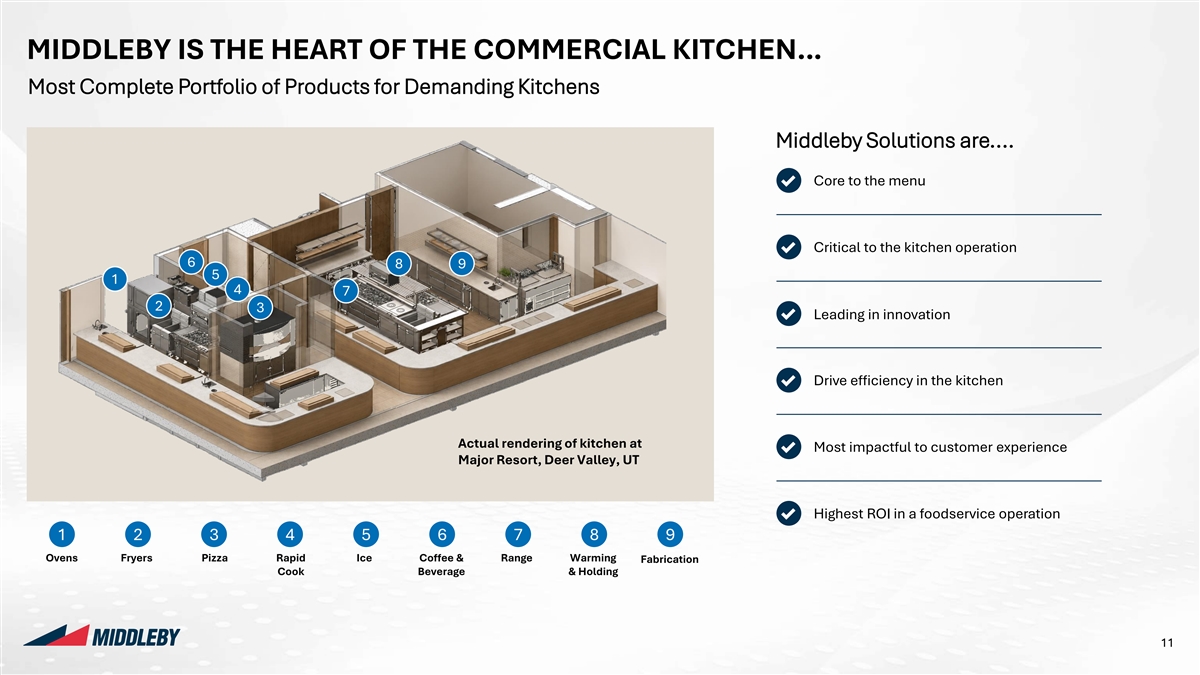
Company Logos Colours 255:255:255 Background MIDDLEBY IS THE HEART OF THE COMMERCIAL KITCHEN… 0:0:0 Text Colour Most Complete Portfolio of Products for Demanding Kitchens 23:60:93 Page Heading 23:60:93 Subheading Middleby Solutions are.... Styles Charts – Charts – Primary Secondary Colours Colours Core to the menu Rounded Y 0:47:80 205:219:224 Corners 0:110:182 161:188:196 Shadows N 226:45:63 129:179:224 Critical to the kitchen operation 6 8 9 228:222:212 244:242:238 Gradients N 5 1 4 7 139:178:221 217:217:217 2 3 Leading in innovation 191:191:191 229:229:229 Headings on page Hierarchy of Highlights Drive efficiency in the kitchen Lines Y Message Box (RGB and weight) N Boxes Highlighted Boxes on the Page Actual rendering of kitchen at Most impactful to customer experience Lines Major Resort, Deer Valley, UT Highlight Table Rows / Maps Tables - Headings RGB 0,0,0 | Wgt: 1pt Row Heading Tables - Rows Highest ROI in a foodservice operation Cells in Tables RGB 185,185,185 | Wgt: 0.5pt 1 2 3 4 5 6 7 8 9 Charts - Axes Ovens Fryers Pizza Rapid Ice Coffee & Range Warming Fabrication RGB 127,127,127 | Wgt: 0.75pt Cook Beverage & Holding Charts - Lines Between Series: None Link to template Pages Setup 11 Width: 33.867 cm Add doctop here Height: 19.05 cm
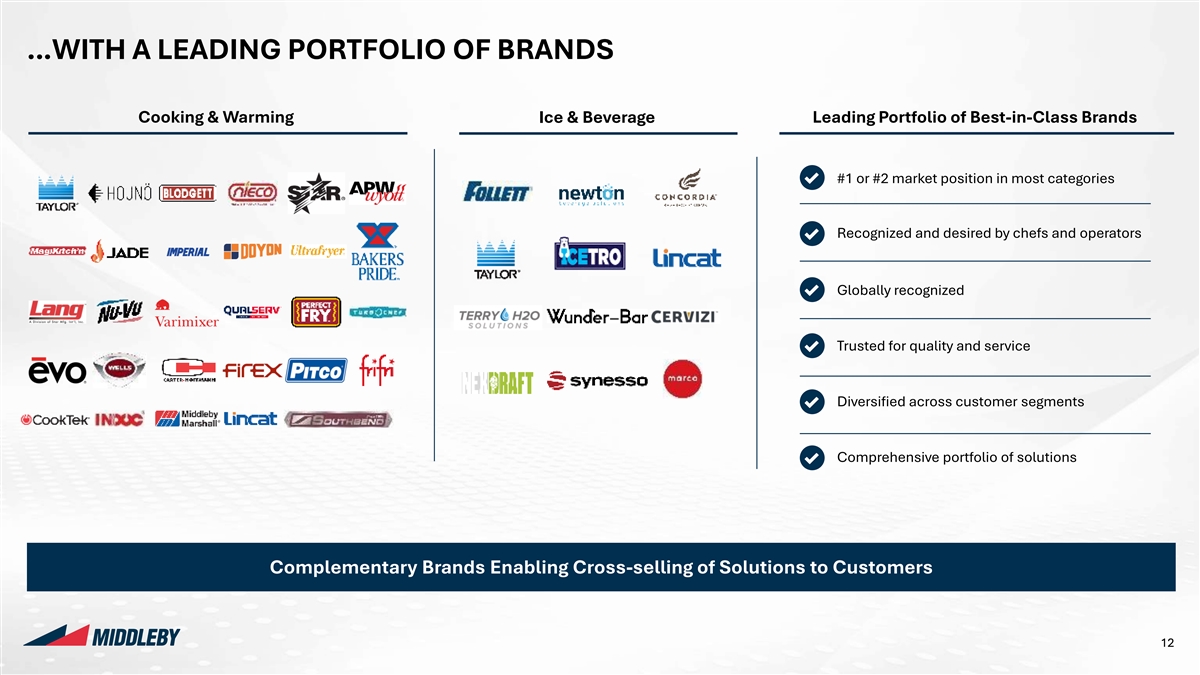
Company Logos Colours 255:255:255 Background …WITH A LEADING PORTFOLIO OF BRANDS 0:0:0 Text Colour 23:60:93 Page Heading Cooking & Warming Ice & Beverage Leading Portfolio of Best-in-Class Brands 23:60:93 Subheading Styles Charts – Charts – Primary Secondary Colours Colours #1 or #2 market position in most categories Rounded Y 0:47:80 205:219:224 Corners 0:110:182 161:188:196 Shadows N Recognized and desired by chefs and operators 226:45:63 129:179:224 228:222:212 244:242:238 Gradients N Globally recognized 139:178:221 217:217:217 191:191:191 229:229:229 Trusted for quality and service Headings on page Hierarchy of Highlights Lines Y Message Box (RGB and weight) Diversified across customer segments N Boxes Highlighted Boxes on the Page Lines Comprehensive portfolio of solutions Highlight Table Rows / Maps Tables - Headings RGB 0,0,0 | Wgt: 1pt Row Heading Tables - Rows Cells in Tables RGB 185,185,185 | Wgt: 0.5pt Charts - Axes RGB 127,127,127 | Wgt: 0.75pt Complementary Brands Enabling Cross-selling of Solutions to Customers Charts - Lines Between Series: None Link to template Pages Setup 12 Width: 33.867 cm Add doctop here Height: 19.05 cm
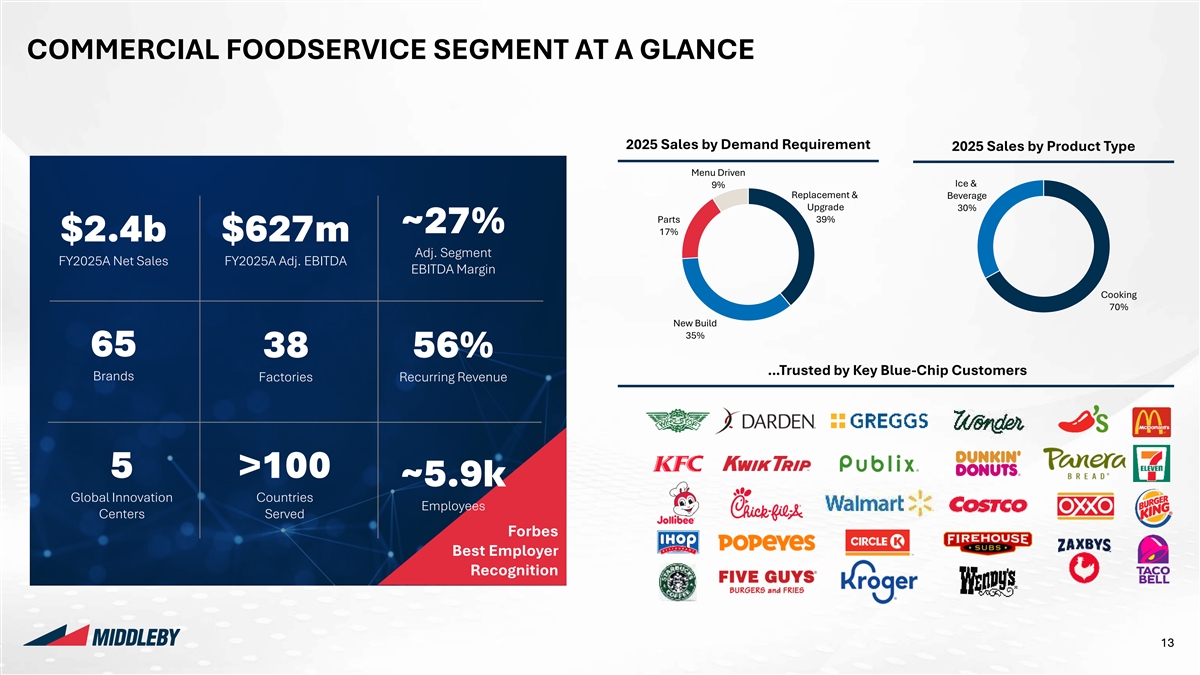
Company Logos Colours 255:255:255 Background COMMERCIAL FOODSERVICE SEGMENT AT A GLANCE 0:0:0 Text Colour 23:60:93 Page Heading 23:60:93 Subheading 2025 Sales by Demand Requirement Styles 2025 Sales by Product Type Charts – Charts – Primary Secondary Colours Colours Menu Driven Ice & 9% Rounded Y 0:47:80 205:219:224 Replacement & Beverage Corners Upgrade 30% 0:110:182 161:188:196 Parts 39% ~27% 17% Shadows N $2.4b $627m 226:45:63 129:179:224 Adj. Segment FY2025A Net Sales FY2025A Adj. EBITDA 228:222:212 244:242:238 EBITDA Margin Gradients N Cooking 139:178:221 217:217:217 70% New Build 191:191:191 229:229:229 35% 65 38 56% Headings on page Hierarchy of Highlights …Trusted by Key Blue-Chip Customers Brands Factories Recurring Revenue Lines Y Message Box (RGB and weight) N Boxes Highlighted Boxes on the Page Lines Highlight Table 5 >100 Rows / Maps Tables - Headings ~5.9k RGB 0,0,0 | Wgt: 1pt Global Innovation Countries Row Heading Employees Tables - Rows Centers Served Cells in Tables RGB 185,185,185 | Wgt: 0.5pt Forbes Charts - Axes Best Employer RGB 127,127,127 | Wgt: 0.75pt Recognition Charts - Lines Between Series: None Link to template Pages Setup 13 Width: 33.867 cm Add doctop here Height: 19.05 cm
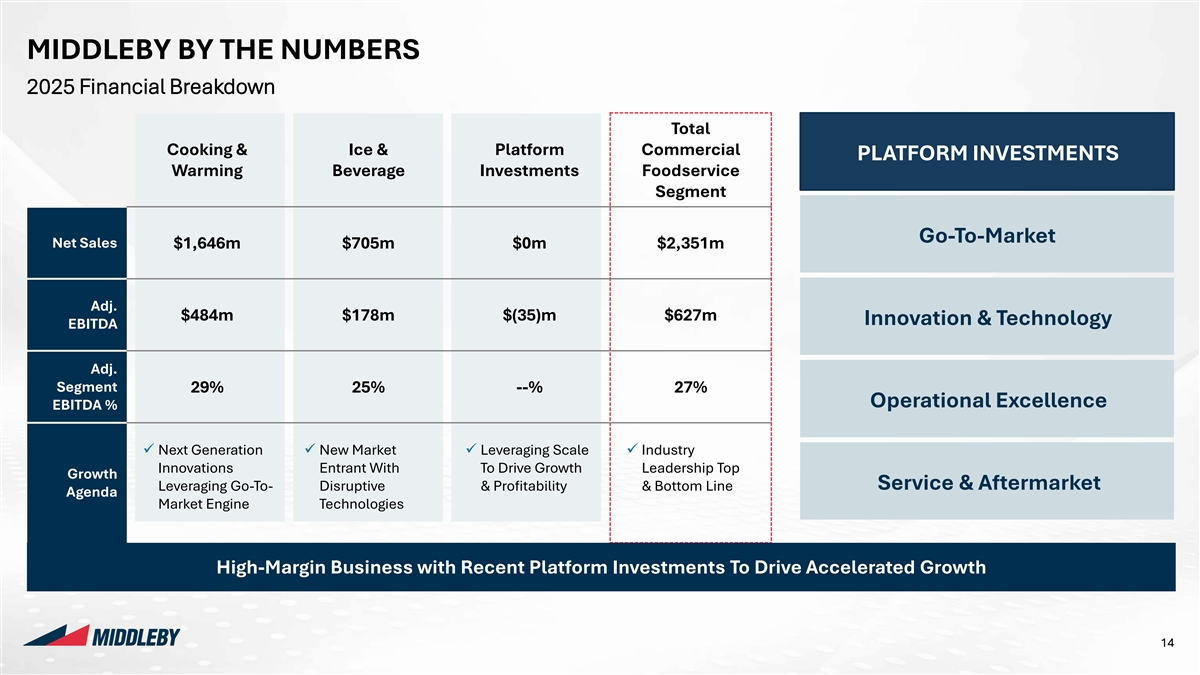
Company Logos Colours 255:255:255 Background MIDDLEBY BY THE NUMBERS 0:0:0 Text Colour 2025 Financial Breakdown 23:60:93 Page Heading 23:60:93 Subheading Total Styles Charts – Charts – Cooking & Ice & Platform Commercial PLATFORM INVESTMENTS Primary Secondary Colours Colours Warming Beverage Investments Foodservice Rounded Y 0:47:80 205:219:224 Segment Corners 0:110:182 161:188:196 Shadows N Go-To-Market 226:45:63 129:179:224 Net Sales $1,646m $705m $0m $2,351m 228:222:212 244:242:238 Gradients N 139:178:221 217:217:217 Adj. $484m $178m $(35)m $627m Innovation & Technology 191:191:191 229:229:229 EBITDA Headings on page Hierarchy of Highlights Adj. Segment 29% 25% --% 27% Lines Y Message Box (RGB and weight) Operational Excellence EBITDA % N Boxes Highlighted Boxes on the Page ✓ Next Generation ✓ New Market ✓ Leveraging Scale ✓ Industry Lines Highlight Table Innovations Entrant With To Drive Growth Leadership Top Growth Rows / Maps Tables - Headings Service & Aftermarket Leveraging Go-To- Disruptive & Profitability & Bottom Line RGB 0,0,0 | Wgt: 1pt Agenda Row Heading Market Engine Technologies Tables - Rows Cells in Tables RGB 185,185,185 | Wgt: 0.5pt Charts - Axes RGB 127,127,127 | Wgt: 0.75pt High-Margin Business with Recent Platform Investments To Drive Accelerated Growth Charts - Lines Between Series: None Link to template Pages Setup 14 Width: 33.867 cm Add doctop here Height: 19.05 cm
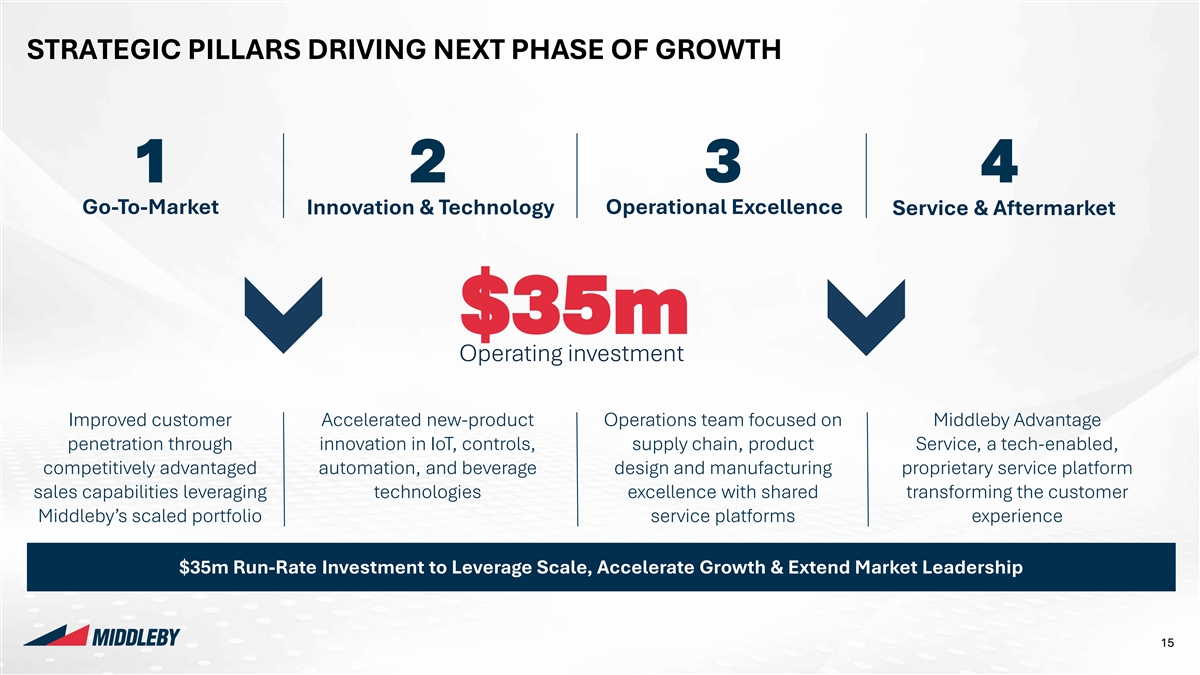
Company Logos Colours 255:255:255 Background STRATEGIC PILLARS DRIVING NEXT PHASE OF GROWTH 0:0:0 Text Colour 23:60:93 Page Heading 23:60:93 Subheading Styles Charts – Charts – Primary Secondary Colours Colours 1 2 3 4 Rounded Y 0:47:80 205:219:224 Corners Go-To-Market Operational Excellence Innovation & Technology Service & Aftermarket 0:110:182 161:188:196 Shadows N 226:45:63 129:179:224 228:222:212 244:242:238 Gradients N 139:178:221 217:217:217 191:191:191 229:229:229 $35m Operating investment Headings on page Hierarchy of Highlights Lines Y Message Box (RGB and weight) Improved customer Accelerated new-product Operations team focused on Middleby Advantage N Boxes Highlighted Boxes on the Page penetration through innovation in IoT, controls, supply chain, product Service, a tech-enabled, Lines Highlight Table competitively advantaged automation, and beverage design and manufacturing proprietary service platform Rows / Maps Tables - Headings RGB 0,0,0 | Wgt: 1pt sales capabilities leveraging technologies excellence with shared transforming the customer Row Heading Tables - Rows Cells in Tables Middleby’s scaled portfolio service platforms experience RGB 185,185,185 | Wgt: 0.5pt Charts - Axes RGB 127,127,127 | Wgt: 0.75pt $35m Run-Rate Investment to Leverage Scale, Accelerate Growth & Extend Market Leadership Charts - Lines Between Series: None Link to template Pages Setup 15 Width: 33.867 cm Add doctop here Height: 19.05 cm
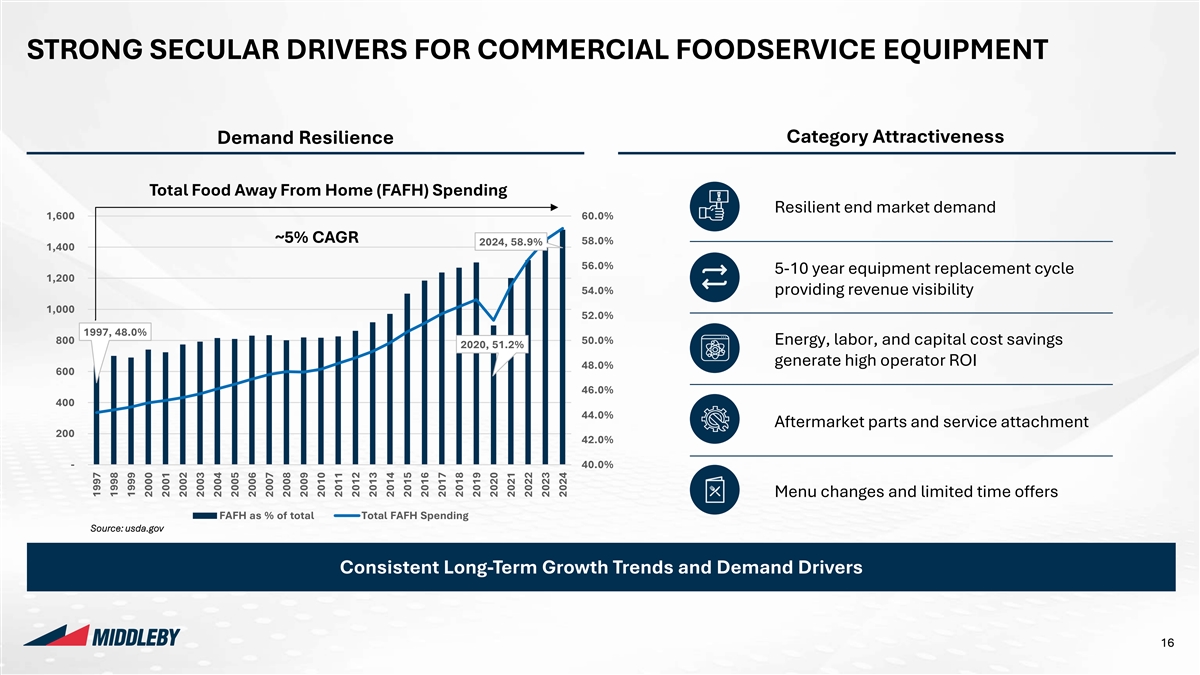
Company Logos Colours 255:255:255 Background STRONG SECULAR DRIVERS FOR COMMERCIAL FOODSERVICE EQUIPMENT 0:0:0 Text Colour 23:60:93 Page Heading 23:60:93 Subheading Category Attractiveness Demand Resilience Styles Charts – Charts – Primary Secondary Colours Colours Rounded Y 0:47:80 205:219:224 Total Food Away From Home (FAFH) Spending Corners Resilient end market demand 0:110:182 161:188:196 1,600 60.0% Shadows N ~5% CAGR 58.0% 2024, 58.9% 226:45:63 129:179:224 1,400 56.0% 228:222:212 244:242:238 5-10 year equipment replacement cycle Gradients N 1,200 54.0% providing revenue visibility 139:178:221 217:217:217 1,000 52.0% 191:191:191 229:229:229 1997, 48.0% 800 50.0% Energy, labor, and capital cost savings 2020, 51.2% Headings on page generate high operator ROI Hierarchy of Highlights 48.0% 600 Lines 46.0% Y Message Box (RGB and weight) 400 44.0% N Aftermarket parts and service attachment Boxes Highlighted Boxes 200 42.0% on the Page Lines Highlight Table - 40.0% Rows / Maps Tables - Headings RGB 0,0,0 | Wgt: 1pt Menu changes and limited time offers Row Heading Tables - Rows FAFH as % of total Total FAFH Spending Cells in Tables RGB 185,185,185 | Wgt: 0.5pt Source: usda.gov Charts - Axes RGB 127,127,127 | Wgt: 0.75pt Consistent Long-Term Growth Trends and Demand Drivers Charts - Lines Between Series: None Link to template Pages Setup 16 Width: 33.867 cm Add doctop here Height: 19.05 cm 1997 1998 1999 2000 2001 2002 2003 2004 2005 2006 2007 2008 2009 2010 2011 2012 2013 2014 2015 2016 2017 2018 2019 2020 2021 2022 2023 2024
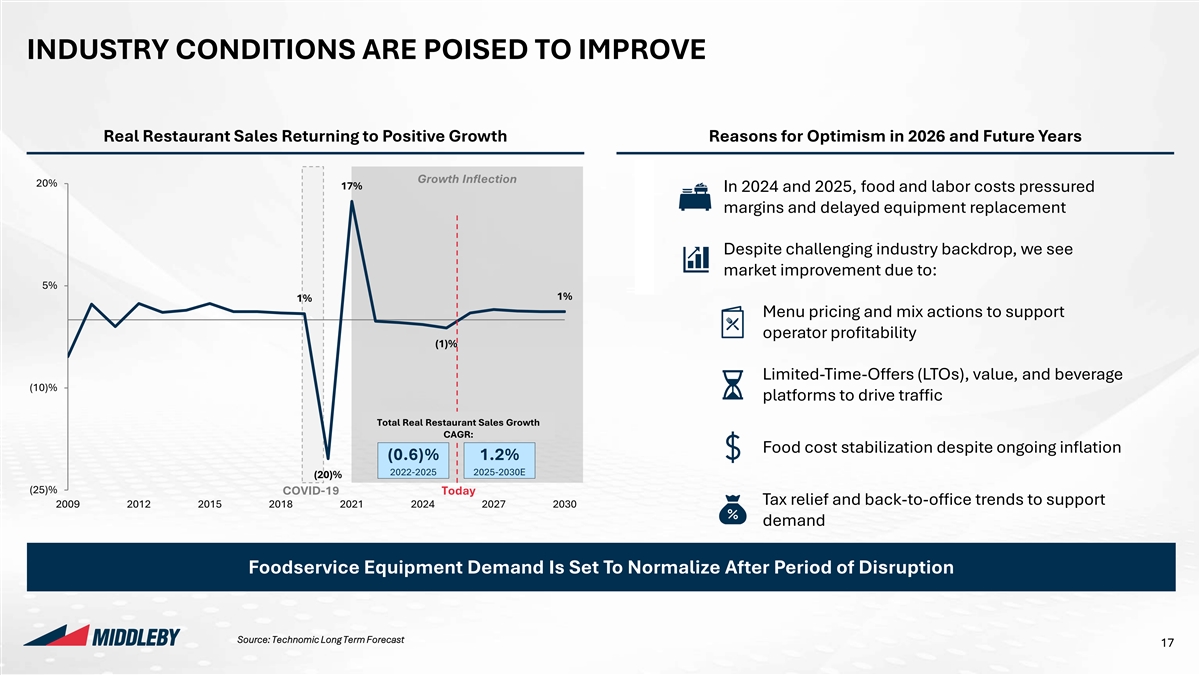
Company Logos Colours 255:255:255 Background INDUSTRY CONDITIONS ARE POISED TO IMPROVE 0:0:0 Text Colour 23:60:93 Page Heading 23:60:93 Subheading Real Restaurant Sales Returning to Positive Growth Reasons for Optimism in 2026 and Future Years Styles Charts – Charts – Primary Secondary Colours Colours Growth Inflection 20% Rounded 17% In 2024 and 2025, food and labor costs pressured Y 0:47:80 205:219:224 Corners margins and delayed equipment replacement 0:110:182 161:188:196 Shadows N 226:45:63 129:179:224 Despite challenging industry backdrop, we see 228:222:212 244:242:238 market improvement due to: Gradients N 5% 1% 139:178:221 217:217:217 1% Menu pricing and mix actions to support 191:191:191 229:229:229 ` operator profitability (1)% Headings on page Hierarchy of Highlights Limited-Time-Offers (LTOs), value, and beverage (10)% Lines Y platforms to drive traffic Message Box (RGB and weight) Total Real Restaurant Sales Growth N Boxes Highlighted Boxes CAGR: on the Page Food cost stabilization despite ongoing inflation (0.6)% 1.2% Lines Highlight Table 2022-2025 2025-2030E (20)% Rows / Maps Tables - Headings (25)% COVID-19 Today RGB 0,0,0 | Wgt: 1pt Tax relief and back-to-office trends to support Row Heading 2009 2012 2015 2018 2021 2024 2027 2030 Tables - Rows Cells in Tables RGB 185,185,185 | Wgt: 0.5pt demand Charts - Axes RGB 127,127,127 | Wgt: 0.75pt Foodservice Equipment Demand Is Set To Normalize After Period of Disruption Charts - Lines Between Series: None Link to template Pages Setup Source: Technomic Long Term Forecast 17 Width: 33.867 cm Add doctop here Height: 19.05 cm
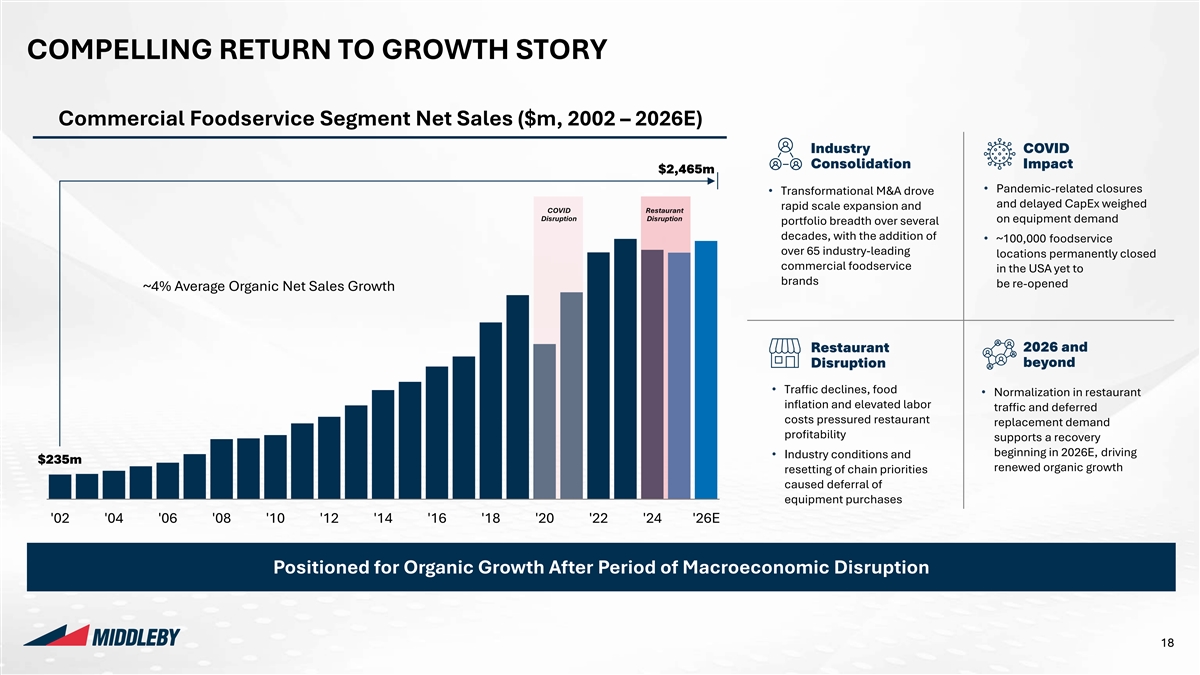
Company Logos Colours 255:255:255 Background COMPELLING RETURN TO GROWTH STORY 0:0:0 Text Colour 23:60:93 Page Heading Commercial Foodservice Segment Net Sales ($m, 2002 – 2026E) 23:60:93 Subheading Styles Charts – Charts – Industry COVID Primary Secondary Consolidation Impact Colours Colours $2,465m Rounded • Pandemic-related closures Y 0:47:80 205:219:224 • Transformational M&A drove Corners and delayed CapEx weighed rapid scale expansion and COVID Restaurant 0:110:182 161:188:196 Disruption Disruption on equipment demand portfolio breadth over several Shadows N decades, with the addition of • ~100,000 foodservice 226:45:63 129:179:224 over 65 industry-leading locations permanently closed commercial foodservice in the USA yet to 228:222:212 244:242:238 Gradients N brands be re-opened ~4% Average Organic Net Sales Growth 139:178:221 217:217:217 191:191:191 229:229:229 2026 and Restaurant Headings on page Disruption beyond Hierarchy of Highlights Lines• Traffic declines, food Y• Normalization in restaurant Message Box (RGB and weight) inflation and elevated labor traffic and deferred costs pressured restaurant replacement demand N Boxes Highlighted Boxes profitability supports a recovery on the Page beginning in 2026E, driving • Industry conditions and Lines $235m Highlight Table renewed organic growth resetting of chain priorities Rows / Maps Tables - Headings caused deferral of RGB 0,0,0 | Wgt: 1pt equipment purchases Row Heading Tables - Rows Cells in Tables '02 '04 '06 '08 '10 '12 '14 '16 '18 '20 '22 '24 '26E RGB 185,185,185 | Wgt: 0.5pt Charts - Axes RGB 127,127,127 | Wgt: 0.75pt Positioned for Organic Growth After Period of Macroeconomic Disruption Charts - Lines Between Series: None Link to template Pages Setup 18 Width: 33.867 cm Add doctop here Height: 19.05 cm
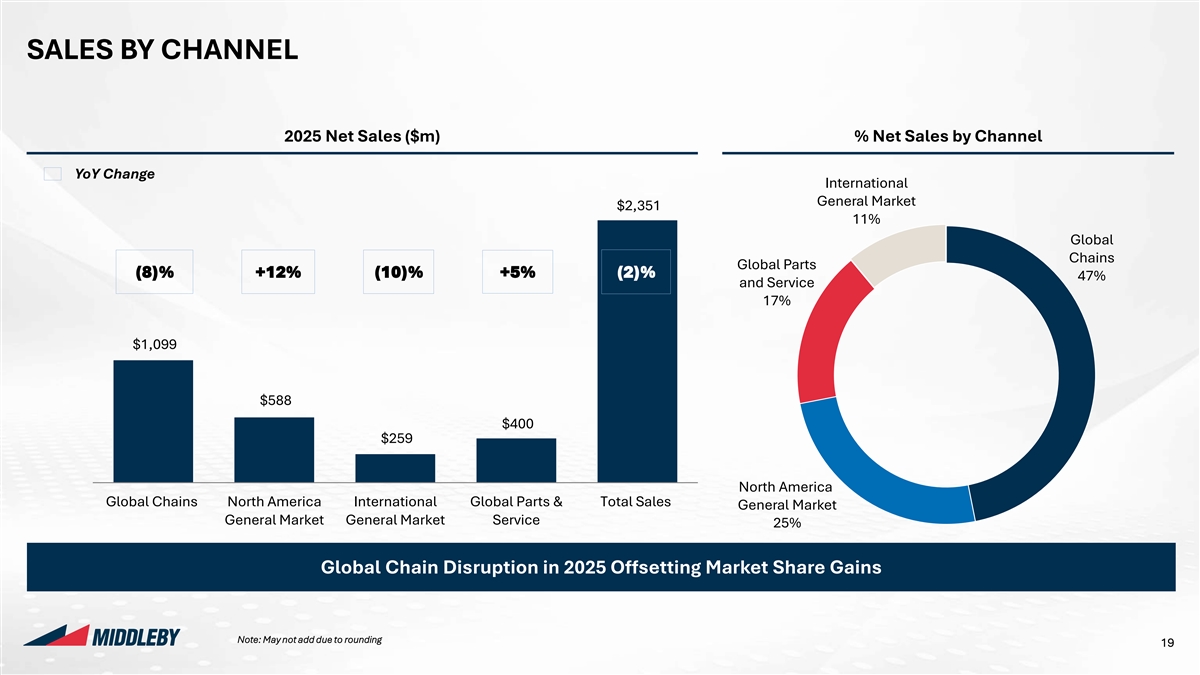
Company Logos Colours 255:255:255 Background SALES BY CHANNEL 0:0:0 Text Colour 23:60:93 Page Heading 23:60:93 Subheading 2025 Net Sales ($m) % Net Sales by Channel Styles Charts – Charts – Primary Secondary Colours Colours YoY Change International Rounded Y 0:47:80 205:219:224 Corners General Market $2,351 0:110:182 161:188:196 11% Shadows N Global 226:45:63 129:179:224 Chains Global Parts 228:222:212 244:242:238 (8)% +12% (10)% +5% (2)% Gradients N 47% and Service 139:178:221 217:217:217 17% 191:191:191 229:229:229 $1,099 Headings on page Hierarchy of Highlights Lines Y Message Box (RGB and weight) $588 N Boxes $400 Highlighted Boxes $259 on the Page Lines Highlight Table Rows / Maps Tables - Headings North America RGB 0,0,0 | Wgt: 1pt Global Chains North America International Global Parts & Total Sales Row Heading General Market Tables - Rows Cells in Tables General Market General Market Service RGB 185,185,185 | Wgt: 0.5pt 25% Charts - Axes RGB 127,127,127 | Wgt: 0.75pt Global Chain Disruption in 2025 Offsetting Market Share Gains Charts - Lines Between Series: None Link to template Pages Setup Note: May not add due to rounding 19 Width: 33.867 cm Add doctop here Height: 19.05 cm
Company Logos Colours 255:255:255 Background MIDDLEBY IS WELL INDEXED TO EMERGING CULTURAL TRENDS 0:0:0 Text Colour 23:60:93 Page Heading 23:60:93 Subheading Styles Drive-Thru Gets Charts – Charts – Primary Secondary The Unexpected Colours Colours Smarter, Faster, Rounded Y 0:47:80 205:219:224 Corners and More Personalized 0:110:182 161:188:196 Pleasures of a Dirty Soda Shadows N 226:45:63 129:179:224 Can Robots 228:222:212 244:242:238 The Customized Drink Gradients N Welcome to the Fast Food 139:178:221 217:217:217 is Out of Control 191:191:191 229:229:229 Reinvent Industry’s Crispy Chicken Headings on page Hierarchy of Highlights Summer Kitchen Productivity Fast Food? Lines Y Message Box (RGB and weight) Chicken Sandwich Wars: N Boxes Highlighted Boxes Becomes the New America’s Most Intense on the Page Lines Highlight Table QSR Battle Growth Lever Coffee Market Rows / Maps Tables - Headings RGB 0,0,0 | Wgt: 1pt Row Heading Tables - Rows Growth Powers Cells in Tables RGB 185,185,185 | Wgt: 0.5pt Charts - Axes Sector Innovation RGB 127,127,127 | Wgt: 0.75pt Charts - Lines Between Series: None Link to template Pages Setup 20 Width: 33.867 cm Add doctop here Height: 19.05 cm
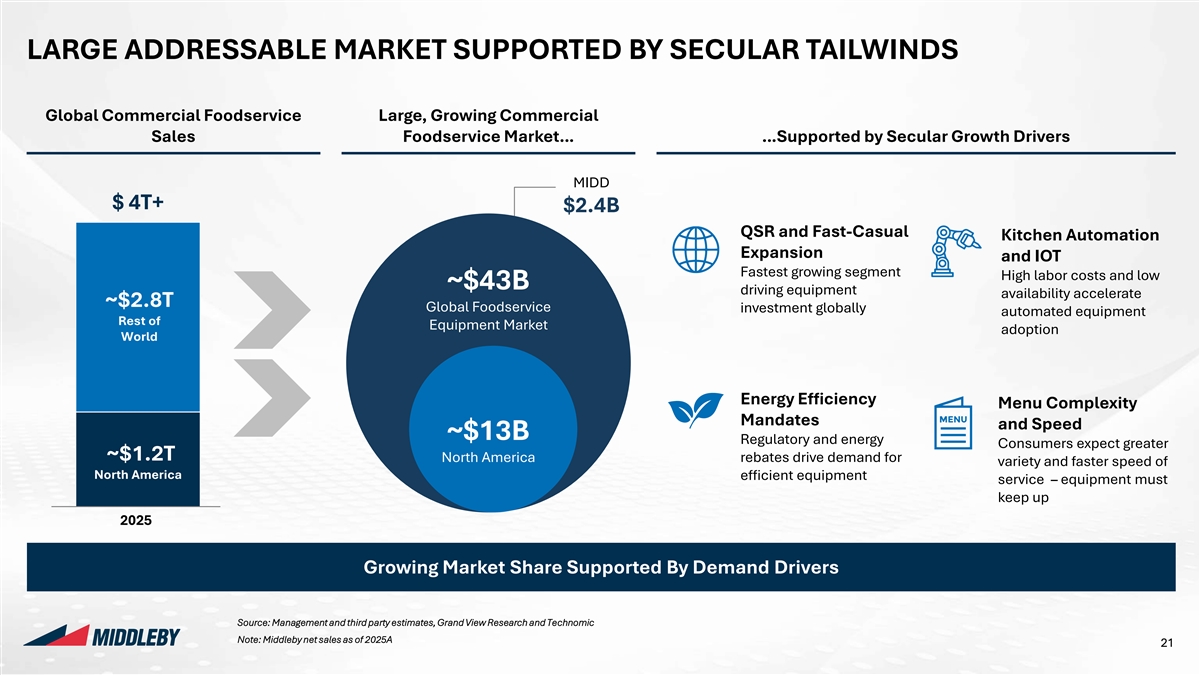
Company Logos Colours 255:255:255 Background LARGE ADDRESSABLE MARKET SUPPORTED BY SECULAR TAILWINDS 0:0:0 Text Colour 23:60:93 Page Heading Global Commercial Foodservice Large, Growing Commercial 23:60:93 Subheading Sales Foodservice Market… …Supported by Secular Growth Drivers Styles Charts – Charts – Primary Secondary Colours Colours MIDD Rounded Y 0:47:80 205:219:224 Corners $ 4T+ $2.4B 0:110:182 161:188:196 Shadows N QSR and Fast-Casual Kitchen Automation 226:45:63 129:179:224 Expansion and IOT 228:222:212 244:242:238 Fastest growing segment Gradients N High labor costs and low ~$43B driving equipment availability accelerate 139:178:221 217:217:217 ~$2.8T Global Foodservice investment globally automated equipment Rest of 191:191:191 229:229:229 Equipment Market adoption World Headings on page Hierarchy of Highlights Lines Y Message Box (RGB and weight) Energy Efficiency Menu Complexity Mandates N Boxes and Speed Highlighted Boxes ~$13B Regulatory and energy on the Page Consumers expect greater Lines ~$1.2T North America rebates drive demand for variety and faster speed of Highlight Table North America efficient equipment Rows / Maps service – equipment must Tables - Headings RGB 0,0,0 | Wgt: 1pt keep up Row Heading Tables - Rows Cells in Tables 2025 RGB 185,185,185 | Wgt: 0.5pt Charts - Axes RGB 127,127,127 | Wgt: 0.75pt Growing Market Share Supported By Demand Drivers Charts - Lines Between Series: None Link to template Pages Setup Source: Management and third party estimates, Grand View Research and Technomic Note: Middleby net sales as of 2025A 21 Width: 33.867 cm Add doctop here Height: 19.05 cm
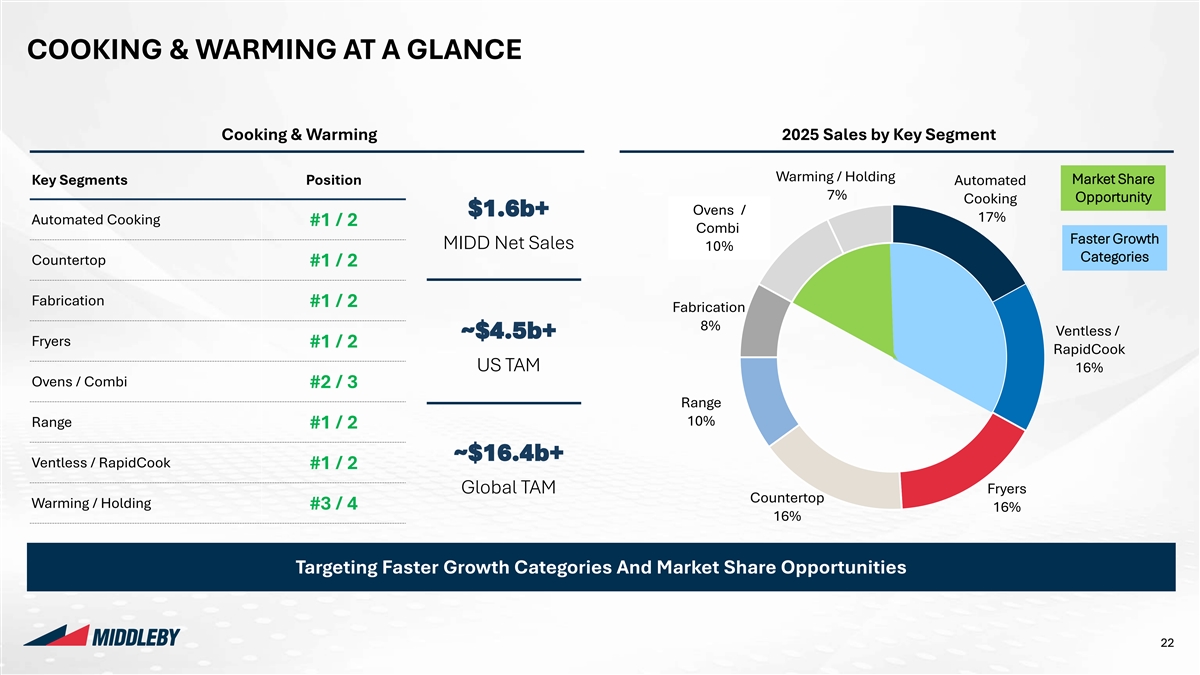
Company Logos Colours 255:255:255 Warming / Holding Background COOKING & WARMING AT A GLANCE 7% 0:0:0 Text Colour 23:60:93 Fabrication Page Heading Automated 8% 23:60:93 Subheading Cooking Cooking & Warming 2025 Sales by Key Segment Styles Charts – Charts – 17% Primary Secondary Colours Colours Warming / Holding Market Share Key Segments Position Automated Range Rounded Y 0:47:80 205:219:224 7% Corners Opportunity Cooking 8% Ovens / $1.6b+ 0:110:182 161:188:196 17% Ventless / Automated Cooking #1 / 2 Combi Shadows N Ovens RapidCook Faster Growth 226:45:63 129:179:224 MIDD Net Sales 10% 10% Categories 16% Countertop #1 / 2 Countertop 228:222:212 244:242:238 Gradients N 11% 139:178:221 217:217:217 Fabrication #1 / 2 Fabrication 191:191:191 229:229:229 Ovens 8% Fryers Ventless / ~$4.5b+ Fryers 8% #1 / 2 16% RapidCook Headings on page Hierarchy of Highlights US TAM 16% Ovens / Combi #2 / 3 Lines Y Message Box (RGB and weight) Range 10% N Range Boxes #1 / 2 Highlighted Boxes on the Page Lines ~$16.4b+ Ventless / RapidCook Highlight Table #1 / 2 Rows / Maps Tables - Headings Global TAM Fryers RGB 0,0,0 | Wgt: 1pt Countertop Row Heading Warming / Holding #3 / 4 16% Tables - Rows Cells in Tables 16% RGB 185,185,185 | Wgt: 0.5pt Charts - Axes RGB 127,127,127 | Wgt: 0.75pt Targeting Faster Growth Categories And Market Share Opportunities Charts - Lines Between Series: None Link to template Pages Setup 22 Width: 33.867 cm Add doctop here Height: 19.05 cm
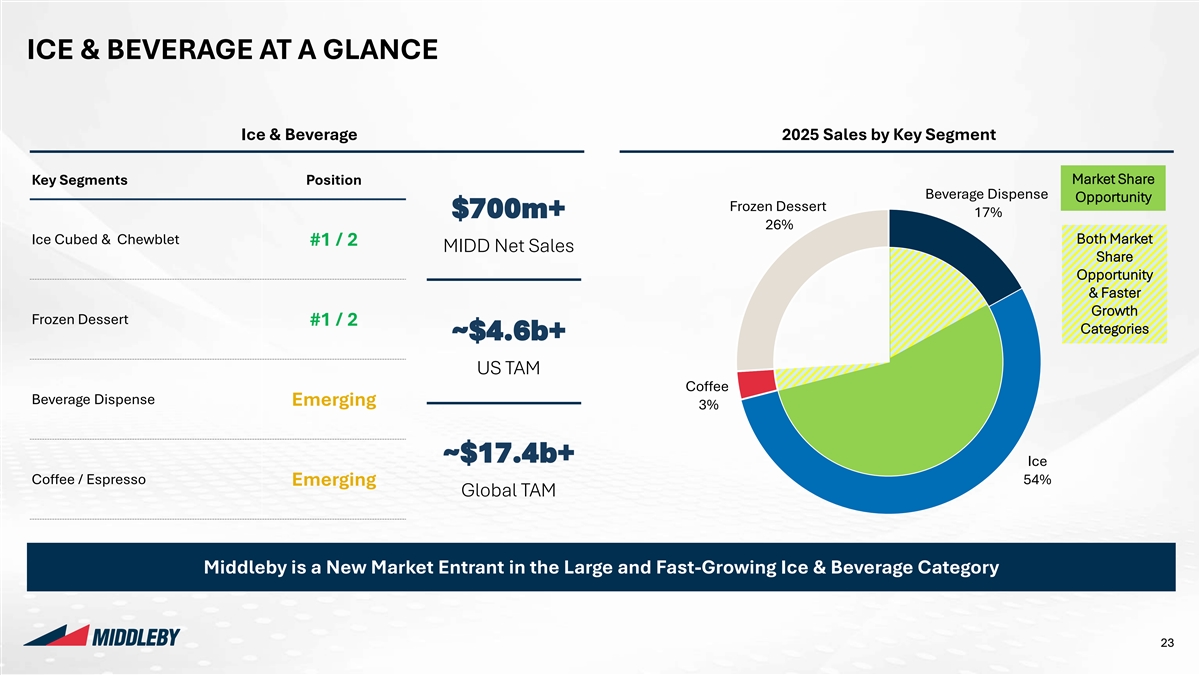
Company Logos Colours 255:255:255 Background ICE & BEVERAGE AT A GLANCE 0:0:0 Text Colour 23:60:93 Page Heading 23:60:93 Subheading Ice & Beverage 2025 Sales by Key Segment Styles Charts – Charts – Primary Secondary Colours Colours Market Share Key Segments Position Rounded Y 0:47:80 205:219:224 Beverage Dispense Corners Opportunity Frozen Dessert $700m+ 17% 0:110:182 161:188:196 26% Shadows N Ice Cubed & Chewblet Both Market #1 / 2 226:45:63 129:179:224 MIDD Net Sales Share 228:222:212 244:242:238 Gradients N Opportunity & Faster 139:178:221 217:217:217 Growth Frozen Dessert #1 / 2 191:191:191 229:229:229 Categories ~$4.6b+ Headings on page Hierarchy of Highlights US TAM Coffee Lines Y Beverage Dispense Message Box (RGB and weight) Emerging 3% N Boxes Highlighted Boxes on the Page Lines ~$17.4b+ Ice Highlight Table Rows / Maps Coffee / Espresso Tables - Headings 54% Emerging RGB 0,0,0 | Wgt: 1pt Global TAM Row Heading Tables - Rows Cells in Tables RGB 185,185,185 | Wgt: 0.5pt Charts - Axes RGB 127,127,127 | Wgt: 0.75pt Middleby is a New Market Entrant in the Large and Fast-Growing Ice & Beverage Category Charts - Lines Between Series: None Link to template Pages Setup 23 Width: 33.867 cm Add doctop here Height: 19.05 cm
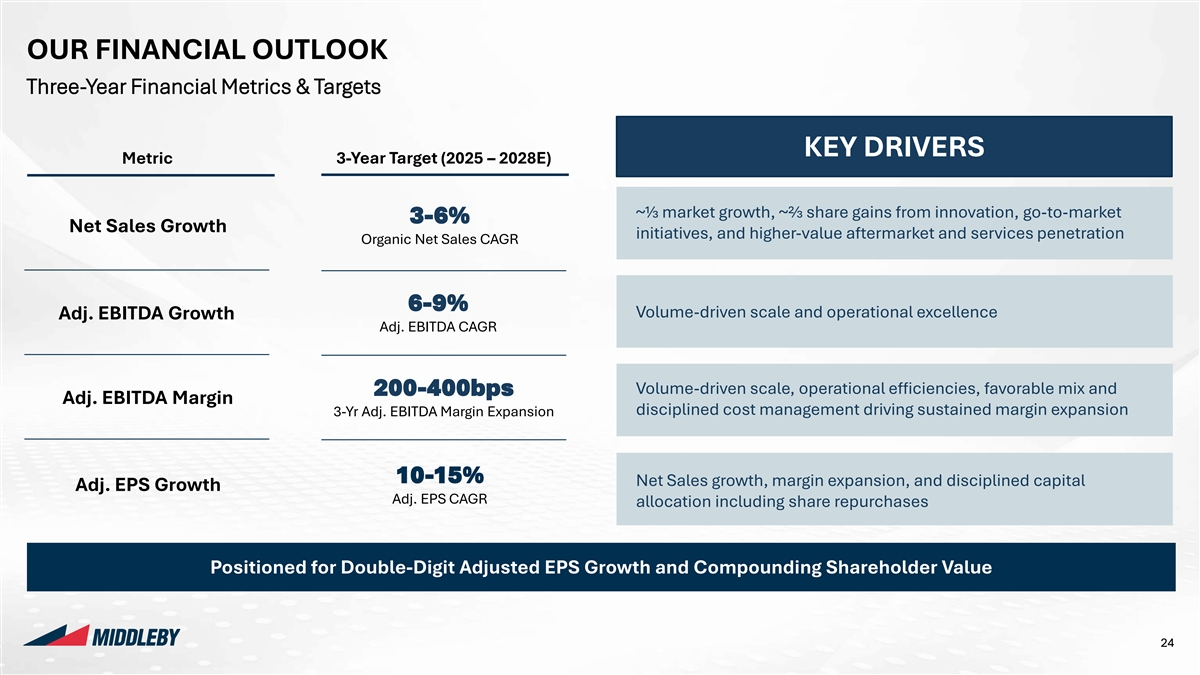
OUR FINANCIAL OUTLOOK Three-Year Financial Metrics & Targets Company Logos Colours 255:255:255 Background OUR FINANCIAL OUTLOOK 0:0:0 Text Colour Three-Year Financial Metrics & Targets 23:60:93 Page Heading 23:60:93 Subheading Styles Charts – Charts – KEY DRIVERS Primary Secondary Metric 3-Year Target (2025 – 2028E) Colours Colours Rounded Y 0:47:80 205:219:224 Corners ~⅓ market growth, ~⅔ share gains from innovation, go-to-market 0:110:182 161:188:196 3-6% Net Sales Growth Shadows N initiatives, and higher-value aftermarket and services penetration Organic Net Sales CAGR 226:45:63 129:179:224 228:222:212 244:242:238 Gradients N 139:178:221 217:217:217 6-9% Volume-driven scale and operational excellence Adj. EBITDA Growth 191:191:191 229:229:229 Adj. EBITDA CAGR Headings on page Hierarchy of Highlights Lines Volume-driven scale, operational efficiencies, favorable mix and Y 200-400bps Adj. EBITDA Margin Message Box (RGB and weight) disciplined cost management driving sustained margin expansion 3-Yr Adj. EBITDA Margin Expansion N Boxes Highlighted Boxes on the Page Lines Highlight Table Rows / Maps 10-15% Tables - Headings Net Sales growth, margin expansion, and disciplined capital Adj. EPS Growth RGB 0,0,0 | Wgt: 1pt Adj. EPS CAGR Row Heading allocation including share repurchases Tables - Rows Cells in Tables RGB 185,185,185 | Wgt: 0.5pt Charts - Axes RGB 127,127,127 | Wgt: 0.75pt Positioned for Double-Digit Adjusted EPS Growth and Compounding Shareholder Value Charts - Lines Between Series: None Link to template Pages Setup 24 Width: 33.867 cm Add doctop here Height: 19.05 cm
Company Logos Colours 255:255:255 Background 0:0:0 Text Colour 23:60:93 Page Heading 23:60:93 Subheading Styles Charts – Charts – Primary Secondary Colours Colours Rounded Y 0:47:80 205:219:224 Corners 0:110:182 161:188:196 Shadows N 226:45:63 129:179:224 228:222:212 244:242:238 Gradients N 139:178:221 217:217:217 191:191:191 229:229:229 GROWTH ENGINE Headings on page Hierarchy of Highlights Lines Y Message Box (RGB and weight) AND VALUE 03 N Boxes Highlighted Boxes on the Page DRIVERS Lines Highlight Table Rows / Maps Tables - Headings RGB 0,0,0 | Wgt: 1pt Row Heading Tables - Rows Cells in Tables RGB 185,185,185 | Wgt: 0.5pt Charts - Axes RGB 127,127,127 | Wgt: 0.75pt Charts - Lines Between Series: None Link to template Pages Setup 25 Width: 33.867 cm Add doctop here Height: 19.05 cm
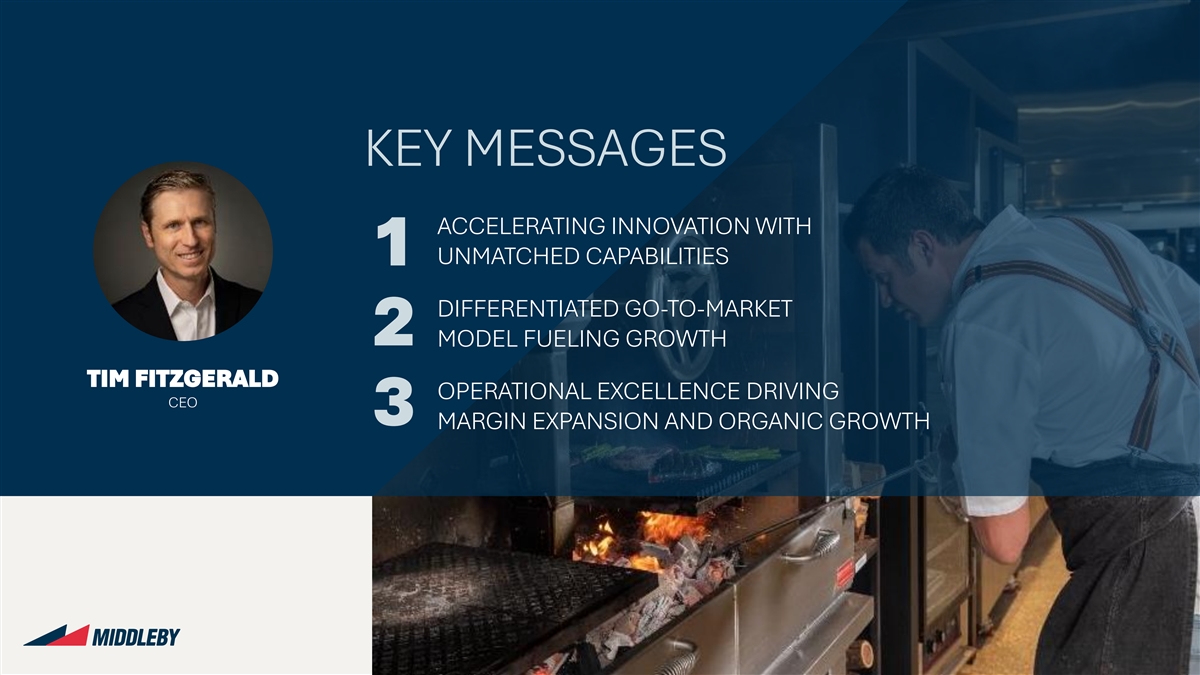
Company Logos Colours 255:255:255 Background 0:0:0 Text Colour 23:60:93 Page Heading 23:60:93 Subheading Styles Charts – Charts – Primary Secondary KEY MESSAGES Colours Colours Rounded Y 0:47:80 205:219:224 Corners 0:110:182 161:188:196 ACCELERATING INNOVATION WITH Shadows N 226:45:63 129:179:224 UNMATCHED CAPABILITIES 1 228:222:212 244:242:238 Gradients N 139:178:221 217:217:217 DIFFERENTIATED GO-TO-MARKET 191:191:191 229:229:229 2 MODEL FUELING GROWTH Headings on page Hierarchy of Highlights TIM FITZGERALD Lines Y OPERATIONAL EXCELLENCE DRIVING Message Box (RGB and weight) CEO 3 N Boxes MARGIN EXPANSION AND ORGANIC GROWTH Highlighted Boxes on the Page Lines Highlight Table Rows / Maps Tables - Headings RGB 0,0,0 | Wgt: 1pt Row Heading Tables - Rows Cells in Tables RGB 185,185,185 | Wgt: 0.5pt Charts - Axes RGB 127,127,127 | Wgt: 0.75pt Charts - Lines Between Series: None Link to template Pages Setup 26 Width: 33.867 cm Add doctop here Height: 19.05 cm
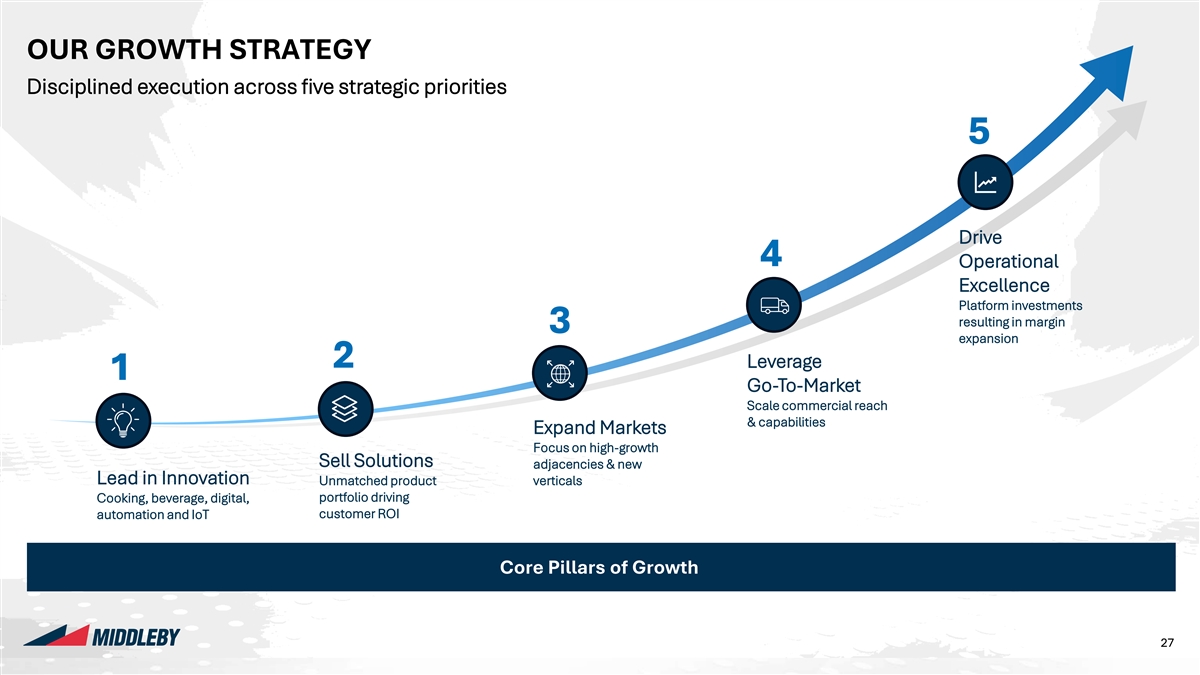
Company Logos Colours 255:255:255 Background OUR GROWTH STRATEGY 0:0:0 Text Colour Disciplined execution across five strategic priorities 23:60:93 Page Heading 23:60:93 Subheading 5 Styles Charts – Charts – 27 Primary Secondary Colours Colours Rounded Y 0:47:80 205:219:224 Corners 0:110:182 161:188:196 Shadows N Drive 226:45:63 129:179:224 4 Operational 228:222:212 244:242:238 Gradients N Excellence 139:178:221 217:217:217 Platform investments resulting in margin 191:191:191 229:229:229 3 expansion Headings on page 2 Leverage Hierarchy of Highlights 1 Go-To-Market Lines Y Message Box (RGB and weight) Scale commercial reach & capabilities N Boxes Highlighted Boxes Expand Markets on the Page Focus on high-growth Lines Sell Solutions Highlight Table adjacencies & new Rows / Maps Lead in Innovation Tables - Headings Unmatched product verticals RGB 0,0,0 | Wgt: 1pt portfolio driving Cooking, beverage, digital, Row Heading Tables - Rows automation and IoT customer ROI Cells in Tables RGB 185,185,185 | Wgt: 0.5pt Charts - Axes RGB 127,127,127 | Wgt: 0.75pt Core Pillars of Growth Charts - Lines Between Series: None Link to template Pages Setup 27 27 Width: 33.867 cm Add doctop here Height: 19.05 cm
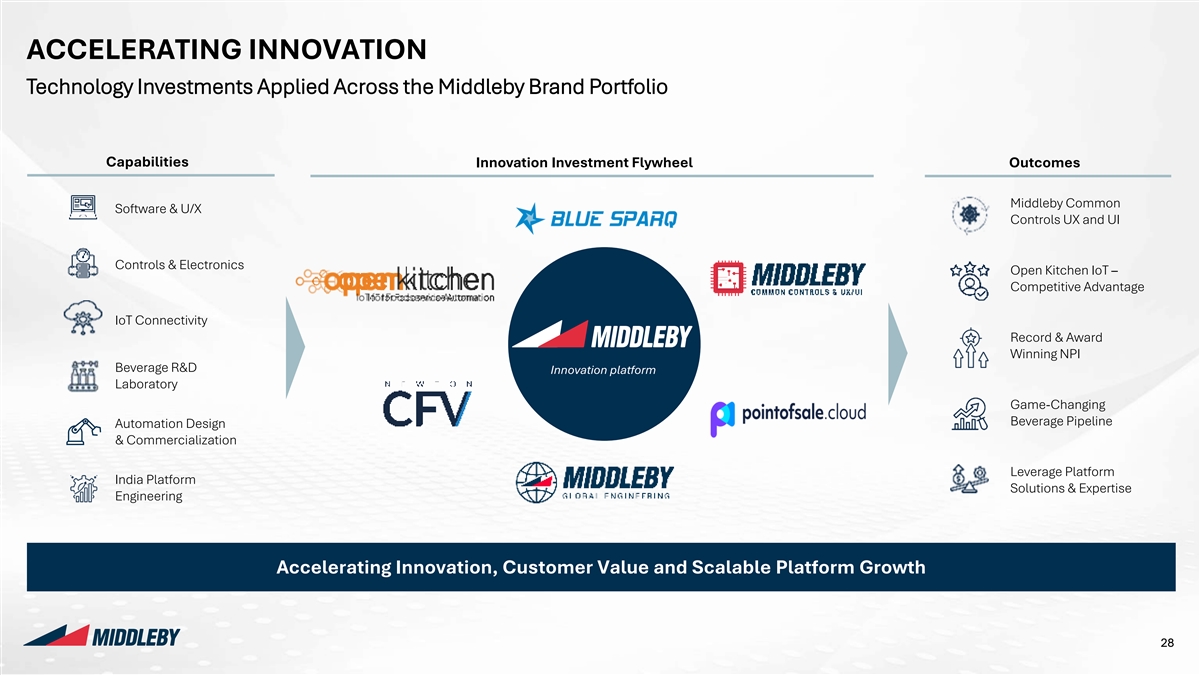
ACCELERATING INNOVATION Technology Investments Applied Across the Middleby Brand Portfolio Company Logos Colours 255:255:255 Background ACCELERATING INNOVATION 0:0:0 Text Colour Technology Investments Applied Across the Middleby Brand Portfolio 23:60:93 Page Heading 23:60:93 Subheading Styles Charts – Charts – Primary Secondary Capabilities Innovation Investment Flywheel Outcomes Colours Colours Rounded Y 0:47:80 205:219:224 Corners Middleby Common Software & U/X 0:110:182 161:188:196 Controls UX and UI Shadows N 226:45:63 129:179:224 Controls & Electronics 228:222:212 244:242:238 Open Kitchen IoT – Gradients N Competitive Advantage 139:178:221 217:217:217 IoT Connectivity 191:191:191 229:229:229 Record & Award Winning NPI Headings on page Hierarchy of Highlights Beverage R&D Innovation platform Laboratory Lines Y Message Box (RGB and weight) Game-Changing Beverage Pipeline N Automation Design Boxes Highlighted Boxes & Commercialization on the Page Lines Highlight Table Leverage Platform Rows / Maps India Platform Tables - Headings Solutions & Expertise RGB 0,0,0 | Wgt: 1pt Engineering Row Heading Tables - Rows Cells in Tables RGB 185,185,185 | Wgt: 0.5pt Charts - Axes RGB 127,127,127 | Wgt: 0.75pt Accelerating Innovation, Customer Value and Scalable Platform Growth Charts - Lines Between Series: None Link to template Pages Setup 28 Width: 33.867 cm Add doctop here Height: 19.05 cm
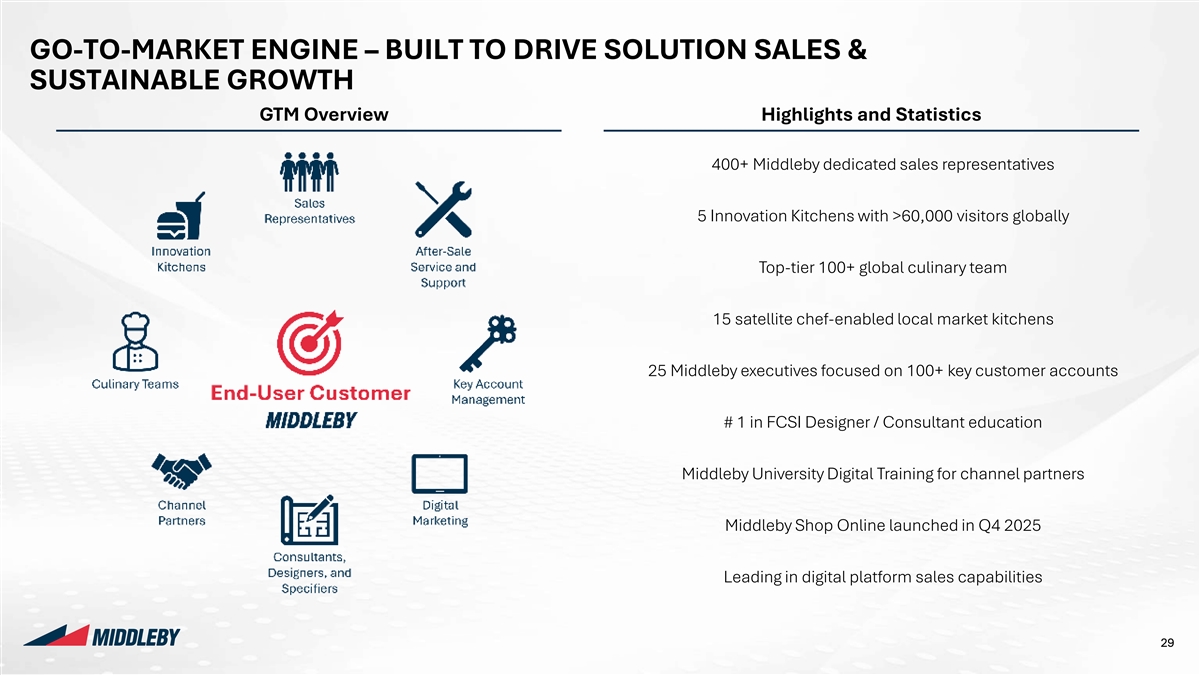
Company Logos Colours 255:255:255 Background GO-TO-MARKET ENGINE – BUILT TO DRIVE SOLUTION SALES & 0:0:0 Text Colour SUSTAINABLE GROWTH 23:60:93 Page Heading GTM Overview Highlights and Statistics 23:60:93 Subheading Styles Charts – Charts – Primary Secondary 400+ Middleby dedicated sales representatives Colours Colours Rounded Y 0:47:80 205:219:224 Corners 0:110:182 161:188:196 5 Innovation Kitchens with >60,000 visitors globally Shadows N 226:45:63 129:179:224 228:222:212 244:242:238 Top-tier 100+ global culinary team Gradients N 139:178:221 217:217:217 15 satellite chef-enabled local market kitchens 191:191:191 229:229:229 Headings on page Hierarchy of Highlights 25 Middleby executives focused on 100+ key customer accounts Lines Y Message Box (RGB and weight) N # 1 in FCSI Designer / Consultant education Boxes Highlighted Boxes on the Page Lines Highlight Table Middleby University Digital Training for channel partners Rows / Maps Tables - Headings RGB 0,0,0 | Wgt: 1pt Row Heading Tables - Rows Cells in Tables RGB 185,185,185 | Wgt: 0.5pt Middleby Shop Online launched in Q4 2025 Charts - Axes RGB 127,127,127 | Wgt: 0.75pt Charts - Lines Between Series: Leading in digital platform sales capabilities None Link to template Pages Setup 29 Width: 33.867 cm Add doctop here Height: 19.05 cm
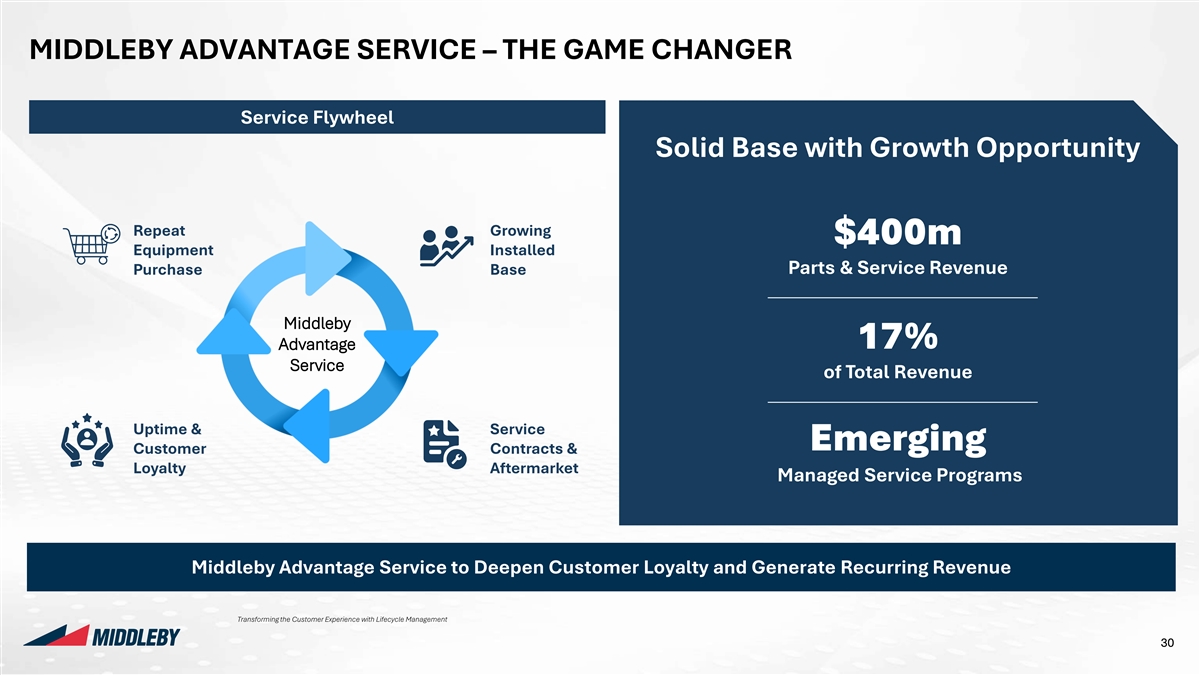
Company Logos Colours 255:255:255 Background MIDDLEBY ADVANTAGE SERVICE – THE GAME CHANGER 0:0:0 Text Colour 23:60:93 Page Heading Service Flywheel 23:60:93 Subheading Styles Charts – Charts – Solid Base with Growth Opportunity Primary Secondary Colours Colours Rounded Y 0:47:80 205:219:224 Corners 0:110:182 161:188:196 Shadows N Repeat Growing $400m 226:45:63 129:179:224 Equipment Installed 228:222:212 244:242:238 Parts & Service Revenue Purchase Base Gradients N 139:178:221 217:217:217 191:191:191 229:229:229 Middleby 17% Advantage Headings on page Hierarchy of Highlights Service of Total Revenue Lines Y Message Box (RGB and weight) N Boxes Highlighted Boxes Uptime & Service on the Page Emerging Customer Contracts & Lines Highlight Table Loyalty Aftermarket Managed Service Programs Rows / Maps Tables - Headings RGB 0,0,0 | Wgt: 1pt Row Heading Tables - Rows Cells in Tables RGB 185,185,185 | Wgt: 0.5pt Charts - Axes RGB 127,127,127 | Wgt: 0.75pt Middleby Advantage Service to Deepen Customer Loyalty and Generate Recurring Revenue Charts - Lines Between Series: None Link to template Pages Setup Transforming the Customer Experience with Lifecycle Management 30 Width: 33.867 cm Add doctop here Height: 19.05 cm
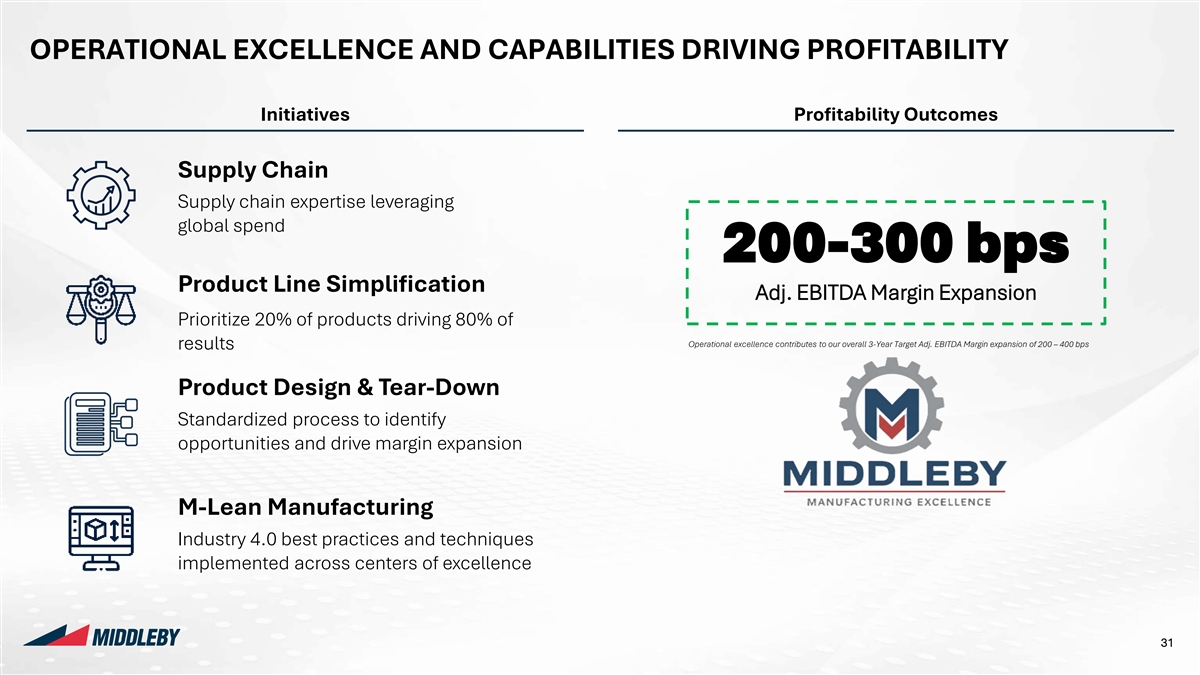
Company Logos Colours 255:255:255 Background OPERATIONAL EXCELLENCE AND CAPABILITIES DRIVING PROFITABILITY 0:0:0 Text Colour 23:60:93 Page Heading Initiatives Profitability Outcomes 23:60:93 Subheading Styles Charts – Charts – Primary Secondary Colours Colours Supply Chain Rounded Y 0:47:80 205:219:224 Corners Supply chain expertise leveraging 0:110:182 161:188:196 global spend Shadows N 226:45:63 129:179:224 200-300 bps 228:222:212 244:242:238 Gradients N Product Line Simplification Adj. EBITDA Margin Expansion 139:178:221 217:217:217 Prioritize 20% of products driving 80% of 191:191:191 229:229:229 Operational excellence contributes to our overall 3-Year Target Adj. EBITDA Margin expansion of 200 – 400 bps results Headings on page Hierarchy of Highlights Lines Product Design & Tear-Down Y Message Box (RGB and weight) Standardized process to identify N Boxes Highlighted Boxes on the Page opportunities and drive margin expansion Lines Highlight Table Rows / Maps Tables - Headings RGB 0,0,0 | Wgt: 1pt Row Heading Tables - Rows M-Lean Manufacturing Cells in Tables RGB 185,185,185 | Wgt: 0.5pt Industry 4.0 best practices and techniques Charts - Axes RGB 127,127,127 | Wgt: 0.75pt implemented across centers of excellence Charts - Lines Between Series: None Link to template Pages Setup 31 Width: 33.867 cm Add doctop here Height: 19.05 cm
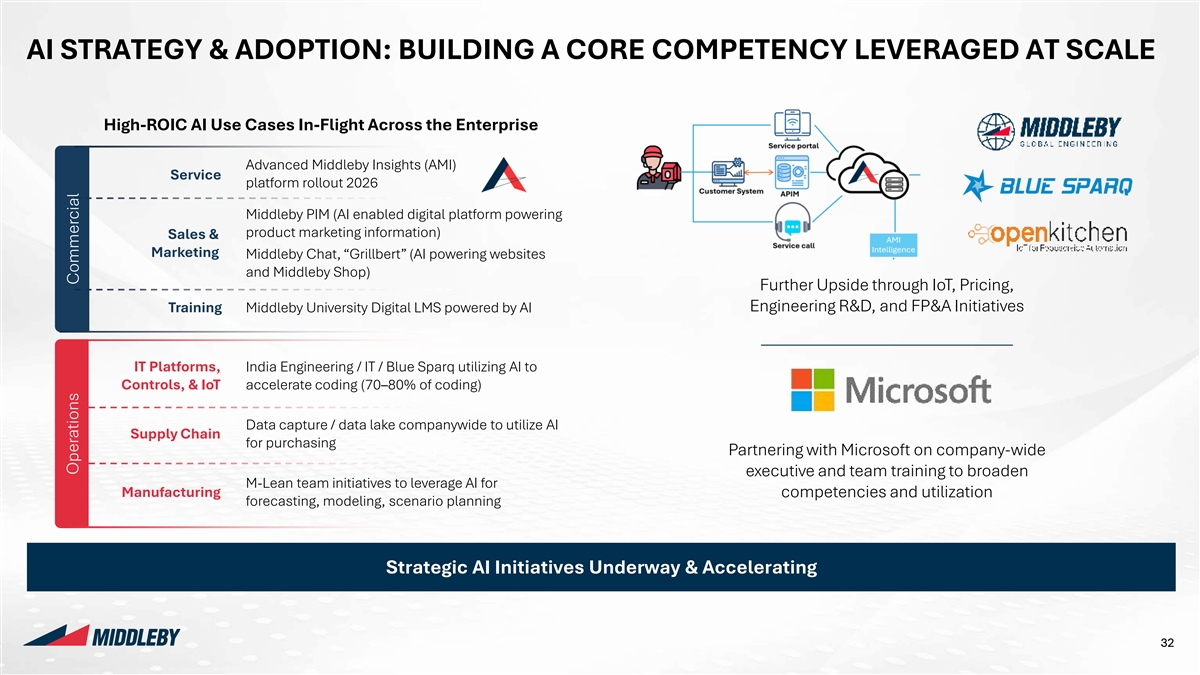
Company Logos Colours 255:255:255 Background AI STRATEGY & ADOPTION: BUILDING A CORE COMPETENCY LEVERAGED AT SCALE 0:0:0 Text Colour 23:60:93 Page Heading 23:60:93 High-ROIC AI Use Cases In-Flight Across the Enterprise Subheading Styles Charts – Charts – Primary Secondary Advanced Middleby Insights (AMI) Colours Colours Service platform rollout 2026 Rounded Y 0:47:80 205:219:224 Corners Middleby PIM (AI enabled digital platform powering 0:110:182 161:188:196 Shadows N product marketing information) Sales & 226:45:63 129:179:224 Marketing Middleby Chat, “Grillbert” (AI powering websites 228:222:212 244:242:238 and Middleby Shop) Gradients N Further Upside through IoT, Pricing, 139:178:221 217:217:217 Engineering R&D, and FP&A Initiatives Training Middleby University Digital LMS powered by AI 191:191:191 229:229:229 Headings on page Hierarchy of Highlights IT Platforms, India Engineering / IT / Blue Sparq utilizing AI to Controls, & IoT accelerate coding (70–80% of coding) Lines Y Message Box (RGB and weight) N Boxes Data capture / data lake companywide to utilize AI Highlighted Boxes Supply Chain on the Page for purchasing Partnering with Microsoft on company-wide Lines Highlight Table executive and team training to broaden Rows / Maps Tables - Headings M-Lean team initiatives to leverage AI for RGB 0,0,0 | Wgt: 1pt Manufacturing competencies and utilization forecasting, modeling, scenario planning Row Heading Tables - Rows Cells in Tables RGB 185,185,185 | Wgt: 0.5pt Charts - Axes RGB 127,127,127 | Wgt: 0.75pt Strategic AI Initiatives Underway & Accelerating Charts - Lines Between Series: None Link to template Pages Setup 32 Width: 33.867 cm Add doctop here Height: 19.05 cm Operations Commercial
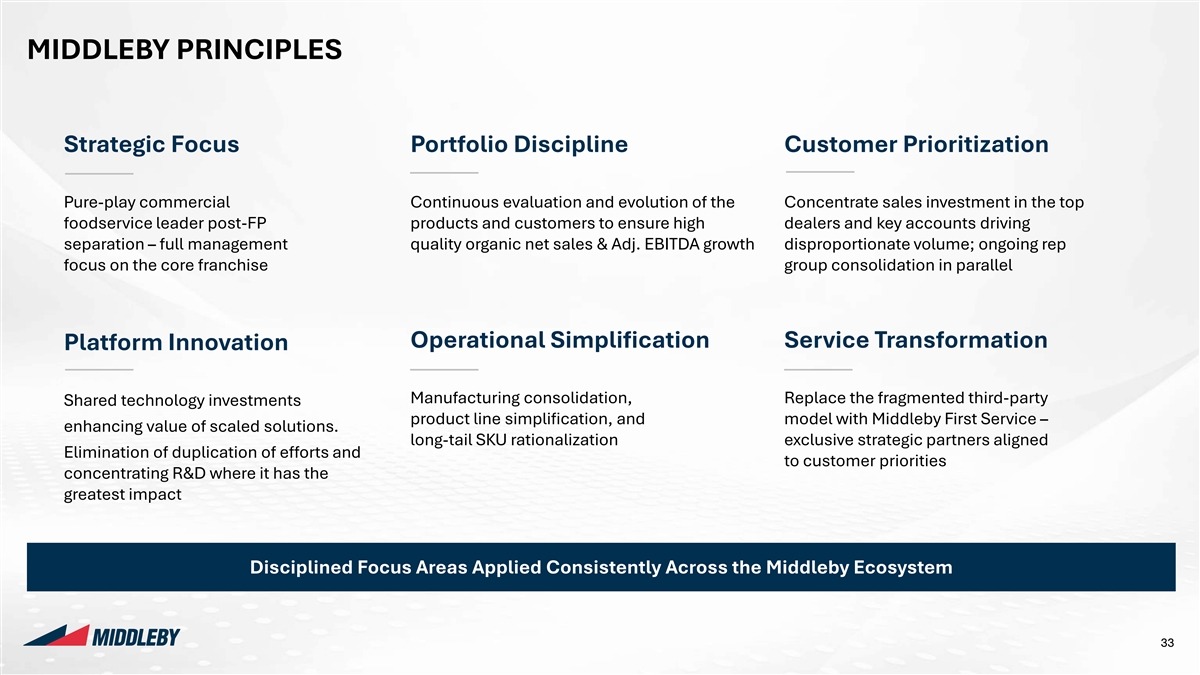
Company Logos Colours 255:255:255 Background MIDDLEBY PRINCIPLES 0:0:0 Text Colour 23:60:93 Page Heading 23:60:93 Subheading Styles Strategic Focus Portfolio Discipline Customer Prioritization Charts – Charts – Primary Secondary Colours Colours Rounded Y 0:47:80 205:219:224 Corners Pure-play commercial Continuous evaluation and evolution of the Concentrate sales investment in the top 0:110:182 161:188:196 foodservice leader post-FP products and customers to ensure high dealers and key accounts driving Shadows N 226:45:63 129:179:224 separation – full management quality organic net sales & Adj. EBITDA growth disproportionate volume; ongoing rep focus on the core franchise group consolidation in parallel 228:222:212 244:242:238 Gradients N 139:178:221 217:217:217 191:191:191 229:229:229 Operational Simplification Service Transformation Platform Innovation Headings on page Hierarchy of Highlights Lines Y Manufacturing consolidation, Replace the fragmented third-party Message Box (RGB and weight) Shared technology investments product line simplification, and model with Middleby First Service – N Boxes Highlighted Boxes enhancing value of scaled solutions. long-tail SKU rationalization exclusive strategic partners aligned on the Page Elimination of duplication of efforts and Lines to customer priorities Highlight Table concentrating R&D where it has the Rows / Maps Tables - Headings RGB 0,0,0 | Wgt: 1pt greatest impact Row Heading Tables - Rows Cells in Tables RGB 185,185,185 | Wgt: 0.5pt Charts - Axes RGB 127,127,127 | Wgt: 0.75pt Disciplined Focus Areas Applied Consistently Across the Middleby Ecosystem Charts - Lines Between Series: None Link to template Pages Setup 33 Width: 33.867 cm Add doctop here Height: 19.05 cm
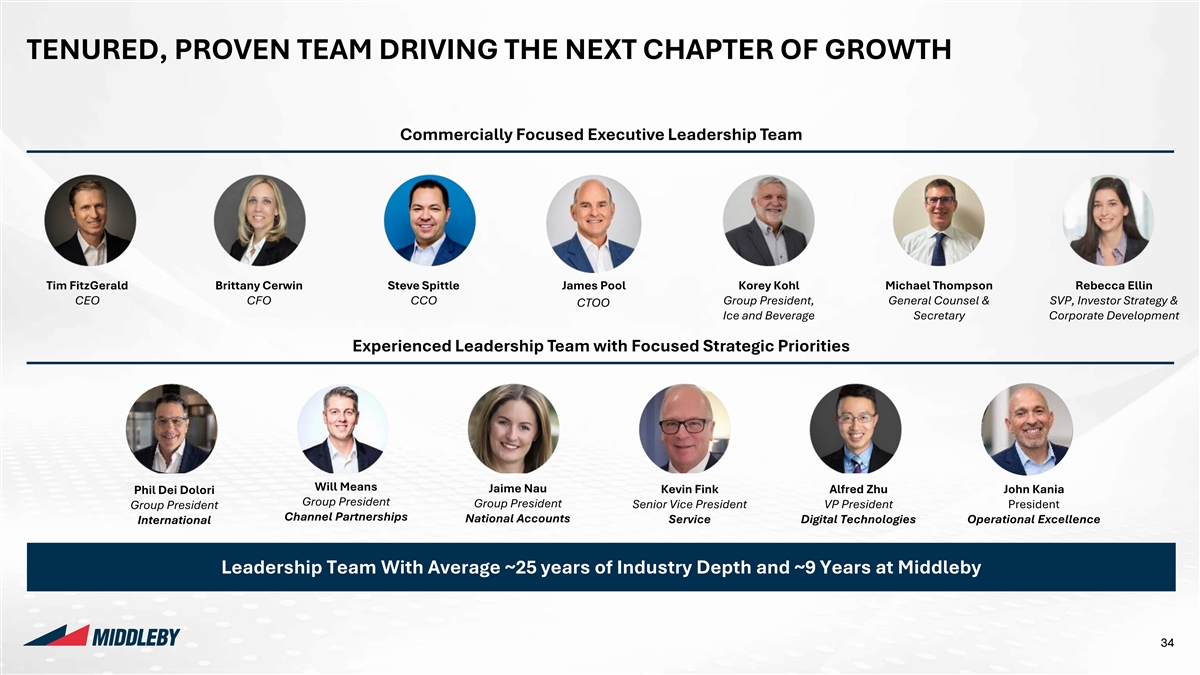
Company Logos Colours 255:255:255 Background TENURED, PROVEN TEAM DRIVING THE NEXT CHAPTER OF GROWTH 0:0:0 Text Colour 23:60:93 Page Heading 23:60:93 Subheading Commercially Focused Executive Leadership Team Styles Charts – Charts – Primary Secondary Colours Colours Rounded Y 0:47:80 205:219:224 Corners 0:110:182 161:188:196 Shadows N 226:45:63 129:179:224 228:222:212 244:242:238 Gradients N Tim FitzGerald Brittany Cerwin Steve Spittle James Pool Korey Kohl Michael Thompson Rebecca Ellin 139:178:221 217:217:217 CEO CFO CCO CTO Group President, General Counsel & SVP, Investor Strategy & CTOO Ice and Beverage Secretary Corporate Development 191:191:191 229:229:229 Experienced Leadership Team with Focused Strategic Priorities Headings on page Hierarchy of Highlights Lines Y Message Box (RGB and weight) N Boxes Highlighted Boxes on the Page Lines Highlight Table Rows / Maps Tables - Headings Will Means Jaime Nau Phil Dei Dolori Kevin Fink Alfred Zhu John Kania RGB 0,0,0 | Wgt: 1pt Group President Row Heading Group President Group President Senior Vice President VP President President Tables - Rows Cells in Tables Channel Partnerships National Accounts International Service Digital Technologies Operational Excellence RGB 185,185,185 | Wgt: 0.5pt Charts - Axes RGB 127,127,127 | Wgt: 0.75pt Leadership Team With Average ~25 years of Industry Depth and ~9 Years at Middleby Charts - Lines Between Series: None Link to template Pages Setup 34 Width: 33.867 cm Add doctop here Height: 19.05 cm
background Company Logos Colours 255:255:255 Background 0:0:0 Text Colour 23:60:93 Page Heading 23:60:93 Subheading Styles Charts – Charts – Primary Secondary Colours Colours Rounded Y 0:47:80 205:219:224 Corners 0:110:182 161:188:196 Shadows N 226:45:63 129:179:224 GO TO INNOVATION 228:222:212 244:242:238 OPERATIONAL SERVICE + Gradients N MARKET + TECHNOLOGY EXCELLENCE 139:178:221 217:217:217 AFTERMARKET 191:191:191 229:229:229 Headings on page Hierarchy of Highlights Lines Y Message Box (RGB and weight) N Boxes Highlighted Boxes on the Page Lines Highlight Table Rows / Maps Tables - Headings RGB 0,0,0 | Wgt: 1pt Row Heading Tables - Rows Cells in Tables RGB 185,185,185 | Wgt: 0.5pt Charts - Axes RGB 127,127,127 | Wgt: 0.75pt Charts - Lines Between Series: TRANSFORMATIONAL GROWTH DRIVERS LEVERAGING SCALE OF PLATFORM None Link to template Pages Setup 35 35 Width: 33.867 cm Add doctop here Height: 19.05 cm
Company Logos Colours 255:255:255 Background 0:0:0 Text Colour 23:60:93 Page Heading 23:60:93 Subheading Styles Charts – Charts – Primary Secondary Colours Colours Rounded Y 0:47:80 205:219:224 Corners 0:110:182 161:188:196 Shadows N 226:45:63 129:179:224 228:222:212 244:242:238 Gradients N 139:178:221 217:217:217 191:191:191 229:229:229 GO-TO-MARKET Headings on page Hierarchy of Highlights Lines Y & COMMERCIAL Message Box (RGB and weight) 04 N Boxes Highlighted Boxes on the Page EXECUTION Lines Highlight Table Rows / Maps Tables - Headings RGB 0,0,0 | Wgt: 1pt Row Heading Tables - Rows Cells in Tables RGB 185,185,185 | Wgt: 0.5pt Charts - Axes RGB 127,127,127 | Wgt: 0.75pt Charts - Lines Between Series: None Link to template Pages Setup 36 Width: 33.867 cm Add doctop here Height: 19.05 cm
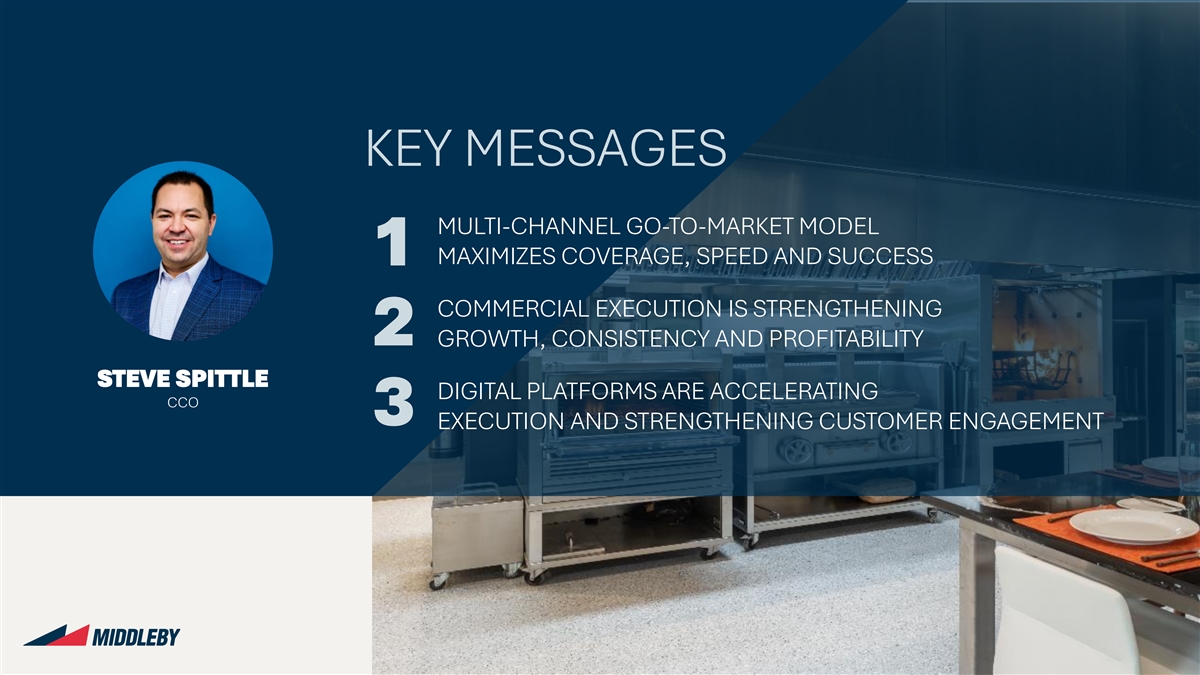
Company Logos Colours 255:255:255 Background 0:0:0 Text Colour 23:60:93 Page Heading 23:60:93 Subheading Styles Charts – Charts – Primary Secondary KEY MESSAGES Colours Colours Rounded Y 0:47:80 205:219:224 Corners 0:110:182 161:188:196 MULTI-CHANNEL GO-TO-MARKET MODEL Shadows N 226:45:63 129:179:224 MAXIMIZES COVERAGE, SPEED AND SUCCESS 1 228:222:212 244:242:238 Gradients N 139:178:221 217:217:217 COMMERCIAL EXECUTION IS STRENGTHENING 191:191:191 229:229:229 2 GROWTH, CONSISTENCY AND PROFITABILITY Headings on page Hierarchy of Highlights STEVE SPITTLE Lines Y DIGITAL PLATFORMS ARE ACCELERATING Message Box (RGB and weight) CCO 3 N Boxes EXECUTION AND STRENGTHENING CUSTOMER ENGAGEMENT Highlighted Boxes on the Page Lines Highlight Table Rows / Maps Tables - Headings RGB 0,0,0 | Wgt: 1pt Row Heading Tables - Rows Cells in Tables RGB 185,185,185 | Wgt: 0.5pt Charts - Axes RGB 127,127,127 | Wgt: 0.75pt Charts - Lines Between Series: None Link to template Pages Setup 37 Width: 33.867 cm Add doctop here Height: 19.05 cm
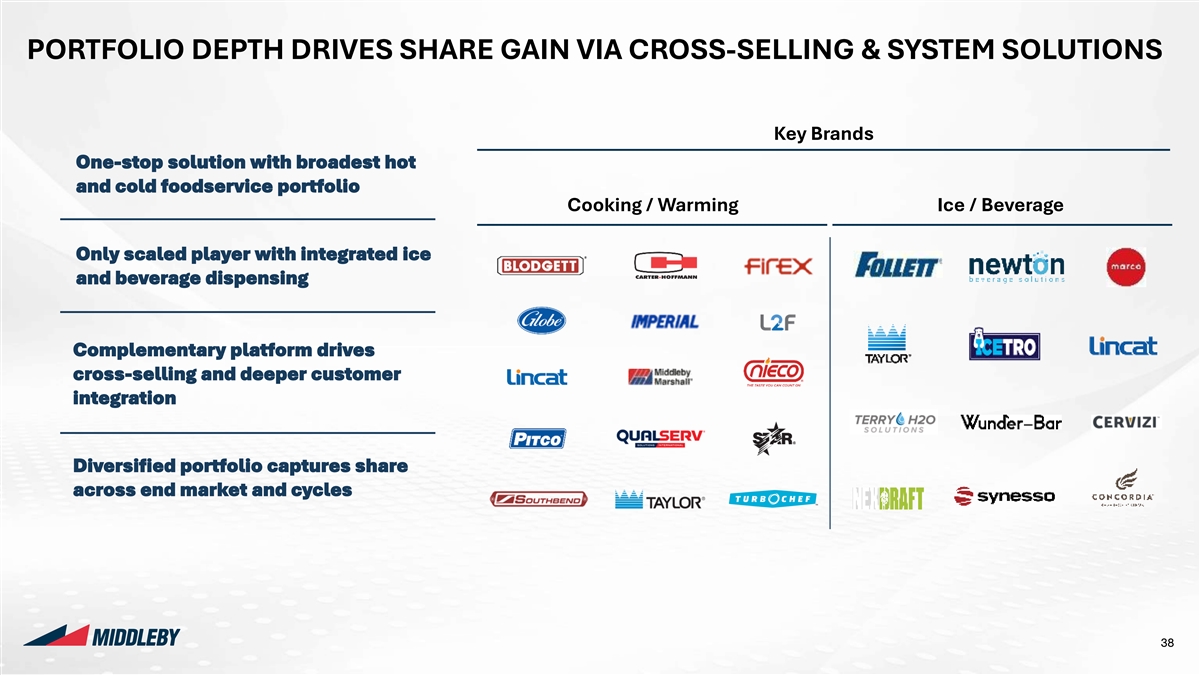
Company Logos Colours 255:255:255 Background PORTFOLIO DEPTH DRIVES SHARE GAIN VIA CROSS-SELLING & SYSTEM SOLUTIONS 0:0:0 Text Colour 23:60:93 Page Heading 23:60:93 Subheading Key Brands Styles Charts – Charts – Primary Secondary One-stop solution with broadest hot Colours Colours Rounded and cold foodservice portfolio Y 0:47:80 205:219:224 Corners Cooking / Warming Ice / Beverage 0:110:182 161:188:196 Shadows N 226:45:63 129:179:224 Only scaled player with integrated ice 228:222:212 244:242:238 Gradients N and beverage dispensing 139:178:221 217:217:217 191:191:191 229:229:229 Complementary platform drives Headings on page Hierarchy of Highlights cross-selling and deeper customer Lines Y integration Message Box (RGB and weight) N Boxes Highlighted Boxes on the Page Lines Highlight Table Diversified portfolio captures share Rows / Maps Tables - Headings RGB 0,0,0 | Wgt: 1pt across end market and cycles Row Heading Tables - Rows Cells in Tables RGB 185,185,185 | Wgt: 0.5pt Charts - Axes RGB 127,127,127 | Wgt: 0.75pt Charts - Lines Between Series: None Link to template Pages Setup 38 Width: 33.867 cm Add doctop here Height: 19.05 cm
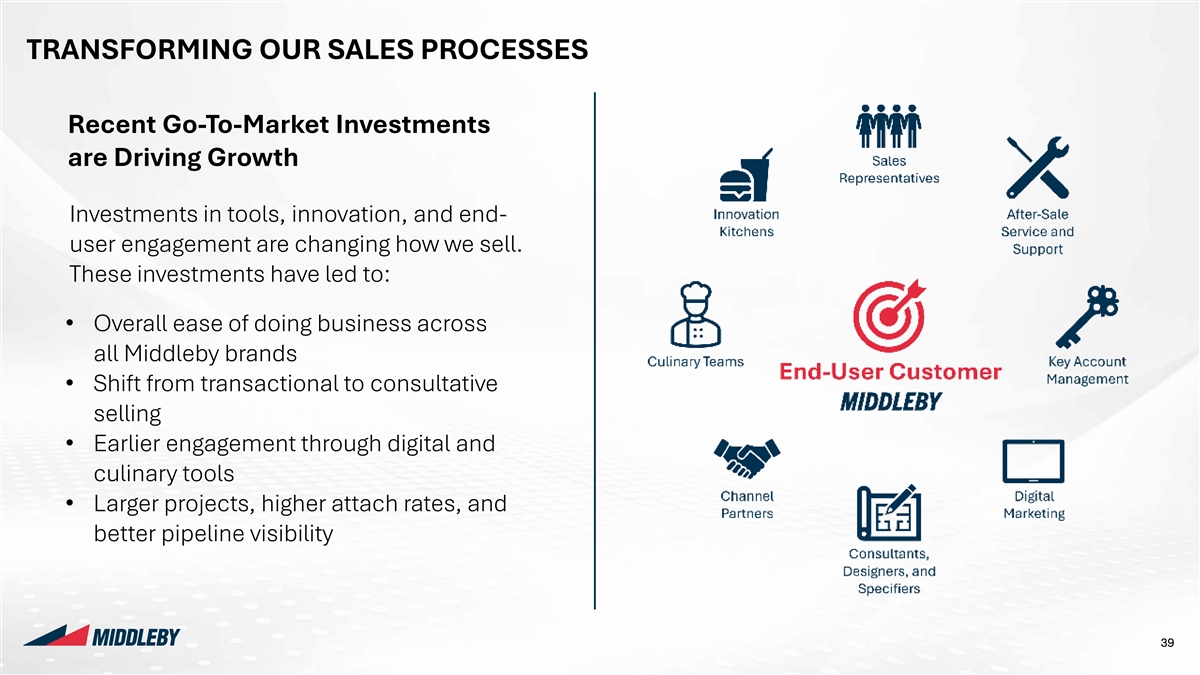
Company Logos Colours 255:255:255 Background TRANSFORMING OUR SALES PROCESSES 0:0:0 Text Colour 23:60:93 Page Heading 23:60:93 Subheading Recent Go-To-Market Investments Styles Charts – Charts – Primary Secondary are Driving Growth Colours Colours Rounded Y 0:47:80 205:219:224 Corners 0:110:182 161:188:196 Investments in tools, innovation, and end- Shadows N 226:45:63 129:179:224 user engagement are changing how we sell. 228:222:212 244:242:238 Gradients N These investments have led to: 139:178:221 217:217:217 191:191:191 229:229:229 • Overall ease of doing business across all Middleby brands Headings on page Hierarchy of Highlights • Shift from transactional to consultative Lines Y Message Box (RGB and weight) selling N Boxes Highlighted Boxes on the Page • Earlier engagement through digital and Lines Highlight Table culinary tools Rows / Maps Tables - Headings RGB 0,0,0 | Wgt: 1pt Row Heading • Larger projects, higher attach rates, and Tables - Rows Cells in Tables RGB 185,185,185 | Wgt: 0.5pt better pipeline visibility Charts - Axes RGB 127,127,127 | Wgt: 0.75pt Charts - Lines Between Series: None Link to template Pages Setup 39 Width: 33.867 cm Add doctop here Height: 19.05 cm
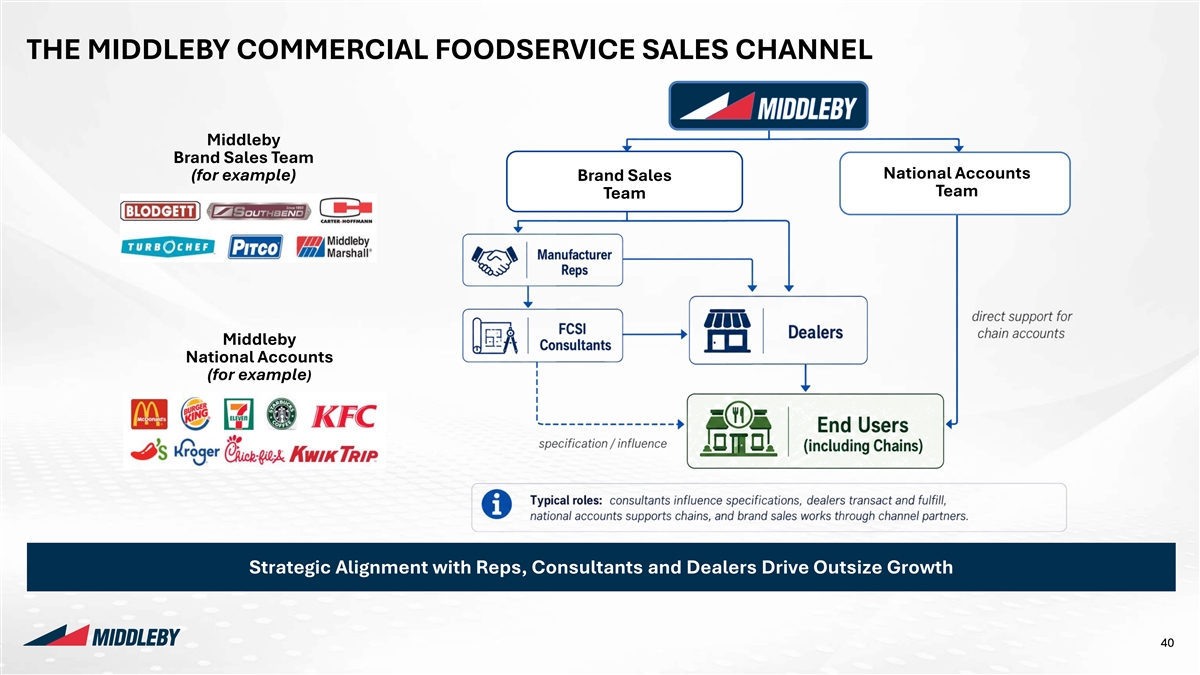
Company Logos Colours 255:255:255 Background THE MIDDLEBY COMMERCIAL FOODSERVICE SALES CHANNEL 0:0:0 Text Colour 23:60:93 Page Heading 23:60:93 Subheading Middleby Styles Charts – Charts – Primary Secondary Brand Sales Team Colours Colours National Accounts (for example) Brand Sales Rounded ` Y 0:47:80 205:219:224 Team Team Corners 0:110:182 161:188:196 Shadows N 226:45:63 129:179:224 228:222:212 244:242:238 Gradients N 139:178:221 217:217:217 191:191:191 229:229:229 Middleby National Accounts Headings on page Hierarchy of Highlights (for example) Lines Y Message Box (RGB and weight) N Boxes Highlighted Boxes on the Page Lines Highlight Table Rows / Maps Tables - Headings RGB 0,0,0 | Wgt: 1pt Row Heading Tables - Rows Cells in Tables RGB 185,185,185 | Wgt: 0.5pt Charts - Axes RGB 127,127,127 | Wgt: 0.75pt Strategic Alignment with Reps, Consultants and Dealers Drive Outsize Growth Charts - Lines Between Series: None Link to template Pages Setup 40 Width: 33.867 cm Add doctop here Height: 19.05 cm
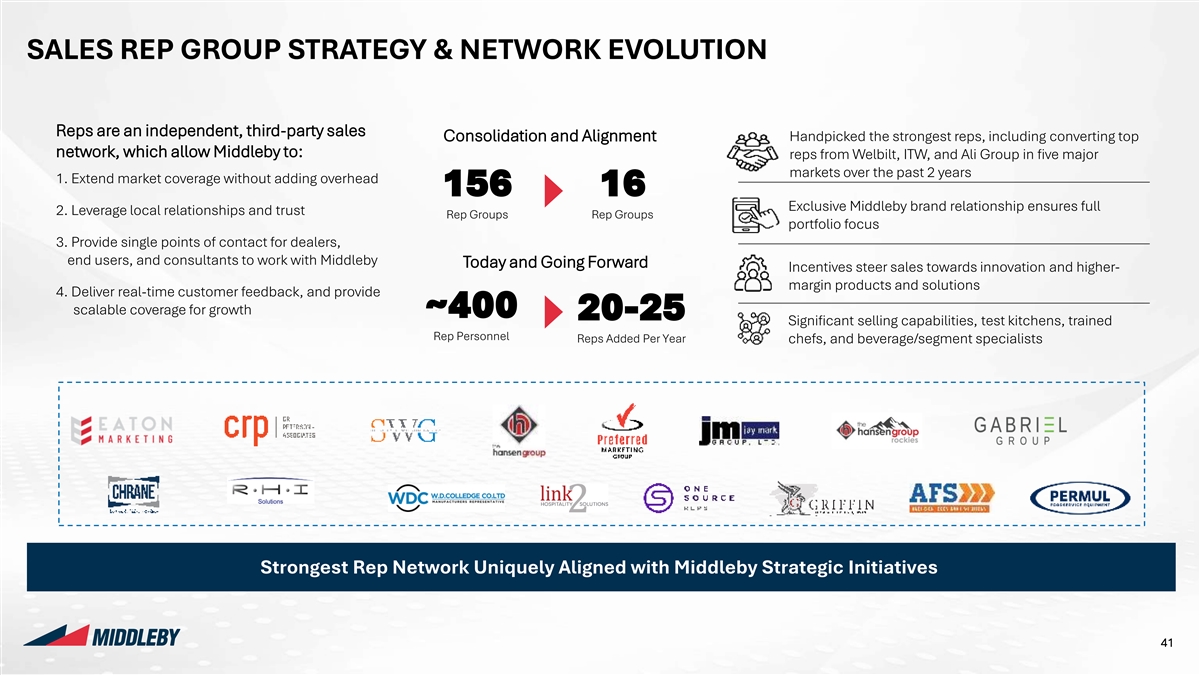
Company Logos Colours 255:255:255 Background SALES REP GROUP STRATEGY & NETWORK EVOLUTION 0:0:0 Text Colour 23:60:93 Page Heading 23:60:93 Subheading Reps are an independent, third-party sales Consolidation and Alignment Handpicked the strongest reps, including converting top Styles Charts – Charts – network, which allow Middleby to: reps from Welbilt, ITW, and Ali Group in five major Primary Secondary Colours Colours markets over the past 2 years 1. Extend market coverage without adding overhead Rounded Y 0:47:80 205:219:224 156 16 Corners Exclusive Middleby brand relationship ensures full 2. Leverage local relationships and trust Rep Groups Rep Groups 0:110:182 161:188:196 portfolio focus Shadows N 226:45:63 129:179:224 3. Provide single points of contact for dealers, end users, and consultants to work with Middleby Today and Going Forward Incentives steer sales towards innovation and higher- 228:222:212 244:242:238 Gradients N margin products and solutions 4. Deliver real-time customer feedback, and provide 139:178:221 217:217:217 scalable coverage for growth ~400 20-25 Significant selling capabilities, test kitchens, trained 191:191:191 229:229:229 Rep Personnel Reps Added Per Year chefs, and beverage/segment specialists Headings on page Hierarchy of Highlights Lines Y Message Box (RGB and weight) N Boxes Highlighted Boxes on the Page Lines Highlight Table Rows / Maps Tables - Headings RGB 0,0,0 | Wgt: 1pt Row Heading Tables - Rows Cells in Tables RGB 185,185,185 | Wgt: 0.5pt Charts - Axes RGB 127,127,127 | Wgt: 0.75pt Strongest Rep Network Uniquely Aligned with Middleby Strategic Initiatives Charts - Lines Between Series: None Link to template Pages Setup 41 Width: 33.867 cm Add doctop here Height: 19.05 cm
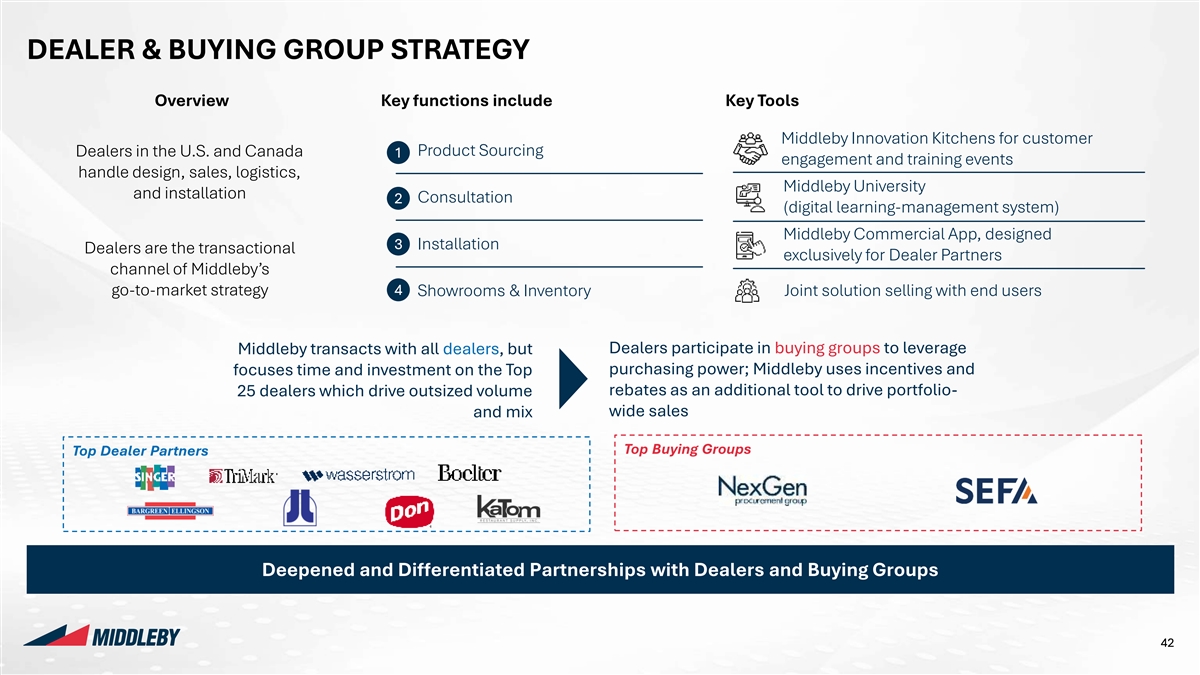
Company Logos Colours 255:255:255 Background DEALER & BUYING GROUP STRATEGY 0:0:0 Text Colour 23:60:93 Page Heading Overview Key functions include Key Tools 23:60:93 Subheading Middleby Innovation Kitchens for customer Styles Charts – Charts – Dealers in the U.S. and Canada Product Sourcing 1 Primary Secondary engagement and training events Colours Colours handle design, sales, logistics, Rounded Middleby University Y 0:47:80 205:219:224 and installation Corners Consultation 2 (digital learning-management system) 0:110:182 161:188:196 Shadows N Middleby Commercial App, designed 226:45:63 129:179:224 3 Installation Dealers are the transactional exclusively for Dealer Partners 228:222:212 244:242:238 channel of Middleby’s Gradients N 4 go-to-market strategy Showrooms & Inventory Joint solution selling with end users 139:178:221 217:217:217 191:191:191 229:229:229 Dealers participate in buying groups to leverage Middleby transacts with all dealers, but Headings on page Hierarchy of Highlights focuses time and investment on the Top purchasing power; Middleby uses incentives and Lines rebates as an additional tool to drive portfolio- Y 25 dealers which drive outsized volume Message Box (RGB and weight) wide sales and mix N Boxes Highlighted Boxes on the Page Top Buying Groups Top Dealer Partners Lines Highlight Table Rows / Maps Tables - Headings RGB 0,0,0 | Wgt: 1pt Row Heading Tables - Rows Cells in Tables RGB 185,185,185 | Wgt: 0.5pt Charts - Axes RGB 127,127,127 | Wgt: 0.75pt Deepened and Differentiated Partnerships with Dealers and Buying Groups Charts - Lines Between Series: None Link to template Pages Setup 42 Width: 33.867 cm Add doctop here Height: 19.05 cm
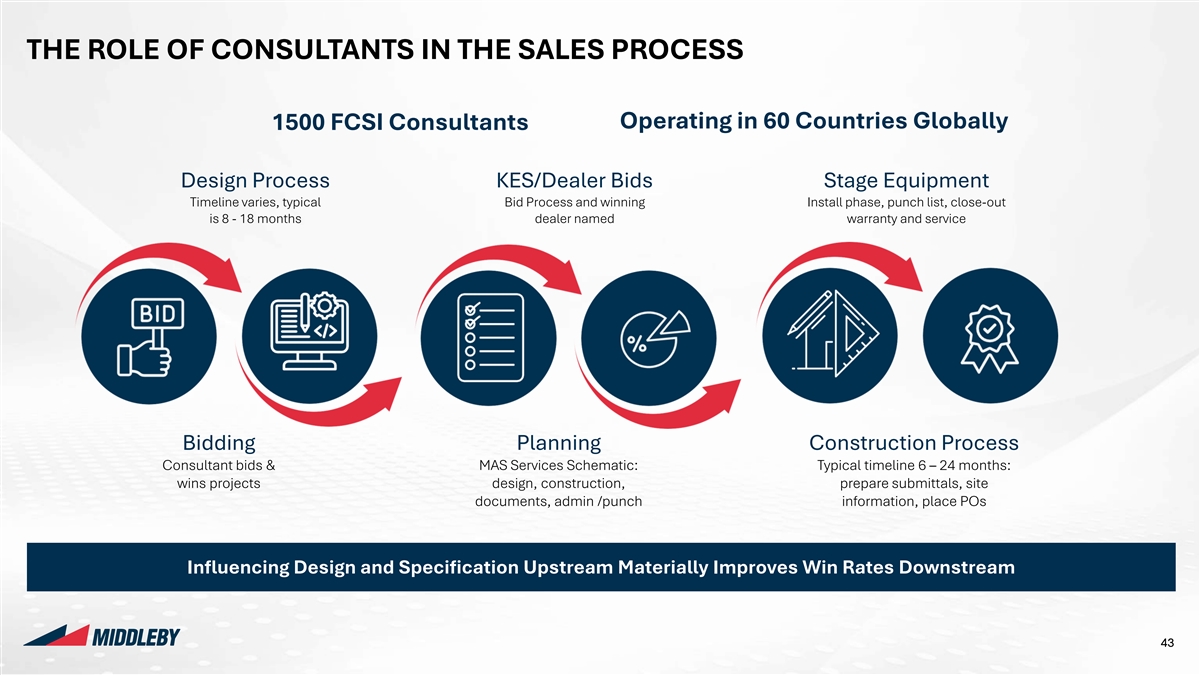
Company Logos Colours 255:255:255 Background THE ROLE OF CONSULTANTS IN THE SALES PROCESS 0:0:0 Text Colour 23:60:93 Page Heading Operating in 60 Countries Globally 23:60:93 1500 FCSI Consultants Subheading Styles Charts – Charts – Primary Secondary Colours Colours Design Process KES/Dealer Bids Stage Equipment Rounded Y 0:47:80 205:219:224 Corners Timeline varies, typical Bid Process and winning Install phase, punch list, close-out 0:110:182 161:188:196 is 8 - 18 months dealer named warranty and service Shadows N 226:45:63 129:179:224 228:222:212 244:242:238 Gradients N 139:178:221 217:217:217 191:191:191 229:229:229 Headings on page Hierarchy of Highlights Lines Y Message Box (RGB and weight) N Boxes Highlighted Boxes on the Page Bidding Planning Construction Process Lines Highlight Table Consultant bids & MAS Services Schematic: Typical timeline 6 – 24 months: Rows / Maps Tables - Headings wins projects design, construction, prepare submittals, site RGB 0,0,0 | Wgt: 1pt documents, admin /punch information, place POs Row Heading Tables - Rows Cells in Tables RGB 185,185,185 | Wgt: 0.5pt Charts - Axes RGB 127,127,127 | Wgt: 0.75pt Influencing Design and Specification Upstream Materially Improves Win Rates Downstream Charts - Lines Between Series: None Link to template Pages Setup 43 Width: 33.867 cm Add doctop here Height: 19.05 cm
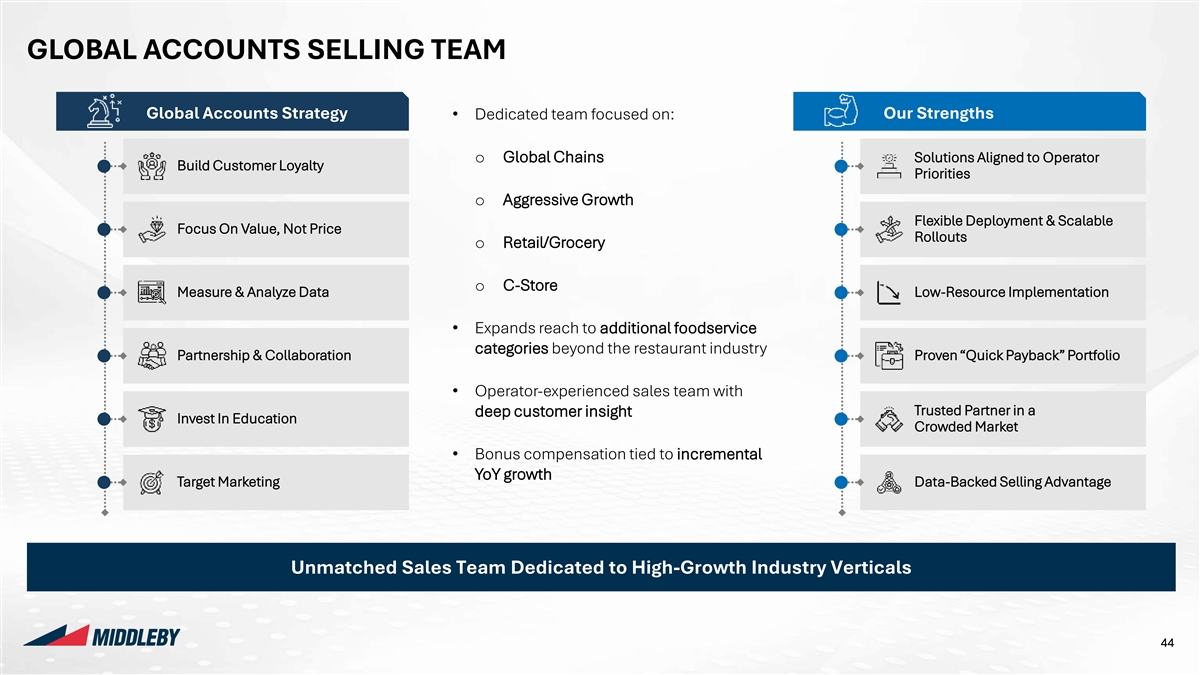
Company Logos Colours 255:255:255 Background GLOBAL ACCOUNTS SELLING TEAM 0:0:0 Text Colour 23:60:93 Page Heading Global Accounts Strategy Our Strengths • Dedicated team focused on: 23:60:93 Subheading Styles Charts – Charts – Primary Secondary o Global Chains Solutions Aligned to Operator Build Customer Loyalty Colours Colours Priorities Rounded Y 0:47:80 205:219:224 Corners o Aggressive Growth 0:110:182 161:188:196 Flexible Deployment & Scalable Focus On Value, Not Price Shadows N Rollouts 226:45:63 129:179:224 o Retail/Grocery 228:222:212 244:242:238 Gradients N o C-Store Measure & Analyze Data Low-Resource Implementation 139:178:221 217:217:217 191:191:191 229:229:229 • Expands reach to additional foodservice categories beyond the restaurant industry Partnership & Collaboration Proven “Quick Payback” Portfolio Headings on page Hierarchy of Highlights Lines Y• Operator-experienced sales team with Message Box (RGB and weight) Trusted Partner in a deep customer insight Invest In Education N Boxes Crowded Market Highlighted Boxes on the Page • Bonus compensation tied to incremental Lines Highlight Table YoY growth Rows / Maps Tables - Headings Target Marketing Data-Backed Selling Advantage RGB 0,0,0 | Wgt: 1pt Row Heading Tables - Rows Cells in Tables RGB 185,185,185 | Wgt: 0.5pt Charts - Axes RGB 127,127,127 | Wgt: 0.75pt Unmatched Sales Team Dedicated to High-Growth Industry Verticals Charts - Lines Between Series: None Link to template Pages Setup 44 Width: 33.867 cm Add doctop here Height: 19.05 cm
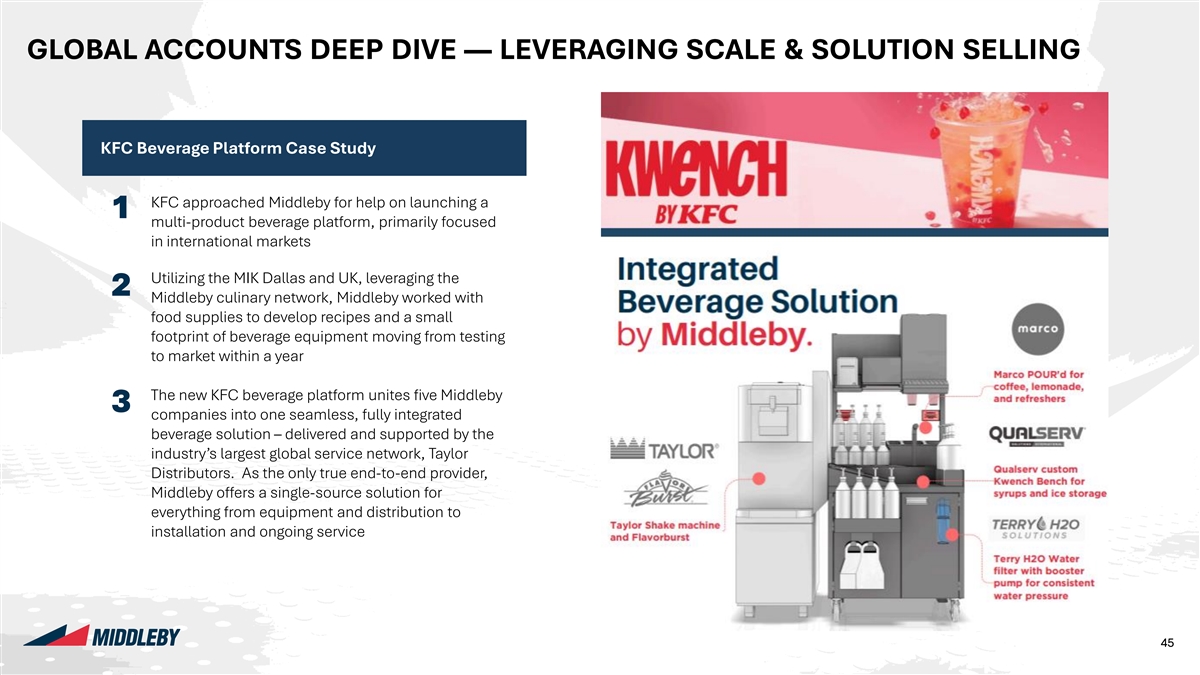
Company Logos Colours 255:255:255 Background GLOBAL ACCOUNTS DEEP DIVE — LEVERAGING SCALE & SOLUTION SELLING 0:0:0 Text Colour 23:60:93 Page Heading 23:60:93 Subheading Styles Charts – Charts – KFC Beverage Platform Case Study Primary Secondary Colours Colours Rounded Y 0:47:80 205:219:224 Corners KFC approached Middleby for help on launching a 1 0:110:182 161:188:196 multi-product beverage platform, primarily focused Shadows N in international markets 226:45:63 129:179:224 228:222:212 244:242:238 Gradients N Utilizing the MIK Dallas and UK, leveraging the 2 139:178:221 217:217:217 Middleby culinary network, Middleby worked with food supplies to develop recipes and a small 191:191:191 229:229:229 footprint of beverage equipment moving from testing to market within a year Headings on page Hierarchy of Highlights Lines Y The new KFC beverage platform unites five Middleby Message Box (RGB and weight) 3 companies into one seamless, fully integrated Boxes N Highlighted Boxes beverage solution – delivered and supported by the on the Page industry’s largest global service network, Taylor Lines Highlight Table Distributors. As the only true end-to-end provider, Rows / Maps Tables - Headings RGB 0,0,0 | Wgt: 1pt Middleby offers a single-source solution for Row Heading Cells Tables - Rows everything from equipment and distribution to in Tables RGB 185,185,185 | Wgt: 0.5pt installation and ongoing service Charts - Axes RGB 127,127,127 | Wgt: 0.75pt Charts - Lines Between Series: None Link to template Pages Setup 45 45 Width: 33.867 cm Add doctop here Height: 19.05 cm
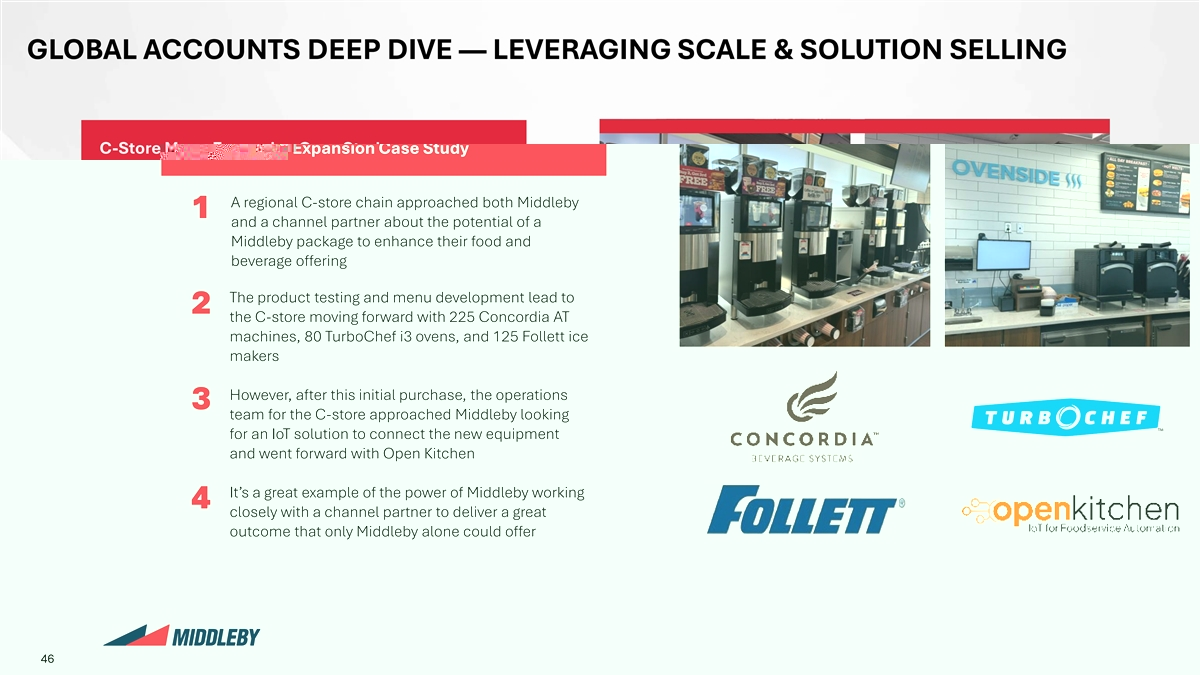
Company Logos Colours 255:255:255 Background GLOBAL ACCOUNTS DEEP DIVE — LEVERAGING SCALE & SOLUTION SELLING 0:0:0 Text Colour 23:60:93 Page Heading 23:60:93 Subheading Styles Charts – Charts – C-Store Menu Expansion Case Study Primary Secondary Colours Colours Rounded Y 0:47:80 205:219:224 Corners A regional C-store chain approached both Middleby 1 0:110:182 161:188:196 and a channel partner about the potential of a Shadows N Middleby package to enhance their food and 226:45:63 129:179:224 beverage offering 228:222:212 244:242:238 Gradients N 139:178:221 217:217:217 The product testing and menu development lead to 2 the C-store moving forward with 225 Concordia AT 191:191:191 229:229:229 machines, 80 TurboChef i3 ovens, and 125 Follett ice makers Headings on page Hierarchy of Highlights Lines Y However, after this initial purchase, the operations Message Box (RGB and weight) 3 team for the C-store approached Middleby looking N Boxes Highlighted Boxes for an IoT solution to connect the new equipment on the Page and went forward with Open Kitchen Lines Highlight Table Rows / Maps Tables - Headings RGB 0,0,0 | Wgt: 1pt It’s a great example of the power of Middleby working Row Heading 4 Tables - Rows closely with a channel partner to deliver a great Cells in Tables RGB 185,185,185 | Wgt: 0.5pt outcome that only Middleby alone could offer Charts - Axes RGB 127,127,127 | Wgt: 0.75pt Charts - Lines Between Series: None Link to template Pages Setup 46 Width: 33.867 cm Add doctop here Height: 19.05 cm
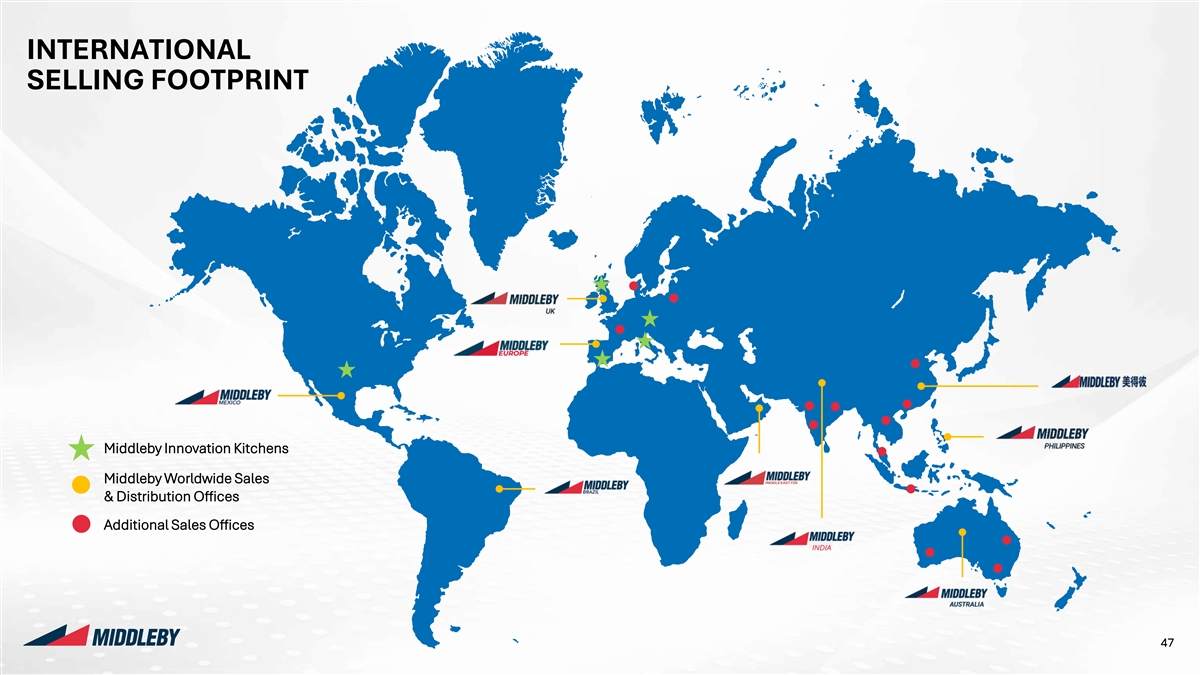
Company Logos Colours 255:255:255 Background INTERNATIONAL 0:0:0 Text Colour SELLING FOOTPRINT 23:60:93 Page Heading 23:60:93 Subheading Styles Charts – Charts – Primary Secondary Colours Colours Rounded Y 0:47:80 205:219:224 Corners 0:110:182 161:188:196 Shadows N 226:45:63 129:179:224 228:222:212 244:242:238 Gradients N 139:178:221 217:217:217 191:191:191 229:229:229 Headings on page Hierarchy of Highlights Lines Y Message Box (RGB and weight) N Boxes Highlighted Boxes on the Page Middleby Innovation Kitchens Lines Highlight Table Rows / Maps Middleby Worldwide Sales Tables - Headings RGB 0,0,0 | Wgt: 1pt & Distribution Offices Row Heading Tables - Rows Cells in Tables RGB 185,185,185 | Wgt: 0.5pt Additional Sales Offices INDIA Charts - Axes RGB 127,127,127 | Wgt: 0.75pt Charts - Lines Between Series: None Link to template Pages Setup 47 Width: 33.867 cm Add doctop here Height: 19.05 cm
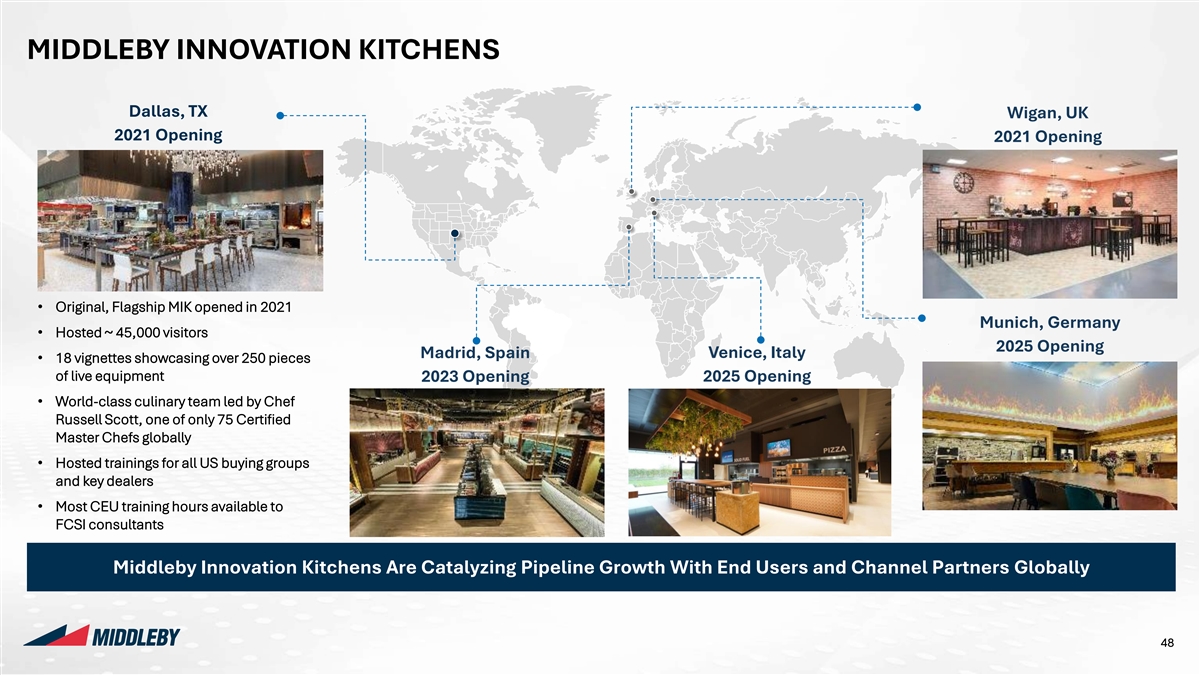
Company Logos Colours 255:255:255 Background MIDDLEBY INNOVATION KITCHENS 0:0:0 Text Colour 23:60:93 Page Heading Dallas, TX Wigan, UK 23:60:93 Subheading 2021 Opening 2021 Opening Styles Charts – Charts – Primary Secondary Colours Colours Rounded Y 0:47:80 205:219:224 Corners 0:110:182 161:188:196 Shadows N 226:45:63 129:179:224 228:222:212 244:242:238 Gradients N 139:178:221 217:217:217 • Original, Flagship MIK opened in 2021 191:191:191 229:229:229 Munich, Germany • Hosted ~ 45,000 visitors 2025 Opening Madrid, Spain Venice, Italy • 18 vignettes showcasing over 250 pieces Headings on page Hierarchy of Highlights of live equipment 2025 Opening 2023 Opening Lines Y Message Box (RGB and weight) • World-class culinary team led by Chef Russell Scott, one of only 75 Certified N Boxes Highlighted Boxes Master Chefs globally on the Page Lines • Hosted trainings for all US buying groups Highlight Table Rows / Maps Tables - Headings and key dealers RGB 0,0,0 | Wgt: 1pt Row Heading • Most CEU training hours available to Tables - Rows Cells in Tables RGB 185,185,185 | Wgt: 0.5pt FCSI consultants Charts - Axes RGB 127,127,127 | Wgt: 0.75pt Middleby Innovation Kitchens Are Catalyzing Pipeline Growth With End Users and Channel Partners Globally Charts - Lines Between Series: None Link to template Pages Setup 48 Width: 33.867 cm Add doctop here Height: 19.05 cm
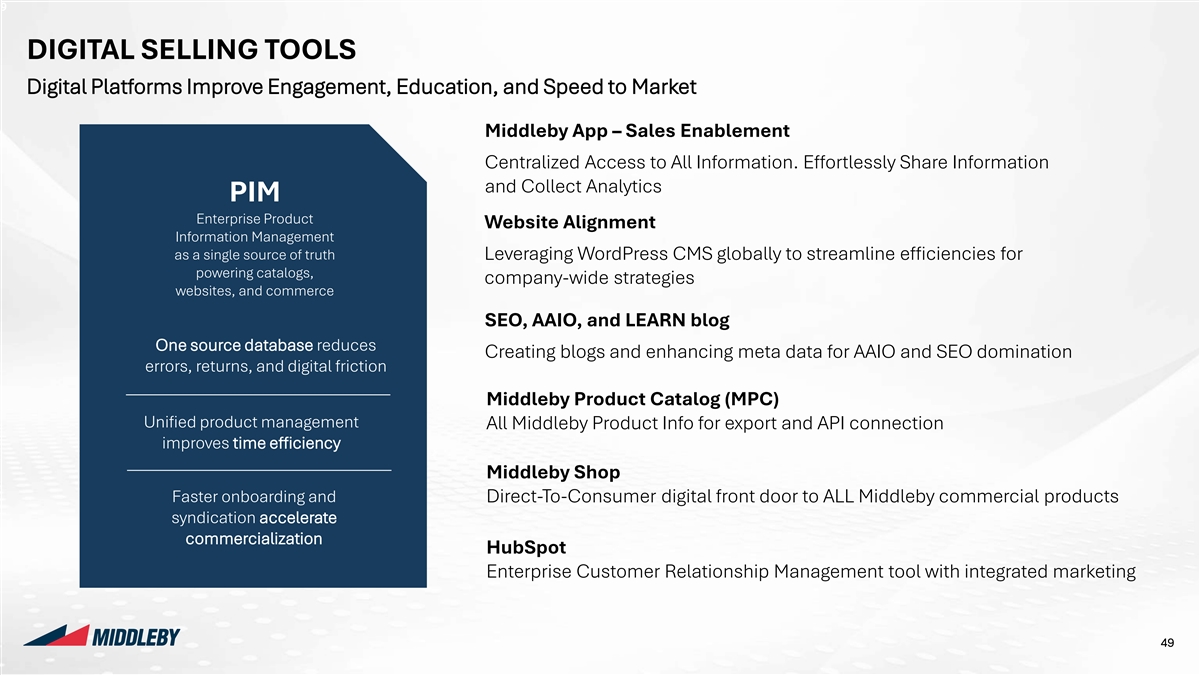
49 Company Logos Colours 255:255:255 Background DIGITAL SELLING TOOLS 0:0:0 Text Colour Digital Platforms Improve Engagement, Education, and Speed to Market 23:60:93 Page Heading 23:60:93 Subheading Middleby App – Sales Enablement Styles Charts – Charts – Primary Secondary Centralized Access to All Information. Effortlessly Share Information Colours Colours Rounded and Collect Analytics Y 0:47:80 205:219:224 PIM Corners 0:110:182 161:188:196 Enterprise Product Website Alignment Shadows N Information Management 226:45:63 129:179:224 as a single source of truth Leveraging WordPress CMS globally to streamline efficiencies for 228:222:212 244:242:238 powering catalogs, Gradients N company-wide strategies websites, and commerce 139:178:221 217:217:217 SEO, AAIO, and LEARN blog 191:191:191 229:229:229 One source database reduces Creating blogs and enhancing meta data for AAIO and SEO domination Headings on page Hierarchy of Highlights errors, returns, and digital friction Lines Y Message Box (RGB and weight) Middleby Product Catalog (MPC) N Unified product management Boxes All Middleby Product Info for export and API connection Highlighted Boxes on the Page improves time efficiency Lines Highlight Table Middleby Shop Rows / Maps Tables - Headings RGB 0,0,0 | Wgt: 1pt Faster onboarding and Direct-To-Consumer digital front door to ALL Middleby commercial products Row Heading Tables - Rows Cells in Tables syndication accelerate RGB 185,185,185 | Wgt: 0.5pt commercialization Charts - Axes HubSpot RGB 127,127,127 | Wgt: 0.75pt Enterprise Customer Relationship Management tool with integrated marketing Charts - Lines Between Series: None Link to template Pages Setup 49 Width: 33.867 cm Add doctop here Height: 19.05 cm
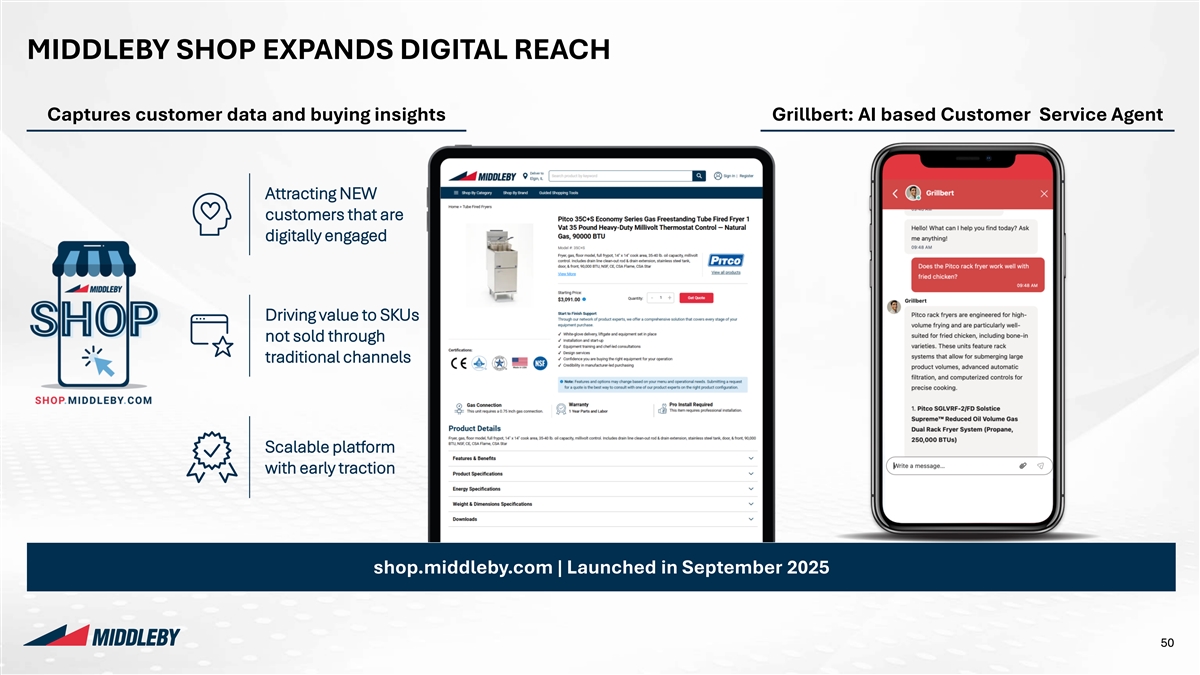
Company Logos Colours 255:255:255 Background MIDDLEBY SHOP EXPANDS DIGITAL REACH 0:0:0 Text Colour 23:60:93 Page Heading Captures customer data and buying insights Grillbert: AI based Customer Service Agent 23:60:93 Subheading Styles Charts – Charts – Primary Secondary Colours Colours Rounded Y 0:47:80 205:219:224 Attracting NEW Corners 0:110:182 161:188:196 customers that are Shadows N digitally engaged 226:45:63 129:179:224 228:222:212 244:242:238 Gradients N 139:178:221 217:217:217 Driving value to SKUs 191:191:191 229:229:229 not sold through traditional channels Headings on page Hierarchy of Highlights Lines Y Message Box (RGB and weight) N Boxes Highlighted Boxes on the Page Scalable platform Lines Highlight Table with early traction Rows / Maps Tables - Headings RGB 0,0,0 | Wgt: 1pt Row Heading Tables - Rows Cells in Tables RGB 185,185,185 | Wgt: 0.5pt Charts - Axes RGB 127,127,127 | Wgt: 0.75pt shop.middleby.com | Launched in September 2025 Charts - Lines Between Series: None Link to template Pages Setup 50 Width: 33.867 cm Add doctop here Height: 19.05 cm
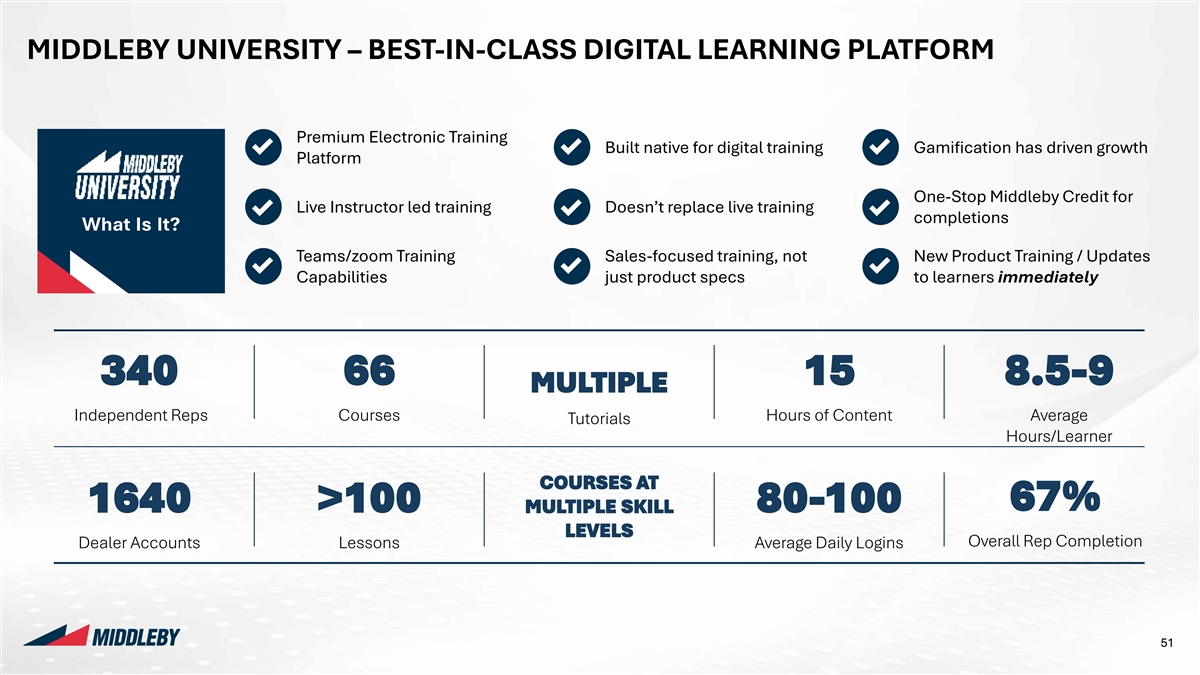
Company Logos Colours 255:255:255 Background MIDDLEBY UNIVERSITY – BEST-IN-CLASS DIGITAL LEARNING PLATFORM 0:0:0 Text Colour 23:60:93 Page Heading 23:60:93 Subheading Premium Electronic Training Styles Charts – Charts – Built native for digital training Gamification has driven growth Primary Secondary Platform Colours Colours Rounded Y 0:47:80 205:219:224 Corners One-Stop Middleby Credit for Live Instructor led training Doesn’t replace live training 0:110:182 161:188:196 completions What Is It? Shadows N 226:45:63 129:179:224 Teams/zoom Training Sales-focused training, not New Product Training / Updates 228:222:212 244:242:238 Gradients N Capabilities just product specs to learners immediately 139:178:221 217:217:217 191:191:191 229:229:229 Headings on page Hierarchy of Highlights 340 66 15 8.5-9 MULTIPLE Lines Y Message Box (RGB and weight) Independent Reps Courses Hours of Content Average Tutorials N Boxes Highlighted Boxes Hours/Learner on the Page Lines Highlight Table Rows / Maps Tables - Headings COURSES AT RGB 0,0,0 | Wgt: 1pt Row Heading 67% 1640 >100 80-100 Tables - Rows MULTIPLE SKILL Cells in Tables RGB 185,185,185 | Wgt: 0.5pt LEVELS Overall Rep Completion Dealer Accounts Lessons Average Daily Logins Charts - Axes RGB 127,127,127 | Wgt: 0.75pt Charts - Lines Between Series: None Link to template Pages Setup 51 Width: 33.867 cm Add doctop here Height: 19.05 cm
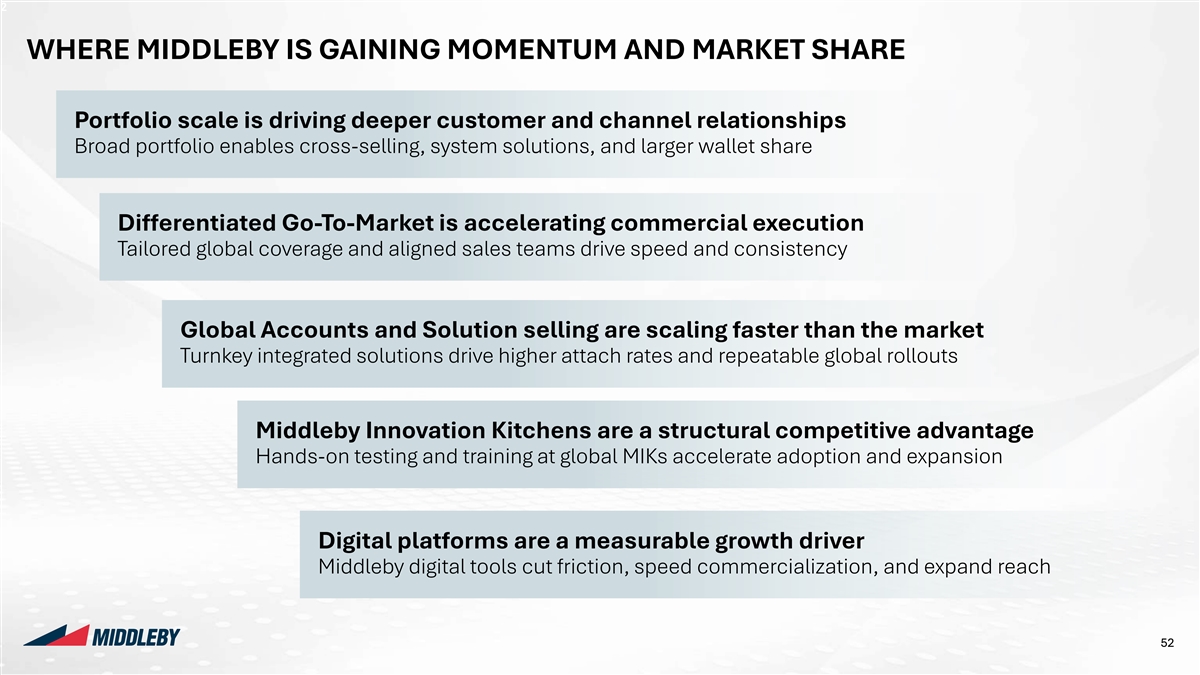
52 Company Logos Colours 255:255:255 Background WHERE MIDDLEBY IS GAINING MOMENTUM AND MARKET SHARE 0:0:0 Text Colour 23:60:93 Page Heading Portfolio scale is driving deeper customer and channel relationships 23:60:93 Subheading Styles Charts – Charts – Broad portfolio enables cross-selling, system solutions, and larger wallet share Primary Secondary Colours Colours Rounded Y 0:47:80 205:219:224 Corners 0:110:182 161:188:196 Differentiated Go-To-Market is accelerating commercial execution Shadows N 226:45:63 129:179:224 Tailored global coverage and aligned sales teams drive speed and consistency 228:222:212 244:242:238 Gradients N 139:178:221 217:217:217 191:191:191 229:229:229 Global Accounts and Solution selling are scaling faster than the market Turnkey integrated solutions drive higher attach rates and repeatable global rollouts Headings on page Hierarchy of Highlights Lines Y Message Box (RGB and weight) N Boxes Highlighted Boxes Middleby Innovation Kitchens are a structural competitive advantage on the Page Lines Hands-on testing and training at global MIKs accelerate adoption and expansion Highlight Table Rows / Maps Tables - Headings RGB 0,0,0 | Wgt: 1pt Row Heading Tables - Rows Cells in Tables RGB 185,185,185 | Wgt: 0.5pt Digital platforms are a measurable growth driver Charts - Axes RGB 127,127,127 | Wgt: 0.75pt Middleby digital tools cut friction, speed commercialization, and expand reach Charts - Lines Between Series: None Link to template Pages Setup 52 Width: 33.867 cm Add doctop here Height: 19.05 cm
Company Logos Colours 255:255:255 Background 0:0:0 Text Colour 23:60:93 Page Heading 23:60:93 Subheading Styles Charts – Charts – Primary Secondary Colours Colours Rounded Y 0:47:80 205:219:224 Corners 0:110:182 161:188:196 Shadows N 226:45:63 129:179:224 228:222:212 244:242:238 Gradients N 139:178:221 217:217:217 191:191:191 229:229:229 TECHNOLOGY Headings on page Hierarchy of Highlights Lines Y Message Box (RGB and weight) 05 N Boxes Highlighted Boxes on the Page Lines Highlight Table Rows / Maps Tables - Headings RGB 0,0,0 | Wgt: 1pt Row Heading Tables - Rows Cells in Tables RGB 185,185,185 | Wgt: 0.5pt Charts - Axes RGB 127,127,127 | Wgt: 0.75pt Charts - Lines Between Series: None Link to template Pages Setup 53 Width: 33.867 cm Add doctop here Height: 19.05 cm
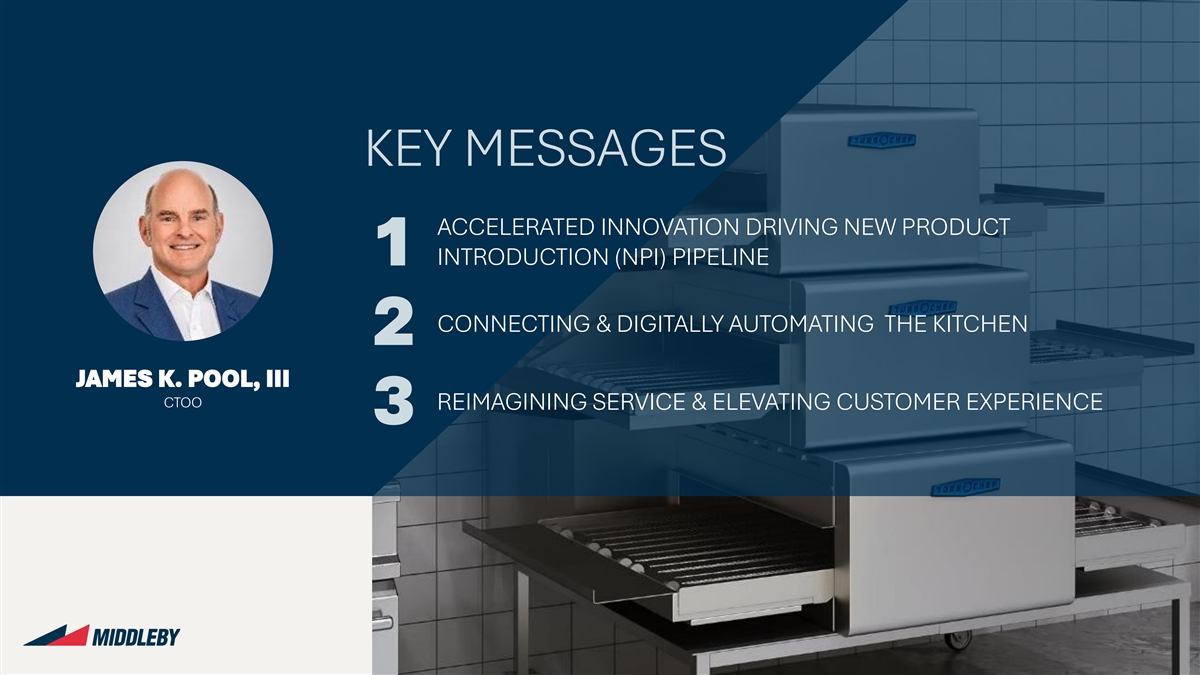
Company Logos Colours 255:255:255 Background 0:0:0 Text Colour 23:60:93 Page Heading 23:60:93 Subheading Styles Charts – Charts – Primary Secondary KEY MESSAGES Colours Colours Rounded Y 0:47:80 205:219:224 Corners 0:110:182 161:188:196 ACCELERATED INNOVATION DRIVING NEW PRODUCT Shadows N 226:45:63 129:179:224 INTRODUCTION (NPI) PIPELINE 1 228:222:212 244:242:238 Gradients N 139:178:221 217:217:217 191:191:191 229:229:229 CONNECTING & DIGITALLY AUTOMATING THE KITCHEN 2 Headings on page Hierarchy of Highlights JAMES K. POOL, III Lines Y Message Box (RGB and weight) CTOO REIMAGINING SERVICE & ELEVATING CUSTOMER EXPERIENCE 3 N Boxes Highlighted Boxes on the Page Lines Highlight Table Rows / Maps Tables - Headings RGB 0,0,0 | Wgt: 1pt Row Heading Tables - Rows Cells in Tables RGB 185,185,185 | Wgt: 0.5pt Charts - Axes RGB 127,127,127 | Wgt: 0.75pt Charts - Lines Between Series: None Link to template Pages Setup 54 Width: 33.867 cm Add doctop here Height: 19.05 cm
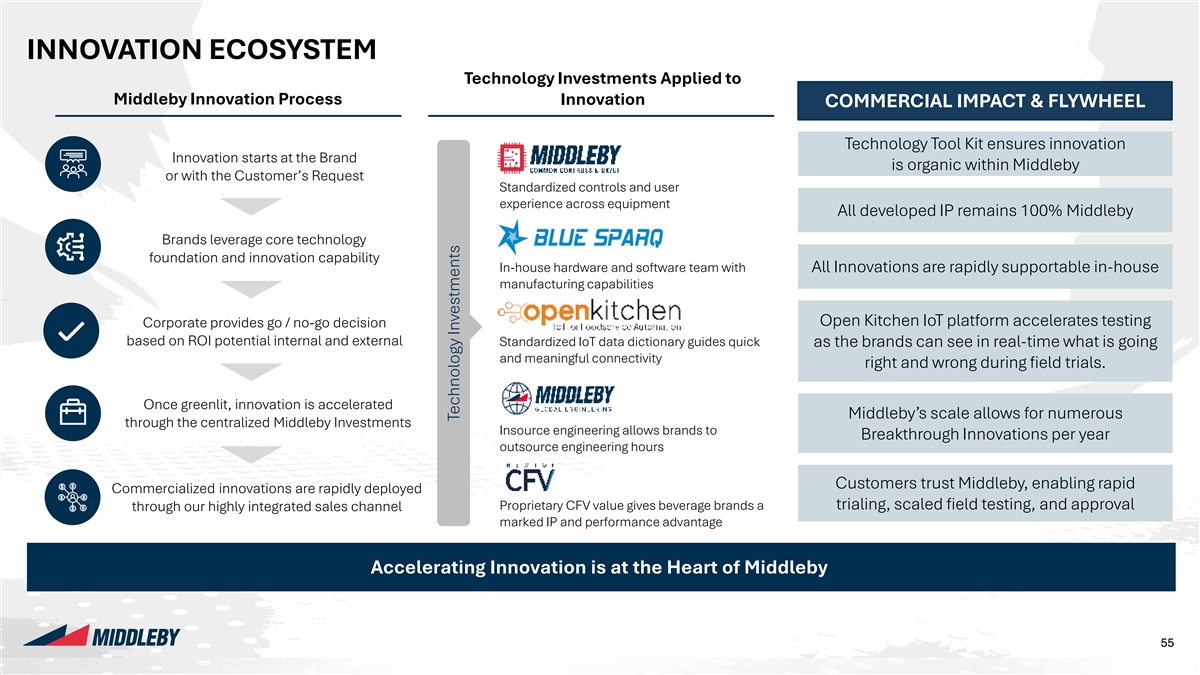
Company Logos Colours 255:255:255 Background INNOVATION ECOSYSTEM 0:0:0 Text Colour Technology Investments Applied to 23:60:93 Page Heading Middleby Innovation Process Innovation COMMERCIAL IMPACT & FLYWHEEL 23:60:93 Subheading Technology Tool Kit ensures innovation Styles Charts – Charts – Primary Secondary Innovation starts at the Brand is organic within Middleby Colours Colours or with the Customer’s Request Rounded Standardized controls and user Y 0:47:80 205:219:224 Corners experience across equipment All developed IP remains 100% Middleby 0:110:182 161:188:196 Shadows N Brands leverage core technology 226:45:63 129:179:224 foundation and innovation capability In-house hardware and software team with All Innovations are rapidly supportable in-house 228:222:212 244:242:238 Gradients N manufacturing capabilities 139:178:221 217:217:217 Open Kitchen IoT platform accelerates testing 191:191:191 229:229:229 Corporate provides go / no-go decision based on ROI potential internal and external Standardized IoT data dictionary guides quick as the brands can see in real-time what is going and meaningful connectivity Headings on page right and wrong during field trials. Hierarchy of Highlights Lines Y Message Box (RGB and weight) Once greenlit, innovation is accelerated Middleby’s scale allows for numerous N through the centralized Middleby Investments Boxes Highlighted Boxes Insource engineering allows brands to Breakthrough Innovations per year on the Page outsource engineering hours Lines Highlight Table Rows / Maps Tables - Headings Customers trust Middleby, enabling rapid Commercialized innovations are rapidly deployed RGB 0,0,0 | Wgt: 1pt Row Heading Proprietary CFV value gives beverage brands a trialing, scaled field testing, and approval through our highly integrated sales channel Tables - Rows Cells in Tables RGB 185,185,185 | Wgt: 0.5pt marked IP and performance advantage Charts - Axes RGB 127,127,127 | Wgt: 0.75pt Accelerating Innovation is at the Heart of Middleby Charts - Lines Between Series: Does this below on this slide? None Link to template Pages Setup 55 55 Width: 33.867 cm Add doctop here Height: 19.05 cm Technology Investments
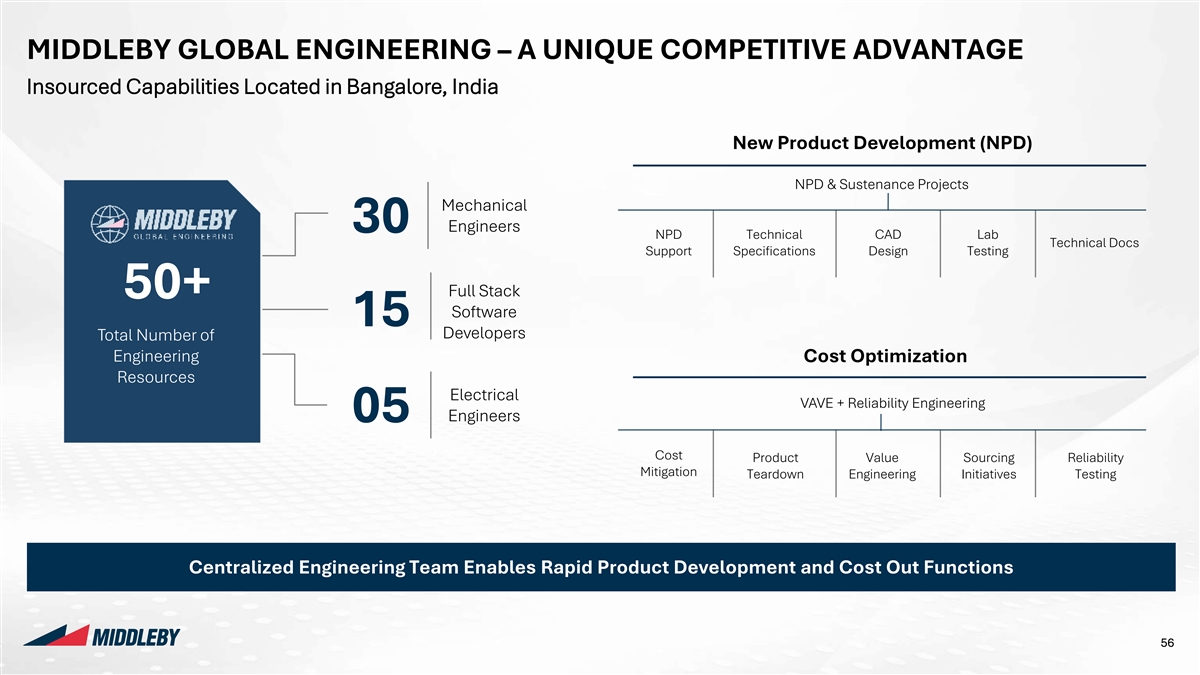
Company Logos Colours 255:255:255 Background MIDDLEBY GLOBAL ENGINEERING – A UNIQUE COMPETITIVE ADVANTAGE 0:0:0 Text Colour Insourced Capabilities Located in Bangalore, India 23:60:93 Page Heading 23:60:93 Subheading New Product Development (NPD) Styles Charts – Charts – Primary Secondary Colours Colours NPD & Sustenance Projects Rounded Y 0:47:80 205:219:224 Corners Mechanical 0:110:182 161:188:196 30 Engineers Shadows N NPD Technical CAD Lab 226:45:63 129:179:224 Technical Docs Support Specifications Design Testing 228:222:212 244:242:238 Gradients N Full Stack 50+ 139:178:221 217:217:217 Software 15 191:191:191 229:229:229 Developers Total Number of Engineering Cost Optimization Headings on page Hierarchy of Highlights Resources Lines Y Electrical Message Box (RGB and weight) VAVE + Reliability Engineering Engineers 05 N Boxes Highlighted Boxes on the Page Cost Lines Product Value Sourcing Reliability Highlight Table Mitigation Teardown Engineering Initiatives Testing Rows / Maps Tables - Headings RGB 0,0,0 | Wgt: 1pt Row Heading Tables - Rows Cells in Tables RGB 185,185,185 | Wgt: 0.5pt Charts - Axes RGB 127,127,127 | Wgt: 0.75pt Centralized Engineering Team Enables Rapid Product Development and Cost Out Functions Charts - Lines Between Series: Does this below on this slide? None Link to template Pages Setup 56 Width: 33.867 cm Add doctop here Height: 19.05 cm
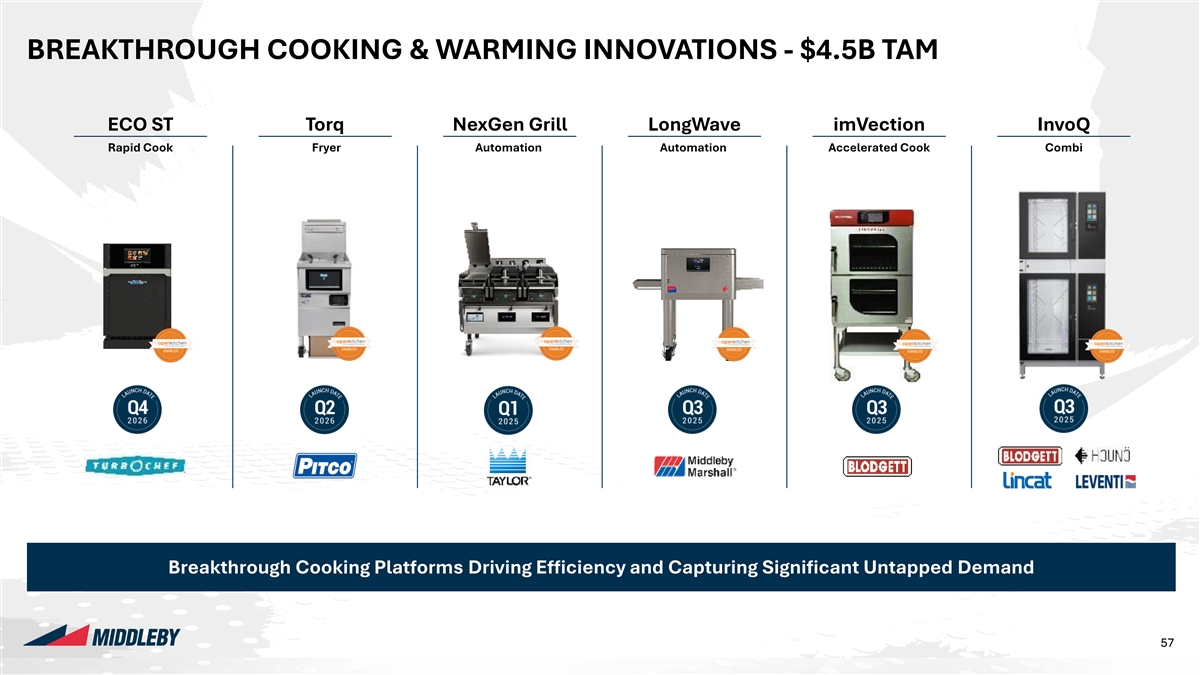
Company Logos Colours 255:255:255 Background BREAKTHROUGH COOKING & WARMING INNOVATIONS - $4.5B TAM 0:0:0 Text Colour 23:60:93 Page Heading 23:60:93 Subheading ECO ST Torq NexGen Grill LongWave imVection InvoQ Styles Rapid Cook Fryer Automation Automation Accelerated Cook Combi Charts – Charts – Primary Secondary Colours Colours Rounded Y 0:47:80 205:219:224 Corners 0:110:182 161:188:196 Shadows N 226:45:63 129:179:224 228:222:212 244:242:238 Gradients N 139:178:221 217:217:217 191:191:191 229:229:229 Headings on page Hierarchy of Highlights Lines Y Message Box (RGB and weight) N Boxes Highlighted Boxes on the Page Lines Highlight Table Rows / Maps Tables - Headings RGB 0,0,0 | Wgt: 1pt Row Heading Tables - Rows Cells in Tables RGB 185,185,185 | Wgt: 0.5pt Does this below on this slide? Charts - Axes RGB 127,127,127 | Wgt: 0.75pt Breakthrough Cooking Platforms Driving Efficiency and Capturing Significant Untapped Demand Charts - Lines Between Series: None Link to template Pages Setup 57 57 Width: 33.867 cm Add doctop here Height: 19.05 cm
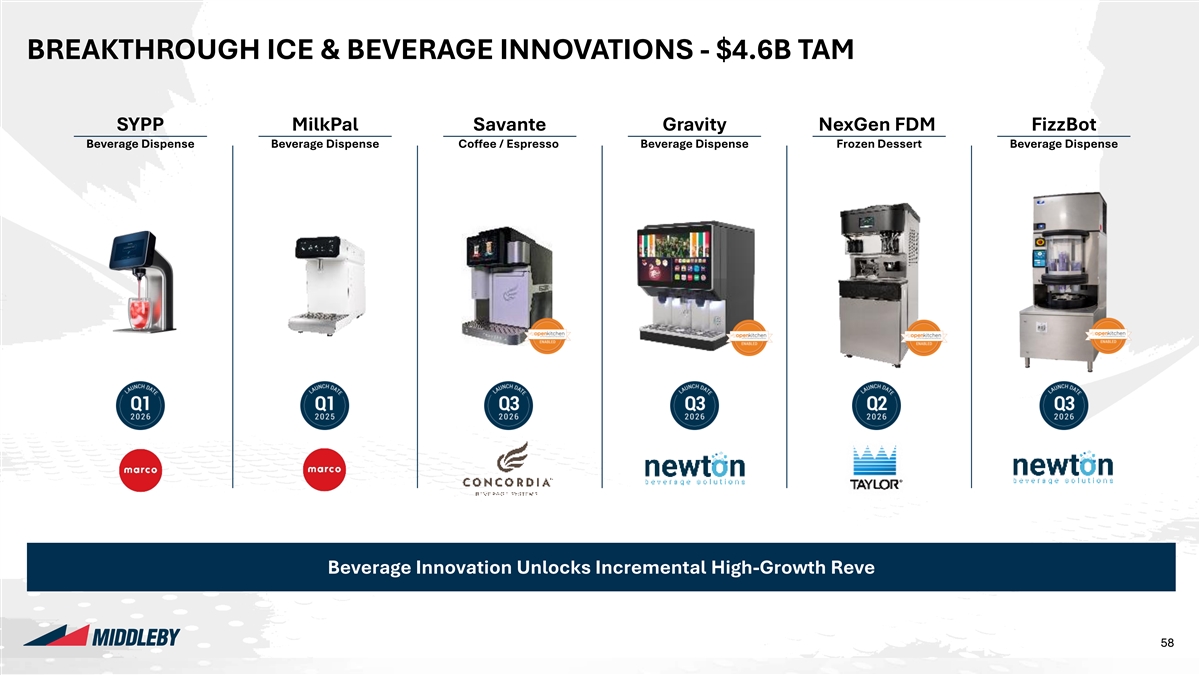
Company Logos Colours 255:255:255 Background BREAKTHROUGH ICE & BEVERAGE INNOVATIONS - $4.6B TAM 0:0:0 Text Colour 23:60:93 Page Heading 23:60:93 Subheading SYPP MilkPal Savante Gravity NexGen FDM FizzBot Beverage Dispense Beverage Dispense Coffee / Espresso Beverage Dispense Frozen Dessert Beverage Dispense Styles Charts – Charts – Primary Secondary Colours Colours Rounded Y 0:47:80 205:219:224 Corners 0:110:182 161:188:196 Shadows N 226:45:63 129:179:224 228:222:212 244:242:238 Gradients N 139:178:221 217:217:217 191:191:191 229:229:229 Headings on page Hierarchy of Highlights Lines Y Message Box (RGB and weight) N Boxes Highlighted Boxes on the Page Lines Highlight Table Rows / Maps Tables - Headings RGB 0,0,0 | Wgt: 1pt Row Heading Tables - Rows Cells in Tables RGB 185,185,185 | Wgt: 0.5pt Does this below on this slide? Charts - Axes RGB 127,127,127 | Wgt: 0.75pt Beverage Innovation Unlocks Incremental High-Growth Reve Charts - Lines Between Series: None Link to template Pages Setup 58 58 Width: 33.867 cm Add doctop here Height: 19.05 cm
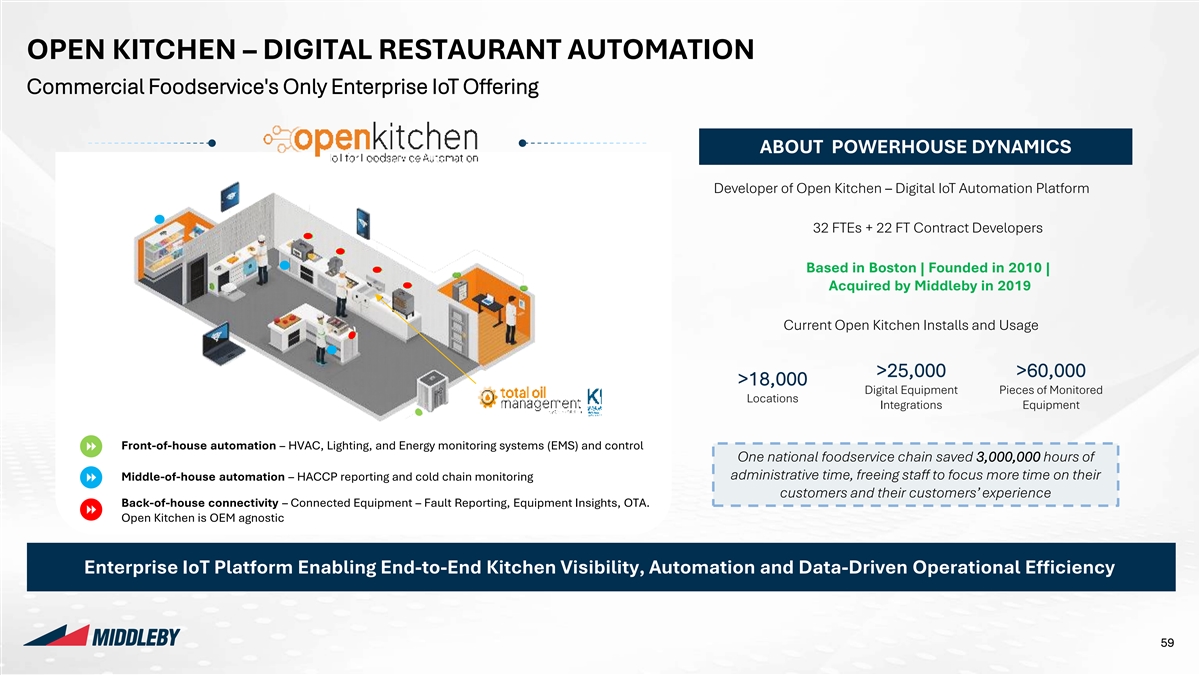
Company Logos Colours 255:255:255 Background OPEN KITCHEN – DIGITAL RESTAURANT AUTOMATION 0:0:0 Text Colour Commercial Foodservice's Only Enterprise IoT Offering 23:60:93 Page Heading 23:60:93 Subheading Styles Charts – Charts – ABOUT POWERHOUSE DYNAMICS Primary Secondary Colours Colours Rounded Y 0:47:80 205:219:224 Developer of Open Kitchen – Digital IoT Automation Platform Corners 0:110:182 161:188:196 32 FTEs + 22 FT Contract Developers Shadows N 226:45:63 129:179:224 Based in Boston | Founded in 2010 | 228:222:212 244:242:238 Gradients N Acquired by Middleby in 2019 139:178:221 217:217:217 191:191:191 229:229:229 Current Open Kitchen Installs and Usage Headings on page Hierarchy of Highlights >25,000 >60,000 >18,000 Lines Digital Equipment Pieces of Monitored Y Locations Message Box (RGB and weight) Integrations Equipment N Boxes Highlighted Boxes on the Page Front-of-house automation – HVAC, Lighting, and Energy monitoring systems (EMS) and control Lines One national foodservice chain saved 3,000,000 hours of Highlight Table administrative time, freeing staff to focus more time on their Middle-of-house automation – HACCP reporting and cold chain monitoring Rows / Maps Tables - Headings RGB 0,0,0 | Wgt: 1pt customers and their customers’ experience Row Heading Back-of-house connectivity – Connected Equipment – Fault Reporting, Equipment Insights, OTA. Tables - Rows Cells in Tables Open Kitchen is OEM agnostic RGB 185,185,185 | Wgt: 0.5pt Charts - Axes RGB 127,127,127 | Wgt: 0.75pt Enterprise IoT Platform Enabling End-to-End Kitchen Visibility, Automation and Data-Driven Operational Efficiency Charts - Lines Between Series: Does this below on this slide? None Link to template Pages Setup 59 Width: 33.867 cm Add doctop here Height: 19.05 cm
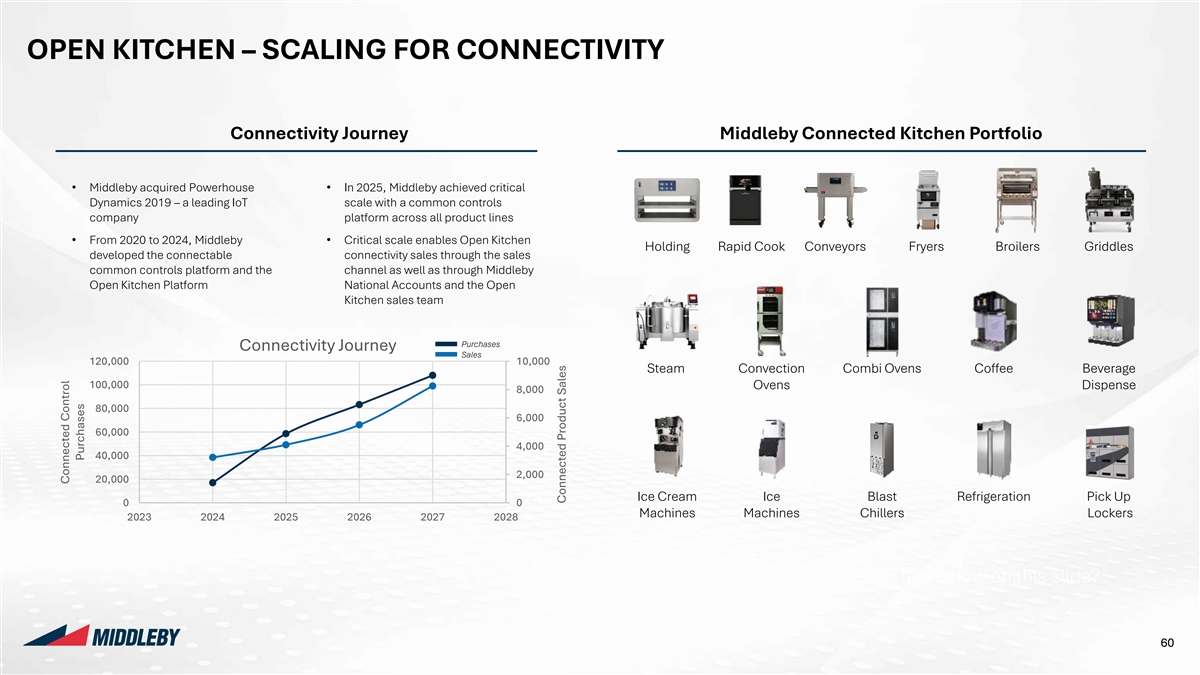
Company Logos Colours 255:255:255 Background OPEN KITCHEN – SCALING FOR CONNECTIVITY 0:0:0 Text Colour 23:60:93 Page Heading 23:60:93 Subheading Connectivity Journey Middleby Connected Kitchen Portfolio Styles Charts – Charts – Primary Secondary Colours Colours Rounded • Middleby acquired Powerhouse • In 2025, Middleby achieved critical Y 0:47:80 205:219:224 Corners Dynamics 2019 – a leading IoT scale with a common controls 0:110:182 161:188:196 company platform across all product lines Shadows N • From 2020 to 2024, Middleby • Critical scale enables Open Kitchen 226:45:63 129:179:224 Holding Rapid Cook Conveyors Fryers Broilers Griddles developed the connectable connectivity sales through the sales 228:222:212 244:242:238 common controls platform and the channel as well as through Middleby Gradients N Open Kitchen Platform National Accounts and the Open 139:178:221 217:217:217 Kitchen sales team 191:191:191 229:229:229 Purchases Connectivity Journey Sales 120,000 10,000 Headings on page Hierarchy of Highlights Steam Convection Combi Ovens Coffee Beverage 100,000 Ovens Dispense Lines 8,000 Y Message Box (RGB and weight) 80,000 6,000 N Boxes Highlighted Boxes 60,000 on the Page 4,000 40,000 Lines Highlight Table 2,000 Rows / Maps 20,000 Tables - Headings RGB 0,0,0 | Wgt: 1pt Ice Cream Ice Blast Refrigeration Pick Up 0 0 Row Heading Tables - Rows Machines Machines Chillers Lockers Cells in Tables 2023 2024 2025 2026 2027 2028 RGB 185,185,185 | Wgt: 0.5pt Charts - Axes RGB 127,127,127 | Wgt: 0.75pt Charts - Lines Between Series: Does this below on this slide? None Link to template Pages Setup 60 Width: 33.867 cm Add doctop here Height: 19.05 cm Connected Control Purchases Connected Product Sales
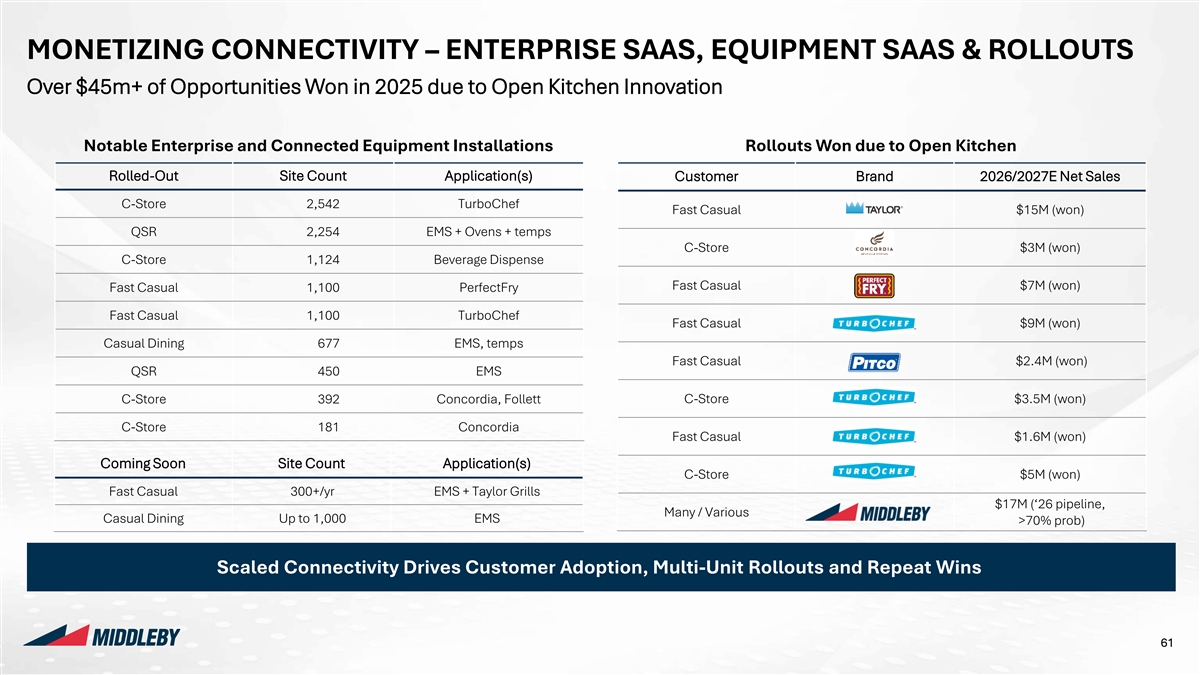
Company Logos Colours 255:255:255 Background MONETIZING CONNECTIVITY – ENTERPRISE SAAS, EQUIPMENT SAAS & ROLLOUTS 0:0:0 Text Colour Over $45m+ of Opportunities Won in 2025 due to Open Kitchen Innovation 23:60:93 Page Heading 23:60:93 Subheading Styles Notable Enterprise and Connected Equipment Installations Rollouts Won due to Open Kitchen Charts – Charts – Primary Secondary Colours Colours Rolled-Out Site Count Application(s) Customer Brand 2026/2027E Net Sales Rounded Y 0:47:80 205:219:224 Corners C-Store 2,542 TurboChef Fast Casual $15M (won) 0:110:182 161:188:196 Shadows N QSR 2,254 EMS + Ovens + temps 226:45:63 129:179:224 C-Store $3M (won) C-Store 1,124 Beverage Dispense 228:222:212 244:242:238 Gradients N Fast Casual $7M (won) Fast Casual 1,100 PerfectFry 139:178:221 217:217:217 Fast Casual 1,100 TurboChef 191:191:191 229:229:229 Fast Casual $9M (won) Casual Dining 677 EMS, temps Fast Casual $2.4M (won) Headings on page Hierarchy of Highlights QSR 450 EMS Lines Y C-Store 392 Concordia, Follett C-Store $3.5M (won) Message Box (RGB and weight) N Boxes C-Store 181 Concordia Highlighted Boxes Fast Casual $1.6M (won) on the Page Lines Highlight Table Coming Soon Site Count Application(s) C-Store $5M (won) Rows / Maps Tables - Headings RGB 0,0,0 | Wgt: 1pt Fast Casual 300+/yr EMS + Taylor Grills Row Heading $17M (‘26 pipeline, Tables - Rows Many / Various Cells in Tables Casual Dining Up to 1,000 EMS >70% prob) RGB 185,185,185 | Wgt: 0.5pt Charts - Axes RGB 127,127,127 | Wgt: 0.75pt Scaled Connectivity Drives Customer Adoption, Multi-Unit Rollouts and Repeat Wins Charts - Lines Between Series: Does this below on this slide? None Link to template Pages Setup 61 Width: 33.867 cm Add doctop here Height: 19.05 cm
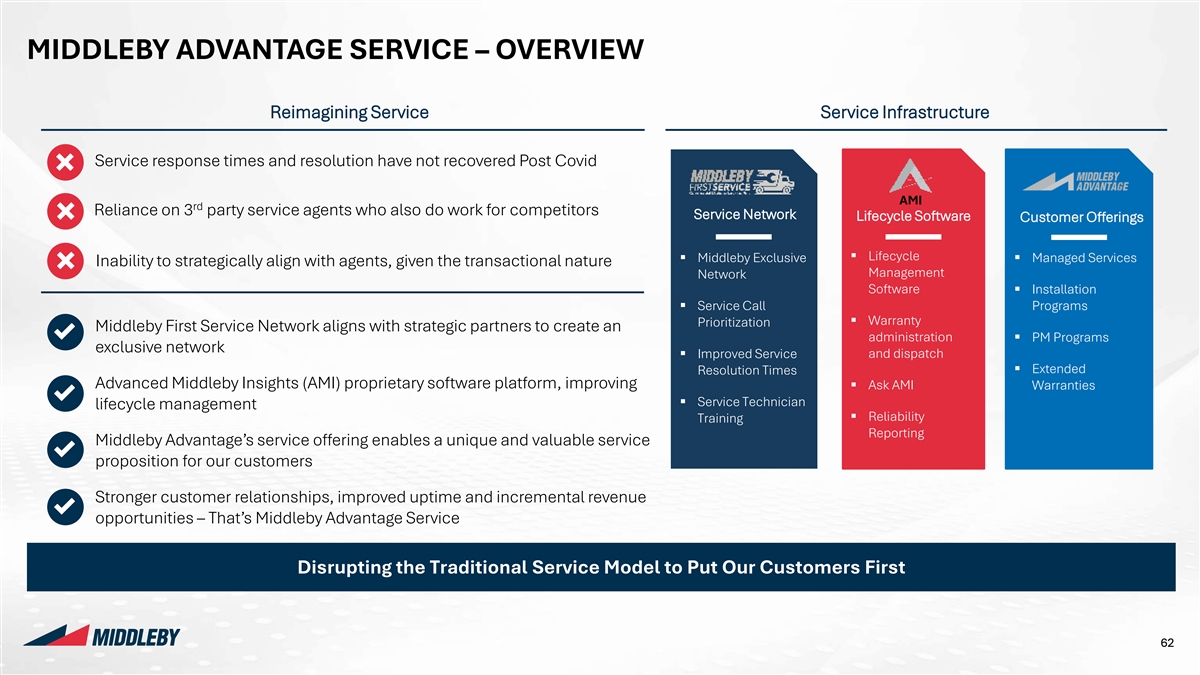
Company Logos Colours 255:255:255 Background MIDDLEBY ADVANTAGE SERVICE – OVERVIEW 0:0:0 Text Colour 23:60:93 Page Heading Reimagining Service Service Infrastructure 23:60:93 Subheading Styles Charts – Charts – Primary Secondary Service response times and resolution have not recovered Post Covid Colours Colours Rounded Y 0:47:80 205:219:224 Corners AMI rd Reliance on 3 party service agents who also do work for competitors Service Network 0:110:182 161:188:196 Lifecycle Software Customer Offerings Shadows N 226:45:63 129:179:224 ▪ Lifecycle ▪ Middleby Exclusive ▪ Managed Services Inability to strategically align with agents, given the transactional nature 228:222:212 244:242:238 Management Gradients N Network Software▪ Installation 139:178:221 217:217:217 ▪ Service Call Programs ▪ Warranty Prioritization 191:191:191 229:229:229 Middleby First Service Network aligns with strategic partners to create an administration ▪ PM Programs exclusive network and dispatch ▪ Improved Service Headings on page Hierarchy of Highlights ▪ Extended Resolution Times Advanced Middleby Insights (AMI) proprietary software platform, improving ▪ Ask AMI Warranties Lines Y Message Box (RGB and weight) ▪ Service Technician lifecycle management ▪ Reliability Training N Boxes Highlighted Boxes Reporting on the Page Middleby Advantage’s service offering enables a unique and valuable service Lines proposition for our customers Highlight Table Rows / Maps Tables - Headings RGB 0,0,0 | Wgt: 1pt Stronger customer relationships, improved uptime and incremental revenue Row Heading Tables - Rows Cells in Tables opportunities – That’s Middleby Advantage Service RGB 185,185,185 | Wgt: 0.5pt Charts - Axes RGB 127,127,127 | Wgt: 0.75pt Disrupting the Traditional Service Model to Put Our Customers First Charts - Lines Between Series: Does this below on this slide? None Link to template Pages Setup 62 Width: 33.867 cm Add doctop here Height: 19.05 cm
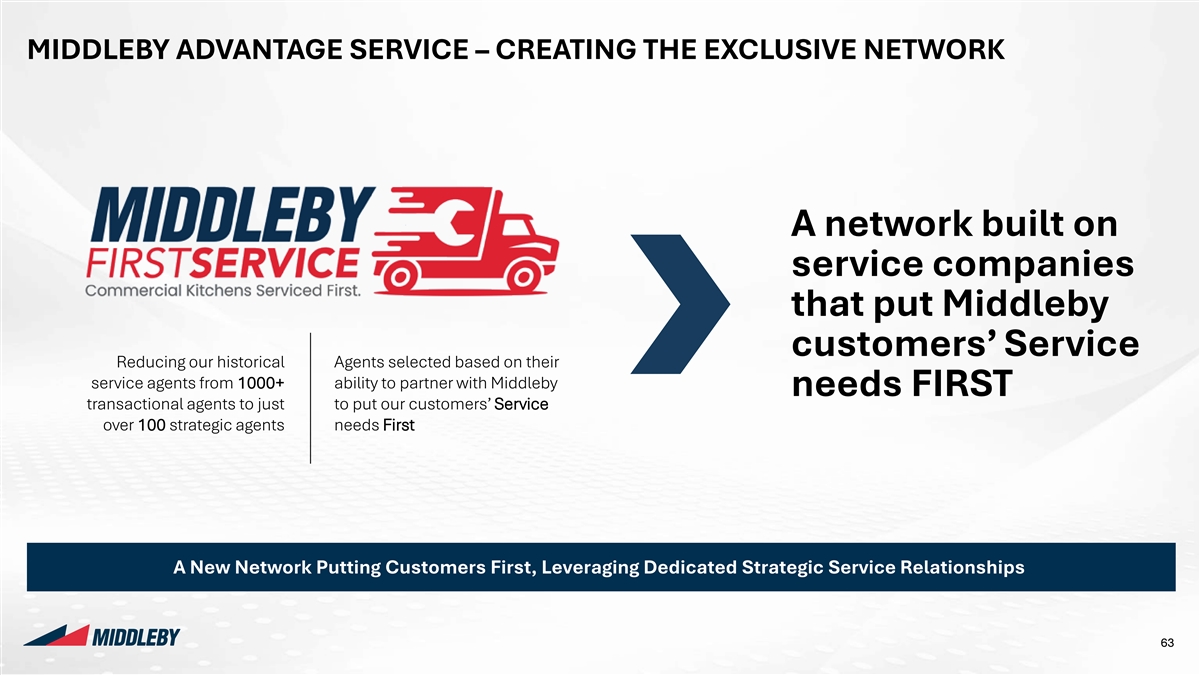
Company Logos Colours 255:255:255 Background MIDDLEBY ADVANTAGE SERVICE – CREATING THE EXCLUSIVE NETWORK 0:0:0 Text Colour 23:60:93 Page Heading 23:60:93 Subheading Styles Charts – Charts – Primary Secondary Colours Colours Rounded Y 0:47:80 205:219:224 Corners 0:110:182 161:188:196 Shadows N A network built on 226:45:63 129:179:224 228:222:212 244:242:238 service companies Gradients N 139:178:221 217:217:217 that put Middleby 191:191:191 229:229:229 customers’ Service Headings on page Reducing our historical Agents selected based on their Hierarchy of Highlights service agents from 1000+ ability to partner with Middleby Lines Y needs FIRST Message Box (RGB and weight) transactional agents to just to put our customers’ Service N Boxes over 100 strategic agents needs First Highlighted Boxes on the Page Lines Highlight Table Rows / Maps Tables - Headings RGB 0,0,0 | Wgt: 1pt Row Heading Tables - Rows Cells in Tables RGB 185,185,185 | Wgt: 0.5pt Charts - Axes RGB 127,127,127 | Wgt: 0.75pt A New Network Putting Customers First, Leveraging Dedicated Strategic Service Relationships Charts - Lines Between Series: Does this below on this slide? None Link to template Pages Setup 63 Width: 33.867 cm Add doctop here Height: 19.05 cm
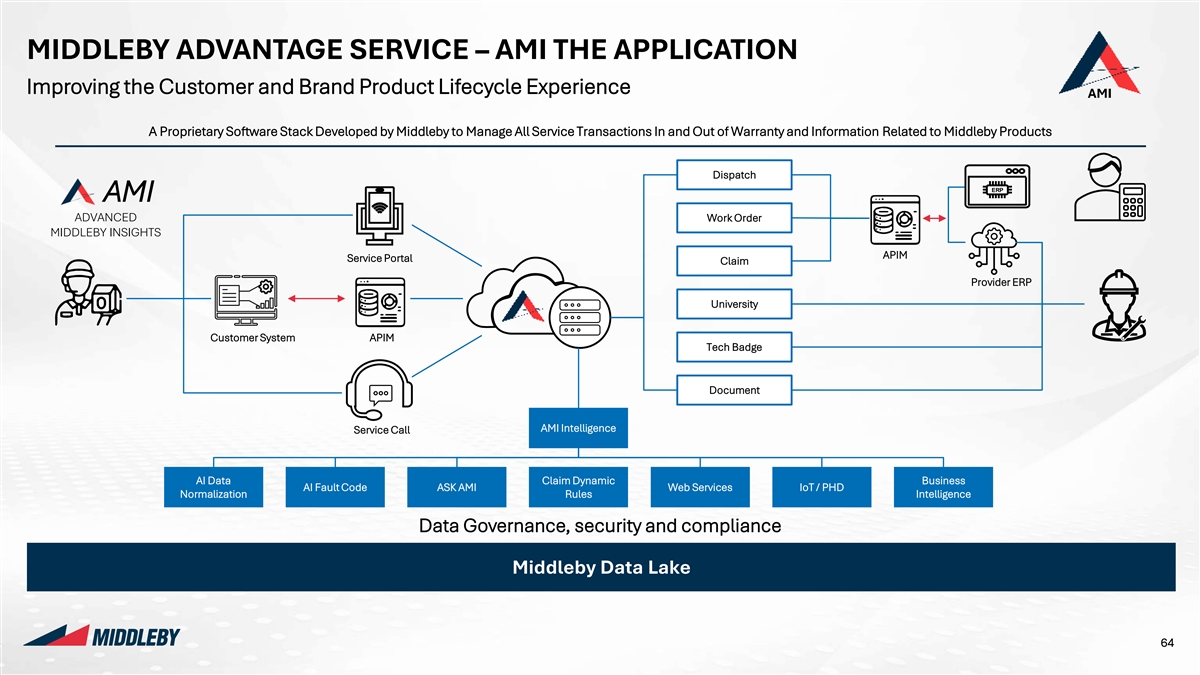
Company Logos Colours 255:255:255 Background MIDDLEBY ADVANTAGE SERVICE – AMI THE APPLICATION 0:0:0 Text Colour Improving the Customer and Brand Product Lifecycle Experience AMI 23:60:93 Page Heading 23:60:93 Subheading A Proprietary Software Stack Developed by Middleby to Manage All Service Transactions In and Out of Warranty and Information Related to Middleby Products Styles Charts – Charts – Primary Secondary Colours Colours Dispatch Rounded Y 0:47:80 205:219:224 AMI Corners 0:110:182 161:188:196 ADVANCED Work Order Shadows N MIDDLEBY INSIGHTS 226:45:63 129:179:224 APIM Service Portal Claim 228:222:212 244:242:238 Gradients N Provider ERP 139:178:221 217:217:217 University 191:191:191 229:229:229 Customer System APIM Tech Badge Headings on page Hierarchy of Highlights Lines Document Y Message Box (RGB and weight) N Boxes Highlighted Boxes AMI Intelligence Service Call on the Page Lines Highlight Table Rows / Maps Tables - Headings AI Data Claim Dynamic Business AI Fault Code ASK AMI Web Services IoT / PHD RGB 0,0,0 | Wgt: 1pt Normalization Rules Intelligence Row Heading Tables - Rows Cells in Tables RGB 185,185,185 | Wgt: 0.5pt Data Governance, security and compliance Charts - Axes RGB 127,127,127 | Wgt: 0.75pt Middleby Data Lake Charts - Lines Between Series: Does this below on this slide? None Link to template Pages Setup 64 Width: 33.867 cm Add doctop here Height: 19.05 cm
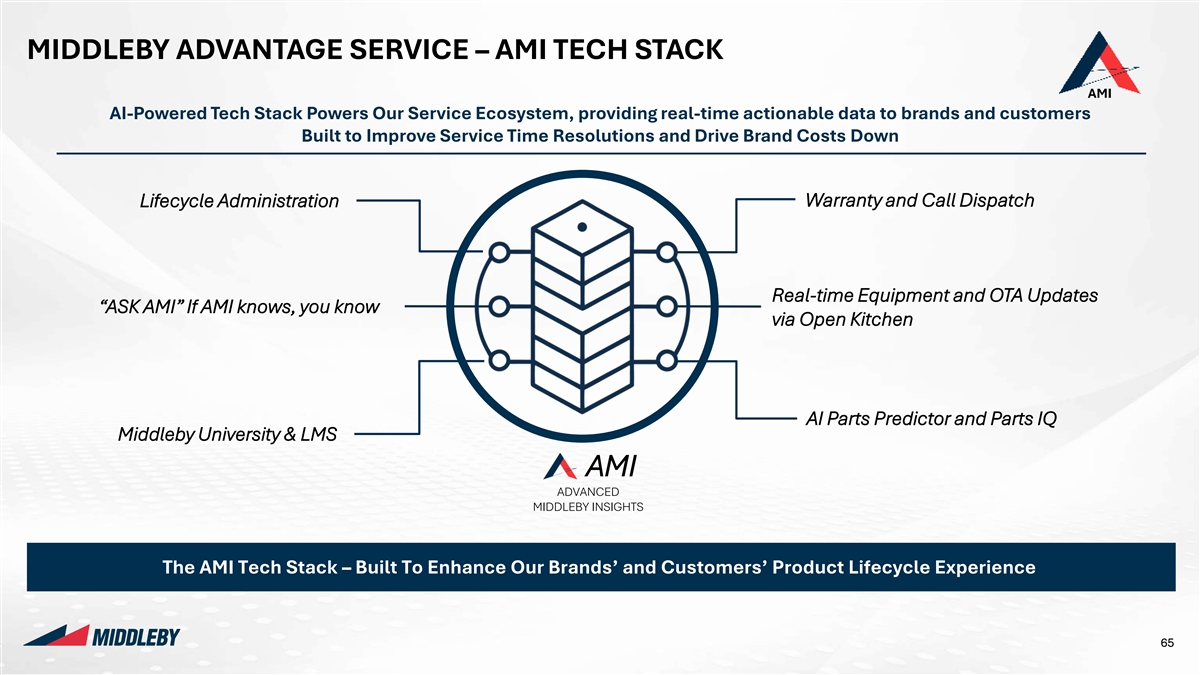
Company Logos Colours 255:255:255 Background MIDDLEBY ADVANTAGE SERVICE – AMI TECH STACK 0:0:0 Text Colour AMI 23:60:93 Page Heading AI-Powered Tech Stack Powers Our Service Ecosystem, providing real-time actionable data to brands and customers 23:60:93 Subheading Built to Improve Service Time Resolutions and Drive Brand Costs Down Styles Charts – Charts – Primary Secondary Colours Colours Rounded Y 0:47:80 205:219:224 Corners Warranty and Call Dispatch Lifecycle Administration 0:110:182 161:188:196 Shadows N 226:45:63 129:179:224 228:222:212 244:242:238 Gradients N 139:178:221 217:217:217 Real-time Equipment and OTA Updates “ASK AMI” If AMI knows, you know via Open Kitchen 191:191:191 229:229:229 Headings on page Hierarchy of Highlights Lines Y Message Box (RGB and weight) AI Parts Predictor and Parts IQ N Boxes Highlighted Boxes Middleby University & LMS on the Page Lines Highlight Table AMI Rows / Maps Tables - Headings RGB 0,0,0 | Wgt: 1pt ADVANCED Row Heading MIDDLEBY INSIGHTS Tables - Rows Cells in Tables RGB 185,185,185 | Wgt: 0.5pt Charts - Axes RGB 127,127,127 | Wgt: 0.75pt The AMI Tech Stack – Built To Enhance Our Brands’ and Customers’ Product Lifecycle Experience Charts - Lines Between Series: Does this below on this slide? None Link to template Pages Setup 65 Width: 33.867 cm Add doctop here Height: 19.05 cm
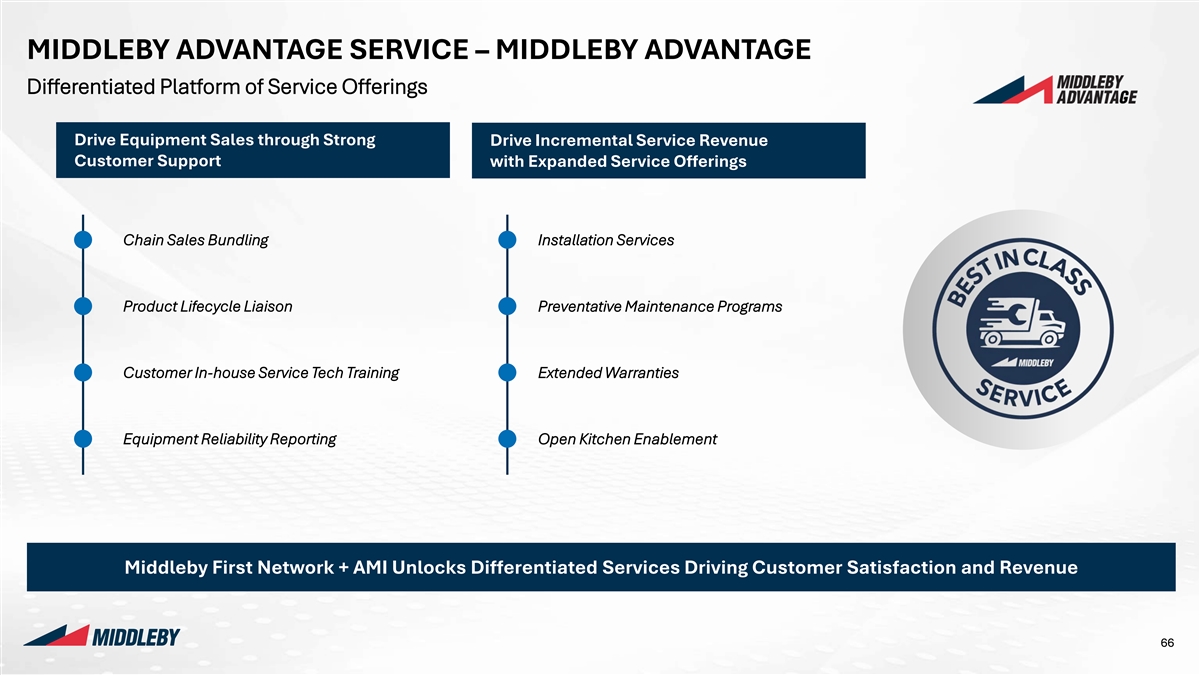
Company Logos Colours 255:255:255 Background MIDDLEBY ADVANTAGE SERVICE – MIDDLEBY ADVANTAGE 0:0:0 Text Colour Differentiated Platform of Service Offerings 23:60:93 Page Heading 23:60:93 Subheading Drive Equipment Sales through Strong Drive Incremental Service Revenue Styles Charts – Charts – Primary Secondary Customer Support with Expanded Service Offerings Colours Colours Rounded Y 0:47:80 205:219:224 Corners 0:110:182 161:188:196 Shadows N Chain Sales Bundling Installation Services 226:45:63 129:179:224 228:222:212 244:242:238 Gradients N 139:178:221 217:217:217 Product Lifecycle Liaison Preventative Maintenance Programs 191:191:191 229:229:229 Headings on page Hierarchy of Highlights Customer In-house Service Tech Training Extended Warranties Lines Y Message Box (RGB and weight) N Boxes Highlighted Boxes Equipment Reliability Reporting Open Kitchen Enablement on the Page Lines Highlight Table Rows / Maps Tables - Headings RGB 0,0,0 | Wgt: 1pt Row Heading Tables - Rows Cells in Tables RGB 185,185,185 | Wgt: 0.5pt Charts - Axes RGB 127,127,127 | Wgt: 0.75pt Middleby First Network + AMI Unlocks Differentiated Services Driving Customer Satisfaction and Revenue Charts - Lines Between Series: Does this below on this slide? None Link to template Pages Setup 66 Width: 33.867 cm Add doctop here Height: 19.05 cm
Company Logos Colours 255:255:255 Background 0:0:0 Text Colour 23:60:93 Page Heading 23:60:93 Subheading Styles Charts – Charts – Primary Secondary Colours Colours Rounded Y 0:47:80 205:219:224 Corners 0:110:182 161:188:196 Shadows N 226:45:63 129:179:224 228:222:212 244:242:238 Gradients N 139:178:221 217:217:217 191:191:191 229:229:229 OPERATIONAL Headings on page Hierarchy of Highlights Lines Y Message Box (RGB and weight) EXCELLENCE N 06 Boxes Highlighted Boxes on the Page Lines Highlight Table Rows / Maps Tables - Headings RGB 0,0,0 | Wgt: 1pt Row Heading Tables - Rows Cells in Tables RGB 185,185,185 | Wgt: 0.5pt Charts - Axes RGB 127,127,127 | Wgt: 0.75pt Charts - Lines Between Series: None Link to template Pages Setup 67 Width: 33.867 cm Add doctop here Height: 19.05 cm
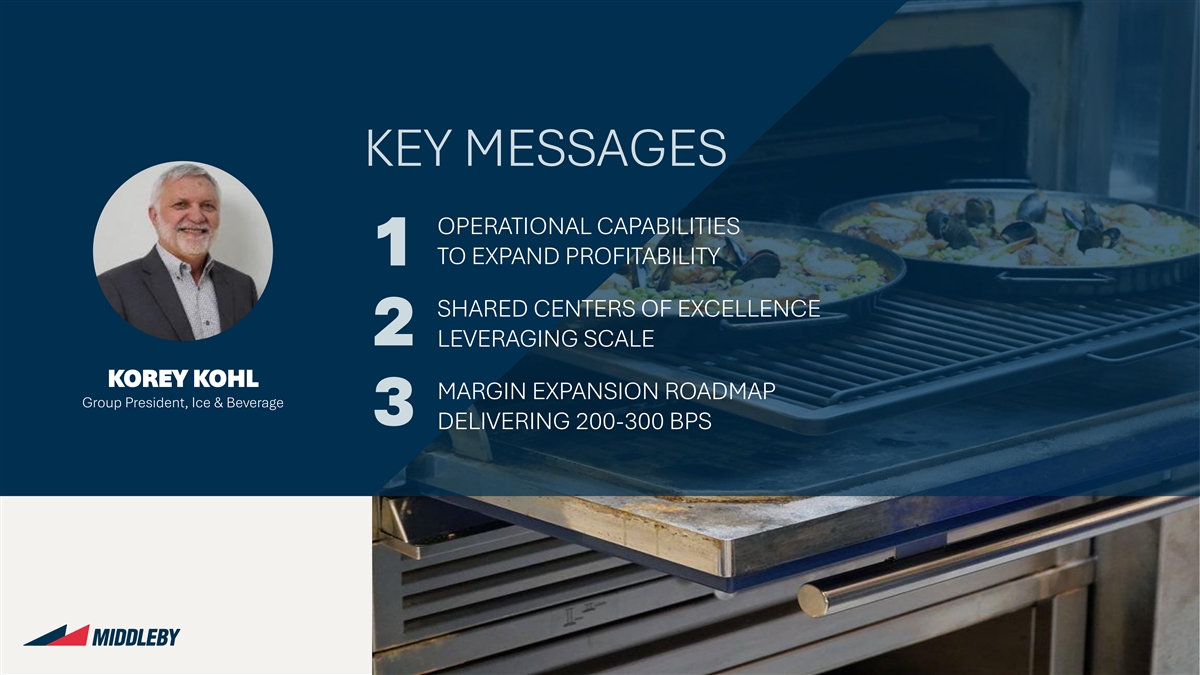
Company Logos Colours 255:255:255 Background 0:0:0 Text Colour 23:60:93 Page Heading 23:60:93 Subheading Styles Charts – Charts – Primary Secondary KEY MESSAGES Colours Colours Rounded Y 0:47:80 205:219:224 Corners 0:110:182 161:188:196 OPERATIONAL CAPABILITIES Shadows N 226:45:63 129:179:224 TO EXPAND PROFITABILITY 1 228:222:212 244:242:238 Gradients N 139:178:221 217:217:217 SHARED CENTERS OF EXCELLENCE 191:191:191 229:229:229 2 LEVERAGING SCALE Headings on page Hierarchy of Highlights KOREY KOHL Lines Y MARGIN EXPANSION ROADMAP Message Box (RGB and weight) Group President, Ice & Beverage 3 N Boxes DELIVERING 200-300 BPS Highlighted Boxes on the Page Lines Highlight Table Rows / Maps Tables - Headings RGB 0,0,0 | Wgt: 1pt Row Heading Tables - Rows Cells in Tables RGB 185,185,185 | Wgt: 0.5pt Charts - Axes RGB 127,127,127 | Wgt: 0.75pt Charts - Lines Between Series: None Link to template Pages Setup 68 Width: 33.867 cm Add doctop here Height: 19.05 cm
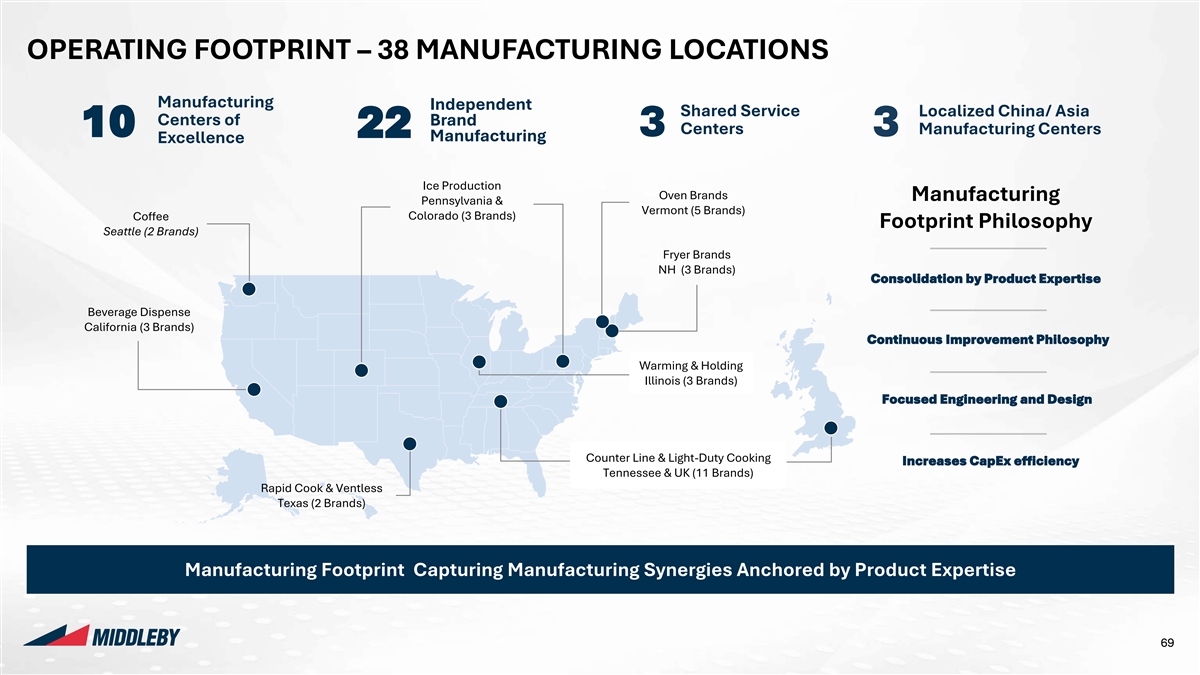
Company Logos Colours 255:255:255 Background OPERATING FOOTPRINT – 38 MANUFACTURING LOCATIONS 0:0:0 Text Colour 23:60:93 Page Heading Manufacturing I Ind ndep epend endent ent Shared Service Localized China/ Asia Centers of B Br ra and nd 23:60:93 Subheading Centers Manufacturing Centers 10 3 3 22 23 Ma Manuf nufa acturi cturing ng Excellence Styles Charts – Charts – Primary Secondary Colours Colours Rounded Ice Production Y 0:47:80 205:219:224 Oven Brands Manufacturing Corners Pennsylvania & Vermont (5 Brands) 0:110:182 161:188:196 Coffee Colorado (3 Brands) Footprint Philosophy Seattle (2 Brands) Shadows N 226:45:63 129:179:224 Fryer Brands 228:222:212 244:242:238 NH (3 Brands) Gradients N Consolidation by Product Expertise 139:178:221 217:217:217 Beverage Dispense 191:191:191 229:229:229 California (3 Brands) Continuous Improvement Philosophy Headings on page Hierarchy of Highlights Warming & Holding Illinois (3 Brands) Lines Y Focused Engineering and Design Message Box (RGB and weight) N Boxes Highlighted Boxes on the Page Lines Counter Line & Light-Duty Cooking Increases CapEx efficiency Highlight Table Tennessee & UK (11 Brands) Rows / Maps Tables - Headings Rapid Cook & Ventless RGB 0,0,0 | Wgt: 1pt Row Heading Texas (2 Brands) Tables - Rows Cells in Tables RGB 185,185,185 | Wgt: 0.5pt Charts - Axes RGB 127,127,127 | Wgt: 0.75pt Manufacturing Footprint Capturing Manufacturing Synergies Anchored by Product Expertise Charts - Lines Between Series: None Link to template Pages Setup 69 Width: 33.867 cm Add doctop here Height: 19.05 cm
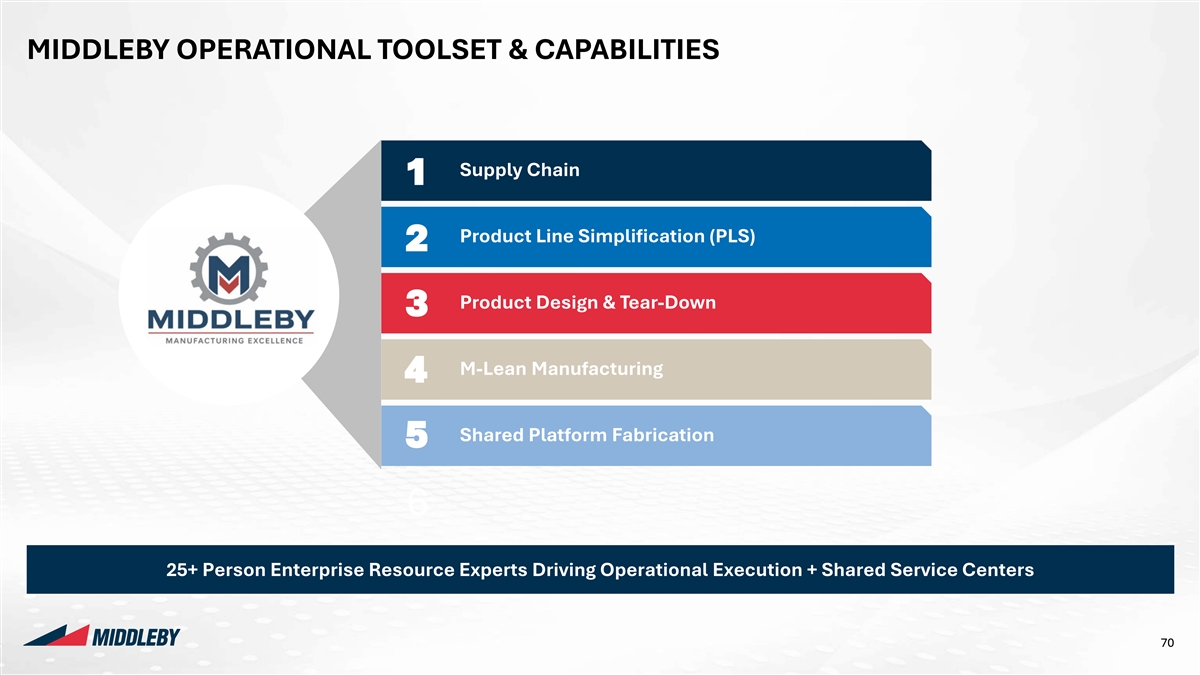
Company Logos Colours 255:255:255 Background MIDDLEBY OPERATIONAL TOOLSET & CAPABILITIES 0:0:0 Text Colour 23:60:93 Page Heading 23:60:93 Subheading Styles Charts – Charts – Primary Secondary Colours Colours Supply Chain 1 Rounded Y 0:47:80 205:219:224 Corners 0:110:182 161:188:196 Shadows N Product Line Simplification (PLS) 226:45:63 129:179:224 2 228:222:212 244:242:238 Gradients N 139:178:221 217:217:217 Product Design & Tear-Down 3 191:191:191 229:229:229 Headings on page Hierarchy of Highlights M-Lean Manufacturing 4 Lines Y Message Box (RGB and weight) N Boxes Highlighted Boxes Shared Platform Fabrication on the Page 5 Lines Highlight Table Rows / Maps Tables - Headings RGB 0,0,0 | Wgt: 1pt Row Heading Tables - Rows 6 Cells in Tables RGB 185,185,185 | Wgt: 0.5pt Charts - Axes RGB 127,127,127 | Wgt: 0.75pt 25+ Person Enterprise Resource Experts Driving Operational Execution + Shared Service Centers Charts - Lines Between Series: None Link to template Pages Setup 70 Width: 33.867 cm Add doctop here Height: 19.05 cm
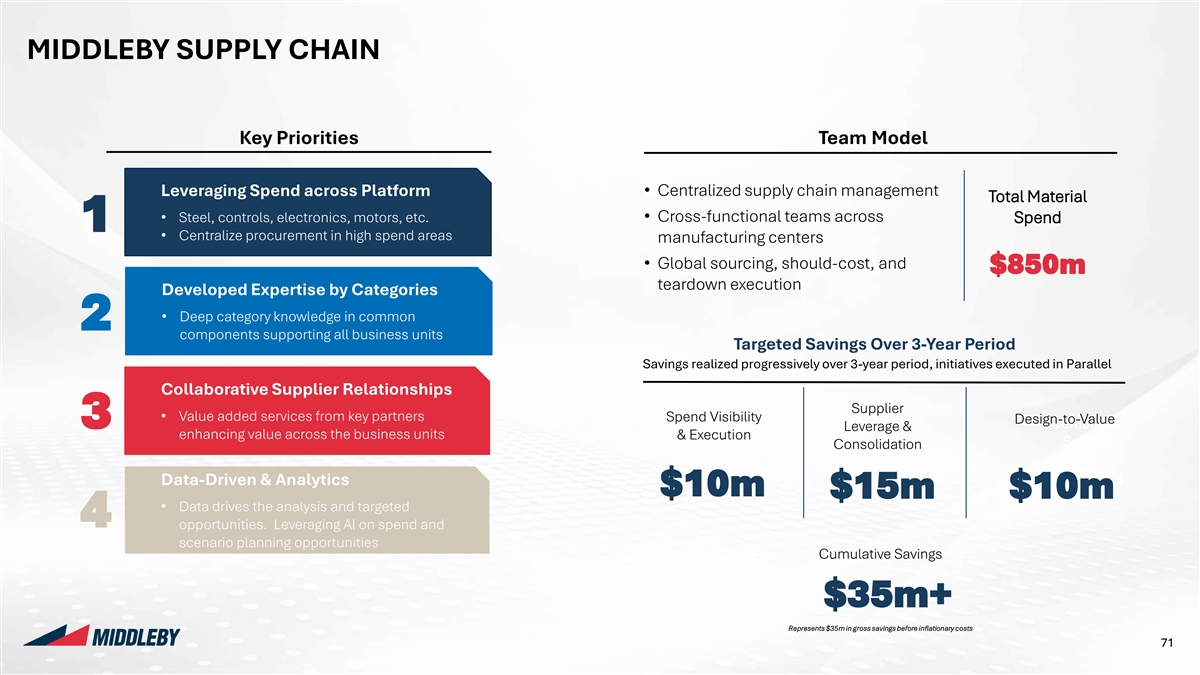
Company Logos Colours 255:255:255 Background MIDDLEBY SUPPLY CHAIN 0:0:0 Text Colour 23:60:93 Page Heading 23:60:93 Subheading Key Priorities Team Model Styles Charts – Charts – Primary Secondary Colours Colours Rounded Y 0:47:80 205:219:224 Leveraging Spend across Platform• Centralized supply chain management Corners Total Material 0:110:182 161:188:196 • Steel, controls, electronics, motors, etc.• Cross-functional teams across Spend 1 Shadows N • Centralize procurement in high spend areas manufacturing centers 226:45:63 129:179:224 • Global sourcing, should-cost, and 228:222:212 244:242:238 $850m Gradients N teardown execution Developed Expertise by Categories 139:178:221 217:217:217 • Deep category knowledge in common 191:191:191 229:229:229 2 components supporting all business units Targeted Savings Over 3-Year Period Headings on page Hierarchy of Highlights Savings realized progressively over 3-year period, initiatives executed in Parallel Lines Collaborative Supplier Relationships Y Message Box (RGB and weight) Supplier • Value added services from key partners Spend Visibility Design-to-Value N Boxes 3 Cumulative Leverage & Highlighted Boxes enhancing value across the business units & Execution on the Page Savings Consolidation Lines Highlight Table Rows / Maps Tables - Headings Data-Driven & Analytics $35m+ RGB 0,0,0 | Wgt: 1pt $10m $15m $10m Row Heading • Data drives the analysis and targeted Tables - Rows Cells in Tables RGB 185,185,185 | Wgt: 0.5pt 4 opportunities. Leveraging AI on spend and scenario planning opportunities Charts - Axes Cumulative Savings RGB 127,127,127 | Wgt: 0.75pt Charts - Lines Between Series: None $35m+ Link to template Pages Setup Represents $35m in gross savings before inflationary costs 71 Width: 33.867 cm Add doctop here Height: 19.05 cm
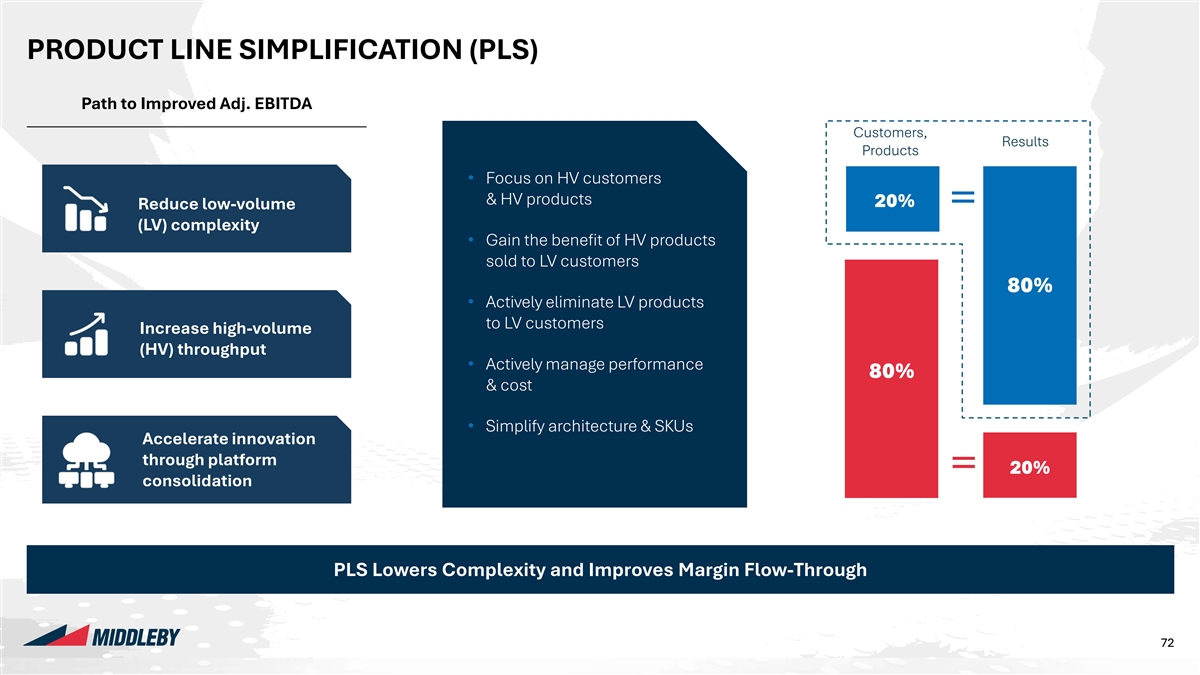
Company Logos Colours 255:255:255 Background PRODUCT LINE SIMPLIFICATION (PLS) 0:0:0 Text Colour 23:60:93 Page Heading Path to Improved Adj. EBITDA 23:60:93 Subheading Customers, Results Styles Charts – Charts – Products Primary Secondary Colours Colours • Focus on HV customers Rounded Y 0:47:80 205:219:224 Corners & HV products 20% Reduce low-volume = 0:110:182 161:188:196 (LV) complexity Shadows N • Gain the benefit of HV products 226:45:63 129:179:224 sold to LV customers 228:222:212 244:242:238 Gradients N 80% 139:178:221 217:217:217 • Actively eliminate LV products 191:191:191 229:229:229 to LV customers Increase high-volume (HV) throughput Headings on page Hierarchy of Highlights • Actively manage performance 80% & cost Lines Y Message Box (RGB and weight) N Boxes • Simplify architecture & SKUs Highlighted Boxes Accelerate innovation on the Page Lines through platform Highlight Table 20% = Rows / Maps Tables - Headings consolidation RGB 0,0,0 | Wgt: 1pt Row Heading Tables - Rows Cells in Tables RGB 185,185,185 | Wgt: 0.5pt Charts - Axes RGB 127,127,127 | Wgt: 0.75pt PLS Lowers Complexity and Improves Margin Flow-Through Charts - Lines Between Series: None Link to template Pages Setup 72 72 Width: 33.867 cm Add doctop here Height: 19.05 cm
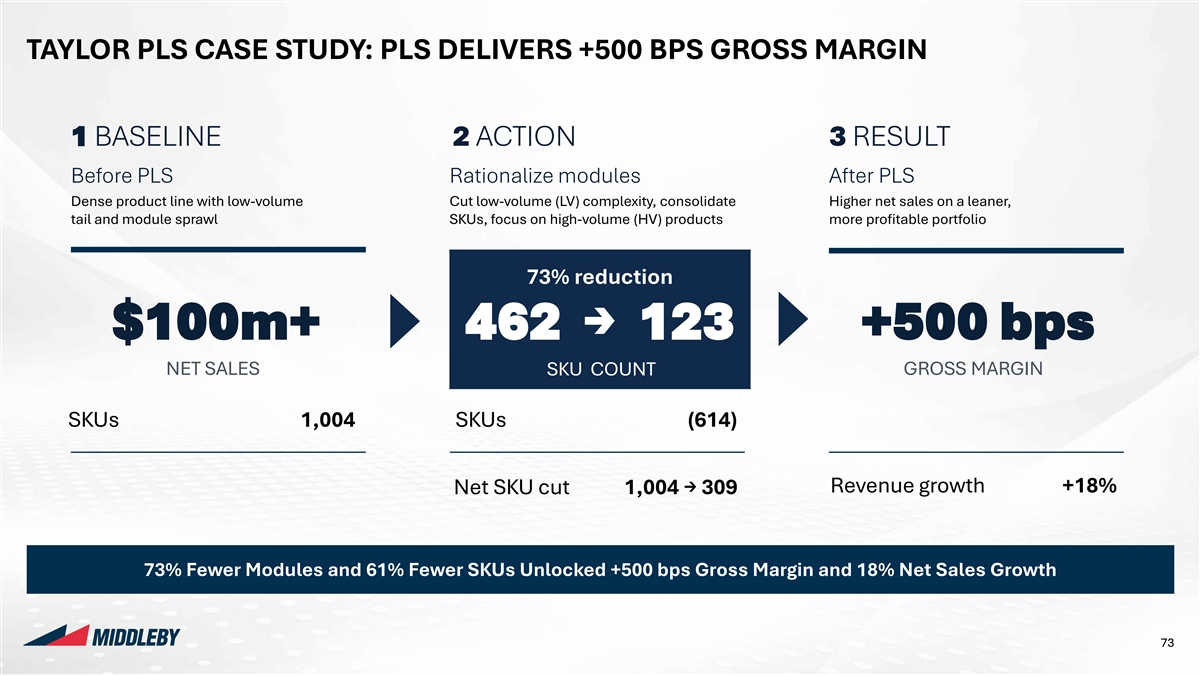
Company Logos Colours 255:255:255 Background TAYLOR PLS CASE STUDY: PLS DELIVERS +500 BPS GROSS MARGIN 0:0:0 Text Colour 23:60:93 Page Heading 23:60:93 Subheading 1 BASELINE 2 ACTION 3 RESULT Styles Charts – Charts – Primary Secondary Colours Colours Before PLS Rationalize modules After PLS Rounded Y 0:47:80 205:219:224 Corners Dense product line with low-volume Cut low-volume (LV) complexity, consolidate Higher net sales on a leaner, 0:110:182 161:188:196 tail and module sprawl SKUs, focus on high-volume (HV) products more profitable portfolio Shadows N 226:45:63 129:179:224 228:222:212 244:242:238 Gradients N 73% reduction 139:178:221 217:217:217 191:191:191 229:229:229 $100m+ 462 → 123 +500 bps Headings on page Hierarchy of Highlights NET SALES GROSS MARGIN SKU COUNT Lines Y Message Box (RGB and weight) N SKUs 1,004 SKUs (614) Boxes Highlighted Boxes on the Page Lines Highlight Table Rows / Maps Tables - Headings Revenue growth +18% Net SKU cut 1,004 → 309 RGB 0,0,0 | Wgt: 1pt Row Heading Tables - Rows Cells in Tables RGB 185,185,185 | Wgt: 0.5pt Charts - Axes RGB 127,127,127 | Wgt: 0.75pt 73% Fewer Modules and 61% Fewer SKUs Unlocked +500 bps Gross Margin and 18% Net Sales Growth Charts - Lines Between Series: None Link to template Pages Setup 73 Width: 33.867 cm Add doctop here Height: 19.05 cm
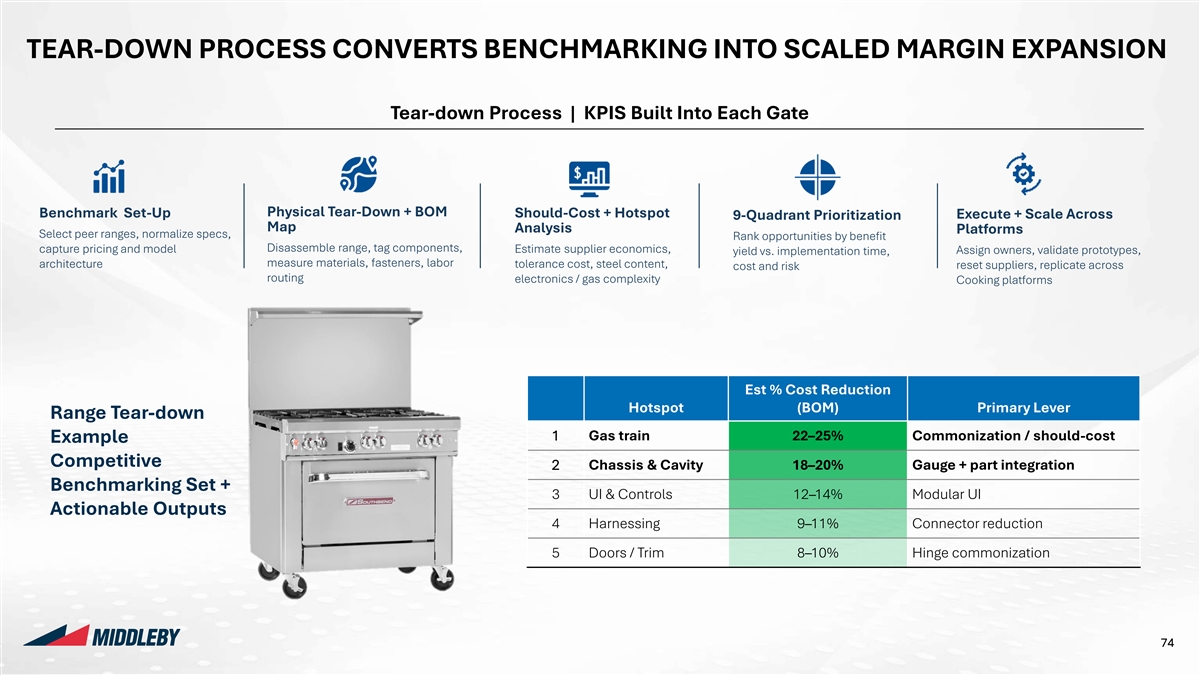
Company Logos Colours 255:255:255 Background TEAR-DOWN PROCESS CONVERTS BENCHMARKING INTO SCALED MARGIN EXPANSION 0:0:0 Text Colour 23:60:93 Page Heading Tear-down Process | KPIS Built Into Each Gate 23:60:93 Subheading Styles Charts – Charts – Primary Secondary Colours Colours Rounded Y 0:47:80 205:219:224 Corners Physical Tear-Down + BOM Benchmark Set-Up Should-Cost + Hotspot Execute + Scale Across 0:110:182 161:188:196 9-Quadrant Prioritization Map Analysis Platforms Shadows N Select peer ranges, normalize specs, Rank opportunities by benefit 226:45:63 129:179:224 Disassemble range, tag components, capture pricing and model Estimate supplier economics, Assign owners, validate prototypes, yield vs. implementation time, measure materials, fasteners, labor architecture tolerance cost, steel content, reset suppliers, replicate across cost and risk 228:222:212 244:242:238 Gradients N routing electronics / gas complexity Cooking platforms 139:178:221 217:217:217 191:191:191 229:229:229 Headings on page Hierarchy of Highlights Lines Est % Cost Reduction Y Message Box (RGB and weight) Hotspot (BOM) Primary Lever Range Tear-down N Boxes Highlighted Boxes 1 Gas train 22–25% Commonization / should-cost Example on the Page Lines Competitive Highlight Table 2 Chassis & Cavity 18–20% Gauge + part integration Rows / Maps Tables - Headings Benchmarking Set + RGB 0,0,0 | Wgt: 1pt 3 UI & Controls 12–14% Modular UI Row Heading Tables - Rows Actionable Outputs Cells in Tables RGB 185,185,185 | Wgt: 0.5pt 4 Harnessing 9–11% Connector reduction Charts - Axes 5 Doors / Trim 8–10% Hinge commonization RGB 127,127,127 | Wgt: 0.75pt Charts - Lines Between Series: None Link to template Pages Setup 74 Width: 33.867 cm Add doctop here Height: 19.05 cm
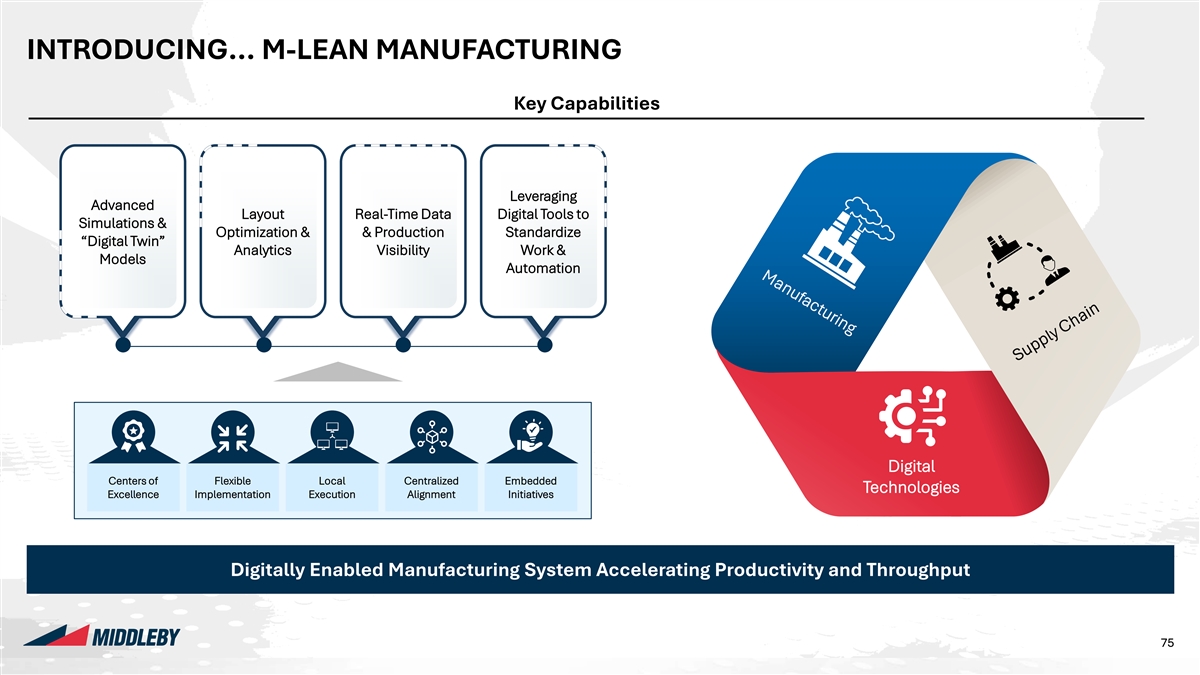
Company Logos Colours 255:255:255 Background INTRODUCING... M-LEAN MANUFACTURING 0:0:0 Text Colour 23:60:93 Page Heading Key Capabilities 23:60:93 Subheading Styles Charts – Charts – Primary Secondary Colours Colours Rounded Y 0:47:80 205:219:224 Leveraging Corners Advanced Layout Real-Time Data Digital Tools to 0:110:182 161:188:196 Simulations & Shadows N Optimization & & Production Standardize “Digital Twin” 226:45:63 129:179:224 Analytics Visibility Work & Models Automation 228:222:212 244:242:238 Gradients N 139:178:221 217:217:217 191:191:191 229:229:229 Headings on page Hierarchy of Highlights Lines Y Message Box (RGB and weight) N Boxes Highlighted Boxes on the Page Lines Highlight Table Digital Rows / Maps Tables - Headings Centers of Flexible Local Centralized Embedded Technologies RGB 0,0,0 | Wgt: 1pt Excellence Implementation Execution Alignment Initiatives Row Heading Tables - Rows Cells in Tables RGB 185,185,185 | Wgt: 0.5pt Charts - Axes RGB 127,127,127 | Wgt: 0.75pt Digitally Enabled Manufacturing System Accelerating Productivity and Throughput Charts - Lines Between Series: None Link to template Pages Setup 75 75 Width: 33.867 cm Add doctop here Height: 19.05 cm 6
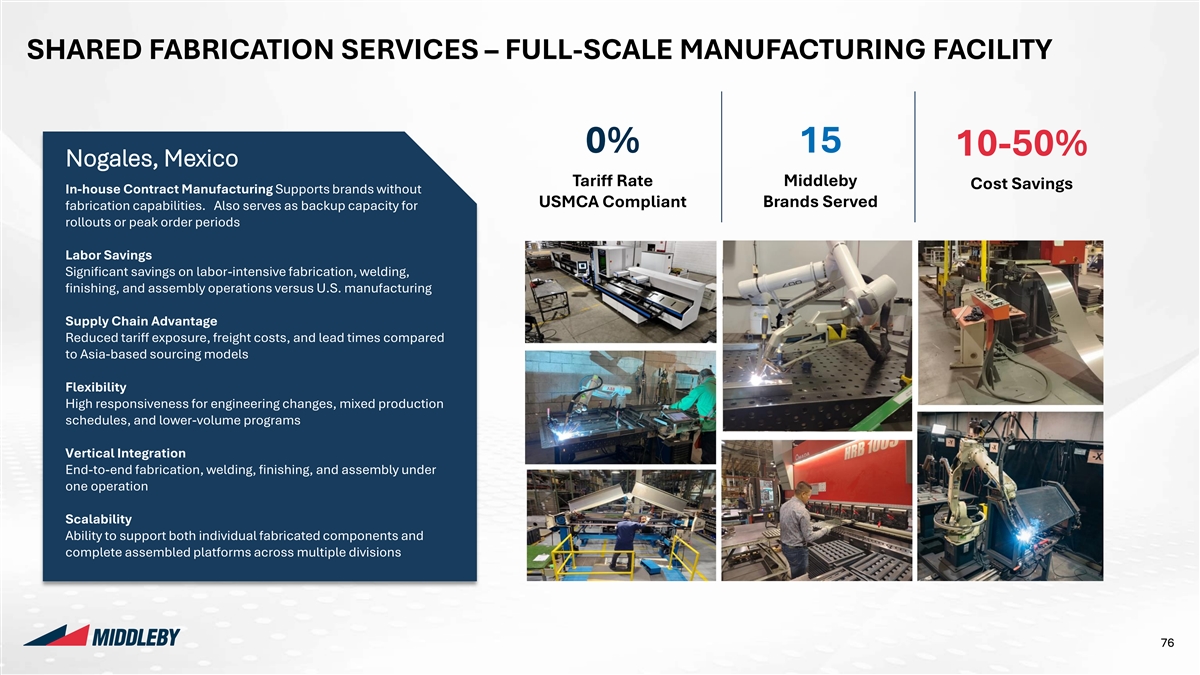
Company Logos Colours 255:255:255 Background SHARED FABRICATION SERVICES – FULL-SCALE MANUFACTURING FACILITY 0:0:0 Text Colour 23:60:93 Page Heading 23:60:93 Subheading Styles 0% 15 Charts – Charts – 10-50% Primary Secondary Nogales, Mexico Colours Colours Tariff Rate Middleby Cost Savings Rounded Y 0:47:80 205:219:224 In-house Contract Manufacturing Supports brands without Corners USMCA Compliant Brands Served fabrication capabilities. Also serves as backup capacity for 0:110:182 161:188:196 rollouts or peak order periods Shadows N 226:45:63 129:179:224 Labor Savings 228:222:212 244:242:238 Significant savings on labor-intensive fabrication, welding, Gradients N finishing, and assembly operations versus U.S. manufacturing 139:178:221 217:217:217 Supply Chain Advantage 191:191:191 229:229:229 Reduced tariff exposure, freight costs, and lead times compared to Asia-based sourcing models Headings on page Hierarchy of Highlights Flexibility Lines Y Key Takeaways Message Box (RGB and weight) High responsiveness for engineering changes, mixed production schedules, and lower-volume programs N Boxes Highlighted Boxes on the Page Vertical Integration Lines Highlight Table End-to-end fabrication, welding, finishing, and assembly under Rows / Maps Tables - Headings one operation RGB 0,0,0 | Wgt: 1pt Row Heading Tables - Rows Cells in Tables Scalability RGB 185,185,185 | Wgt: 0.5pt Ability to support both individual fabricated components and Charts - Axes complete assembled platforms across multiple divisions RGB 127,127,127 | Wgt: 0.75pt Charts - Lines Between Series: None Link to template Pages Setup 76 Width: 33.867 cm Add doctop here Height: 19.05 cm

Company Logos Colours 255:255:255 Background 0:0:0 Text Colour 23:60:93 Page Heading 23:60:93 Subheading Styles Charts – Charts – Primary Secondary Colours Colours Rounded Y 0:47:80 205:219:224 Corners 0:110:182 161:188:196 Shadows N 226:45:63 129:179:224 228:222:212 244:242:238 Gradients N FINANCIAL 139:178:221 217:217:217 191:191:191 229:229:229 FRAMEWORK & Headings on page Hierarchy of Highlights CAPITAL Lines Y Message Box (RGB and weight) N 07 Boxes Highlighted Boxes ALLOCATION on the Page Lines Highlight Table Rows / Maps Tables - Headings RGB 0,0,0 | Wgt: 1pt Row Heading Tables - Rows Cells in Tables RGB 185,185,185 | Wgt: 0.5pt Charts - Axes RGB 127,127,127 | Wgt: 0.75pt Charts - Lines Between Series: None Link to template Pages Setup 77 Width: 33.867 cm Add doctop here Height: 19.05 cm
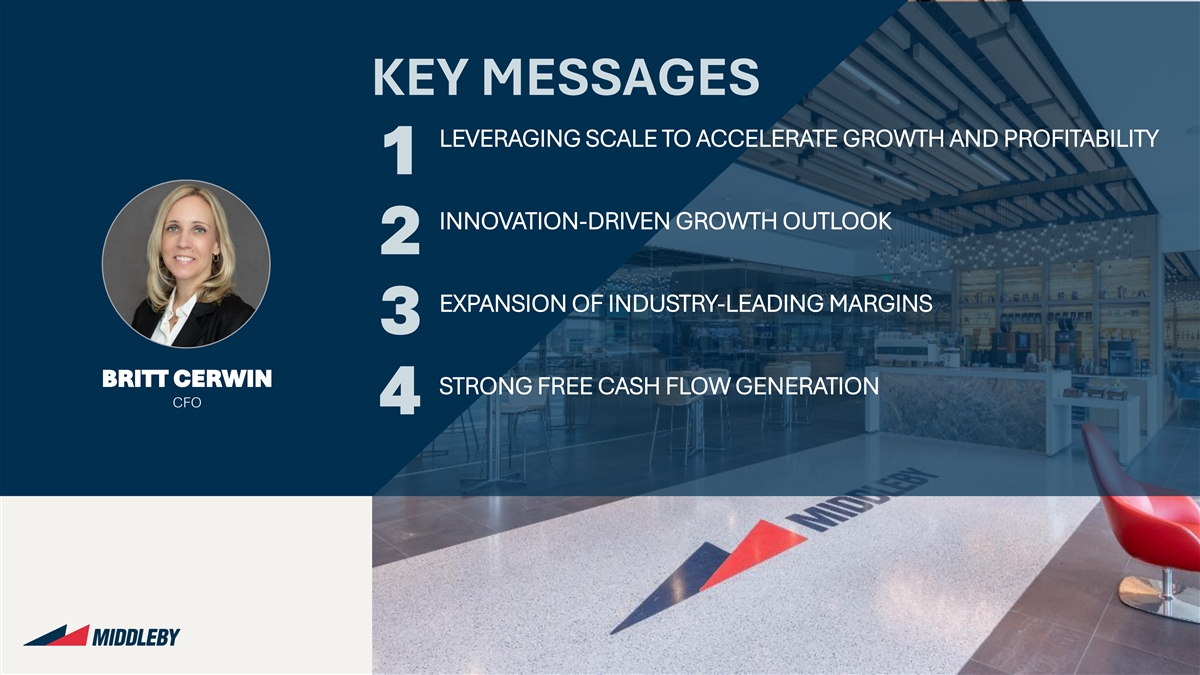
Company Logos Colours 255:255:255 Background 0:0:0 Text Colour KEY MESSAGES 23:60:93 Page Heading 23:60:93 Subheading LEVERAGING SCALE TO ACCELERATE GROWTH AND PROFITABILITY Styles Charts – Charts – Primary Secondary Colours Colours 1 Rounded Y 0:47:80 205:219:224 Corners 0:110:182 161:188:196 INNOVATION-DRIVEN GROWTH OUTLOOK Shadows N 226:45:63 129:179:224 2 228:222:212 244:242:238 Gradients N 139:178:221 217:217:217 EXPANSION OF INDUSTRY-LEADING MARGINS 191:191:191 229:229:229 3 Headings on page Hierarchy of Highlights BRITT CERWIN Lines STRONG FREE CASH FLOW GENERATION Y Message Box (RGB and weight) CFO 4 N Boxes Highlighted Boxes on the Page Lines Highlight Table Rows / Maps Tables - Headings RGB 0,0,0 | Wgt: 1pt Row Heading Tables - Rows Cells in Tables RGB 185,185,185 | Wgt: 0.5pt Charts - Axes RGB 127,127,127 | Wgt: 0.75pt Charts - Lines Between Series: None Link to template Pages Setup 78 Width: 33.867 cm Add doctop here Height: 19.05 cm
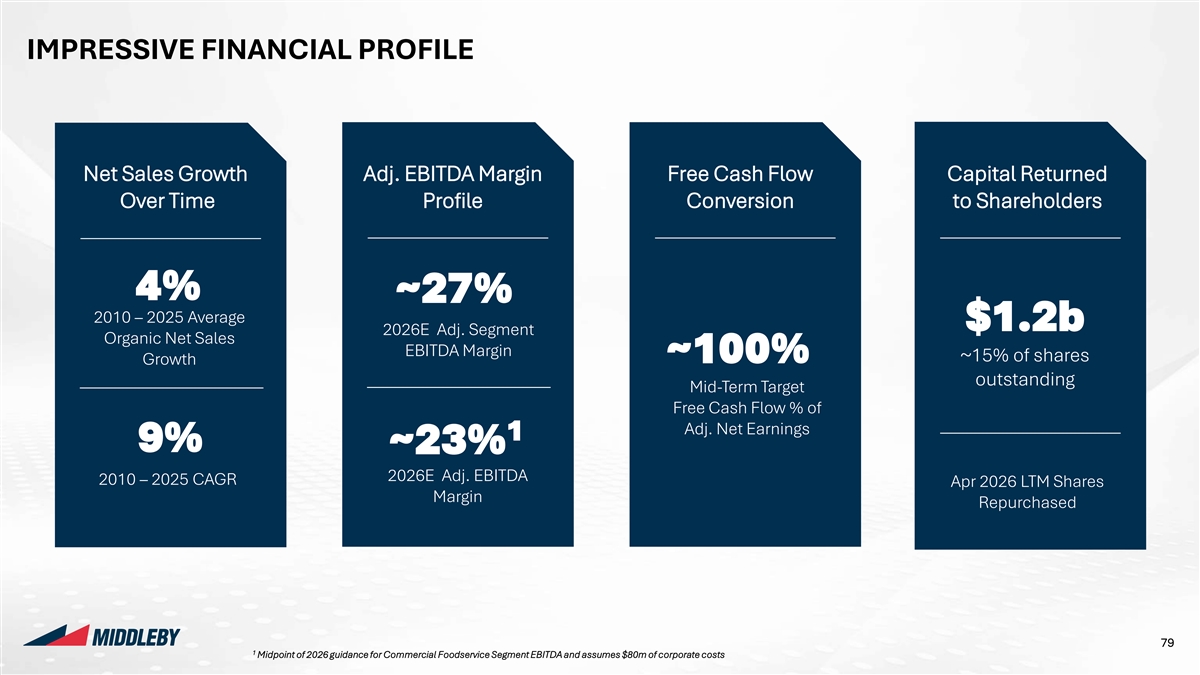
Company Logos Colours 255:255:255 Background IMPRESSIVE FINANCIAL PROFILE 0:0:0 Text Colour 23:60:93 Page Heading 23:60:93 Subheading Styles Charts – Charts – Primary Secondary Colours Colours Net Sales Growth Adj. EBITDA Margin Free Cash Flow Capital Returned Rounded Y 0:47:80 205:219:224 Corners Over Time Profile Conversion to Shareholders 0:110:182 161:188:196 Shadows N 226:45:63 129:179:224 228:222:212 244:242:238 Gradients N 4% 139:178:221 217:217:217 ~27% 2010 – 2025 Average 191:191:191 229:229:229 $1.2b 2026E Adj. Segment Organic Net Sales EBITDA Margin ~15% of shares ~100% Growth Headings on page Hierarchy of Highlights outstanding Mid-Term Target Lines Y Message Box (RGB and weight) Free Cash Flow % of N Boxes Highlighted Boxes Adj. Net Earnings 1 on the Page 9% ~23% Lines Highlight Table 2026E Adj. EBITDA Rows / Maps Tables - Headings 2010 – 2025 CAGR Apr 2026 LTM Shares RGB 0,0,0 | Wgt: 1pt Margin Row Heading Repurchased Tables - Rows Cells in Tables RGB 185,185,185 | Wgt: 0.5pt Charts - Axes RGB 127,127,127 | Wgt: 0.75pt Charts - Lines Between Series: None Link to template Pages Setup 79 Width: 33.867 cm 1 Add doctop here Midpoint of 2026 guidance for Commercial Foodservice Segment EBITDA and assumes $80m of corporate costs Height: 19.05 cm
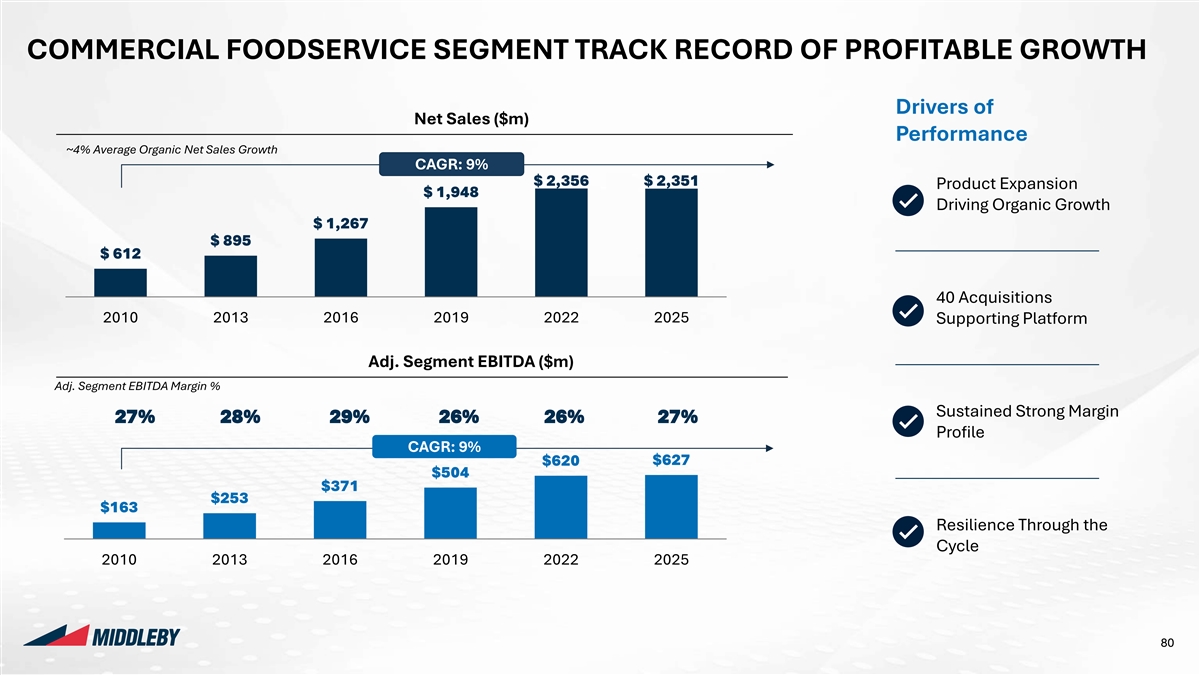
Company Logos Colours 255:255:255 Background COMMERCIAL FOODSERVICE SEGMENT TRACK RECORD OF PROFITABLE GROWTH 0:0:0 Text Colour 23:60:93 Page Heading Drivers of Net Sales ($m) 23:60:93 Subheading Performance Styles Charts – Charts – ~4% Average Organic Net Sales Growth Primary Secondary CAGR: 9% Colours Colours $ 2,356 $ 2,351 Product Expansion Rounded Y 0:47:80 205:219:224 $ 1,948 Corners Driving Organic Growth 0:110:182 161:188:196 $ 1,267 Shadows N $ 895 226:45:63 129:179:224 $ 612 228:222:212 244:242:238 Gradients N 139:178:221 217:217:217 40 Acquisitions 2010 2013 2016 2019 2022 2025 Supporting Platform 191:191:191 229:229:229 Headings on page Adj. Segment EBITDA ($m) Hierarchy of Highlights Adj. Segment EBITDA Margin % Lines Y Message Box (RGB and weight) Sustained Strong Margin 27% 28% 29% 26% 26% 27% N Boxes Highlighted Boxes Profile on the Page CAGR: 9% Lines $627 $620 Highlight Table $504 Rows / Maps Tables - Headings $371 RGB 0,0,0 | Wgt: 1pt $253 Row Heading $163 Tables - Rows Cells in Tables RGB 185,185,185 | Wgt: 0.5pt Resilience Through the Charts - Axes Cycle RGB 127,127,127 | Wgt: 0.75pt 2010 2013 2016 2019 2022 2025 Charts - Lines Between Series: None Link to template Pages Setup 80 Width: 33.867 cm Add doctop here Height: 19.05 cm
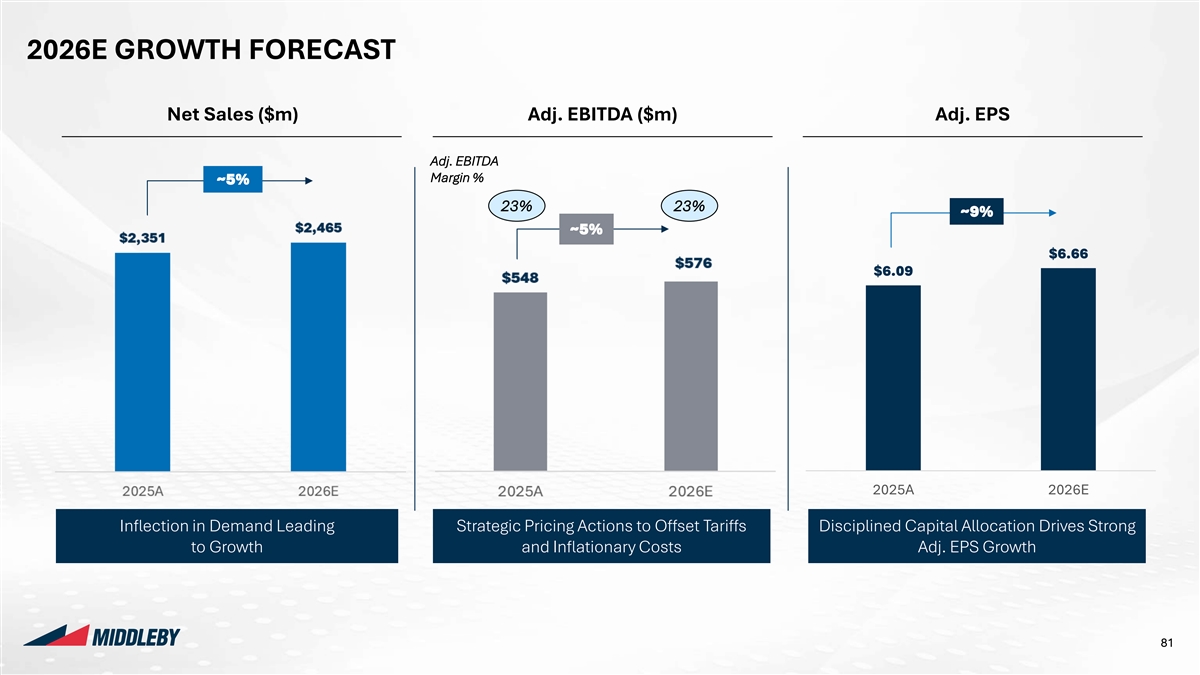
Company Logos Colours 255:255:255 Background 2026E GROWTH FORECAST 0:0:0 Text Colour 23:60:93 Page Heading Net Sales ($m) Adj. EBITDA ($m) Adj. EPS 23:60:93 Subheading Styles Charts – Charts – Primary Secondary Adj. EBITDA Colours Colours Margin % ~5% Rounded Y 0:47:80 205:219:224 Corners 23% 23% ~9% 0:110:182 161:188:196 ~5% Shadows N 226:45:63 129:179:224 $6.66 228:222:212 244:242:238 $6.09 Gradients N 139:178:221 217:217:217 191:191:191 229:229:229 Headings on page Hierarchy of Highlights Lines Y Message Box (RGB and weight) N Boxes Highlighted Boxes on the Page Lines Highlight Table Rows / Maps Tables - Headings 2025A 2026E RGB 0,0,0 | Wgt: 1pt Row Heading Tables - Rows Cells in Tables RGB 185,185,185 | Wgt: 0.5pt Inflection in Demand Leading Strategic Pricing Actions to Offset Tariffs Disciplined Capital Allocation Drives Strong Charts - Axes to Growth and Inflationary Costs Adj. EPS Growth RGB 127,127,127 | Wgt: 0.75pt Charts - Lines Between Series: None Link to template Pages Setup 81 Width: 33.867 cm Add doctop here Height: 19.05 cm
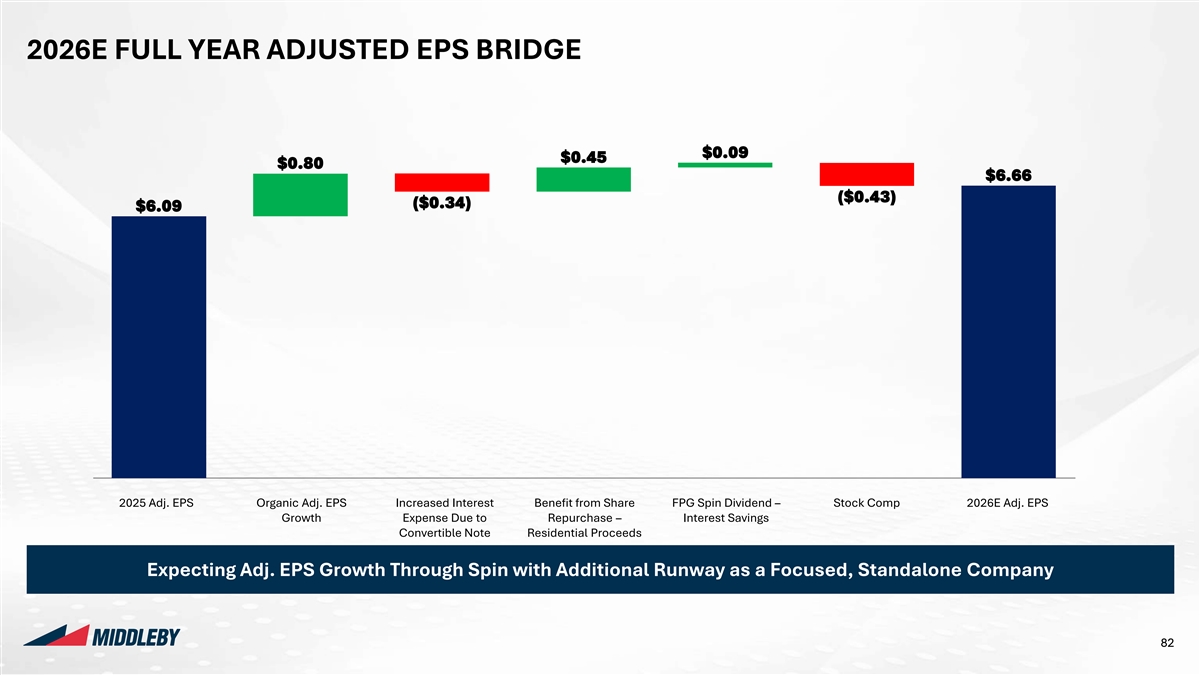
Company Logos Colours 255:255:255 Background 2026E FULL YEAR ADJUSTED EPS BRIDGE 0:0:0 Text Colour 23:60:93 Page Heading 23:60:93 Subheading Styles Charts – Charts – $0.09 Primary Secondary $0.45 $0.80 Colours Colours $6.66 Rounded Y 0:47:80 205:219:224 Corners ($0.43) ($0.34) $6.09 0:110:182 161:188:196 Shadows N 226:45:63 129:179:224 228:222:212 244:242:238 Gradients N 139:178:221 217:217:217 191:191:191 229:229:229 Headings on page Hierarchy of Highlights Lines Y Message Box (RGB and weight) N Boxes Highlighted Boxes on the Page Lines Highlight Table Rows / Maps Tables - Headings RGB 0,0,0 | Wgt: 1pt Row Heading 2025 Adj. EPS Organic Adj. EPS Increased Interest Benefit from Share FPG Spin Dividend – Stock Comp 2026E Adj. EPS Tables - Rows Cells in Tables Growth Expense Due to Repurchase – Interest Savings RGB 185,185,185 | Wgt: 0.5pt Convertible Note Residential Proceeds Charts - Axes RGB 127,127,127 | Wgt: 0.75pt Expecting Adj. EPS Growth Through Spin with Additional Runway as a Focused, Standalone Company Charts - Lines Between Series: None Link to template Pages Setup 82 Width: 33.867 cm Add doctop here Height: 19.05 cm
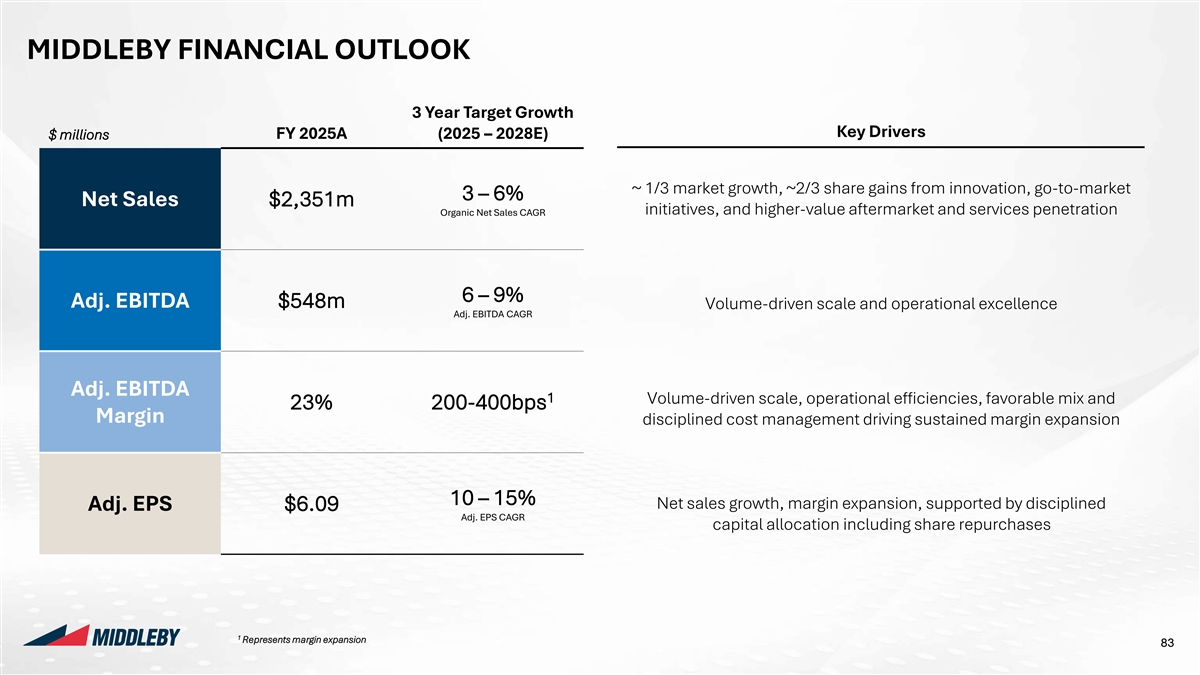
Company Logos Colours 255:255:255 Background MIDDLEBY FINANCIAL OUTLOOK 0:0:0 Text Colour 23:60:93 Page Heading 3 Year Target Growth 23:60:93 Subheading Key Drivers FY 2025A (2025 – 2028E) $ millions Styles Charts – Charts – Primary Secondary Colours Colours Rounded Y 0:47:80 205:219:224 ~ 1/3 market growth, ~2/3 share gains from innovation, go-to-market 3 – 6% Corners Net Sales $2,351m initiatives, and higher-value aftermarket and services penetration Organic Net Sales CAGR 0:110:182 161:188:196 Shadows N 226:45:63 129:179:224 228:222:212 244:242:238 Gradients N 139:178:221 217:217:217 6 – 9% Adj. EBITDA $548m Volume-driven scale and operational excellence Adj. EBITDA CAGR 191:191:191 229:229:229 Headings on page Hierarchy of Highlights Lines Y Adj. EBITDA 1 Volume-driven scale, operational efficiencies, favorable mix and Message Box (RGB and weight) 23% 200-400bps Margin disciplined cost management driving sustained margin expansion N Boxes Highlighted Boxes on the Page Lines Highlight Table Rows / Maps Tables - Headings RGB 0,0,0 | Wgt: 1pt 10 – 15% Row Heading Net sales growth, margin expansion, supported by disciplined Adj. EPS $6.09 Tables - Rows Cells in Tables Adj. EPS CAGR RGB 185,185,185 | Wgt: 0.5pt capital allocation including share repurchases Charts - Axes RGB 127,127,127 | Wgt: 0.75pt Charts - Lines Between Series: None Link to template Pages Setup 1 Represents margin expansion 83 Width: 33.867 cm Add doctop here Height: 19.05 cm
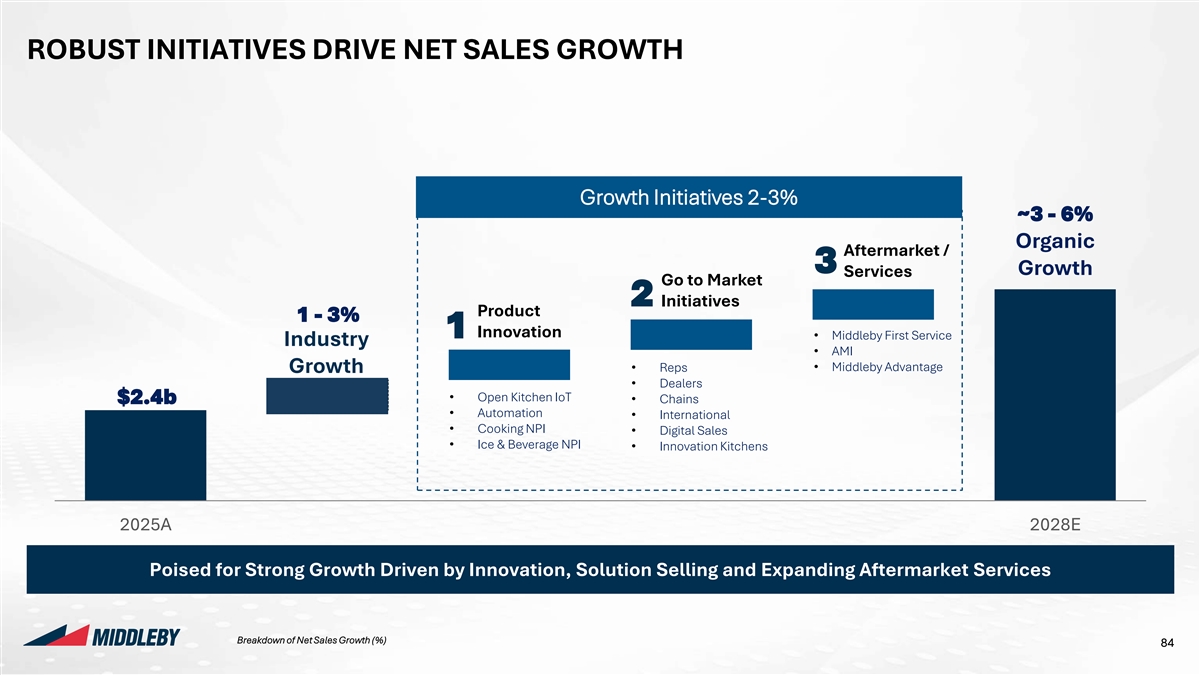
Company Logos Colours 255:255:255 Background ROBUST INITIATIVES DRIVE NET SALES GROWTH 0:0:0 Text Colour 23:60:93 Page Heading 23:60:93 Subheading Styles Charts – Charts – Primary Secondary Colours Colours Rounded Y 0:47:80 205:219:224 Corners Growth Initiatives 2-3% 0:110:182 161:188:196 ~3 - 6% Shadows N 226:45:63 129:179:224 Organic Aftermarket / 3 228:222:212 244:242:238 Growth Services Gradients N Go to Market 139:178:221 217:217:217 2 Initiatives Product 1 - 3% 191:191:191 229:229:229 1 Innovation • Middleby First Service Industry • AMI Headings on page Hierarchy of Highlights • Middleby Advantage • Reps Growth • Dealers Lines Y • Open Kitchen IoT $2.4b• Chains Message Box (RGB and weight) • Automation • International N Boxes Highlighted Boxes • Cooking NPI • Digital Sales on the Page • Ice & Beverage NPI • Innovation Kitchens Lines Highlight Table Rows / Maps Tables - Headings RGB 0,0,0 | Wgt: 1pt Row Heading Tables - Rows Cells in Tables RGB 185,185,185 | Wgt: 0.5pt 2025A 2028E Charts - Axes RGB 127,127,127 | Wgt: 0.75pt Poised for Strong Growth Driven by Innovation, Solution Selling and Expanding Aftermarket Services Charts - Lines Between Series: None Link to template Pages Setup Breakdown of Net Sales Growth (%) 84 Width: 33.867 cm Add doctop here Height: 19.05 cm
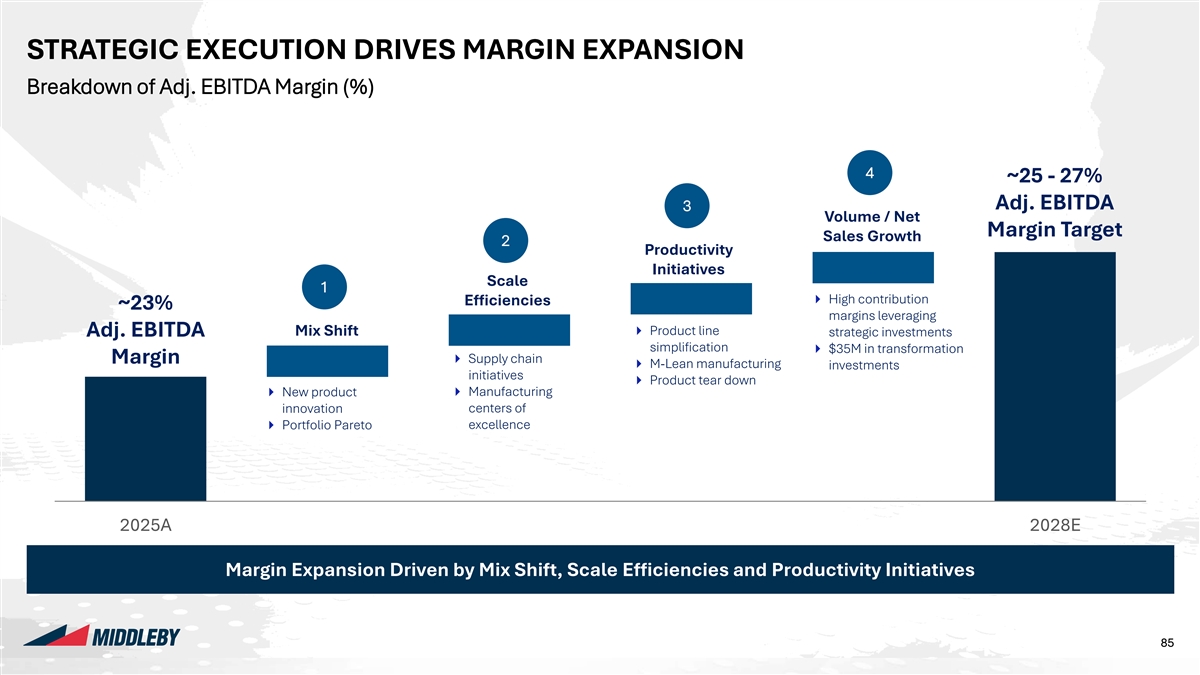
Company Logos Colours 255:255:255 Background STRATEGIC EXECUTION DRIVES MARGIN EXPANSION 0:0:0 Text Colour Breakdown of Adj. EBITDA Margin (%) 23:60:93 Page Heading 23:60:93 Subheading Styles Charts – Charts – Primary Secondary Colours Colours 4 ~25 - 27% Rounded Y 0:47:80 205:219:224 Corners Adj. EBITDA 3 0:110:182 161:188:196 Volume / Net Shadows N Margin Target Sales Growth 2 226:45:63 129:179:224 Productivity 228:222:212 244:242:238 Initiatives Gradients N Scale 1 139:178:221 217:217:217 ⏵ High contribution Efficiencies ~23% margins leveraging 191:191:191 229:229:229 ⏵ Product line Adj. EBITDA Mix Shift strategic investments simplification ⏵ $35M in transformation Margin⏵ Supply chain Headings on page Hierarchy of Highlights ⏵ M-Lean manufacturing investments initiatives ⏵ Product tear down Lines Y⏵ New product ⏵ Manufacturing Message Box (RGB and weight) innovation centers of N Boxes excellence ⏵ Portfolio Pareto Highlighted Boxes on the Page Lines Highlight Table Rows / Maps Tables - Headings RGB 0,0,0 | Wgt: 1pt Row Heading Tables - Rows Cells in Tables RGB 185,185,185 | Wgt: 0.5pt 2025A 2028E Charts - Axes RGB 127,127,127 | Wgt: 0.75pt Margin Expansion Driven by Mix Shift, Scale Efficiencies and Productivity Initiatives Charts - Lines Between Series: None Link to template Pages Setup 85 85 Width: 33.867 cm Add doctop here Height: 19.05 cm
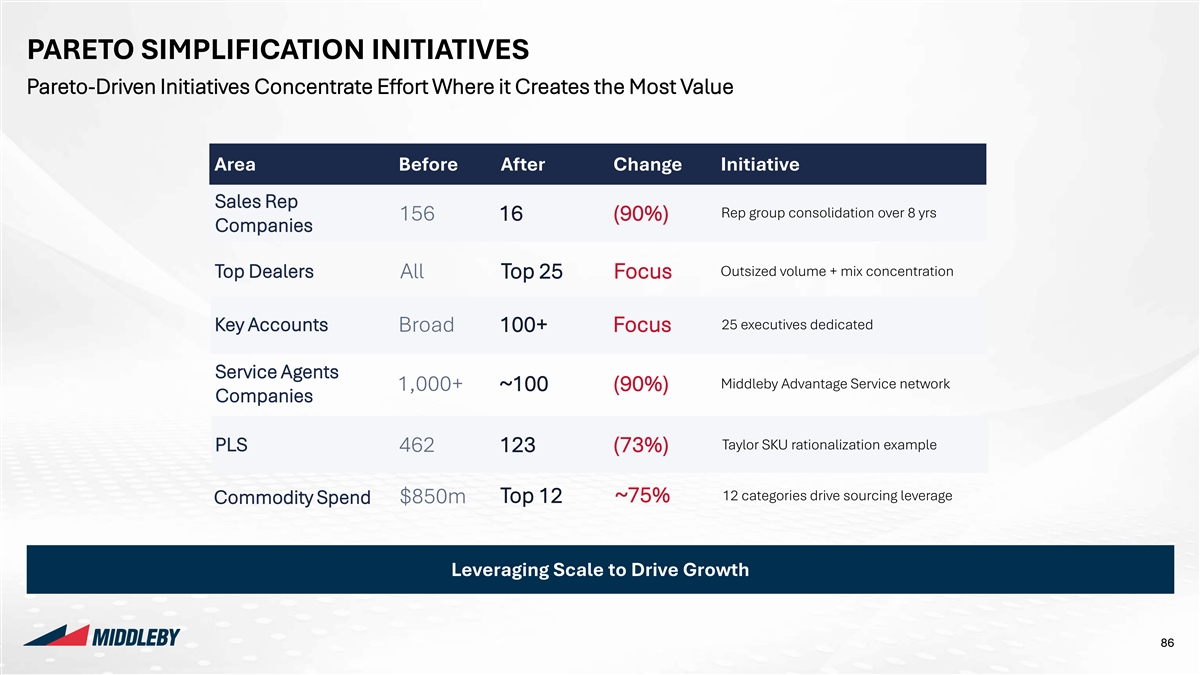
Company Logos Colours 255:255:255 Background PARETO SIMPLIFICATION INITIATIVES 0:0:0 Text Colour Pareto-Driven Initiatives Concentrate Effort Where it Creates the Most Value 23:60:93 Page Heading 23:60:93 Subheading Styles Charts – Charts – Primary Secondary Area Before After Change Initiative Colours Colours Rounded Y 0:47:80 205:219:224 Corners Sales Rep Rep group consolidation over 8 yrs 0:110:182 161:188:196 156 16 (90%) Companies Shadows N 226:45:63 129:179:224 228:222:212 244:242:238 Outsized volume + mix concentration Top Dealers Gradients N All Top 25 Focus 139:178:221 217:217:217 191:191:191 229:229:229 25 executives dedicated Key Accounts Broad 100+ Focus Headings on page Hierarchy of Highlights Service Agents Middleby Advantage Service network 1,000+ ~100 (90%) Lines Y Companies Message Box (RGB and weight) N Boxes Highlighted Boxes on the Page Taylor SKU rationalization example PLS 462 123 (73%) Lines Highlight Table Rows / Maps Tables - Headings RGB 0,0,0 | Wgt: 1pt 12 categories drive sourcing leverage Top 12 ~75% Commodity Spend $850m Row Heading Tables - Rows Cells in Tables RGB 185,185,185 | Wgt: 0.5pt Charts - Axes RGB 127,127,127 | Wgt: 0.75pt Leveraging Scale to Drive Growth Charts - Lines Between Series: None Link to template Pages Setup 86 Width: 33.867 cm Add doctop here Height: 19.05 cm
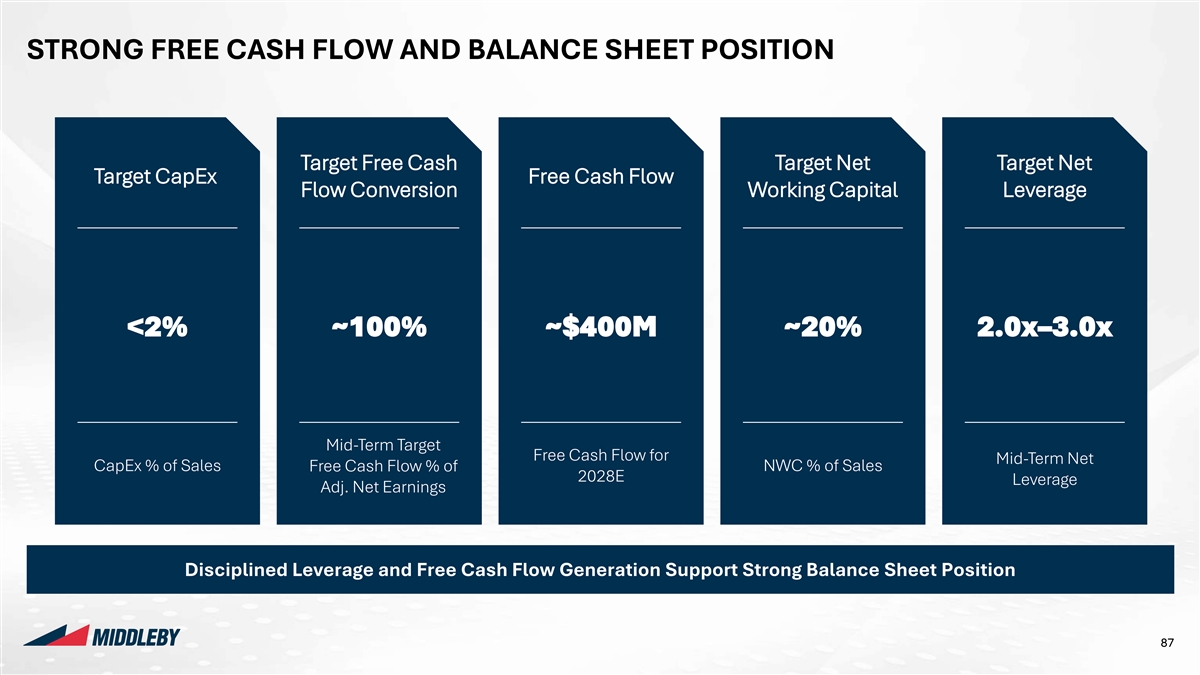
Company Logos Colours 255:255:255 Background STRONG FREE CASH FLOW AND BALANCE SHEET POSITION 0:0:0 Text Colour 23:60:93 Page Heading 23:60:93 Subheading Styles Charts – Charts – Primary Secondary Target Free Cash Target Net Target Net Colours Colours Target CapEx Free Cash Flow Rounded Y 0:47:80 205:219:224 Flow Conversion Working Capital Leverage Corners 0:110:182 161:188:196 Shadows N 226:45:63 129:179:224 228:222:212 244:242:238 Gradients N 139:178:221 217:217:217 191:191:191 229:229:229 <2% ~100% ~$400M ~20% 2.0x–3.0x Headings on page Hierarchy of Highlights Lines Y Message Box (RGB and weight) N Boxes Highlighted Boxes on the Page Mid-Term Target Lines Free Cash Flow for Mid-Term Net Highlight Table CapEx % of Sales Free Cash Flow % of NWC % of Sales 2028E Rows / Maps Tables - Headings Leverage Adj. Net Earnings RGB 0,0,0 | Wgt: 1pt Row Heading Tables - Rows Cells in Tables RGB 185,185,185 | Wgt: 0.5pt Charts - Axes RGB 127,127,127 | Wgt: 0.75pt Disciplined Leverage and Free Cash Flow Generation Support Strong Balance Sheet Position Charts - Lines Between Series: None Link to template Pages Setup 87 Width: 33.867 cm Add doctop here Height: 19.05 cm
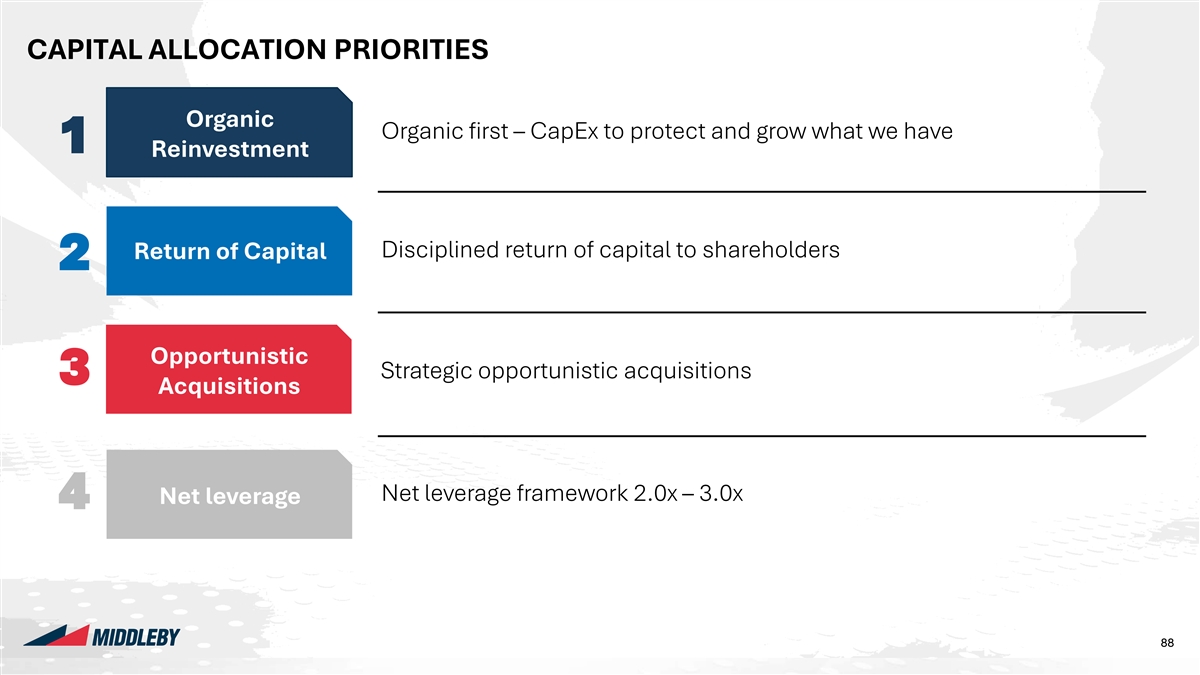
Company Logos Colours 255:255:255 Background CAPITAL ALLOCATION PRIORITIES 0:0:0 Text Colour 23:60:93 Page Heading Organic 23:60:93 Subheading Organic first – CapEx to protect and grow what we have Styles 1 Charts – Charts – Reinvestment Primary Secondary Colours Colours Rounded Y 0:47:80 205:219:224 Corners 0:110:182 161:188:196 Shadows N 226:45:63 129:179:224 Disciplined return of capital to shareholders Return of Capital 2 228:222:212 244:242:238 Gradients N 139:178:221 217:217:217 191:191:191 229:229:229 Opportunistic Headings on page Hierarchy of Highlights Strategic opportunistic acquisitions 3 Lines Acquisitions Y Message Box (RGB and weight) N Boxes Highlighted Boxes on the Page Lines Highlight Table Rows / Maps Tables - Headings RGB 0,0,0 | Wgt: 1pt Net leverage framework 2.0x – 3.0x Net leverage Row Heading 4 Tables - Rows Cells in Tables RGB 185,185,185 | Wgt: 0.5pt Charts - Axes RGB 127,127,127 | Wgt: 0.75pt Charts - Lines Between Series: None Link to template Pages Setup 88 88 Width: 33.867 cm Add doctop here Height: 19.05 cm
Company Logos Colours 255:255:255 Background QUESTIONS & DISCUSSION 0:0:0 Text Colour 23:60:93 Page Heading 23:60:93 Subheading Styles Charts – Charts – Primary Secondary Colours Colours Rounded Y 0:47:80 205:219:224 Corners 0:110:182 161:188:196 Shadows N 226:45:63 129:179:224 228:222:212 244:242:238 Gradients N 139:178:221 217:217:217 191:191:191 229:229:229 Headings on page Hierarchy of Highlights Lines Y Message Box (RGB and weight) N Boxes Highlighted Boxes on the Page Lines Highlight Table Rows / Maps Tables - Headings RGB 0,0,0 | Wgt: 1pt Row Heading Tables - Rows Cells in Tables RGB 185,185,185 | Wgt: 0.5pt Charts - Axes RGB 127,127,127 | Wgt: 0.75pt Charts - Lines Between Series: None Link to template Pages Setup 89 Width: 33.867 cm Add doctop here Height: 19.05 cm

Company Logos Colours 255:255:255 Background DEFINITIONS OF NON-GAAP FINANCIAL MEASURES 0:0:0 Text Colour 23:60:93 Page Heading 23:60:93 The following provides definitions of the non-GAAP financial measures included in this presentation: Subheading Styles Charts – Charts – Primary Secondary • Adjusted EBITDA is defined as net income before depreciation and amortization (including asset impairments), interest expense, Colours Colours Rounded income tax (expense) benefit, other income (expense), net, equity income (loss), net of tax, restructuring and other special items. Y 0:47:80 205:219:224 Corners • Adjusted EBITDA margin is defined as Adjusted EBITDA divided by net sales. 0:110:182 161:188:196 • Adjusted segment EBITDA margin is defined as Adjusted EBITDA for our applicable operating segment divided by net sales for such Shadows N 226:45:63 129:179:224 segment. 228:222:212 244:242:238 • Adjusted net earnings is defined as net income before intangible amortization expense, impairment charges, net periodic pension Gradients N benefit, restructuring expenses, and other charges. 139:178:221 217:217:217 • Adjusted diluted earnings per share (Adjusted EPS) is defined as diluted earnings per share before intangible amortization expense, 191:191:191 229:229:229 impairment charges, net periodic pension benefit, restructuring expenses, and other charges. • Free cash flow is defined as cash flows from operating activities less capital expenditures. Headings on page Hierarchy of Highlights • Free cash flow conversion is defined as free cash flow divided by adjusted net earnings. Lines Y • Net debt is defined as current maturities of long-term debt and long-term debt less cash and cash equivalents. Message Box (RGB and weight) • Net leverage is defined as net debt divided by Adjusted EBITDA. N Boxes Highlighted Boxes • Organic net sales growth is defined as reported net sales growth adjusted to exclude the impact of acquisitions and foreign exchange on the Page Lines rates. Highlight Table Rows / Maps Tables - Headings RGB 0,0,0 | Wgt: 1pt Row Heading The Company believes Adjusted EBITDA, Adjusted EBITDA margin, Adjusted Segment EBITDA margin, Adjusted net earnings, Adjusted Tables - Rows Cells in Tables RGB 185,185,185 | Wgt: 0.5pt EPS and organic net sales growth are useful as supplements to its GAAP results of operations to evaluate certain aspects of its operations and financial performance, and its management team primarily focuses on non-GAAP items in evaluating performance for Charts - Axes RGB 127,127,127 | Wgt: 0.75pt business planning purposes. The Company believes free cash flow and free cash flow conversion are useful to investors to provide Charts - Lines Between Series: None meaningful measures of the Company's ability to service and reduce debt, fund acquisitions and return capital to shareholders. The Company believes net debt and net leverage are useful to investors in understanding our overall financial condition. Link to template Pages Setup 91 Width: 33.867 cm Add doctop here Height: 19.05 cm
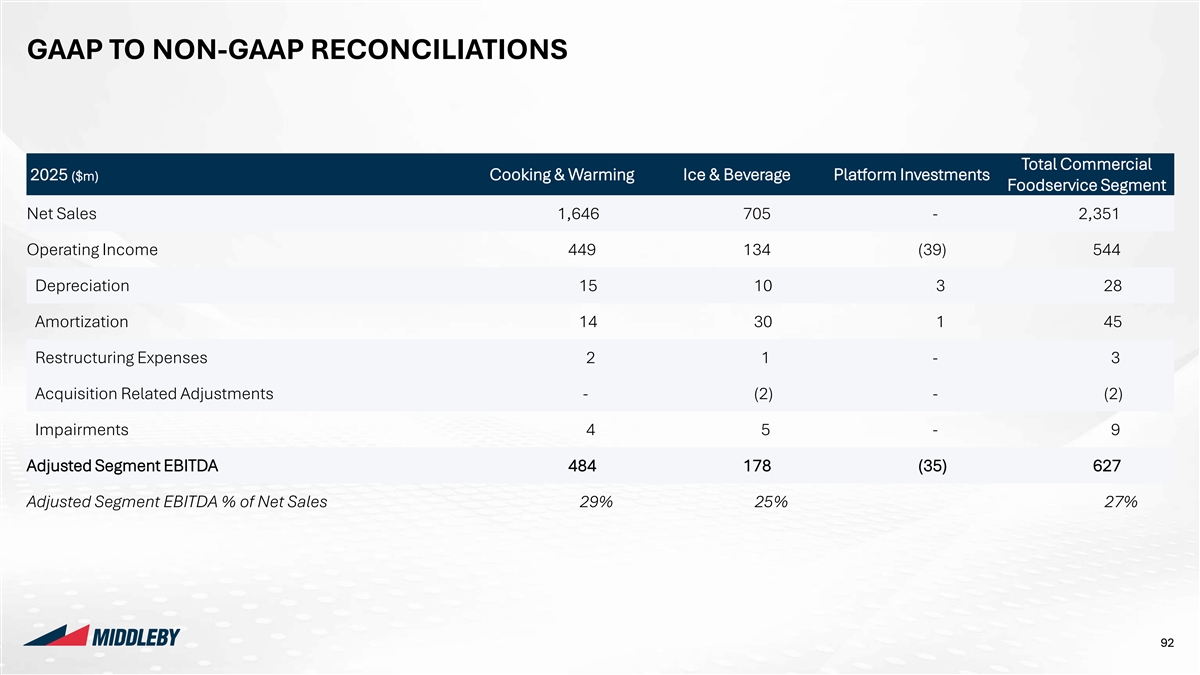
Company Logos Colours 255:255:255 Background GAAP TO NON-GAAP RECONCILIATIONS 0:0:0 Text Colour 23:60:93 Page Heading 23:60:93 Subheading Styles Charts – Charts – Primary Secondary Total Commercial Colours Colours 2025 Cooking & Warming Ice & Beverage Platform Investments ($m) Rounded Foodservice Segment Y 0:47:80 205:219:224 Corners Net Sales 1,646 705 - 2,351 0:110:182 161:188:196 Shadows N 226:45:63 129:179:224 Operating Income 449 134 (39) 544 228:222:212 244:242:238 Gradients N Depreciation 15 10 3 28 139:178:221 217:217:217 191:191:191 229:229:229 Amortization 14 30 1 45 Restructuring Expenses 2 1 - 3 Headings on page Hierarchy of Highlights Lines Y Acquisition Related Adjustments - (2) - (2) Message Box (RGB and weight) N Boxes Highlighted Boxes Impairments 4 5 - 9 on the Page Lines Highlight Table Adjusted Segment EBITDA 484 178 (35) 627 Rows / Maps Tables - Headings RGB 0,0,0 | Wgt: 1pt Row Heading Adjusted Segment EBITDA % of Net Sales 29% 25% 27% Tables - Rows Cells in Tables RGB 185,185,185 | Wgt: 0.5pt Charts - Axes RGB 127,127,127 | Wgt: 0.75pt Charts - Lines Between Series: None Link to template Pages Setup 92 Width: 33.867 cm Add doctop here Height: 19.05 cm
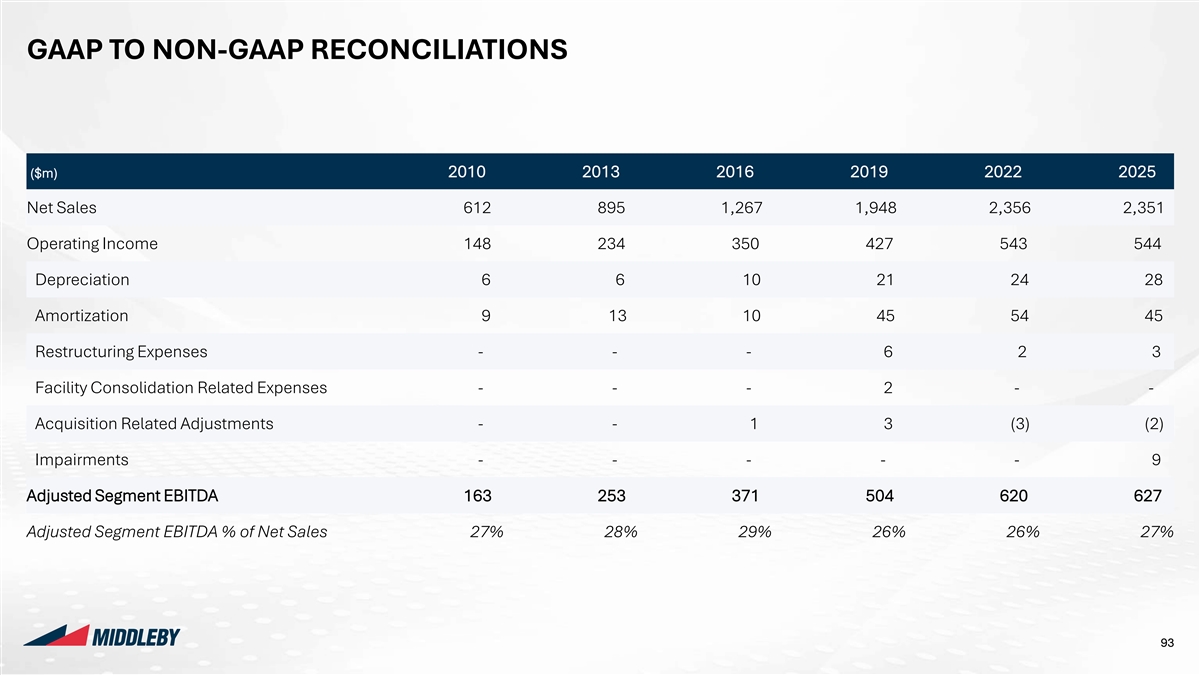
Company Logos Colours 255:255:255 Background GAAP TO NON-GAAP RECONCILIATIONS 0:0:0 Text Colour 23:60:93 Page Heading 23:60:93 Subheading Styles Charts – Charts – Primary Secondary Colours Colours ($m) 2010 2013 2016 2019 2022 2025 Rounded Y 0:47:80 205:219:224 Corners Net Sales 612 895 1,267 1,948 2,356 2,351 0:110:182 161:188:196 Shadows N 226:45:63 129:179:224 Operating Income 148 234 350 427 543 544 228:222:212 244:242:238 Gradients N Depreciation 6 6 10 21 24 28 139:178:221 217:217:217 Amortization 9 13 10 45 54 45 191:191:191 229:229:229 Restructuring Expenses - - - 6 2 3 Headings on page Hierarchy of Highlights Lines Facility Consolidation Related Expenses - - - 2 - - Y Message Box (RGB and weight) N Boxes Acquisition Related Adjustments - - 1 3 (3) (2) Highlighted Boxes on the Page Lines Impairments - - - - - 9 Highlight Table Rows / Maps Tables - Headings RGB 0,0,0 | Wgt: 1pt Adjusted Segment EBITDA 163 253 371 504 620 627 Row Heading Tables - Rows Cells in Tables RGB 185,185,185 | Wgt: 0.5pt Adjusted Segment EBITDA % of Net Sales 27% 28% 29% 26% 26% 27% Charts - Axes RGB 127,127,127 | Wgt: 0.75pt Charts - Lines Between Series: None Link to template Pages Setup 93 Width: 33.867 cm Add doctop here Height: 19.05 cm
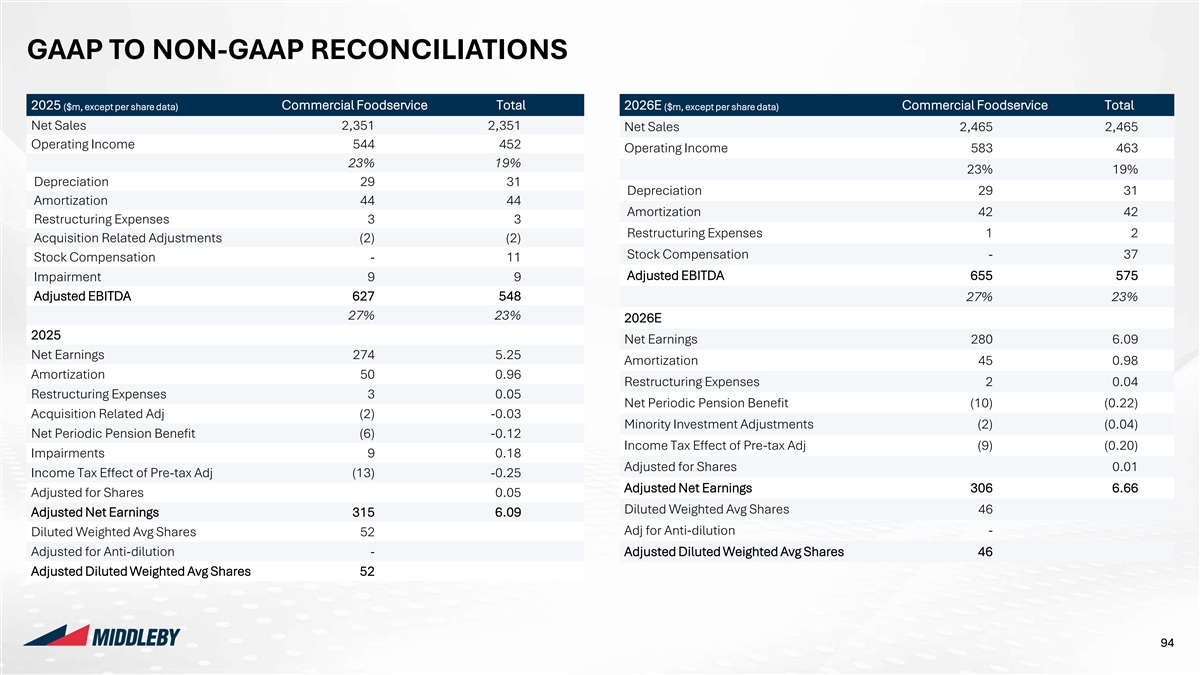
Company Logos Colours 255:255:255 Background GAAP TO NON-GAAP RECONCILIATIONS 0:0:0 Text Colour 23:60:93 Page Heading 2025 ($m, except per share data) Commercial Foodservice Total 2026E ($m, except per share data) Commercial Foodservice Total 23:60:93 Net Sales 2,351 2,351 Subheading Net Sales 2,465 2,465 Operating Income 544 452 Styles Operating Income 583 463 Charts – Charts – Primary Secondary 23% 19% Colours Colours 23% 19% Depreciation 29 31 Rounded Y 0:47:80 205:219:224 Depreciation 29 31 Corners Amortization 44 44 Amortization 42 42 0:110:182 161:188:196 Restructuring Expenses 3 3 Shadows N Restructuring Expenses 1 2 Acquisition Related Adjustments (2) (2) 226:45:63 129:179:224 Stock Compensation - 37 Stock Compensation - 11 228:222:212 244:242:238 Gradients N Adjusted EBITDA 655 575 Impairment 9 9 Adjusted EBITDA 627 548 139:178:221 217:217:217 27% 23% 27% 23% 2026E 191:191:191 229:229:229 2025 Net Earnings 280 6.09 Net Earnings 274 5.25 Amortization 45 0.98 Headings on page Hierarchy of Highlights Amortization 50 0.96 Restructuring Expenses 2 0.04 Lines Y Restructuring Expenses 3 0.05 Message Box (RGB and weight) Net Periodic Pension Benefit (10) (0.22) Acquisition Related Adj (2) -0.03 N Boxes Minority Investment Adjustments (2) (0.04) Highlighted Boxes Net Periodic Pension Benefit (6) -0.12 on the Page Income Tax Effect of Pre-tax Adj (9) (0.20) Impairments 9 0.18 Lines Highlight Table Adjusted for Shares 0.01 Income Tax Effect of Pre-tax Adj (13) -0.25 Rows / Maps Tables - Headings Adjusted Net Earnings 306 6.66 RGB 0,0,0 | Wgt: 1pt Adjusted for Shares 0.05 Row Heading Tables - Rows Diluted Weighted Avg Shares 46 Adjusted Net Earnings 315 6.09 Cells in Tables RGB 185,185,185 | Wgt: 0.5pt Adj for Anti-dilution - Diluted Weighted Avg Shares 52 Charts - Axes Adjusted for Anti-dilution - Adjusted Diluted Weighted Avg Shares 46 RGB 127,127,127 | Wgt: 0.75pt Adjusted Diluted Weighted Avg Shares 52 Charts - Lines Between Series: None Link to template Pages Setup 94 Width: 33.867 cm Add doctop here Height: 19.05 cm