
Exhibit 99.3
JBS REPORTS FIRST QUARTER 2026 RESULTS
May 12, 2026 – JBS N.V. (NYSE: JBS; B3: JBSS32), announces today its 1Q26 results. The numbers reported herein are in US dollars, in accordance with International Financial Reporting Standards (IFRS), unless otherwise specified.
(in millions, except per share data)
| First Quarter | ||||||||
| 2026 | 2025 | |||||||
| Net Sales | $ | 21,609 | $ | 19,527 | ||||
| Adjusted EBITDA (IFRS)² ³ | $ | 1,133 | $ | 1,528 | ||||
| Adjusted EBITDA (USGAAP)¹ ² | $ | 916 | $ | 1,312 | ||||
| Adjusted Operating Income (IFRS)² ³ | $ | 516 | $ | 992 | ||||
| Adjusted Operating Income (USGAAP)¹ ² | $ | 544 | $ | 999 | ||||
| Net Income Attributable to JBS³ | $ | 221 | $ | 500 | ||||
| Earnings Per Share Attributable to JBS³ | $ | 0.21 | $ | 0.47 | ||||
| Leverage (Net Debt / Adjusted EBITDA LTM)² ³ | 2.8x | 2.0x | ||||||
| Interest Coverage (Adjusted EBITDA LTM / Net Interest Expenses LTM)² ³ | 5.7x | 7.8x | ||||||
| ROE LTM ² ³ | 22.1 | % | 24.1 | % | ||||
| ROIC LTM ² ³ | 14.9 | % | 18.0 | % | ||||
First Quarter Highlights
| ● | Net Sales of $21,609 million, up 11% from prior year |
| ● | IFRS Adjusted EBITDA of $1,133 million, down 26% from prior year |
| ● | USGAAP¹ Adjusted EBITDA of $916 million, down 30% from prior year |
| ● | IFRS Adjusted operating income of $516 million, down 48% from prior year |
| ● | USGAAP¹ Adjusted operating income of $544 million, down 48% from prior year |
| ● | EPS of $0.21, down 56% from prior year |
“In Q1 2026, JBS posted sales growth across all business units, a result that reflects the strength of the Company's multi-geography and multi-protein platform. In terms of profitability, two segments were more significantly impacted: Beef North America, pressured by the challenge of the cattle cycle, and Pilgrim's Pride, affected by weather-related challenges and temporary plant stoppages for operational adjustments. Seara continues to report strong results with an Adjusted EBITDA Margin at 15.5% in 1Q26, while USA Pork maintained its high profitability in line with historical levels. Australia, despite solid operational execution, was impacted by foreign exchange headwinds. Finally, JBS Brazil delivered profitability growth, driven by strong international demand.
| (1) | USGAAP (non-audited) |
| (2) | Reconciliations for non-GAAP measures are provided in subsequent sections within this release. |
| (3) | IFRS |
Net income totaled US$221 million in the quarter, while cash burn was US$1.5 billion in the period. Return on equity (ROE) reached 22%, while return on invested capital (ROIC) was 15%. Leverage ended Q1 2026 at 2.77x, in line with the Company's long-term target," said Gilberto Tomazoni — Global CEO.
JBS Beef North America reported record sales for a first quarter, with cutout values remaining at historically high levels. Resilient U.S. consumer demand supported this performance. The increase in live cattle prices outpaced the change in cutout values, reflecting the low cattle availability. In this context, industry spreads remained significantly pressured, particularly in January and February. Additionally, live cattle imports from Mexico remained restricted, further constraining supply in the U.S. market throughout the quarter.
Pilgrim’s Pride implemented several projects during the quarter to enhance operational efficiencies in big bird and to grow key customer partnerships. Together, these projects will reinforce the foundation of future growth while reducing portfolio volatility and increasing returns. Planned plant downtime along with weakened commodity fundamentals and disruptions from weather events contributed to reduced profitability compared to last year. Europe maintained steady results compared to last year given its balanced portfolio across proteins and meal occasions. Back office integration and network optimization continues to improve productivity and support further growth. Mexico grew its branded portfolio across fresh and prepared foods. Geographical diversification also continues with ramp up of production in South and Peninsula areas. Improved growing conditions in the live markets and increased imports compressed margins versus the first quarter of 2025.
JBS USA Pork also reported record net sales for a first quarter, supported by strong domestic market performance driven by solid demand, as U.S. consumers have sought more affordable protein options, and by the Company's continued efforts to expand its value-added and branded product portfolio. As a result, business results remain consistent, reflecting strong commercial and operational execution.
JBS Australia net sales growth in 1Q26 was driven by higher prices in both domestic and export markets. The beef segment delivered strong revenue growth, supported by higher prices and volumes. Strong commercial dynamics, combined with continued operational efficiency gains, more than offset the approximately 30% year-over-year increase in cattle costs in 1Q26. In the other segments, EBITDA improved, particularly in pork and aquaculture, driven by operational execution and higher productivity. Results in Australian dollars remained stable compared to the same period of the prior year. However, the adverse movement of the US dollar against the Australian dollar impacted the conversion of the results into US dollars.
JBS Brazil also reported record sales for a first quarter. The revenue growth reflects mainly higher prices. In the export market, strong revenue growth was driven by higher prices and volumes, supported by robust global demand and the Company's geographic diversification strategy, which boosted sales across several strategic regions. In the domestic market, results continue to reflect the Company's ongoing commitment to value-added products and service offerings, as well as the deepening of partnerships with key customers. In addition to the typical first-quarter seasonality, according to data published by CEPEA-ESALQ, the average live cattle price during the quarter was approximately R$338/@, an increase of 6% compared to 1Q25. As a result, despite the improvement in net revenue, profitability was pressured by elevated cattle costs.
Seara reported 11% sales growth compared to the same period of the prior year, with strong adjusted EBITDA margin at 15.5% in 1Q26. In the export market, the Company maintained its sales growth in both volumes and prices, amid a more challenging operating environment in key markets resulting from the conflict in the Middle East. In the domestic market, despite the seasonality typically associated with the first quarter, Seara continued to invest in its fundamentals, expanding its value-added portfolio, increasing processing capacity for fresh and prepared products, strengthening its brand, and maintaining solid commercial and operational execution. As a result, the Company delivered a strong performance, reinforcing the consistency of its strategy and operational discipline.
Free Cash Flow & Leverage
The first quarter is seasonally characterized by cash consumption, driven by the concentration of payments to cattle and hog suppliers. Thus, the main impact on working capital in the quarter was accounts payable, which came in US$ 252 million higher than in the same period of the prior year. It is worth mentioning that if the amount of livestock deferral in 4Q26 stays at a similar level, it will offset the current impact of the first quarter in the free cash flow of the year. Working capital consumption was already lower than in the same period last year. Excluding the additional US$ 252 million in deferred livestock supplier payments, working capital would have been approximately 23% better compared to 1Q25. However, cash generation in the quarter was also impacted by a lower ~US$400 million Adjusted EBITDA compared to the same period last year as well as an increase of ~US$300 million in capex, mainly growth capex. As a result, free cash flow in the quarter was negative at US$ 1.5 billion (vs. -US$ 917 million in 1Q25). Accordingly, net leverage ended the quarter at 2.77x, in line with our long-term financial target.
2
SEGMENT RESULTS
| JBS Beef North America |
| First Quarter | ||||||||||||
| IFRS - US$ Million | 2026 | 2025 | Var % | |||||||||
| Net Sales | $ | 7,167 | $ | 6,422 | 11.6 | % | ||||||
| Cost of Sales | $ | (7,229 | ) | $ | (6,324 | ) | 14.3 | % | ||||
| Gross Profit | $ | (63 | ) | $ | 98 | - | ||||||
| Adjusted EBITDA | $ | (267 | ) | $ | (100 | ) | 165.5 | % | ||||
| Margin (%) | -3.7 | % | -1.6 | % | -2.1 p.p. | |||||||
| Adjusted Operating Income | $ | (329 | ) | $ | (158 | ) | 107.7 | % | ||||
| Margin (%) | -4.6 | % | -2.5 | % | -2.1 p.p. | |||||||
| First Quarter | ||||||||||||
| USGAAP¹ - US$ Million | 2026 | 2025 | Var % | |||||||||
| Net Sales | $ | 7,167 | $ | 6,422 | 11.6 | % | ||||||
| Cost of Sales | $ | (7,363 | ) | $ | (6,511 | ) | 13.1 | % | ||||
| Gross Profit | $ | (196 | ) | $ | (90 | ) | 118.8 | % | ||||
| Adjusted EBITDA | $ | (230 | ) | $ | (113 | ) | 103.6 | % | ||||
| Margin (%) | -3.2 | % | -1.8 | % | -1.4 p.p. | |||||||
| Adjusted Operating Income | $ | (279 | ) | $ | (158 | ) | 76.4 | % | ||||
| Margin (%) | -3.9 | % | -2.5 | % | -1.4 p.p. | |||||||
| Pilgrim's Pride |
| First Quarter | ||||||||||||
| IFRS - US$ Million | 2026 | 2025 | Var % | |||||||||
| Net Sales | $ | 4,529 | $ | 4,459 | 1.6 | % | ||||||
| Cost of Sales | $ | (3,915 | ) | $ | (3,671 | ) | 6.7 | % | ||||
| Gross Profit | $ | 614 | $ | 789 | -22.1 | % | ||||||
| Adjusted EBITDA | $ | 450 | $ | 660 | -31.9 | % | ||||||
| Margin (%) | 9.9 | % | 14.8 | % | -4.9 p.p. | |||||||
| Adjusted Operating Income | $ | 193 | $ | 431 | -55.2 | % | ||||||
| Margin (%) | 4.3 | % | 9.7 | % | -5.4 p.p. | |||||||
| First Quarter | ||||||||||||
| USGAAP¹ - US$ Million | 2026 | 2025 | Var % | |||||||||
| Net Sales | $ | 4,533 | $ | 4,463 | 1.6 | % | ||||||
| Cost of Sales | $ | (4,187 | ) | $ | (3,908 | ) | 7.1 | % | ||||
| Gross Profit | $ | 345 | $ | 555 | -37.7 | % | ||||||
| Adjusted EBITDA | $ | 308 | $ | 533 | -42.2 | % | ||||||
| Margin (%) | 6.8 | % | 11.9 | % | -5.1 p.p. | |||||||
| Adjusted Operating Income | $ | 190 | $ | 429 | -55.8 | % | ||||||
| Margin (%) | 4.2 | % | 9.6 | % | -5.4 p.p. | |||||||
| JBS Brazil |
| First Quarter | ||||||||||||
| IFRS - US$ Million | 2026 | 2025 | Var % | |||||||||
| Net Sales | $ | 3,789 | $ | 3,170 | 19.5 | % | ||||||
| Cost of Sales | $ | (3,273 | ) | $ | (2,701 | ) | 21.2 | % | ||||
| Gross Profit | $ | 516 | $ | 469 | 10.1 | % | ||||||
| Adjusted EBITDA | $ | 168 | $ | 131 | 27.9 | % | ||||||
| Margin (%) | 4.4 | % | 4.1 | % | 0.3 p.p. | |||||||
| Adjusted Operating Income | $ | 101 | $ | 80 | 27.3 | % | ||||||
| Margin (%) | 2.7 | % | 2.5 | % | 0.2 p.p. | |||||||
| First Quarter | ||||||||||||
| USGAAP¹ - US$ Million | 2026 | 2025 | Var % | |||||||||
| Net Sales | $ | 3,789 | $ | 3,170 | 19.5 | % | ||||||
| Cost of Sales | $ | (3,448 | ) | $ | (2,857 | ) | 20.7 | % | ||||
| Gross Profit | $ | 341 | $ | 313 | 8.8 | % | ||||||
| Adjusted EBITDA | $ | 172 | $ | 125 | 37.4 | % | ||||||
| Margin (%) | 4.5 | % | 3.9 | % | 0.6 p.p. | |||||||
| Adjusted Operating Income | $ | 106 | $ | 78 | 37.0 | % | ||||||
| Margin (%) | 2.8 | % | 2.4 | % | 0.4 p.p. | |||||||
| (1) | USGAAP (non-audited) |
3
| Seara |
| First Quarter | ||||||||||||
| IFRS - US$ Million | 2026 | 2025 | Var % | |||||||||
| Net Sales | $ | 2,379 | $ | 2,150 | 10.6 | % | ||||||
| Cost of Sales | $ | (1,798 | ) | $ | (1,522 | ) | 18.2 | % | ||||
| Gross Profit | $ | 581 | $ | 629 | -7.6 | % | ||||||
| Adjusted EBITDA | $ | 369 | $ | 426 | -13.3 | % | ||||||
| Margin (%) | 15.5 | % | 19.8 | % | -4.3 p.p. | |||||||
| Adjusted Operating Income | $ | 248 | $ | 337 | -26.2 | % | ||||||
| Margin (%) | 10.4 | % | 15.7 | % | -5.3 p.p. | |||||||
| First Quarter | ||||||||||||
| USGAAP¹ - US$ Million | 2026 | 2025 | Var % | |||||||||
| Net Sales | $ | 2,379 | $ | 2,150 | 10.6 | % | ||||||
| Cost of Sales | $ | (1,964 | ) | $ | (1,623 | ) | 21.0 | % | ||||
| Gross Profit | $ | 415 | $ | 528 | -21.3 | % | ||||||
| Adjusted EBITDA | $ | 304 | $ | 372 | -18.2 | % | ||||||
| Margin (%) | 12.8 | % | 17.3 | % | -4.5 p.p. | |||||||
| Adjusted Operating Income | $ | 246 | $ | 331 | -25.7 | % | ||||||
| Margin (%) | 10.3 | % | 15.4 | % | -5.1 p.p. | |||||||
| JBS Australia |
| First Quarter | ||||||||||||
| IFRS - US$ Million | 2026 | 2025 | Var % | |||||||||
| Net Sales | $ | 2,145 | $ | 1,622 | 32.3 | % | ||||||
| Cost of Sales | $ | (1,901 | ) | $ | (1,371 | ) | 38.6 | % | ||||
| Gross Profit | $ | 244 | $ | 250 | -2.6 | % | ||||||
| Adjusted EBITDA | $ | 133 | $ | 160 | -17.2 | % | ||||||
| Margin (%) | 6.2 | % | 9.9 | % | -3.7 p.p. | |||||||
| Adjusted Operating Income | $ | 99 | $ | 131 | -24.3 | % | ||||||
| Margin (%) | 4.6 | % | 8.1 | % | -3.5 p.p. | |||||||
| First Quarter | ||||||||||||
| USGAAP¹ - US$ Million | 2026 | 2025 | Var % | |||||||||
| Net Sales | $ | 2,145 | $ | 1,622 | 32.3 | % | ||||||
| Cost of Sales | $ | (1,971 | ) | $ | (1,432 | ) | 37.6 | % | ||||
| Gross Profit | $ | 174 | $ | 190 | -8.3 | % | ||||||
| Adjusted EBITDA | $ | 152 | $ | 169 | -10.0 | % | ||||||
| Margin (%) | 7.1 | % | 10.4 | % | -3.3 p.p. | |||||||
| Adjusted Operating Income | $ | 129 | $ | 149 | -13.3 | % | ||||||
| Margin (%) | 6.0 | % | 9.2 | % | -3.2 p.p. | |||||||
| JBS USA Pork |
| First Quarter | ||||||||||||
| IFRS - US$ Million | 2026 | 2025 | Var % | |||||||||
| Net Sales | $ | 2,032 | $ | 2,002 | 1.5 | % | ||||||
| Cost of Sales | $ | (1,632 | ) | $ | (1,634 | ) | -0.1 | % | ||||
| Gross Profit | $ | 400 | $ | 368 | 8.8 | % | ||||||
| Adjusted EBITDA | $ | 274 | $ | 247 | 10.8 | % | ||||||
| Margin (%) | 13.5 | % | 12.4 | % | 1.1 p.p. | |||||||
| Adjusted Operating Income | $ | 207 | $ | 179 | 15.7 | % | ||||||
| Margin (%) | 10.2 | % | 8.9 | % | 1.3 p.p. | |||||||
| First Quarter | ||||||||||||
| USGAAP¹ - US$ Million | 2026 | 2025 | Var % | |||||||||
| Net Sales | $ | 2,032 | $ | 2,002 | 1.5 | % | ||||||
| Cost of Sales | $ | (1,817 | ) | $ | (1,771 | ) | 2.6 | % | ||||
| Gross Profit | $ | 215 | $ | 231 | -6.8 | % | ||||||
| Adjusted EBITDA | $ | 204 | $ | 223 | -8.5 | % | ||||||
| Margin (%) | 10.0 | % | 11.1 | % | -1.1 p.p. | |||||||
| Adjusted Operating Income | $ | 156 | $ | 177 | -11.9 | % | ||||||
| Margin (%) | 7.7 | % | 8.8 | % | -1.1 p.p. | |||||||
| (1) | USGAAP (non-audited) |
4
CONSOLIDATED CONDENSED STATEMENTS OF INCOME
(In millions, except per share data)
(Unaudited)
| First Quarter | ||||||||
| 2026 | 2025 | |||||||
| Net Sales | $ | 21,608.6 | $ | 19,526.5 | ||||
| Cost of Sales | (19,284.0 | ) | (16,902.0 | ) | ||||
| Gross Profit | 2,324.6 | 2,624.6 | ||||||
| Selling expenses | (1,302.5 | ) | (1,187.6 | ) | ||||
| General and administrative expenses | (555.6 | ) | (556.4 | ) | ||||
| Other income(expenses) | 18.1 | 2.4 | ||||||
| Net Operating Expenses | (1,840.1 | ) | (1,741.6 | ) | ||||
| Operating Income | 484.5 | 882.9 | ||||||
| Finance Income | 172.2 | 235.7 | ||||||
| Finance Expense | (486.4 | ) | (427.2 | ) | ||||
| Net Finance Expense | (314.2 | ) | (191.5 | ) | ||||
| Share of profit of equity-accounted investees, net of tax | 138.4 | 2.7 | ||||||
| Profit (Loss) Before Taxes | 308.7 | 694.1 | ||||||
| Current Income Taxes | (33.8 | ) | (224.8 | ) | ||||
| Deferred Income Taxes | (33.3 | ) | 87.0 | |||||
| Total Income Taxes | (67.1 | ) | (137.8 | ) | ||||
| Effective Rate | (21.7 | )% | (19.8 | )% | ||||
| Net Income (Loss) | 241.6 | 556.3 | ||||||
| Attributable to: | ||||||||
| Company shareholders | 220.6 | 500.2 | ||||||
| Non-controlling interest | 21.0 | 56.1 | ||||||
| Earnings per Share (US$) | $ | 0.21 | $ | 0.47 | ||||
| First Quarter | ||||||||||||
| IFRS - US$ Million | 2026 | 2025 | Var % | |||||||||
| Adjusted EBITDA | $ | 1,133.3 | $ | 1,527.7 | -25.8 | % | ||||||
| Margin (%) | 5.2 | % | 7.8 | % | -2.6 p.p. | |||||||
| Adjusted Operating Income | $ | 515.8 | $ | 992.1 | -48.0 | % | ||||||
| Margin (%) | 2.4 | % | 5.1 | % | -2.7 p.p. | |||||||
| First Quarter | ||||||||||||
| USGAAP¹ - US$ Million | 2026 | 2025 | Var % | |||||||||
| Adjusted EBITDA | $ | 916.5 | $ | 1,312.4 | -30.2 | % | ||||||
| Margin (%) | 4.2 | % | 6.7 | % | -2.5 p.p. | |||||||
| Adjusted Operating Income | $ | 543.9 | $ | 998.6 | -45.5 | % | ||||||
| Margin (%) | 2.5 | % | 5.1 | % | -2.6 p.p. | |||||||
| (1) | USGAAP (non-audited) |
5
CONSOLIDATED CONDENSED BALANCE SHEETS
(In
millions)
(Unaudited)
| March 31, 2026 | December 31, 2025 | |||||||
| Assets | ||||||||
| Current Assets: | ||||||||
| Cash and cash equivalents | $ | 3,294.8 | $ | 4,565.1 | ||||
| Margin Cash | 158.8 | 159.6 | ||||||
| Trade accounts receivable | 3,877.4 | 4,231.9 | ||||||
| Inventories | 6,761.3 | 6,107.2 | ||||||
| Biological assets | 1,874.4 | 1,826.8 | ||||||
| Recoverable taxes | 995.6 | 957.2 | ||||||
| Derivative assets | 144.7 | 155.6 | ||||||
| Dividends receivable | 2.6 | 1.5 | ||||||
| Other current assets | 507.9 | 433.4 | ||||||
| Total Current Assets | 17,617.5 | 18,438.2 | ||||||
| Non Current Assets: | ||||||||
| Long-term Investments | 49.2 | 45.8 | ||||||
| Recoverable taxes | 2,011.5 | 1,874.6 | ||||||
| Biological assets | 633.5 | 611.8 | ||||||
| Related party receivables | 31.4 | 41.2 | ||||||
| Deferred income taxes | 539.6 | 547.0 | ||||||
| Other non-current assets | 509.2 | 488.8 | ||||||
| 3,774.5 | 3,609.2 | |||||||
| Investments in equity-accounted investees | 293.9 | 171.6 | ||||||
| Property, plant and equipment | 14,102.8 | 13,645.7 | ||||||
| Right of use assets | 1,617.9 | 1,613.6 | ||||||
| Intangible assets | 1,806.9 | 1,825.6 | ||||||
| Goodwill | 5,966.7 | 5,852.6 | ||||||
| Total Non Current Assets | 27,562.8 | 26,718.3 | ||||||
| Total Assets | $ | 45,180.3 | $ | 45,156.5 | ||||
| March 31, 2026 | December 31, 2025 | |||||||
| Liabilities and Equity | ||||||||
| Current Liabilities: | ||||||||
| Trade accounts payable | $ | 5,453.3 | $ | 6,198.1 | ||||
| Supply chain finance | 1,156.5 | 1,134.5 | ||||||
| Loans and financing | 840.1 | 833.1 | ||||||
| Income taxes | 163.7 | 288.0 | ||||||
| Other taxes payable | 159.1 | 153.0 | ||||||
| Payroll and social charges | 1,291.6 | 1,560.2 | ||||||
| Lease liabilities | 365.4 | 354.9 | ||||||
| Dividends payable | 1,071.3 | - | ||||||
| Provisions for legal proceedings | 231.2 | 159.2 | ||||||
| Derivative liabilities | 126.7 | 156.4 | ||||||
| Other current liabilities | 861.7 | 704.5 | ||||||
| Total Current Liabilities | 11,720.5 | 11,541.8 | ||||||
| Non Current Liabilities: | ||||||||
| Loans and financings | 20,524.9 | 20,257.5 | ||||||
| Income and other taxes payable | 420.4 | 407.7 | ||||||
| Payroll and social charges | 305.3 | 288.1 | ||||||
| Lease liabilities | 1,416.8 | 1,412.4 | ||||||
| Deferred income taxes | 1,199.2 | 1,169.3 | ||||||
| Provisions for legal proceedings | 219.0 | 209.4 | ||||||
| Related party payable | 176.2 | 191.0 | ||||||
| Derivative liabilities | 87.4 | 114.4 | ||||||
| Other non-current liabilities | 50.0 | 42.2 | ||||||
| Total Non Current Liabilities | 24,399.1 | 24,091.9 | ||||||
| Equity: | ||||||||
| Share capital - common shares | 41.6 | 35.1 | ||||||
| Reserves | 7,970.6 | 6,582.7 | ||||||
| Undistributed results | 220.6 | 2,085.8 | ||||||
| Attributable to company shareholders | 8,232.8 | 8,703.6 | ||||||
| Attributable to non-controlling interest | 827.9 | 819.2 | ||||||
| Total Equity | 9,060.7 | 9,522.8 | ||||||
| Total Liabilities and Equity | $ | 45,180.3 | $ | 45,156.5 | ||||
6
CONSOLIDATED CONDENSED STATEMENTS OF CASH FLOWS
(In millions)
(Unaudited)
| First Quarter | ||||||||
| 2026 | 2025 | |||||||
| Net income | $ | 241.6 | $ | 556.3 | ||||
| Adjustments for: | ||||||||
| Depreciation and amortization | 617.5 | 535.6 | ||||||
| Expected credit losses | 2.7 | 12.9 | ||||||
| Share of profit of equity-accounted investees | (138.4 | ) | (2.7 | ) | ||||
| (Gain) loss on assets sales | (12.7 | ) | (10.8 | ) | ||||
| Taxes expense | 67.1 | 137.8 | ||||||
| Net finance expense | 314.2 | 191.5 | ||||||
| Share-based compensation | 6.1 | 7.0 | ||||||
| Provisions for legal procedings | 24.8 | 14.0 | ||||||
| Impairment of goodwill and property, plant and equipment | - | 6.2 | ||||||
| Net realizable value inventory adjustments | 15.8 | 17.1 | ||||||
| Fair value adjustment of biological assets | (24.8 | ) | 9.2 | |||||
| DOJ (Department of Justice) and antitrust agreements | 24.6 | 79.5 | ||||||
| 1,138.5 | 1,553.8 | |||||||
| Changes in assets and liabilities: | ||||||||
| Trade accounts receivable | 331.1 | 236.9 | ||||||
| Inventories | (582.4 | ) | (640.9 | ) | ||||
| Recoverable taxes | 2.6 | 42.0 | ||||||
| Other current and non-current assets | 7.8 | (288.5 | ) | |||||
| Biological assets | (183.0 | ) | (191.3 | ) | ||||
| Trade accounts payable and supply chain finance | (799.3 | ) | (547.4 | ) | ||||
| Taxes paid in installments | (14.3 | ) | (6.9 | ) | ||||
| Other current and non-current liabilities | (178.4 | ) | (68.5 | ) | ||||
| DOJ and Antitrust agreements payment | 47.3 | (139.7 | ) | |||||
| Income taxes paid | (218.5 | ) | (234.3 | ) | ||||
| Changes in operating assets and liabilities | (1,587.0 | ) | (1,838.6 | ) | ||||
| Cash provided by operating activities | (448.5 | ) | (284.8 | ) | ||||
| Interest paid | (366.8 | ) | (311.5 | ) | ||||
| Interest received | 26.1 | 41.8 | ||||||
| Cash net of interest provided by (used in) operating activities | (789.3 | ) | (554.5 | ) | ||||
| Cash flow from investing activities: | ||||||||
| Purchases of property, plant and equipment | (566.4 | ) | (264.7 | ) | ||||
| Purchases and disposals of intangible assets | (5.0 | ) | (2.7 | ) | ||||
| Proceeds from sale of property, plant and equipment | 28.7 | 21.9 | ||||||
| Additional/Acquistion investments in equity-accounted investees | 26.4 | - | ||||||
| Dividends received | - | 1.9 | ||||||
| Related party transactions | 1.7 | - | ||||||
| Cash provided by (used in) investing activities | (514.7 | ) | (243.5 | ) | ||||
| Cash flow from financing activities: | ||||||||
| Proceeds from loans and financings | 533.0 | 2,181.0 | ||||||
| Payments of loans and financings | (434.9 | ) | (1,750.7 | ) | ||||
| Derivative instruments received (settled) | (20.2 | ) | (8.9 | ) | ||||
| Dividends paid | - | (379.5 | ) | |||||
| Dividends paid to non-controlling interest | (1.8 | ) | (0.9 | ) | ||||
| Margin Cash | (31.4 | ) | 22.2 | |||||
| Payments of leasing contracts | (111.0 | ) | (98.3 | ) | ||||
| Disposal of treasury shares | 1.2 | - | ||||||
| Others | (2.8 | ) | - | |||||
| Cash provided by (used in) financing activities | (67.7 | ) | (35.0 | ) | ||||
| Effect of exchange rate changes on cash and cash equivalents | 101.4 | 45.3 | ||||||
| Net change in cash and cash equivalents | (1,270.3 | ) | (787.7 | ) | ||||
| Cash and cash equivalents at the beggining of period | 4,565.1 | 5,613.7 | ||||||
| Cash and cash equivalents at the end of period | $ | 3,294.8 | $ | 4,826.0 | ||||
7
Adjusted EBITDA IFRS to USGAAP (non-audited) Reconciliations
(In
millions)
(Unaudited)
| Adjusted EBITDA 1Q26 | ||||||||||||||||||||||||||||||||
| JBS Beef North America | PPC | JBS Brazil | Seara | JBS USA Pork | Australia | Miscellaneous | Total | |||||||||||||||||||||||||
| Adjusted EBITDA IFRS | $ | (266.8 | ) | $ | 449.7 | $ | 167.7 | $ | 369.3 | $ | 274.1 | $ | 132.8 | $ | 6.6 | $ | 1,133.3 | |||||||||||||||
| Leasing adjustments | (14.9 | ) | (21.8 | ) | (4.1 | ) | (11.5 | ) | (21.8 | ) | (13.8 | ) | (0.6 | ) | (88.5 | ) | ||||||||||||||||
| Inventory adjustments at market value | 52.0 | - | - | - | 0.6 | - | - | 52.6 | ||||||||||||||||||||||||
| Biological assets adjustments | - | (120.0 | ) | 8.4 | (53.4 | ) | (49.1 | ) | 32.9 | - | (181.1 | ) | ||||||||||||||||||||
| Other adjustments | (0.2 | ) | 0.4 | - | - | - | - | 0.0 | 0.2 | |||||||||||||||||||||||
| Adjusted EBITDA USGAAP1 | $ | (229.9 | ) | $ | 308.1 | $ | 172.0 | $ | 304.4 | $ | 203.8 | $ | 151.9 | $ | 6.1 | $ | 916.5 | |||||||||||||||
| Adjusted EBITDA 1Q25 | ||||||||||||||||||||||||||||||||
| JBS Beef North America | PPC | JBS Brazil | Seara | JBS USA Pork | Australia | Miscellaneous | Total | |||||||||||||||||||||||||
| Adjusted EBITDA IFRS | $ | (100.5 | ) | $ | 660.2 | $ | 131.1 | $ | 425.7 | $ | 247.3 | $ | 160.4 | $ | 3.6 | $ | 1,527.7 | |||||||||||||||
| Leasing adjustments | (14.8 | ) | (19.7 | ) | (4.4 | ) | (15.7 | ) | (25.4 | ) | (12.3 | ) | (0.7 | ) | (93.0 | ) | ||||||||||||||||
| Inventory adjustments at market value | 2.3 | - | - | - | 6.0 | - | - | 8.3 | ||||||||||||||||||||||||
| Biological assets adjustments | - | (107.7 | ) | (1.5 | ) | (37.9 | ) | (5.1 | ) | 20.7 | - | (131.4 | ) | |||||||||||||||||||
| Other adjustments | 0.1 | 0.4 | - | - | - | - | 0.3 | 0.8 | ||||||||||||||||||||||||
| Adjusted EBITDA USGAAP1 | $ | (112.9 | ) | 533.2 | $ | 125.2 | $ | 372.1 | $ | 222.7 | $ | 168.8 | $ | 3.2 | $ | 1,312.4 | ||||||||||||||||
| (1) | USGAAP (non-audited) |
Adjusted Operating Income IFRS to USGAAP (non-audited) Reconciliations
(In millions)
(Unaudited)
| Adjusted Operating Income (Loss) 1Q26 | ||||||||||||||||||||||||||||||||
| JBS Beef North America | PPC | JBS Brazil | Seara | JBS USA Pork | Australia | Miscellaneous | Total | |||||||||||||||||||||||||
| Adjusted Operating Income IFRS | $ | (328.9 | ) | $ | 192.8 | $ | 101.3 | $ | 248.4 | $ | 207.3 | $ | 98.8 | $ | (3.9 | ) | $ | 515.8 | ||||||||||||||
| Leasing adjustments | (2.6 | ) | (3.3 | ) | (3.6 | ) | (2.2 | ) | (3.1 | ) | (2.6 | ) | (0.0 | ) | (17.4 | ) | ||||||||||||||||
| Inventory adjustments at market value | 52.0 | - | - | - | 0.6 | - | - | 52.6 | ||||||||||||||||||||||||
| Biological assets adjustments | - | - | 8.6 | - | (49.1 | ) | 32.9 | - | (7.5 | ) | ||||||||||||||||||||||
| Other adjustments | 0.0 | 0.1 | - | - | - | - | 0.3 | 0.4 | ||||||||||||||||||||||||
| Adjusted Operating Income USGAAP1 | $ | (279.4 | ) | $ | 189.7 | $ | 106.4 | $ | 246.2 | $ | 155.6 | $ | 129.2 | $ | (3.7 | ) | $ | 543.9 | ||||||||||||||
| Adjusted Operating Income (Loss) 1Q25 | ||||||||||||||||||||||||||||||||
| JBS Beef North America | PPC | JBS Brazil | Seara | JBS USA Pork | Australia | Miscellaneous | Total | |||||||||||||||||||||||||
| Adjusted Operating Income IFRS | $ | (158.3 | ) | $ | 430.6 | $ | 79.6 | $ | 336.7 | $ | 179.1 | $ | 130.6 | $ | (6.2 | ) | $ | 992.1 | ||||||||||||||
| Leasing adjustments | (2.8 | ) | (2.8 | ) | (0.5 | ) | (5.3 | ) | (3.3 | ) | (2.3 | ) | (0.0 | ) | (17.0 | ) | ||||||||||||||||
| Inventory adjustments at market value | 2.3 | - | - | - | 6.0 | - | - | 8.3 | ||||||||||||||||||||||||
| Biological assets adjustments | - | - | (1.5 | ) | - | (5.1 | ) | 20.7 | - | 14.1 | ||||||||||||||||||||||
| Other adjustments | 0.4 | 0.9 | - | - | - | - | (0.2 | ) | 1.1 | |||||||||||||||||||||||
| Adjusted Operating Income USGAAP1 | $ | (158.4 | ) | $ | 428.7 | $ | 77.6 | $ | 331.4 | $ | 176.6 | $ | 149.0 | $ | (6.4 | ) | $ | 998.6 | ||||||||||||||
| (1) | USGAAP (non-audited) |
8
EBITDA to Adjusted EBITDA and Free Cash Flow Reconciliation
(In millions)
| First Quarter | Twelve Months Ended | |||||||||||||||
| 2026 | 2025 | 1Q26 | 1Q25 | |||||||||||||
| Profit before Taxes | $ | 308.7 | $ | 694.1 | $ | 2,234.9 | $ | 3,037.5 | ||||||||
| Share of profit of equity-accounted investees, net of tax | (138.4 | ) | (2.7 | ) | (152.6 | ) | (12.2 | ) | ||||||||
| Net finance results | 314.2 | 191.5 | 1,678.9 | 1,512.6 | ||||||||||||
| (+) Depreciation and amortization | 617.5 | 535.6 | 2,390.4 | 2,180.7 | ||||||||||||
| EBITDA | $ | 1,102.0 | $ | 1,418.6 | $ | 6,151.6 | $ | 6,718.5 | ||||||||
| Adjustments to EBITDA: | ||||||||||||||||
| Other operating income (expense), net | $ | 3.4 | $ | 6.4 | $ | 38.1 | $ | 37.3 | ||||||||
| Tax Assesment Notice | - | - | 43.2 | - | ||||||||||||
| Reestructuring | 2.8 | 17.0 | 19.2 | 97.6 | ||||||||||||
| Impairment of assets | - | 5.7 | 15.5 | 5.7 | ||||||||||||
| Antitrust agreements | 24.6 | 79.5 | 127.4 | 328.6 | ||||||||||||
| Donations and Social Programs | 0.5 | 0.5 | 1.8 | 13.2 | ||||||||||||
| Rio Grande do Sul claim | - | - | - | 19.3 | ||||||||||||
| Fiscal payments and installments | - | - | 2.4 | 81.8 | ||||||||||||
| Extemporaneous litigation | - | - | 20.7 | 61.0 | ||||||||||||
| Reversal of tax credits | - | - | - | 58.7 | ||||||||||||
| Avian influenza | - | - | 17.1 | - | ||||||||||||
| Total Adjusted EBITDA | $ | 1,133.3 | $ | 1,527.7 | $ | 6,437.0 | $ | 7,421.6 | ||||||||
| (-) Depreciation and amortization | 617.5 | 535.6 | 2,390.4 | 2,180.7 | ||||||||||||
| Adjusted Operating Income (IFRS) | $ | 515.8 | $ | 992.1 | $ | 4,046.6 | $ | 5,240.9 | ||||||||
| Total Gross Debt | 21,365.0 | 19,925.4 | 21,365.0 | 19,925.4 | ||||||||||||
| (-) Cash and Equivalents | 3,294.8 | 4,826.0 | 3,294.8 | 4,826.0 | ||||||||||||
| (-) Cash Margin | 158.8 | 347.1 | 158.8 | 347.1 | ||||||||||||
| (-) Financial Investments | 49.2 | - | 49.2 | - | ||||||||||||
| Total Net Debt | $ | 17,862.1 | $ | 14,752.3 | $ | 17,862.1 | $ | 14,752.3 | ||||||||
| Ratio Calculations: | ||||||||||||||||
| Gross Debt/Adjusted EBITDA | 3.32x | 2.68x | ||||||||||||||
| Net Debt/Adjusted EBITDA | 2.77x | 1.99x | ||||||||||||||
| First Quarter | ||||||||
| 2026 | 2025 | |||||||
| Cash provided by operating activities | $ | (448.5 | ) | $ | (284.8 | ) | ||
| Interest paid and received | (340.8 | ) | (269.7 | ) | ||||
| Purchases of property, plant and equipment | (566.4 | ) | (264.7 | ) | ||||
| Payments of leasing contracts | (111.0 | ) | (98.3 | ) | ||||
| Free Cash Flow | $ | (1,466.7 | ) | $ | (917.5 | ) | ||
9
Net Debt Bridge and Proforma Debt Amortization Schedule
(In millions)
(Unaudited)
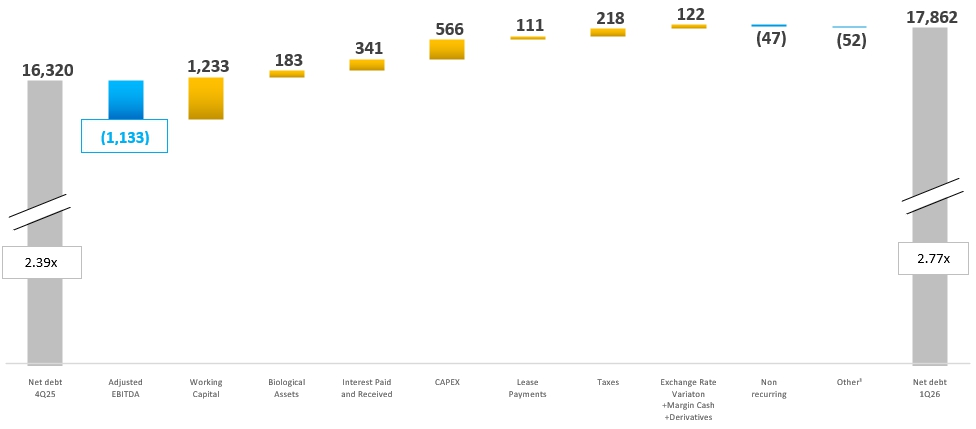
| (1) | Considering acquisitions, non-cash items and Others. |
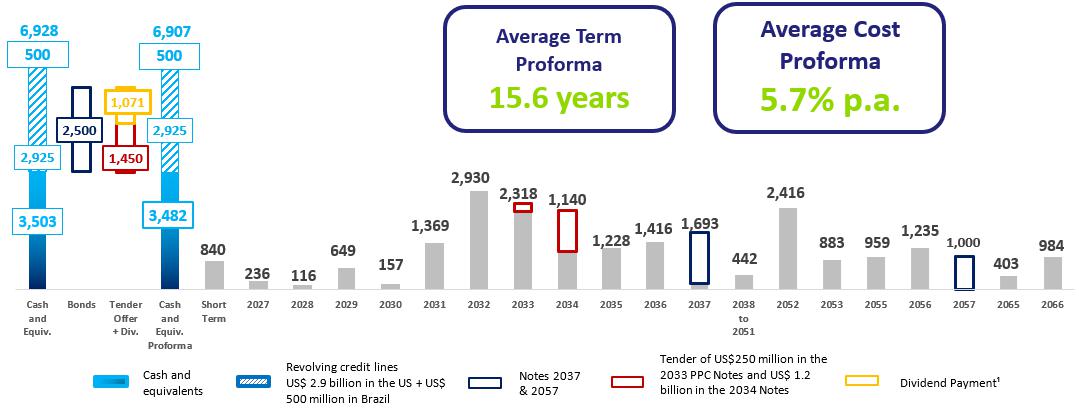
| (1) | Dividends to be paid in June, 2026. |
10
ROE, ROIC and Interest Coverage Reconciliation
(In millions)
(Unaudited)
| Last twelve months ended March 31, | ||||||||
| 2026 | 2025 | |||||||
| Net Income LTM (A) | $ | 1,915.0 | $ | 2,159.1 | ||||
| Average Shareholder Equity (B) | $ | 8,658.4 | $ | 8,940.4 | ||||
| Current Shareholder Equity | $ | 9,060.7 | $ | 8,256.1 | ||||
| Previous Year Shareholder Equity | $ | 8,256.1 | $ | 9,624.7 | ||||
| ROE (A/B) | 22.1 | % | 24.1 | % | ||||
| Last twelve months ended March 31, | ||||||||
| 2026 | 2025 | |||||||
| NOPAT (A) | $ | 3,726.8 | $ | 4,362.6 | ||||
| Adjusted Operating Income (IFRS) | $ | 4,046.6 | $ | 5,240.9 | ||||
| Taxes | $ | -319.8 | $ | -878.4 | ||||
| Average Net Debt (B) | $ | 16,307.2 | $ | 15,309.1 | ||||
| Current Net Debt | $ | 17,862.1 | $ | 14,752.3 | ||||
| Previous Year Net Debt | $ | 14,752.3 | $ | 15,865.9 | ||||
| Average Shareholder Equity (C) | $ | 8,658.4 | $ | 8,940.4 | ||||
| Current Shareholder Equity | $ | 9,060.7 | $ | 8,256.1 | ||||
| Previous Year Shareholder Equity | $ | 8,256.1 | $ | 9,624.7 | ||||
| Invested Capital (B+C) | $ | 24,965.6 | $ | 24,249.5 | ||||
| ROIC [A/(B+C)] | 14.9 | % | 18.0 | % | ||||
| Last twelve months ended March 31, | ||||||||
| 2026 | 2025 | |||||||
| Total Adjusted EBITDA | $ | 6,437.0 | $ | 7,421.6 | ||||
| Net Financial Expense | $ | 1,119.6 | $ | 957.4 | ||||
| Interest Coverage | 5.75x | 7.75x | ||||||
11
Conference Call Information and Other Selected Data
A conference call to discuss the Company's financial results will be held at 9 a.m. Eastern time on Wednesday, May 13, 2026. A link for the webcast of the conference call is available on the JBS Investor Relations website at https://ir.jbsglobal.com/, where a replay of the live webcast and the accompanying slides will also be available, as well as other supplemental data, such as the press release and financial information. The webcast also can be accessed by the following direct link: Click here to access.
This press release is being made in respect of JBS N.V. and its subsidiaries (collectively, the “JBS Group”).
Forward-Looking Statements
We make statements about future events that are subject to risks and uncertainties. Such statements are based on the beliefs and assumptions of our Management and information to which the Company currently has access. Statements about future events include information about our current intentions, beliefs or expectations, as well as those of the members of the Company's Board of Directors and Officers.
Forward-looking statements may include information on possible or presumed operating results, as well as statements that are preceded, followed or that include the words "believe,“ "may," "will," "continue," “expects,“ "predicts," "intends," "plans," "estimates," or similar expressions.
Forward-looking statements and information are not guarantees of performance. They involve risks, uncertainties and assumptions because they refer to future events, depending, therefore, on circumstances that may or may not occur. Future results and shareholder value creation may differ materially from those expressed or implied by the forward-looking statements. Many of the factors that will determine these results and values are beyond our ability to control or predict.
IFRS and Non-GAAP Financial Measures
This release is prepared under IFRS and also includes certain non-GAAP financial measures. These measures are not calculated in accordance with any generally accepted accounting principles (GAAP) or International Financial Reporting Standards (IFRS) and should not be viewed as substitutes for IFRS metrics such as net income, operating cash flow, or other measures of operating performance or liquidity.
We present non-GAAP financial measures to provide additional information that we believe is useful and meaningful to investors. However, such measures do not have standardized definitions and may therefore not be comparable to similarly titled measures presented by other companies. Non-GAAP financial measures should always be considered together with, and not as alternatives to, the financial results reported in accordance with IFRS as issued by the International Accounting Standards Board.
Additionally, all the numbers are unaudited in the condensed consolidated interim financial information, the consolidated US GAAP figure includes non-audited accounting GAAP adjustments in Seara and JBS Brazil, in addition to the Business Units that already report under US GAAP.
Investor Contact: ir@jbsglobal.com
Guilherme Cavalcanti (Global CFO)
Christiane Assis (IRO)
Pedro Bueno
Felipe Brindo
Vítor Figueira
Amanda Harumi
12