Exhibit 99.2
MANAGEMENT’S DISCUSSION AND ANALYSIS OF FINANCIAL CONDITION AND RESULTS OF OPERATIONS
The following Management’s Discussion and Analysis of Financial Condition and Results of Operations (this “MD&A”) contains forward-looking statements that involve risks and uncertainties. Our actual results may differ significantly from those discussed in the forward-looking statements for several reasons, including those described under “—Cautionary Statement Regarding Forward-Looking Statements” below and in the section entitled “Item 3. Key Information—D. Risk Factors” in JBS N.V.’s annual report on Form 20-F for the fiscal year ended December 31, 2025, as filed with the United States Securities and Exchange Commission (the “SEC”) on March 25, 2026 (the “Form 20-F”), and other issues discussed herein.
This MD&A should be read in conjunction with, and is qualified in its entirety by reference to: (1) JBS N.V.’s unaudited condensed consolidated interim financial information as of March 31, 2026 and for the three-month periods ended March 31, 2026 and 2025, and the related notes thereto (“unaudited interim financial statements”), which are included in Exhibit 99.1 to JBS N.V.’s current report on Form 6-K, furnished to the SEC on May 12, 2026 (the “Form 6-K”); (2) JBS N.V.’s audited consolidated financial statements as of December 31, 2025 and 2024 and for each of the years in the three-year period ended December 31, 2025, and the related notes thereto, which are included in our Form 20-F (“audited financial statements”); and (3) the information presented under the section of our Form 20-F entitled “Presentation of Financial and Other Information.”
Our audited financial statements have been prepared in accordance with International Financial Reporting Standards (IFRS) - Accounting Standards, as issued by the International Accounting Standards Board (“IASB”) (“IFRS – Accounting Standards”). Our unaudited interim financial statements have been prepared in accordance with IAS 34 – Interim Financial Reporting, as issued by the IASB.
Except where the context otherwise requires, in this MD&A:
| ● | “JBS Group,” “we,” “our,” “us,” “our company” or like terms refer to JBS N.V. and its consolidated subsidiaries. |
| ● | “JBS N.V.” refers to JBS N.V., a public limited liability company (naamloze vennootschap) under Dutch law. |
| ● | “JBS S.A.” refers to JBS S.A., a Brazilian corporation (sociedade anônima). JBS S.A. is a wholly-owned subsidiary of JBS N.V. |
| ● | “JBS USA” refers to JBS USA Holding Lux S.à r.l., a private limited liability company (société à responsabilité limitée) incorporated and existing under the laws of Luxembourg. JBS USA is an indirect wholly-owned subsidiary of JBS N.V. |
| ● | “PPC” refers to Pilgrim’s Pride Corporation, a Delaware corporation. JBS N.V. beneficially owns approximately 82% of PPC’s outstanding common stock. |
| ● | “Seara” refers to Seara Alimentos Ltda., a Brazilian limited liability company (sociedade limitada). Seara and its subsidiaries produce poultry, pork and processed foods in Brazil. Seara is an indirect wholly-owned subsidiary of JBS N.V. |
Overview
We are the largest protein company and one of the largest food companies in the world in terms of net revenue for the year ended December 31, 2025, according to Bloomberg’s Food Index and publicly available sources. Our net revenue was US$21.6 billion and US$19.5 billion for the three-month periods ended March 31, 2026 and 2025, respectively, and US$86.2 billion, US$77.2 billion and US$72.9 billion for the years ended December 31, 2025, 2024 and 2023, respectively. We recorded a net income of US$0.2 billion and US$0.6 billion for the three-month periods ended March 31, 2026 and 2025, respectively. We recorded a net income of US$2.2 billion for the year ended December 31, 2025, a net income of US$2.0 billion for the year ended December 31, 2024, and a net loss of US$0.1 billion for the year ended December 31, 2023. Our Adjusted EBITDA was US$1.1 billion and US$1.5 billion for the three-month periods ended March 31, 2026 and 2025, respectively, and US$6.8 billion, US$7.2 billion and US$3.5 billion for the years ended December 31, 2025, 2024 and 2023, respectively. Through strategic acquisitions and capital investment, we have created a diversified global platform that allows us to prepare, package and deliver fresh and frozen, value-added and branded beef, poultry, pork, fish, lamb and egg products to leading retailers and foodservice customers. We sell our products to more than 330,000 customers worldwide in approximately 197 countries on six continents.
As of March 31, 2026, we were:
| ● | the #1 global beef producer in terms of capacity, according to Nebraska Public Media, with operations in the United States, Australia, Canada and Brazil and an aggregate daily processing capacity of more than 78,000 heads of cattle; |
| ● | the #1 global poultry producer in terms of capacity, with operations in the United States, Brazil, United Kingdom, Mexico, Puerto Rico and Europe, and an aggregate daily processing capacity of more than 14.0 million chickens according to WATT Poultry, a global resource for the poultry meat industries; |
| ● | the #2 largest global pork producer in terms of capacity, with operations in the United States, Brazil, the United Kingdom, Australia and Europe, and an aggregate daily processing capacity of more than 149,000 hogs according to WATT Poultry; |
| ● | a leading lamb producer in terms of capacity, according to Levante, with operations in Australia and Europe and an aggregate daily processing capacity of more than 23,500 heads; |
| ● | a leading regional fish producer in terms of capacity, according to Forbes, with operations in Australia and an aggregate daily processing capacity of approximately 200 tons; |
| ● | a leading table eggs producer in Brazil, with operation in six Brazilian states, and an aggregate capacity of approximately 4 billion table eggs per year; and |
| ● | a significant global producer of value-added and branded meat products. |
We primarily sell protein products, which include fresh and frozen cuts of beef, pork, lamb, fish, whole chickens, chicken parts and egg, to retailers (such as supermarkets, club stores and other retail distributors), and foodservice companies (such as restaurants, hotels, foodservice distributors and additional processors). Our food products are marketed under a variety of national and regional brands, including: in North America, “Swift,” “Just Bare,” “Pilgrim’s Pride,” “1855,” “Grass Run Garm,” “Gold Kist Farms,” “Gold’n Plump,” “Del Dia,” “La Herencia,” “Mantiqueira,” “Principe,” “Sampco” and premium brands “Sunnyvalley,” and “Imperial American Wagiu Beef;” in Brazil, “Swift,” “Seara,” “Friboi,” “Maturatta,” “Massa Leve,” “Marba,” “Doriana,” “Delícia,” “Primor,” “Incrível,” “Rezende,” “Mantiqueira,” and premium brands “1953 Friboi,” “Black Friboi,” “Seara Gourmet,” “Hans” and “Eder”; in Australia, “Swift” and “Great Southern”; and in Europe, “Moy Park,” “Richmond,” “Fridge Riders,” “Denny,” “Rollover” and “Oak House Foods”. We also produce value-added and branded products marketed, primarily under our portfolio of widely recognized consumer brands in some of our key markets, including “Seara” in Brazil, “Primo,” “Rivalea” and “Huon” in Australia and “Beehive” in New Zealand.
2
We are geographically diversified, with production facilities strategically located to optimize both raw material supply and proximity to consumer markets. In the three-month period ended March 31, 2026, the United States accounted for the largest share of our net revenue, in terms of production, representing 51%, followed by Brazil at 28%, as detailed in the table below.
| For the three-month period ended March 31, 2026 | ||||||||
| US$ | % | |||||||
| (in millions of U.S. dollars, unless otherwise indicated) | ||||||||
| United States of America | 10,918.4 | 50.5 | % | |||||
| Mexico and Canada | 1,602.7 | 7.4 | % | |||||
| Brazil | 5,983.7 | 27.7 | % | |||||
| Australia | 1,858.8 | 8.6 | % | |||||
| Europe | 1,652.4 | 7.6 | % | |||||
| Minor regions | 186.7 | 0.9 | % | |||||
| Total | 22,202.8 | 102.7 | % | |||||
| Intercompany elimination | (594.1 | ) | (2.7 | )% | ||||
| Total | 21,608.6 | 100.0 | % | |||||
In terms of consumption, in the three-month periods ended March 31, 2026 and 2025 and in the year ended December 31, 2025, we generated 75%, 75% and 74% of our net revenue from sales in the countries where we operate our facilities, which we classify as domestic sales, and 25%, 25% and 26% of our net revenue represented export sales. The United States, Brazil and Australia are leading exporters of protein to many fast-growing markets, including Asia, Africa and the Middle East. Asia represented 48%, 43% and 50% of our net revenue from export sales in the three-month periods ended March 31, 2026 and 2025 and in the year ended December 31, 2025, respectively, primarily from sales in China, Japan and South Korea. Africa and the Middle East collectively represented 12%, 13% and 12% of our net revenue from export sales in the three-month periods ended March 31, 2026 and 2025 and in the year ended December 31, 2025, respectively.
Reportable Segments
Our management has defined our operating segments based on the reports that are used to make strategic decisions, analyzed by our chief operating decision maker, who is our chief executive officer. We operate in the following seven reportable business segments: (1) Brazil; (2) Seara; (3) Beef North America; (4) Pork USA; (5) Pilgrim’s Pride; (6) Australia; and (7) Miscellaneous. For additional information, see note 25 to our unaudited interim financial statements, which are included in our Form 6-K, and note 25 to our audited financial statements, which are included in our Form 20-F, and “Item 4. Information on the Company—B. Business Overview—Description of Business Segments” in our Form 20-F. Each segment’s operating performance is evaluated by our chief operating decision maker based on Adjusted EBITDA. See “—Reconciliation of Adjusted EBITDA” below for more information about Adjusted EBITDA, including a reconciliation of Adjusted EBITDA to net income (loss).
Description of Main Consolidated Statement of Income Line Items
Net Revenue
The vast majority of our net revenue is derived from contracts which are based upon a customer ordering our products. Net revenues are recognized when there is a contract with the customer, the transaction price is reliably measurable and when the control over the goods sold is transferred to the customer. We account for a contract, which may be verbal or written, when it is approved and committed by both parties, the rights of the parties are identified along with payment terms, the contract has commercial substance and collectability is probable. While there may be master agreements, the contract is only established when the customer’s order is accepted by us.
We evaluate the transaction for distinct performance obligations, which are the sale of our products to customers. Each performance obligation is recognized based upon a pattern of recognition that reflects the transfer of control to the customer at a point in time, which is upon destination (customer location or port of destination), which depicts the transfer of control and recognition of net revenue. There are instances of customer pick-up at our facility, in which case control transfers to the customer at that point and we recognize net revenue. Our performance obligations are typically fulfilled within days to weeks of the acceptance of the order.
3
The measurability of the transaction price can be impacted by variable consideration (i.e., discounts, rebates, incentives and the customer’s right to return products). Some or all of the estimated amount of variable consideration is included in the transaction price but only to the extent that it is highly probable a significant reversal in the amount of cumulative net revenue recognized will not occur when the uncertainty associated with the variable consideration is subsequently resolved. This varies from customer to customer according to the terms of sale. However, due to the nature of our business, there is minimal variable consideration.
Allocating the transaction price to a specific performance obligation based upon the relative standalone selling prices includes estimating the standalone selling prices including discounts and variable consideration.
Shipping and handling activities are performed before a customer obtains control of the goods and its obligation is fulfilled upon transfer of the goods to a customer. Shipping and handling costs are recorded within cost of sales. We can incur incremental costs to obtain or fulfill a contract, such as payment of commissions, which are not expected to be recovered. The amortization period for such expenses is less than one year; therefore, the costs are expensed as incurred and included in deductions from sales.
We receive payments from customers based on terms established with the customer. Payments are typically due within seven days of delivery for domestic accounts and 30 days for international accounts. Customer contract liabilities relate to payments received in advance of satisfying the performance obligation under the contract. Moreover, a contract liability is recognized when we have an obligation to transfer products to a customer from whom the consideration has already been received. The recognition of the contractual liability occurs at the time when the consideration is received and settled. We recognize net revenue upon fulfilling the related performance obligation. Contract liabilities are presented as advances from customers in the statement of financial position.
We disaggregate our net revenues by (i) domestic sales, which refer to sales within each geographical location and (ii) export sales, which refer to sales outside of each geographical location.
We also disaggregate our net revenues between Brazil, Seara, Beef North America, Pork USA, Pilgrim’s Pride, Australia and Miscellaneous segments to align with our segment presentation in note 25 to our unaudited interim financial statements, which are included in our Form 6-K, and note 25 to our audited financial statements, which are included in our Form 20-F.
We sell our products in the countries where we operate our facilities, which we classify as domestic sales, and elsewhere, which we classify as export sales, as follows:
| For the three-month period ended March 31, | ||||||||
| 2026 | 2025 | |||||||
| (in millions of US$) | ||||||||
| Domestic sales | 16,160.7 | 14,609.1 | ||||||
| Export sales | 5,447.9 | 4,917.5 | ||||||
| Net revenue | 21,608.6 | 19,526.5 | ||||||
Our net revenue is derived from our seven segments as set forth below.
| ● | Net Revenue from Sales of Brazil. Our Brazil segment includes all of our operating activities in Brazil, mainly represented by slaughter facilities, cold storage and meat processing, fat, feed and production of cattle by-products, such as leather, collagen and other products produced in Brazil. Net revenues are generated from the sale of products predominantly to restaurant chains, food processing companies, distributors, supermarket chains, wholesale supermarket and other significant users within the food chain. |
| ● | Net Revenue from Sales of Seara. Our Seara segment includes all the operating activities of Seara and its subsidiaries, mainly represented by chicken and pork processing, production and commercialization of food products and value-added products. Net revenues are generated from the sale of products predominantly to restaurant chains, food processing companies, distributors, supermarket chains, wholesale supermarket and other significant users within the food chain. |
4
| ● | Net Revenue from Sales of Beef North America. Our Beef North America segment includes JBS USA’s beef processing operations in North America and the plant-based businesses in Europe. This segment also sells by-products to the variety meat, feed processing, fertilizer, automotive and pet food industries and also produces value-added meat products including toppings for pizzas. Sampco LLC imports processed meats and other foods such as canned fish, fruits and vegetables to the United States and Vivera Topholding BV produces and sells plant-based protein products in Europe. |
| ● | Net Revenue from Sales of Pork USA. Our Pork USA segment includes JBS USA’s pork operations, including Swift Prepared Foods. Net revenues are generated from the sale of products predominantly to retailers of fresh pork, including trimmed cuts such as loins, roasts, chops, butts, picnics and ribs. Other pork products, including hams, bellies and trimmings, are sold predominantly to further processors who, in turn, manufacture bacon, sausage, and deli and luncheon meats. In addition, net revenues are generated from the sale of case ready products. As a complement to our pork processing business, we also conduct business through our hog production operations, including 31 hog farms and eight feed mills, from which, JBS USA will source live hogs for its pork processing operations. |
| ● | Net Revenue from Sales of Pilgrim’s Pride. Our Pilgrim’s Pride segment includes PPC’s operations, the majority of whose revenues are generated from United States, United Kingdom, Europe and Mexico sales of fresh and prepared chicken. The fresh chicken products consist of refrigerated (non-frozen) whole or cut-up chicken, either pre-marinated or non-marinated, and pre-packaged chicken in various combinations of freshly refrigerated, whole chickens and chicken parts. The prepared chicken products include portion-controlled breast fillets, tenderloins and strips, delicatessen products, salads, formed nuggets and patties and bone-in chicken parts. These products are sold either refrigerated or frozen and may be fully cooked, partially cooked or raw. In addition, these products are breaded or non-breaded and either pre-marinated or non-marinated. The segment also generates net revenue from the sale of prepared pork products through Pilgrim’s Pride Limited. The segment includes the specialty meats and ready meals businesses of Pilgrim’s Food Masters and generates net revenues from branded and private label meats, meat snacks, food-to-go products, and ethnic chilled and frozen ready meals. |
| ● | Net Revenue from Sales of Australia. Our Australia segment includes our fresh, frozen, value-added and branded beef, lamb, pork and fish products in Australia and New Zealand. The majority of our beef net revenues from our operations in Australia are generated from the sale of fresh beef products (including fresh and frozen chuck cuts, rib cuts, loin cuts, round cuts, thin meats, ground beef, offal and other products). We also sell value-added and branded beef products (including frozen cooked and pre-cooked beef, corned cooked beef, beef cubes and consumer-ready products, such as hamburgers and sausages). We also operate lamb, pork and fish processing facilities in Australia and New Zealand, as the result of the acquisitions of Huon Aquaculture Group Ltd and the Rivalea hog breeding and processing business in Australia. JBS Australia also generates net revenues through their cattle hoteling business. |
| ● | Net Revenue from Sales of Miscellaneous. Our Miscellaneous segment includes certain operations not attributable to our reportable segments set forth above, such as international leather operations and other operations in Europe. |
Cost of Sales
A significant portion of our cost of sales consists of raw materials, primarily biological assets and feed ingredients. We incur costs to (1) purchase livestock (cattle, hogs and lamb) ready for slaughter in the production of beef, pork and lamb products and (2) feed live animals (chickens, hogs and fish) for breeding and slaughter in the production of chicken, pork and fish products in our vertically-integrated operations. Raw materials costs are generally influenced by fluctuations in prices to purchase (i) livestock in the spot market or under contracts and (ii) feed ingredients, primarily corn and soy meal, which are the main feed ingredients required in our vertically integrated operations. In addition to purchasing livestock and feed ingredients, our cost of sales also consists of other production costs (including packaging and other raw materials) and labor. The key drivers of costs by segment are as follows:
| ● | Brazil. In Brazil we generally purchase cattle livestock in the spot market transactions or under contracts that fluctuate with market conditions as we do not keep or raise our own cattle. Our Brazil operations are impacted primarily by grass-fed cattle supply. Reductions in the breeding herds can affect supply, and thus costs, over a period of years. |
5
| ● | Seara. Our vertically-integrated chicken and pork operations are impacted primarily by fluctuations in the price of feed ingredients. |
| ● | Beef North America. We generally purchase cattle livestock in the spot market or under contracts that fluctuate with market conditions as we do not keep or raise our own cattle. Our beef operations are impacted primarily by fed cattle supply. Our beef business is directly affected by fluctuations in the spot market based on available supply and indirectly influenced by fluctuations in the price of feed ingredients. |
| ● | Pork USA. In North America, we generally purchase pork livestock in the spot market or under contracts that fluctuate with market conditions and we raise approximately 25% of our hogs. Our pork business is directly affected by fluctuations in the price of feed ingredients. |
| ● | Pilgrim’s Pride. Our vertically-integrated chicken operations are impacted primarily by fluctuations in the price of feed ingredients. |
| ● | Australia. Our Australian beef operations are impacted primarily by fed cattle supply, in addition to fish feed ingredients and hog prices. |
| ● | Miscellaneous. Includes certain costs and expenses related to our operations not attributable to the reportable segments, such as certain of our corporate expenses and our costs and expenses related to our international leather operations and other operations in Europe. |
Adjusted EBITDA
Adjusted EBITDA is calculated by making the following adjustments to our net income, as further described below (see “—Reconciliation of Adjusted EBITDA”): exclusion of current and deferred income taxes; exclusion of share of profit of equity-accounted investees, net of tax; exclusion of net finance expense; exclusion of depreciation and amortization expenses; exclusion of antitrust agreements expenses; exclusion of donations and social programs expenses; exclusion of impairment of assets; exclusion of restructuring expenses; exclusion of fiscal payments and installments; exclusion of Rio Grande do Sul claim losses; exclusion of extemporaneous litigation expenses; exclusion of reversal of tax credits; exclusion of avian influenza impacts; exclusion of certain tax assessment notice; and exclusion of certain other operating income (expense), net.
Operating Expenses
Our operating expenses consist primarily of:
| ● | General and Administrative Expenses. This line item primarily includes expenses relating to corporate payroll, utilities and maintenance of our corporate offices and headquarters. |
| ● | Selling Expenses. This line item includes expenses relating to advertising, freights, payment of commissions and salaries to members of our sales team and expected credit losses. |
Net Finance Expense
Net finance expense includes expenses relating to interest incurred on our indebtedness, interest income, gains and losses related to our net exposure to foreign currencies and fair value adjustments from financing and commodity-related derivative transactions.
Items Affecting Comparability of Financial Results
Acquisitions
We have a track record of acquiring and integrating operations. Through strategic acquisitions, we have built a diversified global platform, which has significantly increased our net revenues, partially due to these acquisitions.
Revenues, expenses and cash flows of acquired businesses are recorded for transactions consummated commencing after the closing date of the business acquired.
6
None of the acquisitions (individually or in the aggregate) that we completed during the periods discussed below under “—Summary of Results” is considered significant under the rules governing the inclusion of pro forma and historical financial statements in an SEC-registered offering of securities.
Currency
As a global company, our results of operations and financial condition have been, and will continue to be, exposed to foreign currency exchange rate fluctuations. The financial statements of each entity included in the consolidation are prepared using the functional currency of the main economic environment it operates.
Any depreciation or appreciation of the foreign currency exchange rate compared to an entity´s functional currency may impact our revenues, costs and expenses incurred in such functional currency or currencies other than our reporting currency, causing a monetary increase or decrease, provided that the other variables remain unchanged. In addition, a portion of our loans and financing is denominated in foreign currencies (foreign currency indicates loans denominated in a different currency from an entity´s functional currency). For this reason, any movement of the currency exchange rate compared to an entity´s functional currency may significantly increase or decrease our finance expense and our current and non-current loans and financing. Additionally, the results and financial position of all entities with a functional currency different from our functional currency (Brazilian real) have been translated to Brazilian real and then translated into the Group’s presentation currency (U.S. dollar).
Our risk management department enters into derivative instruments previously approved by our board of directors to protect financial assets and liabilities and future cash flow from commercial activities and net investments in foreign operations. Our board of directors has approved financial instruments to hedge our exposure to loans, investments, cash flows from interest payments, export estimate, acquisition of raw material, and other transactions, whenever they are quoted in currencies different than our or our subsidiaries’ functional currency. The primary exposures to exchange rate risk are in U.S. dollars, euros, British pounds, Mexican pesos and Australian dollars.
Principal Factors Affecting our Financial Condition and Results of Operations
Our results of operations have been influenced and will continue to be influenced by a variety of factors. In addition to the factors discussed below, factors that impact the results of our operations include outbreaks of livestock and poultry disease, product contamination or recalls, our ability to implement our business plan and the level of demand for our products in the countries in which we operate. Demand for our products in those countries is affected by the performance of their respective economies in terms of gross domestic product (GDP), as well as prevailing levels of employment, inflation and interest rates.
Brazil, Seara, Beef North America, Pork USA, Pilgrim’s Pride and Australia Segments
We operate globally and during the regular course of our operations are exposed to price fluctuations in feeder cattle, live cattle, lean hogs, corn, soybeans, and energy, especially in our North American, Australian and Brazilian markets. Commodity markets are characterized by volatility arising from external factors including climate, supply levels, transportation costs, agricultural policies and storage costs, among others.
Our risk management department is responsible for mapping our exposure to commodity prices and proposing strategies to our risk management committee in order to mitigate such exposure. Biological assets are a very important raw material used by us. In order to maintain future supply of these materials, we enter into forward contracts to anticipate purchases with suppliers. To complement these forward purchases, we use derivative instruments to mitigate each specific exposure, most notably futures contracts, to mitigate the impact of price fluctuations - on inventories and sales contracts. We take the historical average amount spent on materials as an indication of the operational value to be protected by firm contracts.
In addition to the above, our risk management department monitors a number of other metrics and indicators that affect our operations in our Brazil, Seara, Beef North America, Pork USA, Pilgrim’s Pride and Australia segments, including the following:
| ● | production volume; |
7
| ● | plant capacity utilization; |
| ● | sales volume; |
| ● | selling prices; |
| ● | customer demand and preferences (see “Item 3. Key Information—D. Risk Factors—Risks Relating to Our Business and Industries—Changes in consumer preferences and/or negative perception of the consumer regarding the quality and safety of our products could adversely affect our business” in our Form 20-F); |
| ● | commodity futures prices for livestock (see “Item 3. Key Information—D. Risk Factors— Risks Relating to Our Business and Industries—Our results of operations may be adversely affected by fluctuations in market prices for, and the availability of, livestock and animal feed ingredients” in our Form 20-F); |
| ● | the spread between livestock prices and selling prices for finished goods; |
| ● | utility prices and trends; |
| ● | livestock availability; |
| ● | production yield; |
| ● | seasonality; |
| ● | the economy performance of the countries where we sell our products; |
| ● | competition and industry consolidation; |
| ● | taxation; |
| ● | perceived value of our brands; |
| ● | interest rate fluctuations; |
| ● | currency exchange rate fluctuations (see “Item 3. Key Information—D. Risk Factors—Risks Relating to the Markets in Which We Operate—Our exports pose special risks to our business and operations” in our Form 20-F); and |
| ● | trade barriers, exchange controls and political risk and other risks associated with export and foreign operations (see “Item 3. Key Information—D. Risk Factors—Risks Relating to the Markets in Which We Operate—Our exports pose special risks to our business and operations” in our Form 20-F). |
Effects of the Variation of Prices for the Purchase of Raw Materials on Our Costs of Goods Sold
Our principal raw materials are livestock and feed ingredients for our chicken, pork and fish operations. Raw materials accounted for a majority of the total cost of products sold during the three-month period ended March 31, 2026 and the year ended December 31, 2025. Changes in the price of cattle, pork and feed ingredients have a direct impact on operating costs and are based on factors beyond our management’s control, such as climate, the supply volume, transportation costs, agricultural policies and others. We seek to hedge the price paid for cattle purchased through financial instruments in order to attempt to protect ourselves from price variations between their date of the purchase and their date of the delivery. Our risk management department is responsible for mapping the exposures to commodity prices of the JBS Group and proposing strategies to our risk management committee, in order to mitigate such exposures. Biological assets are a very important raw material used by us. In order to maintain future supply of these materials, we participate in forward contracts to anticipate purchases with suppliers. To complement these forward purchases, we use derivative instruments to mitigate each specific exposure, most notably futures contracts, to mitigate the impact of price fluctuations - on inventories and sales contracts. We take the historical average amount spent on materials as an indication of the operational value to be protected by firm contracts.
8
The price of cattle, pork and feed ingredients in the domestic markets has significantly fluctuated in the past, and we believe that it will continue to fluctuate over the next few years. Any increase in the price of cattle, pork and feed ingredients and, consequently, production costs may adversely impact our gross margins and our results of operations if we are not able to pass these price increases to our clients. Conversely, any decrease in the price of cattle, pork and feed ingredients and, consequently, our production costs, may positively impact our gross margins and our results of operations.
Effect of Level of Indebtedness and Interest Rates
As of March 31, 2026, our total outstanding indebtedness was US$21,365.0 million, consisting of US$840.1 million of current loans and financing and US$20,524.9 million of non-current loans and financing, representing 52.9% of our total liabilities, which totaled US$36,119.6 million as of March 31, 2026.
As of December 31, 2025, our total outstanding indebtedness was US$21,090.6 million, consisting of US$833.1 million of current loans and financing and US$20,257.5 million of non-current loans and financing, representing 59.2% of our total liabilities, which totaled US$35,633.7 million as of December 31, 2025.
The interest rates that we pay on our indebtedness depend on a variety of factors, including local and international interest rates and risk assessments of our company, our industry and the global economies.
Fluctuations in Domestic Market Prices of Fresh and Processed Products Can Significantly Affect Our Operating Revenues
Domestic market prices for fresh and processed products are generally determined in accordance with market conditions. These prices are also affected by the additional markup that retailers charge end consumers. We have negotiated these margins with each network of retailers and depending on the network, with each store individually.
Effects of Fluctuations in Export Prices of Fresh and Processed Products on Operating Revenues
Fluctuations in export prices of our raw and processed products can significantly affect our net operating income. The prices of fresh and processed products that we charge in domestic and export markets have fluctuated significantly in recent years, and we believe that these prices will continue to fluctuate in the future.
Effects of Fluctuations in Foreign Exchange Rates Currencies
As our presentation currency is the U.S. dollars and some of our entities have other currencies as their functional currency (for example the Brazilian real), all else being equal, any strengthening of the U.S. dollar against these currencies will reduce the revenues and expenses of these entities, whereas any depreciation of the U.S. dollar against these currencies will increase their revenues and expenses.
For further information on our presentation currency, functional currencies and translation of foreign currencies see “—Items Affecting Comparability of Financial Results—Currency” above.
Impacts from Russia-Ukraine, Israel-Hamas, and U.S. and Israel-Iran Conflicts
The Russia-Ukraine war began in February 2022. The impact of the ongoing war and sanctions has not been limited to businesses that operate in Russia and Ukraine and has negatively impacted and will likely continue to negatively impact other global economic markets including where we operate. The impacts have included and may continue to include, but are not limited to, higher prices for commodities, such as food products, ingredients and energy products, increasing inflation in some countries, and disrupted trade and supply chains. The conflict has disrupted shipments of grains, vegetable oils, fertilizer and energy products. Russia’s recent suspension of the Black Sea Grain Initiative, which allowed Ukraine to export grain and other food items, will likely further exacerbate rising food prices and supply chain issues if not reinstated.
9
The impact on the agriculture markets falls into two main categories: (1) the effect on Ukrainian crop production, as the region is key in global grain production; and (2) the duration of the disruption in trade flows. Safety and financing concerns in the region are restricting export execution, which is in turn forcing grain and oil demand to find alternative supply. The duration of the war and related volatility makes global markets extremely sensitive to growing-season weather in other global grain producing regions and has led to a large risk premium in futures prices. The continued volatility in the global markets as a result of the war has adversely impacted our costs by driving up prices, raising inflation and increasing pressure on the supply of feed ingredients and energy products throughout the global markets.
In addition, the U.S. government and other governments in jurisdictions in which we operate have imposed sanctions and export controls against Russia, Belarus and interests therein and threatened additional sanctions and controls. The impact of these measures, now and in the future, could adversely affect our business, supply chain or customers. See “Item 3. Key Information—D. Risk Factors—Risks Relating to the Markets in Which We Operate—Our business may be negatively impacted by economic or other consequences from conflicts, such as Russia’s war against Ukraine and Israel, the United States and Iran in the Middle East, and the sanctions imposed as a response to that actions” in our Form 20-F for additional information.
Moreover, on October 7, 2023, Hamas attacked Israel, with Israel then declaring war on Hamas in the Gaza Strip and since then, Israel has been involved in military conflicts with Hamas, Hezbollah, a terrorist organization based in Lebanon, and Iran, both directly and through proxies like the Houthi movement in Yemen and armed groups in Iraq and other terrorist organizations. Although certain ceasefire agreements have been reached, and some Iranian proxies have declared a halt to their attacks, there is no assurance that these agreements will be upheld, military activity and hostilities continue to exist at varying levels of intensity, and the situation remains volatile, with the potential for escalation into a broader regional conflict involving additional terrorist organizations and possibly other countries. In June 2025, a new round of direct hostilities broke out between Israel and Iran, involving significant missile and drone strikes exchanged between the two countries. This escalation has heightened regional instability. In October 2025, a new ceasefire went into effect under a U.S.-brokered framework, providing for the release of hostages by Hamas and prisoners by Israel, withdrawal of Israeli troops to agreed lines, and increase of humanitarian aid flows into Gaza. However, significant challenges threaten the durability of this ceasefire.
In February 2026, the United States and Israel launched coordinated military strikes against key Iranian military and infrastructure targets. This marked a significant escalation in the conflict, resulting in heightened instability across the Middle East, further disruptions to global energy markets, and increased volatility in international trade and supply chains.
Escalation or expansion of hostilities, interventions by other groups or nations, the imposition of economic sanctions, disruption of shipping transit in the Straits of Hormuz or other significant trade routes, or similar outcomes could adversely affect the international trade, our business, results of operations, financial condition and cash flows. Although we do not have manufacturing operations in the affected regions, we are monitoring the development and unfolding of the situation and its potential effects on our sector and operations. As of the date of this MD&A, no significant impacts on our business have been identified.
Impact of Inflation
Most of the countries and regions in which we operate, including the United States, Brazil, Australia, Mexico and Europe, are currently experiencing pronounced inflation. None of the locations in which we operate are experiencing hyperinflation. All segments experienced inflation in operating costs, especially in labor, freight and transportation and certain materials. We have also experienced high average sales prices impacted by the current inflationary environment. We have responded to inflationary challenges in 2023, 2024 and 2025 by continuing negotiations with customers to pass through costs increases in order to recoup the increased expenses we have experienced. We also continue to focus on operational initiatives that aim to deliver labor efficiencies, better agricultural performance and improved yields.
For more information about the risks of inflation on our operations, see “Item 3. Key Information—D. Risk Factors—Risks Relating to the Markets in Which We Operate—Deterioration of global economic conditions could adversely affect our business” and “—We are exposed to emerging and developing country risks,” —The Brazilian government exercises, and will continue to exercise, significant influence over the Brazilian economy. These influences, as well as the political and economic conditions of the country, could negatively affect our activities” and “—Our business may be negatively impacted by economic or other consequences from conflicts, such as Russia’s war against Ukraine and Israel, the United States and Iran in the Middle East, and the sanctions imposed as a response to that actions” in our Form 20-F.
10
Recent Developments
For a description of our recent developments, see notes 1.2 and 1.3 to our unaudited interim financial statements, which are included in our Form 6-K.
Overview of Results
We recorded a net income of US$241.6 million for the three-month period ended March 31, 2026, as compared to a net income of US$556.3 million for the three-month period ended March 31, 2025.
Summary of Results
Three-Month Period Ended March 31, 2026 Compared to the Three-Month Period Ended March 31, 2025
| For the three-month period ended March 31, | ||||||||||||
| 2026 | 2025 | % Change | ||||||||||
| (in millions of US$) | ||||||||||||
| Consolidated statement of income: | ||||||||||||
| Net revenue | 21,608.6 | 19,526.5 | 10.7 | % | ||||||||
| Cost of sales | (19,284.0 | ) | (16,902.0 | ) | 14.1 | % | ||||||
| Gross profit | 2,324.6 | 2,624.6 | (11.4 | )% | ||||||||
| Selling expenses | (1,302.5 | ) | (1,187.6 | ) | 9.7 | % | ||||||
| General and administrative expenses | (555.6 | ) | (556.4 | ) | (0.1 | )% | ||||||
| Other income | 41.7 | 30.3 | 37.4 | % | ||||||||
| Other expenses | (23.6 | ) | (28.0 | ) | (15.5 | )% | ||||||
| Net operating expenses | (1,840.1 | ) | (1,741.6 | ) | 5.7 | % | ||||||
| Operating profit | 484.5 | 882.9 | (45.1 | )% | ||||||||
| Finance income | 172.2 | 235.7 | (26.9 | )% | ||||||||
| Finance expense | (486.4 | ) | (427.2 | ) | 13.9 | % | ||||||
| Net finance expense | (314.2 | ) | (191.5 | ) | 64.0 | % | ||||||
| Share of profit of equity-accounted investees, net of tax | 138.4 | 2.7 | 4,960.9 | % | ||||||||
| Profit before taxes | 308.7 | 694.1 | (55.5 | )% | ||||||||
| Current income taxes | (33.8 | ) | (224.8 | ) | (85.0 | )% | ||||||
| Deferred income taxes | (33.3 | ) | 87.0 | (138.3 | )% | |||||||
| Total income taxes | (67.1 | ) | (137.8 | ) | (51.3 | )% | ||||||
| Net income | 241.6 | 556.3 | (56.6 | )% | ||||||||
11
Net Income
| For the three-month period ended March 31, | ||||||||||||||||
| 2026 | 2025 | Change | % Change | |||||||||||||
| (in millions of US$, unless otherwise indicated) | ||||||||||||||||
| Net income | 241.6 | 556.3 | (314.7 | ) | (56.6 | )% | ||||||||||
| Net margin (net income as percentage of net revenue) | 1.1 | % | 2.8 | % | 1.7 p.p. | — | ||||||||||
For the reasons described below, our net income decreased by US$314.7 million, or 56.6%, in the three-month period ended March 31, 2026, as compared to the same period in 2025. Our net margin was 1.1% for the three-month period ended March 31, 2026, compared to 2.8% for the same period in 2025.
Net Revenue
| For the three-month period ended March 31, | ||||||||||||||||
| 2026 | 2025 | Change | % Change | |||||||||||||
| (in millions of US$, unless otherwise indicated) | ||||||||||||||||
| Net revenue | 21,608.6 | 19,526.5 | 2,082.1 | 10.7 | % | |||||||||||
Our net revenue increased by US$2,082.1 million, or 10.7%, in the three-month period ended March 31, 2026, as compared to the same period in 2025. Our net revenue was positively impacted by an overall 10.5% increase in our average sales prices and by a 0.1% increase in sales volumes considering all segments. For more information, see “—Segment Results” below.
Cost of Sales
| For the three-month period ended March 31, | ||||||||||||||||
| 2026 | 2025 | Change | % Change | |||||||||||||
| (in millions of US$, unless otherwise indicated) | ||||||||||||||||
| Cost of sales | (19,284.0 | ) | (16,902.0 | ) | (2,382.0 | ) | 14.1 | % | ||||||||
| Gross profit | 2,324.6 | 2,624.6 | (300.0 | ) | (11.4 | )% | ||||||||||
| Cost of sales as percentage of net revenue | 89.2 | % | 86.6 | % | 2.6 p.p. | — | ||||||||||
Our cost of sales increased by US$2,382.0 million, or 14.1%, in the three-month period ended March 31, 2026, as compared to the same period in 2025, primarily due to a 14.7% increase in the cost of inventories, raw materials and production inputs to US$16,447.8 million in the three-month period ended March 31, 2026 from US$14,344.9 million in the same period in 2025, primarily due to the increase in the cost of cattle, which reached record levels.
12
Selling Expenses
| For the three-month period ended March 31, | ||||||||||||||||
| 2026 | 2025 | Change | % Change | |||||||||||||
| (in millions of US$, unless otherwise indicated) | ||||||||||||||||
| Selling expenses | (1,302.5 | ) | (1,187.6 | ) | (114.9 | ) | 9.7 | % | ||||||||
| Selling expenses as percentage of net revenue | 6.0 | % | 6.1 | % | (0.1) p.p. | — | ||||||||||
Our selling expenses increased by US$114.9 million, or 9.7%, in the three-month period ended March 31, 2026, as compared to the same period in 2025, primarily due to: (1) a 8.7% increase in freight and selling expenses to US$1,011.3 million in the three-month period ended March 31, 2026 from US$930.6 million in the same period in 2025, primarily due to the increase in sales volumes and fuel prices; and (2) a 14.8% increase in salaries and benefits to US$152.3 million in the three-month period ended March 31, 2026 from US$132.7 million in the same period in 2025, mainly related to increase in wages and performance bonus.
General and Administrative Expenses
| For the three-month period ended March 31, | ||||||||||||||||
| 2026 | 2025 | Change | % Change | |||||||||||||
| (in millions of US$, unless otherwise indicated) | ||||||||||||||||
| General and administrative expenses | (555.6 | ) | (556.4 | ) | 0.8 | (0.1 | )% | |||||||||
| General and administrative expenses as percentage of net revenue | 2.6 | % | 2.8 | % | (0.2) p.p. | — | ||||||||||
Our general and administrative expenses decreased by US$0.8 million, or 0.1%, in the three-month period ended March 31, 2026, as compared to the same period in 2025, primarily due to:
| ● | Salaries and benefits – Salaries and benefits increased by US$28.8 million, or 10.2%, to US$311.7 million in the three-month period ended March 31, 2026 from US$282.9 million in the same period in 2025, primarily as a result of the increase in wages and performance bonus; |
| ● | Fees, services held and general expenses – increased by US$18.3 million, or 12.4%, to US$165.7 million in the three-month period ended March 31, 2026 from US$147.4 million in the same period in 2025, primarily as a result of increased fees, mainly related to legal services; |
Partially offset by:
| ● | DOJ and antitrust agreements – DOJ and antitrust agreements decreased by US$54.9 million, to US$24.6 million in the three-month period ended March 31, 2026 from US$79.5 million in the same period in 2025, primarily as a result of addition of new agreements in relation to our Pork USA and Beef North America segments in the period ended March 31, 2025. |
13
Other Income
| For the three-month period ended March 31, | ||||||||||||||||
| 2026 | 2025 | Change | % Change | |||||||||||||
| (in millions of US$, unless otherwise indicated) | ||||||||||||||||
| Other income | 41.7 | 30.3 | 11.3 | 37.4 | % | |||||||||||
| Other income as percentage of net revenue | 0.2 | % | 0.2 | % | 0.0 p.p. | — | ||||||||||
Our other income increased by US$11.3 million, or 37.4%, in the three-month period ended March 31, 2026, as compared to the same period in 2025. This increase is mainly related to the increase in gain on the sales of assets to US$25.5 million in the three-month period ended March 31, 2026 from US$16.1 million in the same period in 2025.
Other Expenses
| For the three-month period ended March 31, | ||||||||||||||||
| 2026 | 2025 | Change | % Change | |||||||||||||
| (in millions of US$, unless otherwise indicated) | ||||||||||||||||
| Other expenses | (23.6 | ) | (28.0 | ) | 4.3 | (15.5 | )% | |||||||||
| Other expenses as percentage of net revenue | 0.1 | % | 0.1 | % | 0.0 p.p. | — | ||||||||||
Our other expenses decreased by US$4.3 million, or 15.5%, in the three-month period ended March 31, 2026, as compared to the same period in 2025, primarily due to the decrease in restructuring expenses to US$2.4 million in the three-month period ended March 31, 2026 from US$17.0 million in the same period in 2025. This decrease was partially offset by the increase in losses on asset sales, to US$21.6 million in the three-month period ended March 31, 2026 from US$4.0 million in the same period in 2025.
Net Finance Expense
| For the three-month period ended March 31, | ||||||||||||||||
| 2026 | 2025 | Change | % Change | |||||||||||||
| (in millions of US$, unless otherwise indicated) | ||||||||||||||||
| Net finance expense | (314.2 | ) | (191.5 | ) | (122.7 | ) | 64.0 | % | ||||||||
| Gains from exchange rate variation | 86.1 | 51.8 | 34.3 | 66.1 | % | |||||||||||
| Fair value adjustments on derivatives | 20.1 | 20.2 | (0.2 | ) | (0.8 | )% | ||||||||||
| Interest expense | (469.5 | ) | (414.7 | ) | (54.8 | ) | 13.2 | % | ||||||||
| Interest income | 66.0 | 163.6 | (97.6 | ) | (59.7 | )% | ||||||||||
| Bank fees and others | (16.8 | ) | (12.5 | ) | (4.4 | ) | 35.1 | % | ||||||||
Our net finance expense increased by US$122.7 million, or 64.0%, in the three-month period ended March 31, 2026, as compared to the same period in 2025, primarily due to:
| ● | Interest income – Interest income decreased by US$97.6 million, or 59.7%, in the three-month period ended March 31, 2026, as compared to the same period in 2025. This was primarily due to a decrease in interest income from financial investments, mainly as a result of a reduction in cash and cash equivalents position, and a decrease in interest rates ; |
| ● | Interest expense – Interest expense increased by US$54.8 million, or 13.2%, in the three-month period ended March 31, 2026, as compared to the same period in 2025. This was primarily due to US$47.4 million increase in interest expenses from loans and financing; |
14
Partially offset by:
| ● | Gains from exchange rate variation – Gains from exchange rate variation increased by US$34.3 million, or 66.1%, in the three-month period ended March 31, 2026, as compared to the same period in 2025. This increase was primarily driven by favorable exchange rate impacts on cash and cash equivalents and trade accounts receivable, primarily as a result of the depreciation of the U.S. dollar against the Brazilian real in the period. |
Current and Deferred Income Taxes
| For the three-month period ended March 31, | ||||||||||||||||
| 2026 | 2025 | Change | % Change | |||||||||||||
| (in millions of US$, unless otherwise indicated) | ||||||||||||||||
| Profit before taxes | 308.7 | 694.1 | (385.4 | ) | (55.5 | )% | ||||||||||
| Nominal rate | (34.00 | )% | (34.00 | )% | — | — | ||||||||||
| Expected tax expense | (105.0 | ) | (236.0 | ) | 131.0 | (55.5 | )% | |||||||||
| Current income taxes | (33.8 | ) | (224.8 | ) | 191.0 | (85.0 | )% | |||||||||
| Deferred income taxes | (33.3 | ) | 87.0 | (120.3 | ) | (138.3 | )% | |||||||||
| Total income taxes | (67.1 | ) | (137.8 | ) | 70.7 | (51.3 | )% | |||||||||
| Effective income tax rate | (21.7 | )% | (19.9 | )% | (1.8) p.p. | — | ||||||||||
The nominal tax rate for Brazilian income tax and social contribution is 34%. However, our effective tax rate may change in each period based on fluctuations in the taxable income generated by each of our foreign subsidiaries, different tax rates in countries where we operate and the tax credits generated by tax payments made by foreign subsidiaries, which can be used to offset taxes that would be paid in Brazil.
The nature and timing of the permanent differences that arise during the period also affect our effective tax rate. These permanent differences generally refer to subsidies made for investments in Brazil and abroad, differences in tax rates on foreign subsidiaries, unrecognized deferred taxes in the current year, income from untaxed interest on foreign subsidiaries and the impact of taxation on companies with dual jurisdiction.
Effective income tax rate increased by 1.8 p.p. to 21.7% in the three-month period ended March 31, 2026, compared to 19.9% in the same period in 2025.
For the three-month period ended March 31, 2026, although several subsidiaries reported profits and paid the corresponding taxes, the consolidated results were adversely impacted by losses incurred by a significant number of subsidiaries. The combination of these positive and negative results contributed to a reduction in the consolidated total taxable income in Brazil, resulting in an additional balance of taxes paid abroad.
Additionally, as JBS S.A. reported a tax loss during the period, part of the taxes paid abroad was recognized as a tax credit in the consolidated result for the period.
In this context, we recognized an income tax benefit for the three-month period ended March 31, 2026, primarily driven by the positive impact of foreign tax credits.
15
Segment Results
| For the three-month period ended March 31, | ||||||||||||||||
| 2026 | 2025 | Change | % Change | |||||||||||||
| (in millions of US$) | ||||||||||||||||
| Net revenue | ||||||||||||||||
| Brazil segment | 3,788.8 | 3,170.0 | 618.9 | 19.5 | % | |||||||||||
| Seara segment | 2,379.3 | 2,150.5 | 228.8 | 10.6 | % | |||||||||||
| Beef North America segment | 7,166.6 | 6,421.6 | 745.0 | 11.6 | % | |||||||||||
| Pork USA segment | 2,031.7 | 2,001.7 | 30.0 | 1.5 | % | |||||||||||
| Pilgrim’s Pride segment | 4,529.4 | 4,459.4 | 70.0 | 1.6 | % | |||||||||||
| Australia segment | 2,144.9 | 1,621.5 | 523.4 | 32.3 | % | |||||||||||
| Miscellaneous segment | 298.8 | 118.4 | 180.4 | 152.4 | % | |||||||||||
| Total reportable segments | 22,339.4 | 19,943.0 | 2,396.4 | 12.0 | % | |||||||||||
| Eliminations (1) | (730.8 | ) | (416.5 | ) | (314.3 | ) | 75.5 | % | ||||||||
| Total net revenue | 21,608.6 | 19,526.5 | 2,082.1 | 10.7 | % | |||||||||||
| Adjusted EBITDA | ||||||||||||||||
| Brazil segment | 167.7 | 131.1 | 36.6 | 27.9 | % | |||||||||||
| Seara segment | 369.3 | 425.7 | (56.4 | ) | (13.3 | )% | ||||||||||
| Beef North America segment | (266.8 | ) | (100.5 | ) | (166.3 | ) | 165.5 | % | ||||||||
| Pork USA segment | 274.1 | 247.3 | 26.8 | 10.8 | % | |||||||||||
| Pilgrim’s Pride segment | 449.7 | 660.2 | (210.5 | ) | (31.9 | )% | ||||||||||
| Australia segment | 132.8 | 160.4 | (27.6 | ) | (17.2 | )% | ||||||||||
| Miscellaneous segment | 6.6 | 3.6 | 3.0 | 85.0 | % | |||||||||||
| Total reportable segments | 1,133.3 | 1,527.7 | (394.4 | ) | (25.8 | )% | ||||||||||
| Total Adjusted EBITDA | 1,133.3 | 1,527.7 | (394.4 | ) | (25.8 | )% | ||||||||||
n.m. = not meaningful.
| (1) | Includes intercompany and intersegment transactions. |
We measure our segment profitability using Adjusted EBITDA, which is calculated by making the following adjustments to net income, as further described below under “—Reconciliation of Adjusted EBITDA”: exclusion of current and deferred income taxes; exclusion of share of profit of equity-accounted investees, net of tax; exclusion of net finance expense; exclusion of depreciation and amortization expenses; exclusion of antitrust agreements expenses; exclusion of donations and social programs expenses; exclusion of impairment of assets; exclusion of restructuring expenses; exclusion of fiscal payments and installments; exclusion of Rio Grande do Sul claim losses; exclusion of extemporaneous litigation expenses; exclusion of reversal of tax credits; exclusion of avian influenza impacts; exclusion of certain tax assessment notice; and exclusion of certain other operating income (expense), net.
Brazil Segment
| For the three-month period ended March 31, | ||||||||||||||||
| 2026 | 2025 | Change | % Change | |||||||||||||
| (in millions of US$, unless otherwise indicated) | ||||||||||||||||
| Net revenue | 3,788.8 | 3,170.0 | 618.9 | 19.5 | % | |||||||||||
| Adjusted EBITDA | 167.7 | 131.1 | 36.6 | 27.9 | % | |||||||||||
Net Revenue. The increase in our Brazil segment net revenue was mainly impacted by a 20.4% increase in sales prices, especially fresh meat in the export market.
Adjusted EBITDA. Adjusted EBITDA in our Brazil segment increased by US$36.6 million, or 27.9%, to US$167.7 million in the three-month period ended March 31, 2026 from US$131.1 million in the same period in 2025, primarily due to the increase in net revenue.
16
Seara Segment
| For the three-month period ended March 31, | ||||||||||||||||
| 2026 | 2025 | Change | % Change | |||||||||||||
| (in millions of US$, unless otherwise indicated) | ||||||||||||||||
| Net revenue | 2,379.3 | 2,150.5 | 228.8 | 10.6 | % | |||||||||||
| Adjusted EBITDA | 369.3 | 425.7 | (56.4 | ) | (13.3 | )% | ||||||||||
Net Revenue. The increase in our Seara segment net revenue was impacted by (1) a 6.2% increase in sales volumes, especially fresh poultry in the domestic market and fresh pork in the export market; and (2) a 4.2% increase in sales prices, specially fresh poultry in the export market.
Adjusted EBITDA. Adjusted EBITDA in our Seara segment decreased by US$56.4 million, or 13.3%, to US$369.3 million in the three-month period ended March 31, 2026 from US$425.7 million in the same period in 2025, primarily due higher raw material costs, reflecting higher slaughter volumes, as well as increased grain consumption.
Beef North America Segment
| For the three-month period ended March 31, | ||||||||||||||||
| 2026 | 2025 | Change | % Change | |||||||||||||
| (in millions of US$, unless otherwise indicated) | ||||||||||||||||
| Net revenue | 7,166.6 | 6,421.6 | 745.0 | 11.6 | % | |||||||||||
| Adjusted EBITDA | (266.8 | ) | (100.5 | ) | (166.3 | ) | 165.5 | % | ||||||||
Net Revenue. The increase in our Beef North America segment net revenue was impacted by a 15% increase in average sales price, mainly in the domestic market, partially offset by a 3.0% decrease in sales volume.
Adjusted EBITDA. Adjusted EBITDA in our Beef North America segment decreased by US$166.3 million, or 165.5%, to a loss of US$266.8 million in the three-month period ended March 31, 2026 from a loss of US$100.5 million in the same period in 2025, primarily due to the significant increase in cattle prices, that was partially offset by the increase in net revenue.
Pork USA Segment
| For the three-month period ended March 31, | ||||||||||||||||
| 2026 | 2025 | Change | % Change | |||||||||||||
| (in millions of US$, unless otherwise indicated) | ||||||||||||||||
| Net revenue | 2,031.7 | 2,001.7 | 30.0 | 1.5 | % | |||||||||||
| Adjusted EBITDA | 274.1 | 247.3 | 26.8 | 10.8 | % | |||||||||||
Net Revenue. The increase in our Pork USA segment net revenue was mainly impacted by a 5.9% increase in sales prices, in both export and domestic markets, partially offset by a 4.2% decrease in sales volumes, especially in the domestic market.
Adjusted EBITDA. Adjusted EBITDA in our Pork USA segment increased by US$26.8 million, or 10.8%, to US$274.1 million in the three-month period ended March 31, 2026 from US$247.3 million in the same period in 2025, primarily due to the increase in net revenue.
17
Pilgrim’s Pride Segment
| For the three-month period ended March 31, | ||||||||||||||||
| 2026 | 2025 | Change | % Change | |||||||||||||
| (in millions of US$, unless otherwise indicated) | ||||||||||||||||
| Net revenue | 4,529.4 | 4,459.4 | 70.0 | 1.6 | % | |||||||||||
| Adjusted EBITDA | 449.7 | 660.2 | (210.5 | ) | (31.9 | )% | ||||||||||
Net Revenue. The increase in our Pilgrim’s Pride segment net revenue was impacted by a 3.1% increase in average sales prices, in both the export and domestic markets, partially offset by a 1.5% decrease in volumes in the domestic market.
Adjusted EBITDA. Adjusted EBITDA in our Pilgrim’s Pride segment decreased by US$210.5 million, or 31.9%, to US$449.7 million in the three-month period ended March 31, 2026 from US$660.2 million in the same period in 2025, primarily due to higher live operation costs and the unfavorable impact of currency rate changes in Europe and Mexico.
Australia Segment
| For the three-month period ended March 31, | ||||||||||||||||
| 2026 | 2025 | Change | % Change | |||||||||||||
| (in millions of US$, unless otherwise indicated) | ||||||||||||||||
| Net revenue | 2,144.9 | 1,621.5 | 523.4 | 32.3 | % | |||||||||||
| Adjusted EBITDA | 132.8 | 160.4 | (27.6 | ) | (17.2 | )% | ||||||||||
Net Revenue. The increase in our Australia segment was impacted by (1) an increase of 19.3% in average sales prices, especially in the domestic market, and (2) an increase of 10.8% in average sales volumes, especially in the export market.
Adjusted EBITDA. Adjusted EBITDA in our Australia segment decreased by US$27.6 million, or 17.2%, to US$132.8 million in the three-month period ended March 31, 2026 from US$160.4 million in the same period in 2025, primarily due to a 29% increase in cattle prices.
Miscellaneous Segment
| For the three-month period ended March 31, | ||||||||||||||||
| 2026 | 2025 | Change | % Change | |||||||||||||
| (in millions of US$, unless otherwise indicated) | ||||||||||||||||
| Net revenue | 298.8 | 118.4 | 180.4 | 152.4 | % | |||||||||||
| Adjusted EBITDA | 6.6 | 3.6 | 3.0 | 85.0 | % | |||||||||||
Net Revenue. Our Miscellaneous segment net revenue in the three-month period ended March 31, 2026 increased by 152.4% when compared with the same period in 2025.
Adjusted EBITDA. Adjusted EBITDA in our Miscellaneous segment increased to US$6.6 million in the three-month period ended March 31, 2026 from US$3.6 million in the same period in 2025.
18
Liquidity and Capital Resources
Our financial condition and liquidity is and will continue to be influenced by a variety of factors, including:
| ● | our ability to generate cash flows from operations; |
| ● | the level of our outstanding indebtedness and the interest we are obligated to pay on our indebtedness, which affects our net financial results; |
| ● | prevailing domestic and international interest rates, which affect our debt service requirements; |
| ● | our ability to continue to borrow funds from financial institutions or to access the capital markets; |
| ● | our working capital needs, based on our growth plans; |
| ● | our capital expenditure requirements, which consist primarily of purchasing property, plant and equipment; and |
| ● | strategic investments and acquisitions. |
Our principal cash requirements consist of the following:
| ● | the purchase of raw materials, most of which represents the purchase of feed ingredients for the production of chicken and hogs and the purchase of livestock for our processing operations; |
| ● | our working capital requirements; |
| ● | the servicing of our indebtedness; |
| ● | capital expenditures related mainly to our purchases of property, plant and equipment; |
| ● | strategic investments, and acquisitions; |
| ● | dividends and other distributions; and |
| ● | taxes in connection with our operations. |
Our main sources of liquidity consist of the following:
| ● | cash flows from operating activities; and |
| ● | short-term and long-term borrowings. |
For the next 12 months, we believe that our cash on hand, cash flow from operations and remaining availability under credit lines from commercial banks will be sufficient to meet our ongoing operating requirements, make scheduled principal and interest payments on our outstanding debt and fund our capital expenditures for the foreseeable future.
19
As of March 31, 2026, our total outstanding indebtedness was US$21,365.0 million, consisting of US$840.1 million of current loans and financing and US$20,524.9 million of non-current loans and financing, representing 52.9% of our total liabilities, which totaled US$36,119.6 million as of March 31, 2026.
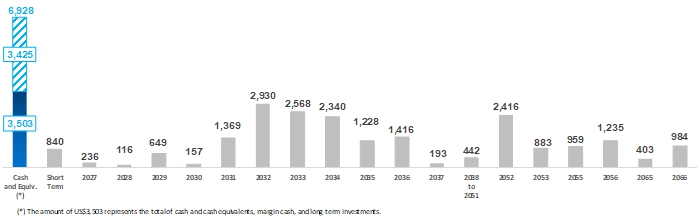
We believe we have a strong liquidity position and a well-staggered debt maturity profile. As of March 31, 2026, we had cash and cash equivalents, margin cash and long-term investments of US$3,502.8 million. In addition, as of the same date, we are permitted to borrow up to US$3.4 billion under our revolving credit facilities. The chart below shows our debt amortization schedule, together with our cash and cash equivalents as of March 31, 2026 and our borrowing capacity under our revolving credit facilities as of March 31, 2026.
Debt Amortization Schedule
(in US$ millions)
We believe that our cash and cash equivalents, margin cash and long-term investments balance together with our borrowing capacity under our revolving credit facilities as of March 31, 2026 should be sufficient to meet our outstanding debt requirements through mid-2033. However, this balance and our ability to continue to generate sufficient cash is subject to certain general economic, financial, industry, legislative, regulatory and other factors beyond our control. For more information, see “Item 3. Key Information—D. Risk Factors” in our Form 20-F.
Cash Flows
The table below shows our cash flows from operating, investing and financing activities for the periods indicated:
| For the three-month period ended March 31, | ||||||||
| 2026 | 2025 | |||||||
| (in millions of US$) | ||||||||
| Net cash used in operating activities | (789.3 | ) | (554.5 | ) | ||||
| Net cash used in investing activities | (514.7 | ) | (243.5 | ) | ||||
| Net cash used in financing activities | (67.7 | ) | (35.0 | ) | ||||
| Effect of exchange rate changes on cash and cash equivalents | 101.4 | 45.3 | ||||||
| Change in cash and cash equivalents, net | (1,270.3 | ) | (787.7 | ) | ||||
| Cash and cash equivalents at the beginning of the period | 4,565.3 | 5,613.7 | ||||||
| Cash and cash equivalents at the end of the period | 3,294.8 | 4,826.0 | ||||||
20
Operating Activities
Cash flow provided by (used in) operating activities may vary from time to time according to the fluctuation of sales revenues, cost of sales, operating expenses, changes in operating activities, interest paid and received and income tax paid.
Net cash used in operating activities for the three-month period ended March 31, 2026 was US$789.3 million, compared to net cash used in operating activities of US$554.5 million in the same period in 2025. This increase was primarily due to:
| ● | a decrease in net income adjustments of US$415.4 million, to US$1,138.5 million in the three-month period ended March 31, 2026, from US$1,553.8 million in the same period in 2025; |
| ● | an increase in other current and non-current assets of US$296.4 million, to a cash generation of US$7.8 million in the three-month period ended March 31, 2026, from a cash consumption of US$288.5 million in the same period in 2025; |
| ● | a decrease in payments relating to DOJ and antitrust agreements of US$187.1 million, to a cash generation of US$47.3 million in the three-month period ended March 31, 2026 from a cash consumption of US$139.7 million in the same period in 2025; |
| ● | an increase in cash generation from trade accounts receivables of US$94.1 million, to US$331.1 million in the three-month period ended March 31, 2026, from US$236.9 million in the same period in 2025; |
| ● | a decrease in cash consumption from inventories of US$58.5 million, to US$582.4 million in the three-month period ended March 31, 2026, from US$640.9 million in the same period in 2025; and |
| ● | a decrease in income taxes paid of US$15.9 million, to US$218.5 million in the three-month period ended March 31, 2026, from US$234.3 million in the same period in 2025 |
Investing Activities
Cash flow provided by (used in) investing activities is primarily related to: (1) our acquisition of subsidiaries minus net cash at the time of acquisition; (2) our acquisition of property, plant and equipment; (3) our acquisition of intangible assets; and (4) our receipt of payment from the sale of property, plant and equipment.
For the three-month period ended March 31, 2026, net cash used in investing activities totaled US$514.7 million, of which, we highlight, US$566.4 million was cash used in purchases of property, plant and equipment. The total cash used was partially offset by US$28.7 million in cash provided by sales of property, plant and equipment.
For the three-month period ended March 31, 2025, net cash used in investing activities totaled US$243.5 million, of which, we highlight, US$264.7 million was cash used in purchases of property, plant and equipment, partially offset by US$21.9 million in cash provided by sales of property, plant and equipment.
Financing Activities
Cash flow provided by financing activities includes primarily proceeds from new loans and financing and derivatives settled in cash. Cash flow used in financing activities includes primarily principal payments on loans and financing, payments related to derivatives settled in cash, payments for purchase of treasury shares and payments of dividends.
21
For the thee-month period ended March 31, 2026, net cash used in financing activities totaled US$67.7 million, of which, we highlight, (1) US$434.9 million was cash used in payments of loans and financing and (2) US$111.0 million cash used in payments of leasing contracts; which was partially offset by US$533.0 million in cash proceeds from loans and financing.
For the three-month period ended March 31, 2025, net cash used in financing activities totaled US$35.0 million, of which, we highlight, (1) US$1,750.7 million was cash used in payments of loans and financing; (2) US$379.5 million was dividend payments; and (3) US$98.3 million was payments of leasing contracts; which was partially offset by US$2,181.0 million in cash proceeds from loans and financing.
Indebtedness and Financing Strategy
As of March 31, 2026, our total outstanding indebtedness was US$21,365.0 million, consisting of US$840.1 million of current loans and financing and US$20,524.9 million of non-current loans and financing, representing 52.9% of our total liabilities, which totaled US$36,119.6 million as of March 31, 2026.
As of December 31, 2025, our total outstanding indebtedness was US$21,090.6 million, consisting of US$833.1 million of current loans and financing and US$20,257.5 million of non-current loans and financing, representing 59.2% of our total liabilities, which totaled US$35,633.7 million as of December 31, 2025.
Our financing strategy has been and will be, over the next several years, to: (1) extend the average maturity of our outstanding indebtedness, including by refinancing short-term debt through longer-term borrowings and issuing longer-term debt securities, in order to increase our liquidity levels and improve our strategic, financial and operational flexibility; and (2) reduce our financing costs by accessing lower-cost sources of finance, including through the capital markets and export finance.
Based on the profile of our indebtedness as of December 31, 2025 and our track record, we believe we will continue to be able to raise funds in U.S. dollars, euros and reais to meet our financial obligations. We further believe that our capital expenditures during recent years, in addition to capital expenditures that we intend to make in the near future, will allow us to increase our ability to generate cash, to strengthen our credit ratios and to enhance our capacity to meet our financial obligations.
We maintain lines of credit with various financial institutions to finance working capital requirements, and we believe we will continue to be able to obtain additional credit to finance our working capital needs based on our past track record and current market conditions.
22
Indebtedness Summary and Maturities
The table below sets forth our consolidated loans and financing as of March 31, 2026. A “foreign currency” instrument refers to an instrument whose currency is different from the functional currency of the borrower. A “local currency” instrument refers to an instrument whose currency is the same as the functional currency of the borrower.
| Type | Average annual interest rate | Currency | Index | Maturity | As of March 31, 2026 | |||||||||
| (in millions of US$) | ||||||||||||||
| Foreign currency: | ||||||||||||||
| Working capital – Dollar | 3.92 | % | USD | SOFR | 2030 | 14.8 | ||||||||
| CRA - Agribusiness Credit Receivable Certificates | 5.36 | % | USD | — | 2029 | 67.0 | ||||||||
| CRA - Agribusiness Credit Receivable Certificates | 5.30 | % | USD | — | 2029 | 19.3 | ||||||||
| CRA - Agribusiness Credit Receivable Certificates | 5.49 | % | USD | — | 2035 | 20.5 | ||||||||
| Export credit note | 4.94 | % | USD | SOFR | 2026 | 258.0 | ||||||||
| Others | 5.77 | % | Several | Several | Several | 2.3 | ||||||||
| Total foreign currency | 382.1 | |||||||||||||
| Local currency: | ||||||||||||||
| Notes 2.50% JBS Lux 2027 | 2.50 | % | USD | — | 2027 | 105.9 | ||||||||
| Notes 3.00% JBS Lux 2029 | 3.00 | % | USD | — | 2029 | 595.1 | ||||||||
| Notes 3.75% JBS Lux 2031 | 3.75 | % | USD | — | 2031 | 495.8 | ||||||||
| Notes 3.00% JBS Lux 2032 | 3.00 | % | USD | — | 2032 | 996.8 | ||||||||
| Notes 3.63% JBS Fin 2032 | 3.63 | % | USD | — | 2032 | 965.1 | ||||||||
| Notes 5.75% JBS Lux 2033 | 5.75 | % | USD | — | 2033 | 1,679.0 | ||||||||
| Notes 6.75% JBS Lux 2034 | 6.75 | % | USD | — | 2034 | 1,492.8 | ||||||||
| Notes 5.95% JBS USA 2035 | 5.95 | % | USD | — | 2035 | 1,014.2 | ||||||||
| Notes 5.50% JBS Lux 2036 | 5.50 | % | USD | — | 2036 | 1,246.3 | ||||||||
| Notes 4.38% JBS Lux 2052 | 4.38 | % | USD | — | 2052 | 894.6 | ||||||||
| Notes 6.50% JBS Lux 2052 | 6.50 | % | USD | — | 2052 | 1,560.3 | ||||||||
| Notes 7.25% JBS Lux 2053 | 7.25 | % | USD | — | 2053 | 908.4 | ||||||||
| Notes 6.38% JBS USA 2055 | 6.38 | % | USD | — | 2055 | 735.7 | ||||||||
| Notes 6.25% JBS Lux 2056 | 6.25 | % | USD | — | 2056 | 1,241.6 | ||||||||
| Notes 6.38% JBS Lux 2066 | 6.38 | % | USD | — | 2066 | 1,031.6 | ||||||||
| Notes 4.25% PPC 2031 | 4.25 | % | USD | — | 2031 | 803.1 | ||||||||
| Notes 3.50% PPC 2032 | 3.50 | % | USD | — | 2032 | 895.7 | ||||||||
| Notes 6.25% PPC 2033 | 6.25 | % | USD | — | 2033 | 925.5 | ||||||||
| Notes 6.88% PPC 2034 | 6.88 | % | USD | — | 2034 | 500.9 | ||||||||
| Working Capital – Euros | 2.25 | % | EUR | Euribor | 2026 - 28 | 53.0 | ||||||||
| Working Capital – Pounds | 5.65 | % | GBP | — | 2026 | 5.3 | ||||||||
| CDC - Direct credit to consumers | 14.99 | % | BRL | — | 2026 | 0.3 | ||||||||
| Livestock financing | 9.00 | % | BRL | — | 2035 | 11.9 | ||||||||
| Livestock financing – Pre | 14.65 | % | BRL | CDI | 2026 | 124.5 | ||||||||
| Livestock financing | 14.65 | % | BRL | CDI | 2026 | 0.3 | ||||||||
| CRA - Agribusiness Receivables Certificates | 15.45 | % | BRL | CDI | 2028 | 55.1 | ||||||||
| CRA - Agribusiness Receivables Certificates | 7.45 | % | BRL | IPCA | 2029 - 65 | 2,326.6 | ||||||||
| Rivalea ING Credit Facility | 5.20 | % | AUD | BBSN | — | 69.0 | ||||||||
| PPC Term Loan Revolving Credit Facility | 3.50 | % | USD | — | — | 27.2 | ||||||||
| Primo ANZ Credit Facility | 5.25 | % | AUD | BBSN | — | 36.7 | ||||||||
| Others | 4.68 | % | Several | Several | — | 184.7 | ||||||||
| Total local currency | 20,982.9 | |||||||||||||
| Total | 21,365.0 | |||||||||||||
| Breakdown: | ||||||||||||||
| Current loans and financing* | 840.1 | |||||||||||||
| Non-current loans and financing | 20,524.9 | |||||||||||||
| Total | 21,365.0 | |||||||||||||
| * | Balances classified as current which have their maturities between April 2026 and March 31, 2027. |
23
The table below sets forth the payment schedule of our consolidated loans and financing in the total amount of US$21,365.0 million, as of March 31, 2026:
| As of March 31, 2026 | ||||||||
| (in millions of US$) | (%) | |||||||
| Total current | 840.1 | 3.9 | % | |||||
| 2027 | 236.3 | 1.1 | % | |||||
| 2028 | 116.2 | 0.5 | % | |||||
| 2029 | 648.5 | 3.0 | % | |||||
| 2030 | 156.6 | 0.7 | % | |||||
| 2031 | 1,368.6 | 6.4 | % | |||||
| After 2031 | 17,998.7 | 84.2 | % | |||||
| Total non-current | 20,524.9 | 96.1 | % | |||||
| Total | 21,365.0 | 100.0 | % | |||||
Certain of our indebtedness is secured or guaranteed by the following: (1) receivables and inventories; (2) letters of credit; (3) guarantees by parent companies or subsidiaries; and (4) mortgages and liens on real estate, equipment and other items.
For a description of the material debt agreements of JBS S.A. and its subsidiaries, see “—Description of Material Indebtedness” below.
Capital Expenditures
We make capital expenditures primarily for acquisitions, strategic investments as well as equipment purchases and maintenance, expansions and modernization of our facilities including: (1) expansion and modernization of our Seara plants; (2) buildings and earthwork for our facilities in the United States; (3) investments in our new business (Novos Negócios) units and (4) the construction of a new Italian specialties and pepperoni plant in Columbia, South Carolina.
Our capital expenditures for the three-month period ended March 31, 2026 totaled US$566.4 million in cash used in the purchase of property, plant and equipment, of which 44% were investments in facilities and 56% were investments in capacity expansion.
The source of cash for our capital expenditures generally tends to be our own operating cash flows.
Description of Material Indebtedness
The following summarizes our material indebtedness as of the date of this MD&A, unless otherwise noted.
24
Fixed-Rate Notes
We have the following series of fixed-rate debt securities in the international capital markets as of March 31, 2026.
| Security | Outstanding Principal Amount | Final Maturity | ||||
| (in millions) | ||||||
| JBS USA 2.500% Notes due 2027 (1) | US$ | 106.0 | July 2027 | |||
| JBS USA 3.000% Notes due 2029 (1) | US$ | 600.0 | February 2029 | |||
| JBS USA 3.750% Notes due 2031 (1) | US$ | 493.0 | December 2031 | |||
| JBS USA 3.625% Sustainability-Linked Notes due 2032 (1) | US$ | 968.8 | January 2032 | |||
| JBS USA 3.000% Sustainability-Linked Notes due 2032 (1) | US$ | 1,000.0 | May 2032 | |||
| JBS USA 5.750% Notes due 2033 (1) | US$ | 1,661.7 | April 2033 | |||
| JBS USA 6.750% Notes due 2034 (1) | US$ | 1,507.0 | March 2034 | |||
| JBS USA 5.950% Notes due 2035 (1) | US$ | 1,000.0 | April 2035 | |||
| JBS USA 4.375% Notes due 2052 (1) | US$ | 900.0 | February 2052 | |||
| JBS USA 6.500% Notes due 2052 (1) | US$ | 1,548.0 | December 2052 | |||
| JBS USA 7.250% Notes due 2053 (1) | US$ | 900.0 | November 2053 | |||
| JBS USA 5.500% Notes due 2036 (1) | US$ | 1,250.0 | January 2036 | |||
| JBS USA 6.250% Notes due 2056 (1) | US$ | 1,250.0 | March 2056 | |||
| JBS USA 6.375% Notes due 2066 (1) | US$ | 750.0 | April 2066 | |||
| JBS USA 6.375% Notes due 2055 (1) | US$ | 1,000.0 | February 2055 | |||
| PPC 4.250% Sustainability-Linked Notes due 2031 (2) | US$ | 796.2 | April 2031 | |||
| PPC 3.500% Notes due 2032 (2) | US$ | 899.6 | March 2032 | |||
| PPC 6.250% Notes due 2033 (2) | US$ | 922.5 | July 2033 | |||
| PPC 6.875% Notes due 2034 (2) | US$ | 500.0 | May 2034 | |||
| (1) | On November 19, 2025, JBS USA, JBS N.V. and Regions Bank, as trustee, entered into supplemental indentures to each of the respective indentures governing these JBS USA Registered Notes. Pursuant to each supplemental indenture, (1) JBS USA was substituted as a co-issuer by JBS N.V. and JBS N.V. became a co-issuer of the JBS USA Registered Notes and (2) JBS S.A., JBS Global Luxembourg S.à r.l. and JBS Global Meat Holdings Pty Limited were released as parent guarantors of the JBS USA Registered Notes, in each case, in accordance with the terms and conditions of the applicable indentures governing these JBS USA Registered Notes. As a result, JBS S.A. was released from its obligations as a guarantor under the indentures, and JBS N.V. became the successor co-issuer under the JBS USA Registered Notes, and has succeeded JBS S.A. as the registrant under the JBS USA Registered Notes. In addition, JBS N.V., together with JBS USA Foods Group Holdings and JBS USA Food Company Holdings, became liable for all obligations under the indentures and the JBS USA Registered Notes. Therefore, as of March 31, 2026, the issuers of these notes were JBS N.V., JBS USA Foods Group Holdings and JBS USA Food Company Holdings. |
| (2) | These notes were issued by PPC and are guaranteed by Pilgrim’s Pride Corporation of West Virginia, Inc., Gold’n Plump Poultry, LLC, Gold’n Plump Farms, LLC, and JFC LLC. |
The indentures governing these notes contain negative covenants that limit JBS N.V. or PPC, as applicable, and their respective significant restricted subsidiaries that guarantee these notes from creating liens on Principal Property (as defined in the applicable indentures governing each series of notes) to secure debt and entering into certain sale and leaseback transactions. In addition, the indentures governing these notes restrict JBS N.V.’s or PPC’s, as applicable, ability to merge, consolidate, sell or otherwise dispose of all or substantially all of their respective assets. These covenants are subject to certain exceptions and qualifications, including that as of the date of this MD&A, there are no Principal Properties. For more information about these covenants and the indentures governing each series of these notes, see Exhibits 2.2 through 2.56 to our Form 20-F. We are currently in compliance with the covenants under the indentures governing our notes.
25
Sustainability-Linked Bonds
As described above, we have issued three series of fixed-rate sustainability-linked debt securities in the international capital markets, as follows:
| ● | JBS USA’s 3.625% Sustainability-Linked Notes due January 2032 in an aggregate principal amount of US$973.4 million; |
| ● | JBS USA’s 3.000% Sustainability-Linked Notes due May 2032 in an aggregate principal amount of US$988.7 million; and |
| ● | PPC’s 4.250% Sustainability-Linked Notes due April 2031 in an aggregate principal amount of US$794.1 million. |
As further described below, each series of sustainability-linked notes contains certain sustainability performance targets of JBS S.A., JBS USA or PPC that if unsatisfied will result in an increase in the interest rate payable on the respective notes. The applicable sustainability performance targets are specifically tailored to the business, operations and capabilities of JBS S.A., JBS USA and PPC and do not easily lend themselves to benchmarking against sustainability performance targets that may be used by other companies. In connection with these notes, none of JBS S.A., JBS USA or PPC has committed to (i) allocate the net proceeds specifically to projects or business activities meeting sustainability criteria or (ii) be subject to any other limitations or requirements that may be associated with green instruments, social instruments or sustainability instruments or other financial instruments in any particular market.
Furthermore, as there is currently no generally accepted definition (legal, regulatory or otherwise) of, nor market consensus as to what criteria a particular financial instrument must meet to qualify as, “green,” “social,” “sustainable” or “sustainability-linked” (and, in addition, the requirements of any such label may evolve from time to time), no assurance was or could be given to investors in these notes or to any other party by the issuers or the guarantors of the notes or any second party opinion providers or any qualified provider of third-party assurance or attestation services appointed by each company (an “external verifier”) that the notes will meet any or all investor expectations regarding the sustainability performance target qualifying as “green,” “social,” “sustainable” or “sustainability-linked,” or satisfy an investor’s requirements or any future legal, quasi-legal or other standards for investment in assets with sustainability characteristics, or that any adverse social and/or other impacts will not occur in connection with JBS S.A., JBS USA and/or PPC striving to achieve the sustainability performance target or the use of the net proceeds from the offering of notes.
In addition, no assurance or representation was given by the issuers and guarantors of the notes, any second party opinion providers or any external verifier as to the suitability or reliability for any purpose whatsoever of any opinion, report or certification of any third party in connection with the offering of the notes or the respective sustainability performance targets to fulfill any green, social, sustainability, sustainability-linked and/or other criteria. Any such opinion, report or certification is not, nor shall it be deemed to be, incorporated in and/or form part of this MD&A.
There can be no assurance of the extent to which JBS S.A., JBS USA and/or PPC will be successful in significantly decreasing their greenhouse gas emissions. Although a failure to achieve the applicable sustainability performance targets will give rise to an upward adjustment of the applicable interest rates, any such failure would not be an event of default under the notes, nor would such failure result in a requirement to redeem or repurchase such securities.
See “Item 3. Key Information—D. Risk Factors—Risks Relating to Our Business and Industries—Failure by us to achieve our sustainability performance targets may result in increased interest payments under future financings and harm to our reputation” in our Form 20-F.
JBS USA’s 3.625% Sustainability-Linked Notes due January 2032
Under the terms of JBS USA’s 3.625% Sustainability-Linked Notes due January 2032, if JBS S.A. does not satisfy the sustainability performance target it established under its Sustainability-Linked Framework adopted in June 2021 (the “JBS S.A. June 2021 Sustainability-Linked Framework”) to reduce its Global Greenhouse Gas Emissions Intensity by 16.364% by December 31, 2025, based on linear annual improvements against the 2019 baseline year, and provide confirmation thereof to the trustee together with a related confirmation by an external verifier at least 30 days prior to January 15, 2027, the interest rate payable on the notes will be increased by 25 basis points from and including January 15, 2027 to and including the maturity date of January 15, 2032. For more information about the JBS S.A. June 2021 Sustainability-Linked Framework, including the sustainability performance target, see “Item 4. Information on the Company—B. Business Overview—Climate Change Reduction Goals—Sustainability-Linked Frameworks—JBS S.A. June 2021 Sustainability-Linked Framework” in our Form 20-F.
26
JBS USA’s 3.000% Sustainability-Linked Notes due May 2032
Under the terms of JBS USA’s 3.000% Sustainability-Linked Notes due May 2032, if JBS USA does not satisfy the sustainability performance target it established under its Sustainability-Linked Framework adopted in November 2021 (the “JBS USA Sustainability-Linked Framework”) to reduce its Global Greenhouse Gas Emissions Intensity by 20.30% by December 31, 2026, based on linear annual improvements against the 2019 baseline year, and provide confirmation thereof to the trustee together with a related confirmation by an external verifier within six months after December 31, 2026, the interest rate payable on the notes will be increased by 25 basis points from and including November 15, 2027 to and including the maturity date of May 15, 2032. For more information about the JBS USA Sustainability-Linked Framework, including the sustainability performance target, see “Item 4. Information on the Company—B. Business Overview—Climate Change Reduction Goals—Sustainability-Linked Frameworks— JBS USA Sustainability-Linked Framework” in our Form 20-F.
PPC’s 4.250% Sustainability-Linked Notes due April 2031
Under the terms of PPC’s 4.250% Sustainability-Linked Notes due April 2031, if PPC does not satisfy the sustainability performance target it established under its Sustainability-Linked Framework adopted in March 2021(the “PPC Sustainability-Linked Framework”) to reduce its Global Greenhouse Gas Emissions Intensity by 17.679% by December 31, 2025, based on linear annual improvements against the 2019 baseline year, and provide confirmation thereof to the trustee together with a related confirmation by an external verifier at least 30 days prior to October 15, 2026, the interest rate payable on the notes will be increased by 25 basis points from and including October 15, 2026 to and including the maturity date of April 15, 2031. For more information about the PPC Sustainability-Linked Framework, including the sustainability performance target, see “Item 4. Information on the Company—B. Business Overview—Climate Change Reduction Goals—Sustainability-Linked Frameworks— PPC Sustainability-Linked Framework” in our Form 20-F.
JBS S.A. Revolving Credit Facility
On August 5, 2022, JBS S.A. and its subsidiaries JBS Investments Luxembourg S.à r.l., Seara Meats B.V. and Seara Alimentos Ltda., as borrowers and guarantors, entered into a US$450.0 million revolving unsecured credit facility (the “JBS S.A. Revolving Credit Facility”). On December 19, 2025, we entered into an amendment to the JBS S.A. Revolving Credit Facility, whereby JBS N.V. was included as an additional borrower and guarantor for all purposes under the JBS S.A. Revolving Credit Facility and its ancillary documents.
Any borrowing made by a borrower will be guaranteed by the other three obligors. The capacity of JBS S.A. Revolving Credit Facility could be increased up to US$500.0 million, with an accordion expansion feature, which was put into effect in November 2024, after obtaining lender commitments. The JBS S.A. Revolving Credit Facility initially matured in August 2025 and included two one-year extensions that were exercised at the borrowers’ option and duly accepted by all counterparties. Pursuant to the terms of the JBS S.A. Revolving Credit Facility, the interest rate under any borrowings will accrue at an adjusted secured overnight financing rate (“SOFR”), plus applicable margins that are based on the corporate rating of JBS S.A. As of March 31, 2026, there were no outstanding borrowings under the JBS S.A. Revolving Credit Facility.
The JBS S.A. Revolving Credit Facility contains customary representations, covenants and events of default. The JBS S.A. Revolving Credit Facility contains negative covenants that restrict the borrowers and guarantors thereunder and significant restricted subsidiaries from creating liens on their property or assets to secure debt and entering into certain sale and leaseback transactions. In addition, the JBS S.A. Revolving Credit Facility restricts the borrowers’ and guarantors’ ability to merge, consolidate, sell or otherwise dispose of all or substantially all of their respective assets. These covenants are subject to certain exceptions and qualifications. For more information about these covenants and the JBS S.A. Revolving Credit Facility, see Exhibit 4.1 to our Form 20-F. We are currently in compliance with the covenants under the JBS S.A. Revolving Credit Facility.
27
JBS USA Senior Unsecured Revolving Facility
On November 1, 2022, JBS USA, JBS USA Food Company, JBS USA Finance, Inc. (prior to its dissolution), JBS Australia and JBS Canada, as borrowers, entered into an unsecured revolving credit facility (as amended from time to time, the “JBS Senior Unsecured Revolving Facility”), with Bank of Montreal, as administrative agent, and the lender parties thereto. The JBS Senior Unsecured Revolving Facility provides for a revolving credit commitment in an amount up to US$1,500.0 million with a maturity in 2027, with two one-year extension options at each lender’s discretion. The facility is available in two tranches of US$800.0 million and US$700.0 million and in multiple currencies, subject to sub-limits with respect to any amounts borrowed in currencies other than amounts borrowed in Dollars. These loans bear interest at the applicable benchmark rate or the prime rate plus applicable margins that are based on the corporate credit or family rating of JBS N.V. On November 19, 2025, we entered into an amendment to the JBS Senior Unsecured Revolving Facility, whereby (1) JBS USA was substituted as a borrower by JBS N.V. and JBS N.V. became a borrower and a guarantor under the JBS Senior Unsecured Revolving Facility, (2) JBS USA Food Company was substituted as a borrower by JBS USA Food Company Holdings and JBS USA Food Company Holdings became a borrower and a guarantor under the JBS Senior Unsecured Revolving Facility and (3) JBS S.A., JBS Global Luxembourg S.à r.l. and JBS Global Meat Holdings Pty Limited were released as parent guarantors, in each case, in accordance with the terms and conditions of the JBS Senior Unsecured Revolving Facility. As a result of this amendment, the borrowers under the JBS Senior Unsecured Revolving Facility currently include JBS N.V., JBS USA Food Company Holdings, JBS Australia and JBS Canada.
Guarantees. Subject to the JBS Collateral Cure (as described below), borrowings are guaranteed by JBS N.V. and each of the borrowers in relation to its respective borrowings only (with the exception of JBS Australia that is not a guarantor). Following a JBS Collateral Cure, the direct parent entity of each borrower and each wholly-owned subsidiary of each borrower is required to become a guarantor (other than, in each case, certain excluded subsidiaries that are not required to become a guarantor).
Covenants. The JBS Senior Unsecured Revolving Facility contains customary representations and warranties, covenants and events of default. The JBS Senior Unsecured Revolving Facility imposes certain limitations and restrictions on JBS N.V. and its restricted subsidiaries, including, without limitation (1) restricting any restricted subsidiary of JBS N.V. that is not a borrower or guarantor of the JBS Senior Unsecured Revolving Facility from incurring additional debt, subject to certain significant exceptions and (2) creating liens, entering into certain transactions with affiliates and consolidating or merging, in each case, subject to certain significant exceptions. In addition, the JBS Senior Unsecured Revolving Facility and subject to the JBS Collateral Cure described below, includes a financial maintenance covenant that requires compliance with a minimum interest coverage ratio of 3:00 to 1:00, which shall be tested at the end of each fiscal quarter of the borrowers (the “JBS Financial Maintenance Covenant”). For more information about these covenants and the JBS Senior Unsecured Revolving Facility, see Exhibits 4.2 to 4.4 to our Form 20-F. We are currently in compliance with the covenants under the JBS Senior Unsecured Revolving Facility.
Collateral Cure. After the end of any fiscal quarter, the borrowers may give notice that they will not be in compliance with the JBS Financial Maintenance Covenant and instead may elect to cause (1) the borrowers and each wholly-owned subsidiary of each borrower (other than, in each case, any excluded subsidiary) to become a guarantor, and (2) each borrower and each such subsidiary guarantor, in each case organized in the United States, to provide perfected first-priority security interests in substantially all of its assets (other than certain excluded assets) (the “JBS Collateral Cure”). From and after the date of the JBS Collateral Cure, the JBS Financial Maintenance Covenant will no longer be in effect and availability under the JBS Senior Unsecured Revolving Facility will be limited and subject to collateral coverage utilizing a 75% advance rate on U.S. receivables and a 50% advance rate on U.S. inventory, subject to certain exceptions.
As of March 31, 2026, JBS N.V. had outstanding letters of credit and available borrowings under the revolving credit commitment of US$0.2 million and US$1,499.8 million, respectively. There were no outstanding borrowings as of March 31, 2026.
28
JBS USA Commercial Paper Program
On December 10, 2024, JBS USA launched its commercial paper program. The program allowed JBS USA, JBS USA Food Company and JBS USA Foods Group Holdings to issue up to US$1.0 billion in aggregate principal amount of short-term, unsecured notes without registration under the Securities Act.
On December 22, 2025, the issuers notified the other parties of the termination of the existing commercial paper program. Concurrently, JBS N.V., JBS USA Foods Group Holdings and JBS USA Food Company Holdings launched a new program, allowing the issuance of up to US$1.0 billion in aggregate principal amount of short-term, unsecured notes without registration under the Securities Act. As of March 31, 2026, there were no outstanding borrowings under the new commercial paper program.
PPC U.S. Credit Facility
On October 4, 2023, PPC and certain of PPC’s subsidiaries entered into a Revolving Syndicated Facility Agreement (the “PPC U.S. Credit Facility”) with CoBank, ACB as administrative agent and the other lenders party thereto. The PPC U.S. Credit Facility provides for a revolving loan commitment of up to US$850.0 million with a maturity on October 4, 2028. The PPC U.S. Credit Facility is unsecured and will be used for general corporate purposes. Outstanding borrowings under the PPC U.S. Credit Facility bear interest at a per annum rate equal to either the SOFR or the prime rate plus applicable margins based on PPC’s credit ratings. As of March 31, 2026, PPC had outstanding letters of credit and available borrowings under the PPC U.S. Credit Facility of US$4.0 million and US$846 million, respectively, and there were no outstanding borrowings under this agreement.
The PPC U.S. Credit Facility is not guaranteed by any of PPC’s subsidiaries. Following the PPC Collateral Cure (as defined below), each wholly-owned subsidiary of each borrower is required to become a guarantor (other than certain excluded subsidiaries that are not required to become a guarantor). The PPC U.S. Credit Facility contains customary representations and warranties, covenants and events of default. The PPC U.S. Credit Facility imposes certain limitations and restrictions on PPC and its restricted subsidiaries, including limitations on (1) liens, (2) indebtedness, (3) sales and other dispositions of assets, (4) dividends, distributions, and other payments in respect of equity interest, (5) investments, and (6) voluntary prepayments, redemptions or repurchases of junior debt, in each case, subject to certain exceptions which can be material and certain of such clauses only apply to PPC upon the occurrence of certain triggering events. In addition, the PPC U.S. Credit Facility and subject to the PPC Collateral Cure, includes a financial maintenance covenant that requires PPC not to permit its interest coverage ratio to be less than 3.50:1.00, which shall be tested at the end of each fiscal quarter of PPC (the “PPC Financial Maintenance Covenant”).
After the end of any fiscal quarter, PPC may give notice that they will not be in compliance with the PPC Financial Maintenance Covenant and instead may elect to cause the borrowers and each subsidiary guarantor to provide security interests in the collateral that secured PPC’s prior secured credit facility (the “PPC Collateral Cure”). From and after the date of the PPC Collateral Cure, the PPC Financial Maintenance Covenant will no longer be in effect and availability under the PPC U.S. Credit Facility will be limited and subject to collateral coverage utilizing a 75% advance rate on U.S. receivables and a 50% advance rate on U.S. inventory, subject to certain exceptions. PPC is currently in compliance with the covenants under the PPC U.S. Credit Facility.
For more information about these covenants and the PPC U.S. Credit Facility, see Exhibit 4.5 to our Form 20-F.
Agribusiness Credit Receivable Certificates (Certificados de Recebíveis do Agronegócio)
JBS S.A.
From May 2022 through May 2024, JBS S.A. issued several series of non-convertible unsecured debentures through private placements in Brazil, with maturities ranging from 2027 until 2044. These debentures are denominated in Brazilian reais and bear interest at various rates. A larger part of these debentures have their principal amount adjusted according to the Brazilian inflation – IPCA (Índice Nacional de Preços ao Consumidor Amplo), with an annual average interest rate of 6.4% as of March 31, 2026, while the remaining part is indexed to the U.S. dollar plus an annual average interest rate of 5.4% as of March 31, 2026. These debentures underlie the securitization of agribusiness receivables in Brazil through the issuance of agribusiness receivables certificates (Certificados de Recebíveis do Agronegócio) (“CRAs”). The net proceeds from the issuances of these debentures have been used primarily to acquire cattle, natural products and other inputs necessary for the processing or industrialization of bovine cattle, including the slaughter, preparation of by-products, and the manufacturing of meat products from the primary slaughter process mentioned above, as well as the sale of the resulting products and by-products of such process, including exportation, intermediation, storage, and transportation of the products, by-products, and derivatives. As of March 31, 2026, the outstanding aggregate principal amount of the CRAs was US$1.4 billion.
29
Seara
From October 2024 through November 2025, several series of CRAs representing rural financial product notes (Cédulas de Produto Rural Financeiras – CPR-Financeiras) issued by Seara and guaranteed by JBS S.A. were issued, with maturities ranging from 2029 until 2065. These rural financial product notes are denominated in Brazilian reais and bear interest at various rates. A larger part of these rural financial product notes have their principal amount adjusted according to the Brazilian inflation – IPCA (Índice Nacional de Preços ao Consumidor Amplo), with an annual average interest rate of 7.5% as of March 31, 2026, while the remaining part is indexed to the U.S. dollar plus an annual average interest rate of 5.4% as of March 31, 2026. Seara used the net proceeds from the issuances of the rural financial product notes primarily to acquire raw materials, namely corn in natura, in the ordinary course of its business. As of March 31, 2026, the outstanding aggregate principal amount of the CRAs was US$1.3 billion. The agreements governing these CRAs contain customary covenants and events of default; however, they do not include any financial covenants.
Other Debt
For more information about our consolidated indebtedness, including our other, lower value debt instruments and facilities, see “—Contractual Obligations” below and note 16 to our unaudited interim financial statements, which are included in our Form 6-K, and note 16 to our audited financial statements, which are included in our Form 20-F.
Contractual Obligations
The following tables summarize our significant loans and financing, including estimated interest thereon, payables related to purchases of assets, finance lease obligations, operating lease obligations and other purchase obligations as of the dates indicated that have an impact on our liquidity.
| As of March 31, 2026 | ||||||||||||||||||||
| Less than 1 year | Between 1 and 2 years | Between 3 and 5 years | More than 5 years | Total | ||||||||||||||||
| (in millions of US$) | ||||||||||||||||||||
| Trade accounts payable and supply chain finance | 6,609.8 | — | — | — | 6,609.8 | |||||||||||||||
| Loans and financing | 840.1 | 352.5 | 2,173.7 | 17,998.7 | 21,365.0 | |||||||||||||||
| Estimated interest on loans and financing (1) | 1,202.0 | 1,401.5 | 3,263.6 | 15,158.4 | 21,025.5 | |||||||||||||||
| Derivatives liabilities | 126.7 | 87.4 | — | — | 214.0 | |||||||||||||||
| Payments of leases | 365.4 | 508.3 | 532.1 | 701.9 | 2,107.8 | |||||||||||||||
| Commodities forward purchase contracts | 194.1 | 16,490.0 | 13,072.5 | 3,589.4 | 33,346.1 | |||||||||||||||
| (1) | Includes interest on all loans and financing outstanding. Payments are estimated for variable rate and variable term debt based on effective interest rates as of March 31, 2026. Payments in foreign currencies are estimated using the March 31, 2026 exchange rate. |
Quantitative and Qualitative Disclosures About Market Risk
We are exposed to various market risks arising from our normal business activities. These market risks, which are beyond our control, primarily involve the possibility that changes in interest rates, inflation, exchange rates and commodity prices will adversely affect the value of our financial assets and liabilities or future cash flows and earnings.
30
Our risk management strategy is designed to mitigate the financial impact derived from our exposure to market risks, and accordingly, we have used and may continue to use interest rate, exchange rates and commodity derivative instruments, cash and receivables to mitigate these market risks. Our hedging activities are governed by a financial risk management department, which follows corporate governance standards and guidelines for our company that are established by our risk management committee and approved by our board of directors.
For more information about our risk management, see note 26 to our unaudited interim financial statements, which are included in our Form 6-K, and note 27 to our audited financial statements, which are included in our Form 20-F.
Research and Development, Patents and Licenses, Etc.
Our global innovation teams collaborate to share trends, solutions, and technological advancements, leveraging collective expertise to drive category growth. With a diverse product portfolio, JBS aims to deliver high-quality offerings tailored to evolving customer needs and consumer preferences. Investments in cultivated protein are central to our strategic vision. In 2021, we entered the cultured protein market with the acquisition of BioTech Foods in Spain. Additionally, the upcoming JBS Biotech Innovation Centre in Santa Catarina will be Brazil’s largest research facility dedicated to food biotechnology. Our expansion into plant-based proteins is exemplified by Seara’s Incrível and the acquisition of Vivera Topholding BV, which produces and sells plant-based protein products in Europe.
Initiatives such as Seara’s Innovation Hub and Friboi’s Meat Technology and Study Center (Cetec) reflect our commitment to product quality and innovation. Through in-depth analysis of the entire production chain and continuous research, we adapt to shifting consumer expectations. In partnership with Colorado State University, we established the JBS Global Food Innovation Center, advancing food safety, meat sciences, and animal welfare practices. Furthermore, JBS USA makes significant investments in technology and innovation to uphold world-class quality standards, exemplified by the transition to zero-trim beef products. Meanwhile, Pilgrim’s Europe integrates advanced technologies, including Internet of Things (IoT) devices, to enhance operational efficiencies and predictive maintenance.
Trend Information
The following list sets forth, in our view, the most important trends, uncertainties and events that are reasonably likely to continue to have a material effect on our revenues, income from operations, profitability, liquidity and capital resources, or that may cause reported financial information to be not necessarily indicative of future operating results or financial condition:
| ● | global economic conditions; |
| ● | Brazilian economic environment; |
| ● | effect of level of indebtedness and interest rates; |
| ● | effect of the levels of sales of fresh and processed products in the domestic market on our results of operations; |
| ● | effect of the levels of exports of fresh and processed products on our results of operations; |
| ● | fluctuations in domestic market prices of fresh and processed products can significantly affect our operating revenues; |
| ● | effects of fluctuations in export prices of fresh and processed products on operating revenues; |
| ● | effects of the variation of prices for the purchase of raw materials on our costs of goods sold; and |
31
| ● | effects of fluctuations in currency exchange rates. |
For more information, see “—Principal Factors Affecting our Financial Condition and Results of Operations” above.
Critical Accounting Estimates
The presentation of our financial position and results of operation in accordance with IFRS – Accounting Standards, and the disclosures related to judgements and estimates can be found in note 2.6 to our consolidated financial statements, which are included in our Form 20-F.
Recent Accounting Pronouncements
Certain new and amended accounting standards and interpretations have been adopted by us and are described in note 2.4 to our unaudited interim financial statements, which are included in our Form 6-K, and note 2.5 to our audited financial statements, which are included in our Form 20-F.
Reconciliation of Adjusted EBITDA
We have disclosed Adjusted EBITDA in this MD&A, which is a non-GAAP financial measure. Adjusted EBITDA is used as a measure of our segments performance by our management and should not be considered as a measure of financial performance in accordance with IFRS – Accounting Standards. You should rely on non-GAAP financial measures in a supplemental manner only in making your investment decision. There is no standard definition of non-GAAP financial measures, and JBS’s definitions may not be comparable to those used by other companies.
Adjusted EBITDA is calculated by making the following adjustments to our net income, as further described below: exclusion of current and deferred income taxes; exclusion of share of profit of equity-accounted investees, net of tax; exclusion of net finance expense; exclusion of depreciation and amortization expenses; exclusion of antitrust agreements expenses; exclusion of donations and social programs expenses; exclusion of impairment of assets; exclusion of restructuring expenses; exclusion of fiscal payments and installments; exclusion of Rio Grande do Sul claim losses; exclusion of extemporaneous litigation expenses; exclusion of reversal of tax credits; exclusion of avian influenza impacts; exclusion of certain tax assessment notice; and exclusion of certain other operating income (expense), net.
The use of Adjusted EBITDA instead of net income has limitations as an analytical tool, including the following:
| ● | Adjusted EBITDA does not reflect changes in, or cash requirements for, working capital needs; |
| ● | Adjusted EBITDA does not reflect interest expense, or the cash requirements necessary to service interest or principal payments, on debt; |
| ● | Adjusted EBITDA does not reflect income tax expense or the cash requirements to pay taxes; |
| ● | Although depreciation and amortization are non-cash charges, the assets being depreciated and amortized will often have to be replaced in the future, and Adjusted EBITDA does not reflect any cash requirements for such replacements; |
| ● | Adjusted EBITDA does not reflect historical cash expenditures or future requirements for capital expenditures or contractual commitments; and |
| ● | Adjusted EBITDA includes adjustments that represent cash expenses or that represent non-cash charges that may relate to future cash expenses, and some of these expenses are of a type that are expected to be incurred in the future, although the amount of any such future charge cannot be predicted. |
32
Adjusted EBITDA is reconciled to our net income (loss) as follows:
| For the three-month period ended March 31, | For the year ended December 31, | |||||||||||||||||||
| 2026 | 2025 | 2025 | 2024 | 2023 | ||||||||||||||||
| (in millions of US$) | ||||||||||||||||||||
| Net income (loss) | 241.6 | 556.3 | 2,229.8 | 1,967.6 | (131.7 | ) | ||||||||||||||
| Income taxes – current and deferred | 67.1 | 137.8 | 390.5 | 743.4 | (128.0 | ) | ||||||||||||||
| Share of profit of equity-accounted investees, net of tax | (138.4 | ) | (2.7 | ) | (16.9 | ) | (2.9 | ) | (9.5 | ) | ||||||||||
| Net finance expense | 314.2 | 191.5 | 1,556.3 | 1,669.8 | 1,353.4 | |||||||||||||||
| Depreciation and amortization | 617.5 | 535.6 | 2,308.5 | 2,189.5 | 2,149.1 | |||||||||||||||
| Antitrust agreements (a) | 24.6 | 79.5 | 182.3 | 253.7 | 102.5 | |||||||||||||||
| Donations and social programs (b) | 0.5 | 0.5 | 1.8 | 22.5 | 18.2 | |||||||||||||||
| Impairment of assets (c) | — | 5.7 | 21.1 | — | 26.3 | |||||||||||||||
| Restructuring (d) | 2.8 | 17.0 | 33.4 | 95.6 | 52.2 | |||||||||||||||
| Fiscal payments and installments (e) | — | — | 2.4 | 81.8 | — | |||||||||||||||
| Rio Grande do Sul claim (f) | — | — | 0.0 | 19.3 | — | |||||||||||||||
| Extemporaneous litigation (g) | — | — | 20.7 | 61.0 | — | |||||||||||||||
| Reversal of tax credits (h) | — | — | — | 58.7 | — | |||||||||||||||
| Avian influenza (i) | — | — | 17.1 | — | — | |||||||||||||||
| Tax assessment notice (j) | — | — | 43.2 | — | — | |||||||||||||||
| Other operating income (expense), net (k) | 3.4 | 6.4 | 41.2 | 32.0 | 25.5 | |||||||||||||||
| Adjusted EBITDA | 1,133.3 | 1,527.7 | 6,831.4 | 7,191.9 | 3,457.9 | |||||||||||||||
| Adjusted EBITDA by segment: | ||||||||||||||||||||
| Brazil | 167.7 | 131.1 | 955.1 | 965.0 | 469.3 | |||||||||||||||
| Seara | 369.3 | 425.7 | 1,553.4 | 1,538.6 | 364.5 | |||||||||||||||
| Beef North America | (266.8 | ) | (100.5 | ) | (319.5 | ) | 247.3 | 114.2 | ||||||||||||
| Pork USA | 274.1 | 247.3 | 898.9 | 1,071.2 | 526.9 | |||||||||||||||
| Pilgrim’s Pride | 449.7 | 660.2 | 2,804.5 | 2,703.4 | 1,536.0 | |||||||||||||||
| Australia | 132.8 | 160.4 | 916.0 | 664.3 | 454.7 | |||||||||||||||
| Miscellaneous | 6.6 | 3.6 | 23.0 | 3.5 | (5.2 | ) | ||||||||||||||
| Total reportable segments | 1,133.3 | 1,527.7 | 6,831.4 | 7,193.2 | 3,460.4 | |||||||||||||||
| Eliminations (l) | — | — | — | (1.3 | ) | (2.6 | ) | |||||||||||||
| Adjusted EBITDA | 1,133.3 | 1,527.7 | 6,831.4 | 7,191.9 | 3,457.9 | |||||||||||||||
| (a) | Refers to antitrust agreements entered into by JBS USA and its subsidiaries. For more information, see “Item 8. Financial Information—A. Consolidated Statements and Other Financial Information—Legal Proceedings.” |
| (b) | Refers to donations made by us, substantially composed of donations to the JBS Fund for The Amazon (Fundo JBS pela Amazônia), a fund established by JBS S.A. to finance and support innovative, long-term initiatives that build on our legacy of conservation and sustainable development in the Amazon biome. |
| (c) | Refers mainly to the impairment of fixed assets and the impairment of recoverable tax credits. |
| (d) | Refers to multiple restructuring initiatives, primarily those in our indirect subsidiary PPC, which are registered as other expenses, as well as other non-significant restructuring projects that are registered as general and administrative expenses. |
| (e) | Refers to the special payment program for installment plans of tax proceedings with exemption from fines and reduction of interest of our indirect subsidiary JBS S.A. |
| (f) | Refers to losses incurred in connection with a claim related to the floods that occurred in the Brazilian State of Rio Grande do Sul. |
| (g) | Refers to extemporaneous litigation arising from debts of companies acquired by the JBS Group and recognizes these settlement expenses within general and administrative. |
| (h) | Refers to the reversal of ICMS credits on sales operations disallowed in the Brazilian State of Santa Catarina. |
| (i) | Refers to the impacts related to the avian influenza incurred by our indirect subsidiary Seara. |
| (j) | Refers to tax assessments related to the acquisition of Tyson de México by our indirect subsidiary PPC. For more information, see “Item 8. Financial Information—A. Consolidated Statements and Other Financial Information—Legal Proceedings.” |
| (k) | Refers to several adjustments in JBS USA’s jurisdiction, such as third-party advisory expenses related to acquisitions and insurance recovery, among others. |
33
Supplemental Financial and Non-Financial Information about the Obligors of the JBS USA Registered Notes
Reference is made to the following 15 series of notes (collectively, the “JBS USA Registered Notes”) issued by JBS N.V., JBS USA Foods Group Holdings and JBS USA Food Company Holdings (collectively, the “Co-Issuers” or “Obligors”): (i) 2.500% Senior Notes due 2027; (ii) 3.000% Senior Notes due 2029; (iii) 3.750% Senior Notes due 2031; (iv) 3.625% Sustainability-Linked Senior Notes due 2032; (v) 3.000% Sustainability-Linked Senior Notes due 2032; (vi) 5.750% Senior Notes due 2033; (vii) 6.750% Senior Notes due 2034; (viii) 5.950% Senior Notes due 2035; (ix) 5.500% Senior Notes due 2036; (x) 4.375% Senior Notes due 2052; (xi) 6.500% Senior Notes due 2052; (xii) 7.250% Senior Notes due 2053; (xiii) 6.375% Senior Notes due 2055; (xiv) 6.250% Senior Notes due 2056; and (xv) 6.375% Senior Notes due 2066.
JBS N.V. indirectly owns 100% of each of JBS USA Foods Group Holdings and JBS USA Food Company Holdings, which are holding subsidiaries of JBS N.V. with no operations of their own or assets (other than the equity interests of their respective direct subsidiaries). The Obligors’ ability to service their debt obligations, including the JBS USA Registered Notes, is dependent upon the earnings of their respective subsidiaries and such subsidiaries’ ability to distribute those earnings as dividends, loans or other payments to such Obligors. Under the terms of the indentures pursuant to which the JBS USA Registered Notes were issued, principal, accrued and unpaid interest and certain other obligations are due under the JBS USA Registered Notes in accordance with each such indenture. For more information about the terms and conditions of the JBS USA Registered Notes, see “Item 12. Description of Securities Other Than Equity Securities—A. Debt Securities—Description of the JBS USA Registered Notes.” The JBS USA Registered Notes are senior unsecured obligations and are effectively subordinated to the Obligors’ secured obligations to the extent of the value of the assets securing such obligations. The JBS USA Registered Notes are structurally subordinated to all existing and future debt and other liabilities, including trade payables, of each of JBS N.V.’s subsidiaries (other than the other Co-Issuers). Moreover, under the laws of the jurisdictions of organization of the Obligors, obligations under the JBS USA Registered Notes are subordinated to certain statutory preferences. In the event of any liquidation, bankruptcy, or judicial reorganization of such entities, such statutory preferences, including motions for restitution, post-petition claims, claims for salaries, wages, social security, taxes and court fees and expenses and claims secured by collateral, among others, will have preference and priority over any other claims, including any claims in respect of the Obligors under the JBS USA Registered Notes. For more information about these and other the factors that may affect payments to holders of the JBS USA Registered Notes, see “Item 3. Key Information—D. Risk Factors—Risks Relating to Our Debt and the JBS USA Registered Notes” in our Form 20-F.
Pursuant to Rule 3-10 of Regulation S-X subsidiary issuers are not required to provide separate financial statements, provided that the subsidiary obligor is consolidated into the parent company’s consolidated financial statements, and, subject to certain exceptions as set forth below, the alternative disclosure required by Rule 13-01 of Regulation S-X is provided, which includes narrative disclosure and summarized financial information. Accordingly, separate consolidated financial statements of each Co-Issuer (other than JBS N.V.) have not been presented.
Furthermore, as permitted under Rule 13-01(a)(4)(vi) of Regulation S-X, except as described below, we have excluded the summarized financial information for the Co-Issuers (other than JBS N.V.) because, except for JBS N.V., the combined Co-Issuers, excluding investments in subsidiaries that are not issuers, have no material assets, liabilities or results of operations, and management believes such summarized financial information would not provide incremental value to investors.
Summarized financial information is presented below for JBS N.V., as parent company and the only Co-Issuer with material operations, on a stand-alone basis and does not include investments in and equity in the earnings of non-obligor subsidiaries. Transactions with and balances to/from non-obligor subsidiaries and related parties have been presented separately.
34
The following summarized financial information sets forth our summarized statement of financial position data as of March 31, 2026 and December 31, 2025 and summarized statement of income data for the three-month period ended March 31, 2026 and the year ended December 31, 2025.
| As of and for the three-month period ended March 31, 2026 | As of and for the year ended December 31, 2025 | |||||||
| (in millions of US$) | ||||||||
| Statement of financial position data: | ||||||||
| Current assets: | ||||||||
| Due from non-obligor subsidiaries and related parties | 381.9 | 431.5 | ||||||
| Other current assets | 2,868.5 | 2,761.9 | ||||||
| Total current assets | 3,250.4 | 3,193.3 | ||||||
| Non-current assets: | ||||||||
| Due from non-obligor subsidiaries and related parties | 47.0 | 57.0 | ||||||
| Other non-current assets | 12,780.0 | 12,402.3 | ||||||
| Total non-current assets | 12,827.0 | 12,459.3 | ||||||
| Current liabilities: | ||||||||
| Due to non-obligor subsidiaries and related parties | 90.0 | 98.0 | ||||||
| Other current liabilities | 2,092.0 | 2,067.5 | ||||||
| Total current liabilities | 2,182.0 | 2,165.5 | ||||||
| Non-current liabilities: | ||||||||
| Due to non-obligor subsidiaries and related parties | 3,901.0 | 2,744.0 | ||||||
| Other non-current liabilities | 2,308.9 | 2,185.6 | ||||||
| Total non-current liabilities | 6,209.9 | 4,929.6 | ||||||
| Statement of income data (1): | ||||||||
| Net revenue | 3,478.9 | 14,218.5 | ||||||
| Gross profit | 460.7 | 2,112.5 | ||||||
| Net income (loss) attributable to company shareholders | (18.0 | ) | 440.3 | |||||
| Net income (loss) | (18.0 | ) | 440.3 | |||||
| (1) | For the three-month period ended March 31, 2026, net revenue, gross profit and net income (loss) include US$628.3 million, US$21.9 million and US$14.4 million, respectively, of intercompany transactions with non-obligor subsidiaries and related parties. For the year ended December 31, 2025, net revenue, gross profit and net income (loss) include US$1,986.3 billion, US$191.1 million and US$126.1 million, respectively, of intercompany transactions with non-obligor subsidiaries and related parties. |
Cautionary Statement Regarding Forward-Looking Statements
This MD&A includes statements reflecting assumptions, expectations, intentions or beliefs about future events that are intended as “forward-looking statements” as defined under the Private Securities Litigation Reform Act of 1995. All statements included in this MD&A, other than statements of historical fact, that address activities, events or developments that we or our management expect, believe or anticipate will or may occur in the future are forward-looking statements. These statements represent our reasonable judgment on the future based on various factors and using numerous assumptions and are subject to known and unknown risks, uncertainties and other factors that could cause our actual results and financial position to differ materially from those contemplated by the statements. You can identify these statements by the fact that they do not relate strictly to historical or current facts. They use words such as “anticipate,” “estimate,” “project,” “forecast,” “plan,” “may,” “will,” “should,” “could,” “expect” and other words of similar meaning. In particular, these include, but are not limited to, statements of our current views and estimates of future economic circumstances, industry conditions in domestic and international markets and our performance and financial results.
35
Among the factors that may cause actual results and events to differ from the anticipated results and expectations expressed in such forward-looking statements are the following:
| ● | the risk of outbreak of animal diseases, more stringent trade barriers in key export markets and increased regulation of food safety and security; |
| ● | product contamination or recall concerns; |
| ● | fluctuations in the prices of live cattle, hogs, chicken, corn and soymeal; |
| ● | fluctuations in the selling prices of beef, pork and chicken products; |
| ● | developments in, or changes to, the laws, regulations and governmental policies governing our business and products or failure to comply with them, including environmental and sanitary liabilities; |
| ● | currency exchange rate fluctuations, trade barriers, exchange controls, political risk and other risks associated with export and foreign operations; |
| ● | changes in international trade regulations; |
| ● | our strategic direction and future operation; |
| ● | deterioration of economic conditions globally and more specifically in the principal markets in which we operate; |
| ● | our ability to implement our business plan, including our ability to arrange financing when required and on reasonable terms and the implementation of our financing strategy and capital expenditure plan; |
| ● | the successful integration or implementation of mergers and acquisitions, joint ventures, strategic alliances or divestiture plans; |
| ● | the competitive nature of the industry in which we operate and the consolidation of our customers; |
| ● | customer demands and preferences; |
| ● | our level of indebtedness; |
| ● | adverse weather conditions in our areas of operations; |
| ● | continued access to a stable workforce and favorable labor relations with employees; |
| ● | our dependence on key members of our management; |
36
| ● | the interests of our ultimate controlling shareholders; |
| ● | reputational risk in connection with U.S. and Brazilian civil and criminal actions and investigations involving our ultimate controlling shareholders, and the outcome of these actions; |
| ● | economic instability in Brazil and a resulting reduction in market confidence in the Brazilian economy; |
| ● | political crises in Brazil; |
| ● | the declaration or payment of dividends or interest attributable to shareholders’ equity; |
| ● | the ongoing war between Russia and Ukraine and the ongoing conflict involving Israel, the United States and Iran in the Middle East, including higher prices for commodities, such as food products, ingredients and energy products, increasing inflation in some countries, and disrupted trade and supply chains as a result of disruptions caused by these conflicts; |
| ● | changes in the global trade and tariff environment, including new trade restrictions, tariff escalations, and policy shifts affecting cross-border commerce and supply chains, such as recent U.S. tariff increases on imports from several countries; |
| ● | unfavorable outcomes in legal and regulatory proceedings and government investigations that we are, or may become, a party to; |
| ● | the risk factors discussed under the heading “Item 3. Key Information—D. Risk Factors” in our Form 20-F; |
| ● | other factors or trends affecting our financial condition, liquidity or results of operations; and |
| ● | other statements contained in this MD&A regarding matters that are not historical facts. |
In addition, there may be other factors and uncertainties, many of which are beyond our control, that could cause our actual results and events to be materially different from the results referenced in the forward-looking statements. Many of these factors will be important in determining our actual future results. Consequently, any or all of our forward-looking statements may turn out to be inaccurate.
We caution investors not to place undue reliance on any forward-looking statements, which speak only as of the date made. Except as required by law, we undertake no obligation to publicly update any forward-looking statements, whether as a result of new information, future events or otherwise.
All forward-looking statements contained in this MD&A are qualified in their entirety by this cautionary statement.
37