Shareholder Report
Feb. 28, 2026
USD ($)
$ / shares
WHAT WERE THE FUND COSTS FOR THE PAST YEAR? (based on a hypothetical $10,000 investment)
|
Fund Name
|
Costs of a $10,000 investment
|
Costs paid as a percentage of a $10,000 investment*,**
|
|
Tema Alternative Asset Managers ETF
|
$28
|
0.75%
|
WHAT FACTORS INFLUENCED PERFORMANCE
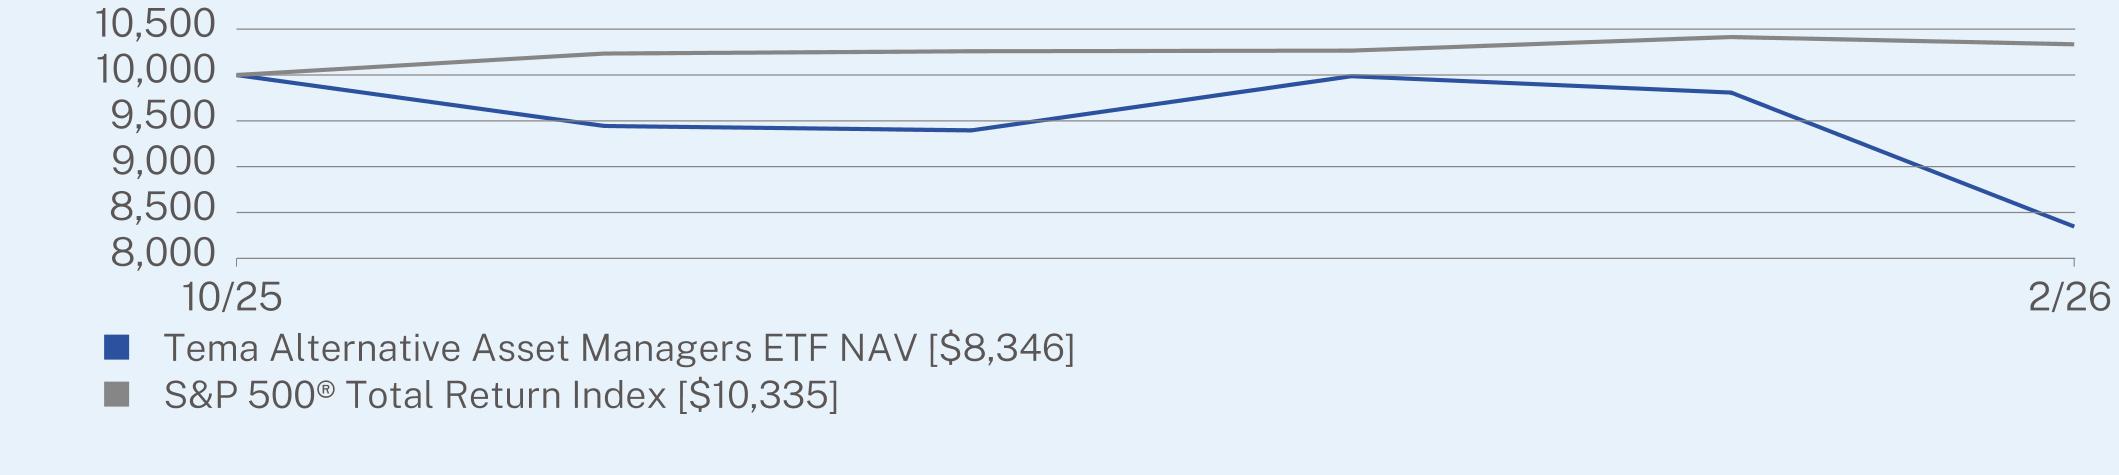
The Fund launched during the annual period and therefore presents performance from inception rather than a full twelve-month return. Since inception, the Fund experienced negative performance (-16.54%), reflecting concerns in private credit, exposure to feared AI disruption and general macro headwinds from geopolitics and rates.
|
Top Contributors
|
|
|
↑
|
Tikehau Capital
|
|
↑
|
Wheaton Precious Metals Corp.
|
|
↑
|
Wendel
|
|
Top Detractors
|
|
|
↓
|
Stepstone Group Inc.
|
|
↓
|
Hamilton Lane Inc.
|
|
↓
|
Ares Management Corp.
|
CUMULATIVE TOTAL RETURN (%)
|
|
Since Inception
(10/01/2025) |
|
Tema Alternative Asset Managers ETF NAV
|
-16.54
|
|
S&P 500® Total Return Index
|
3.35
|
Visit https://temaetfs.com/aaum for more recent performance information.
Visit https://temaetfs.com/aaum for more recent performance information.
KEY FUND STATISTICS (as of February 28, 2026)
|
Net Assets
|
$2,039,471
|
|
Number of Holdings
|
30
|
|
Net Advisory Fee
|
$7,280
|
|
Portfolio Turnover
|
7%
|
WHAT DID THE FUND INVEST IN? (as of February 28, 2026)
|
Top 10 Issuers
|
(% of net assets)
|
|
Brookfield Corp.
|
5.8%
|
|
EQT AB
|
5.3%
|
|
Partners Group Holding AG
|
5.1%
|
|
Carlyle Group, Inc.
|
5.1%
|
|
Brookfield Asset Management Ltd.
|
5.0%
|
|
Hamilton Lane, Inc.
|
4.9%
|
|
Apollo Global Management, Inc.
|
4.8%
|
|
KKR & Co., Inc.
|
4.7%
|
|
TPG, Inc.
|
4.6%
|
|
Blackstone, Inc.
|
4.6%
|
|
Top Sectors*
|
(% of net assets)
|
|
Financials
|
98.0%
|
|
Materials
|
0.9%
|
|
Cash & Other
|
1.1%
|
WHAT WERE THE FUND COSTS FOR THE PAST YEAR? (based on a hypothetical $10,000 investment)
|
Fund Name
|
Costs of a $10,000 investment
|
Costs paid as a percentage of a $10,000 investment
|
|
Tema American Reshoring ETF
|
$94
|
0.75%
|
WHAT FACTORS INFLUENCED PERFORMANCE
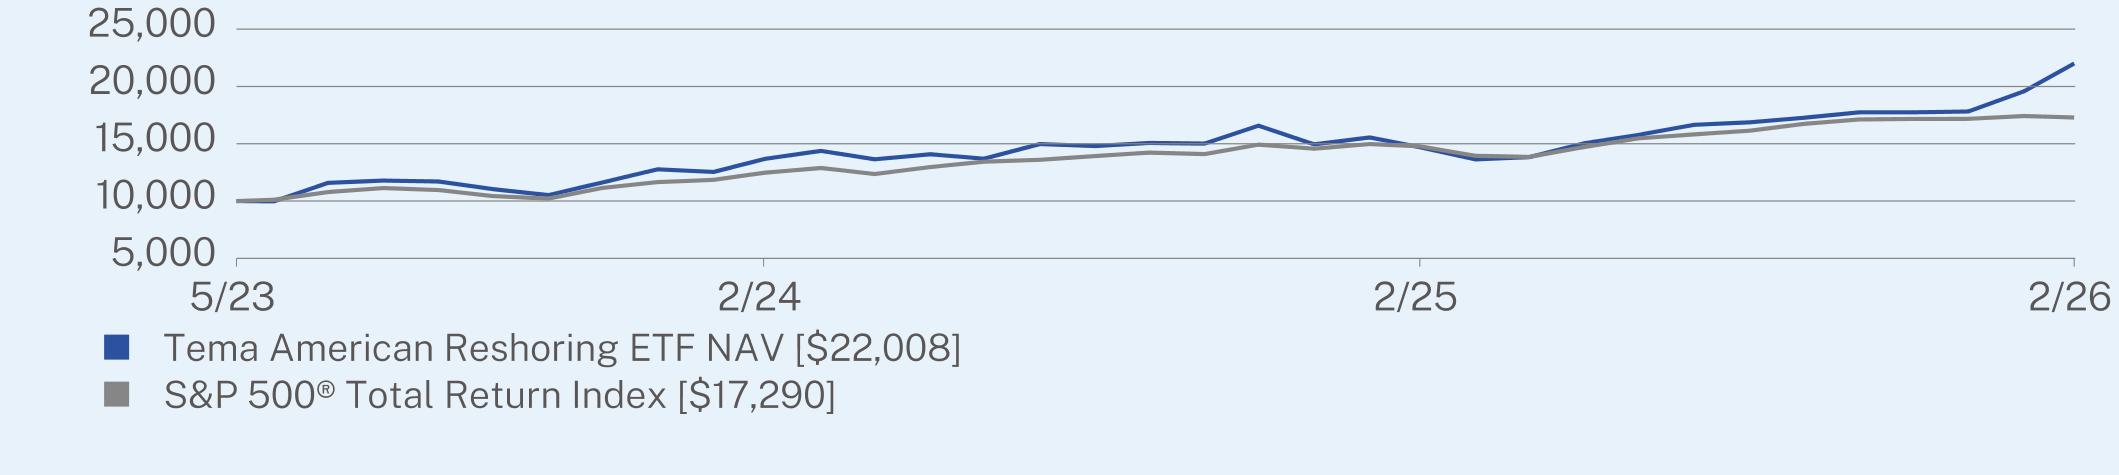
During the annual period, the Fund delivered strong positive performance (+49.78%), driven by robust conditions across domestic US industrial and manufacturing names. Key tailwinds included sustained policy support for domestic manufacturing investment, infrastructure spending, and strong earnings momentum across the Fund’s mid-cap industrials holdings, while periodic volatility stemming from global trade uncertainty and interest rate sensitivity among capital-intensive names presented headwinds at points during the period.
|
Top Contributors
|
|
|
↑
|
ATI Inc.
|
|
↑
|
Caterpillar Inc.
|
|
↑
|
Powell Industries Inc.
|
|
Top Detractors
|
|
|
↓
|
Herc Holdings Inc.
|
|
↓
|
WESCO International Inc.
|
|
↓
|
Federal Signal Corp.
|
ANNUAL AVERAGE TOTAL RETURN (%)
|
|
1 Year
|
Since Inception
(05/11/2023) |
|
Tema American Reshoring ETF NAV
|
49.78
|
32.47
|
|
S&P 500® Total Return Index
|
16.99
|
21.55
|
Visit https://temaetfs.com/rsho for more recent performance information.
Visit https://temaetfs.com/rsho for more recent performance information.
KEY FUND STATISTICS (as of February 28, 2026)
|
Net Assets
|
$264,188,527
|
|
Number of Holdings
|
27
|
|
Net Advisory Fee
|
$1,308,790
|
|
Portfolio Turnover
|
52%
|
WHAT DID THE FUND INVEST IN? (as of February 28, 2026)
|
Top 10 Issuers
|
(% of net assets)
|
|
Timken Co.
|
7.0%
|
|
Powell Industries, Inc.
|
6.7%
|
|
Gates Industrial Corp. PLC
|
6.2%
|
|
Cognex Corp.
|
5.9%
|
|
Caterpillar, Inc.
|
5.9%
|
|
Terex Corp.
|
5.7%
|
|
ATI, Inc.
|
5.3%
|
|
Rockwell Automation, Inc.
|
5.2%
|
|
Applied Industrial Technologies, Inc.
|
4.9%
|
|
Ingersoll Rand, Inc.
|
4.6%
|
|
Top Sectors*
|
(% of net assets)
|
|
Industrials
|
85.3%
|
|
Materials
|
6.9%
|
|
Information Technology
|
5.9%
|
|
Energy
|
0.7%
|
|
Cash & Other
|
1.2%
|
This report describes changes to the Fund that occurred during the reporting period.
WHAT WERE THE FUND COSTS FOR THE PAST YEAR? (based on a hypothetical $10,000 investment)
|
Fund Name
|
Costs of a $10,000 investment
|
Costs paid as a percentage of a $10,000 investment
|
|
Tema Durable Quality ETF
|
$58
|
0.55%
|
WHAT FACTORS INFLUENCED PERFORMANCE
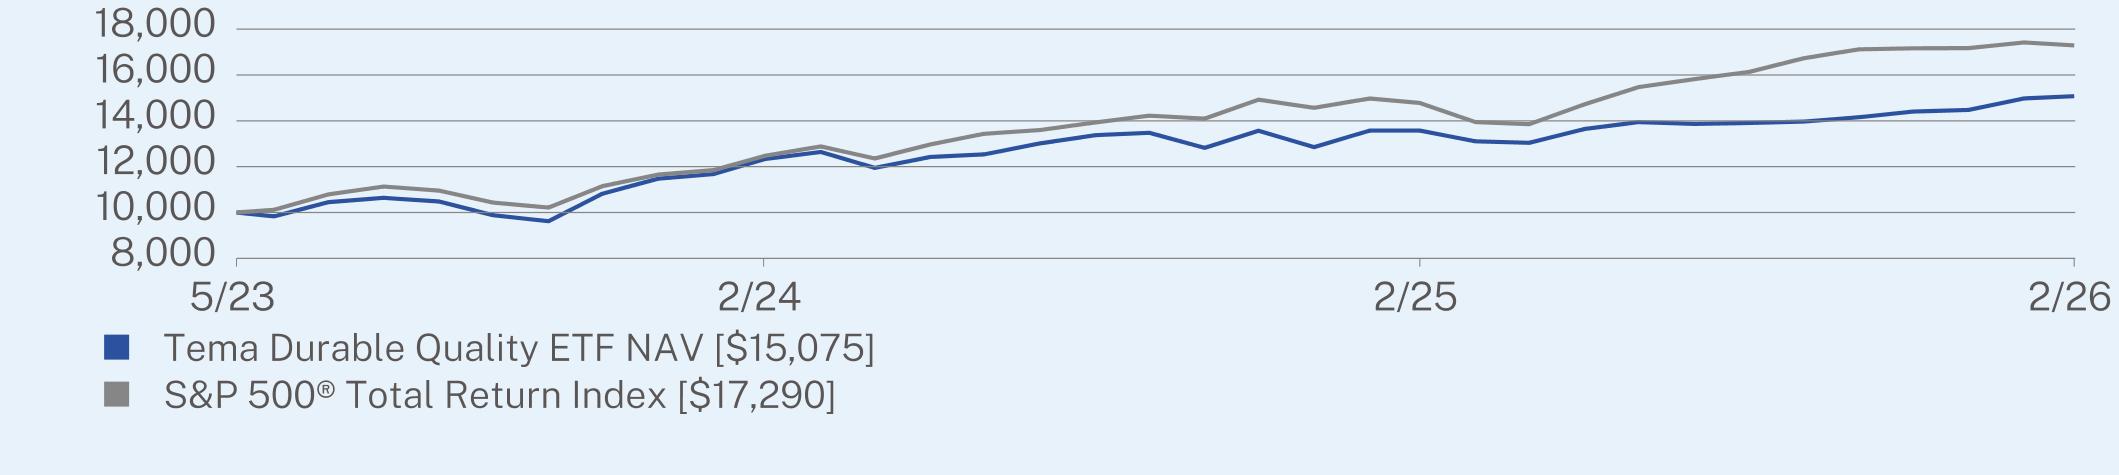
During the annual period, the Fund delivered positive performance (+11.05%), reflecting a broadly supportive environment for high-quality, competitively advantaged businesses across Financials, Information Technology, and Healthcare. The quality factor was generally rewarded over the period, though intermittent episodes of broader market risk appetite, where lower-quality higher-beta names outperformed, presented headwinds at points during the period.
|
Top Contributors
|
|
|
↑
|
Lam Research Corp.
|
|
↑
|
GE Aerospace
|
|
↑
|
KLA Corp.
|
|
Top Detractors
|
|
|
↓
|
Intuit Inc.
|
|
↓
|
Teradyne Inc.
|
|
↓
|
Icon PLC
|
ANNUAL AVERAGE TOTAL RETURN (%)
|
|
1 Year
|
Since Inception
(05/11/2023) |
|
Tema Durable Quality ETF NAV
|
11.05
|
15.75
|
|
S&P 500® Total Return Index
|
16.99
|
21.55
|
Visit https://temaetfs.com/toll for more recent performance information.
Visit https://temaetfs.com/toll for more recent performance information.
KEY FUND STATISTICS (as of February 28, 2026)
|
Net Assets
|
$48,470,521
|
|
Number of Holdings
|
42
|
|
Net Advisory Fee
|
$328,589
|
|
Portfolio Turnover
|
51%
|
WHAT DID THE FUND INVEST IN? (as of February 28, 2026)
|
Top 10 Issuers
|
(% of net assets)
|
|
GE Aerospace
|
6.2%
|
|
Lam Research Corp.
|
4.9%
|
|
Visa, Inc.
|
4.9%
|
|
Cboe Global Markets, Inc.
|
4.3%
|
|
Performance Food Group Co.
|
4.3%
|
|
KLA Corp.
|
3.9%
|
|
Ferrovial SE
|
3.3%
|
|
Thermo Fisher Scientific, Inc.
|
3.0%
|
|
Fortinet, Inc.
|
2.9%
|
|
Moody’s Corp.
|
2.9%
|
|
Top Sectors*
|
(% of net assets)
|
|
Information Technology
|
27.7%
|
|
Financials
|
27.2%
|
|
Industrials
|
17.8%
|
|
Health Care
|
13.7%
|
|
Consumer Staples
|
7.5%
|
|
Materials
|
3.7%
|
|
Utilities
|
1.4%
|
|
Cash & Other
|
1.0%
|
Fund Name Change:
On June 27, 2025 the Tema Monopolies and Oligopolies ETF was renamed to Tema Durable Quality ETF.
WHAT WERE THE FUND COSTS FOR THE PAST YEAR? (based on a hypothetical $10,000 investment)
|
Fund Name
|
Costs of a $10,000 investment
|
Costs paid as a percentage of a $10,000 investment
|
|
Tema Electrification ETF
|
$98
|
0.75%
|
WHAT FACTORS INFLUENCED PERFORMANCE
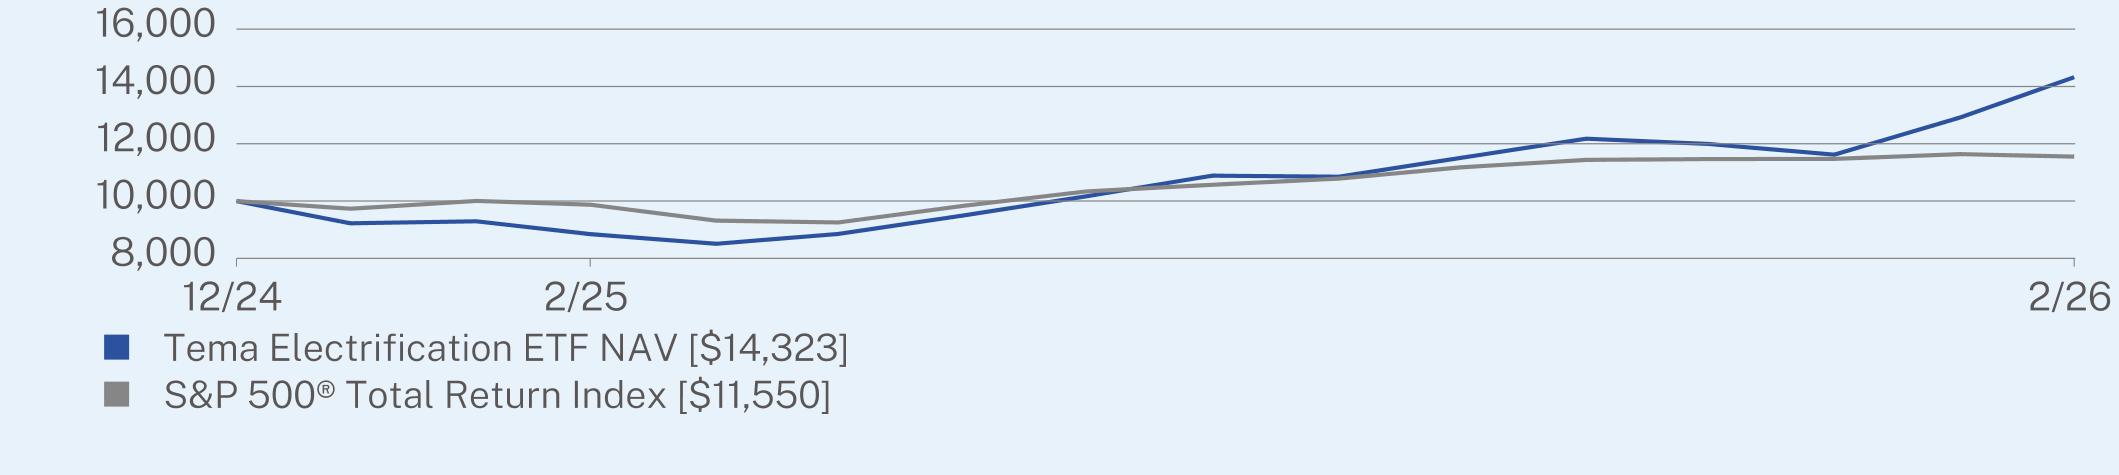
During the annual period, the Fund delivered exceptionally strong positive performance (+61.94%), driven by structural demand for grid modernization, data center power infrastructure, and AI-related electricity investment. The Fund’s exposure to mid-cap Industrials and Utilities names proved well-positioned to capture these themes.
|
Top Contributors
|
|
|
↑
|
Bel Fuse Inc.
|
|
↑
|
Powell Industries Inc.
|
|
↑
|
GE Nernova Inc.
|
|
Top Detractors
|
|
|
↓
|
Itron Inc.
|
|
↓
|
Mirion Technologies Inc.
|
|
↓
|
Infineon Technologies
|
ANNUAL AVERAGE TOTAL RETURN (%)
|
|
1 Year
|
Since Inception
(12/04/2024) |
|
Tema Electrification ETF NAV
|
61.94
|
33.66
|
|
S&P 500® Total Return Index
|
16.99
|
12.34
|
Visit https://temaetfs.com/volt for more recent performance information.
Visit https://temaetfs.com/volt for more recent performance information.
KEY FUND STATISTICS (as of February 28, 2026)
|
Net Assets
|
$442,383,480
|
|
Number of Holdings
|
32
|
|
Net Advisory Fee
|
$1,175,493
|
|
Portfolio Turnover
|
32%
|
WHAT DID THE FUND INVEST IN? (as of February 28, 2026)
|
Top 10 Issuers
|
(% of net assets)
|
|
Bel Fuse, Inc.
|
6.5%
|
|
Powell Industries, Inc.
|
6.4%
|
|
NextEra Energy, Inc.
|
6.2%
|
|
Quanta Services, Inc.
|
4.8%
|
|
American Electric Power Co., Inc.
|
4.6%
|
|
Amphenol Corp.
|
4.2%
|
|
GE Vernova, Inc.
|
4.0%
|
|
Hubbell, Inc.
|
3.9%
|
|
Entergy Corp.
|
3.9%
|
|
Energy Transfer LP
|
3.7%
|
|
Top Sectors*
|
(% of net assets)
|
|
Industrials
|
46.2%
|
|
Utilities
|
31.9%
|
|
Information Technology
|
16.9%
|
|
Energy
|
4.4%
|
|
Cash & Other
|
0.6%
|
This report describes changes to the Fund that occurred during the reporting period.
WHAT WERE THE FUND COSTS FOR THE PAST YEAR? (based on a hypothetical $10,000 investment)
|
Fund Name
|
Costs of a $10,000 investment
|
Costs paid as a percentage of a $10,000 investment
|
|
Tema Heart & Health ETF
|
$82
|
0.75%
|
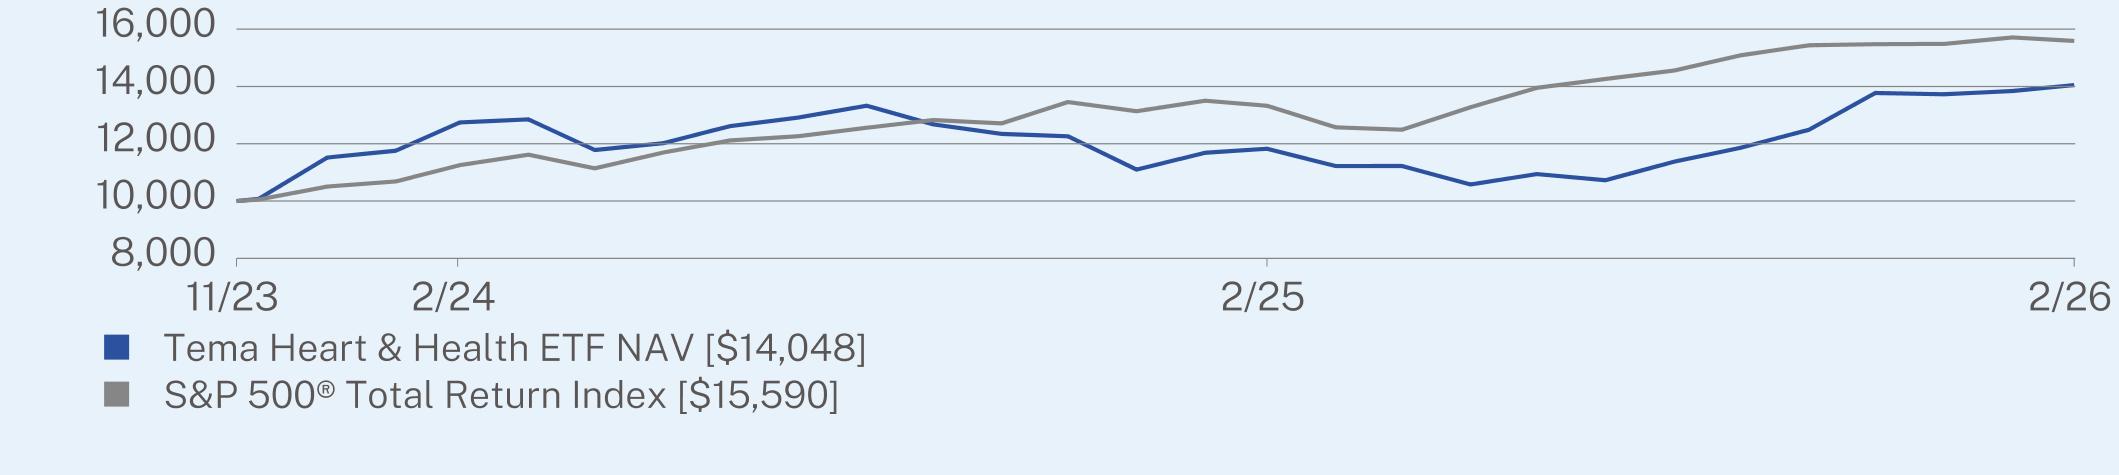
WHAT FACTORS INFLUENCED PERFORMANCE
During the annual period, the Fund delivered positive performance (+18.79%), underpinned by broad strength across large-cap healthcare names and meaningful contributions from holdings with exposure to the obesity drug themes. Intermittent pressure on managed care names and pharmaceutical pricing concerns presented modest headwinds at points during the period.
|
Top Contributors
|
|
|
↑
|
Arrowhead Pharmaceuticals Inc.
|
|
↑
|
Bridgebio Pharma Inc.
|
|
↑
|
Revolution Medicines Inc.
|
|
Top Detractors
|
|
|
↓
|
Novo Nordisk
|
|
↓
|
UnitedHealth Group Inc.
|
|
↓
|
Boston Scientific Corp.
|
ANNUAL AVERAGE TOTAL RETURN (%)
|
|
1 Year
|
Since Inception
(11/21/2023) |
|
Tema Heart & Health ETF NAV
|
18.79
|
16.12
|
|
S&P 500® Total Return Index
|
16.99
|
21.57
|
Visit https://temaetfs.com/hrts for more recent performance information.
Visit https://temaetfs.com/hrts for more recent performance information.
KEY FUND STATISTICS (as of February 28, 2026)
|
Net Assets
|
$55,315,427
|
|
Number of Holdings
|
45
|
|
Net Advisory Fee
|
$396,841
|
|
Portfolio Turnover
|
40%
|
WHAT DID THE FUND INVEST IN? (as of February 28, 2026)
|
Top 10 Issuers
|
(% of net assets)
|
|
Eli Lilly & Co.
|
10.0%
|
|
Roche Holding AG
|
5.5%
|
|
Johnson & Johnson
|
4.9%
|
|
AstraZeneca PLC
|
4.8%
|
|
Merck & Co., Inc.
|
4.2%
|
|
Thermo Fisher Scientific, Inc.
|
4.0%
|
|
UnitedHealth Group, Inc.
|
3.8%
|
|
Gilead Sciences, Inc.
|
3.6%
|
|
Novartis AG
|
3.6%
|
|
Abbott Laboratories
|
3.4%
|
|
Top Sectors*
|
(% of net assets)
|
|
Health Care
|
99.2%
|
|
Cash & Other
|
0.8%
|
Fund Name Change:
On June 27, 2025 the Tema GLP-1, Obesity & Cardiometabolic ETF was renamed Tema Heart & Health ETF.
This report describes changes to the Fund that occurred.
WHAT WERE THE FUND COSTS FOR THE PAST YEAR? (based on a hypothetical $10,000 investment)
|
Fund Name
|
Costs of a $10,000 investment
|
Costs paid as a percentage of a $10,000 investment*,**
|
|
Tema International Defense Innovation ETF
|
$30
|
0.68%
|
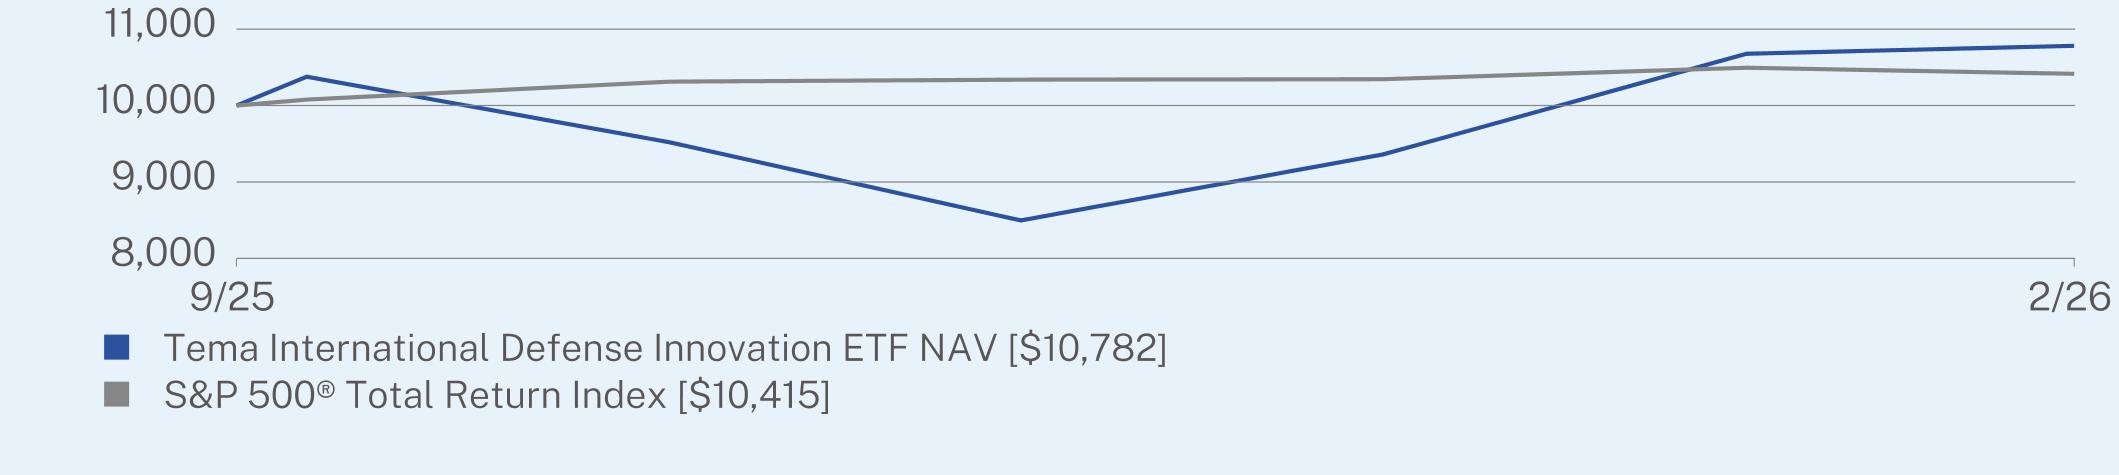
WHAT FACTORS INFLUENCED PERFORMANCE
The Fund launched during the annual period and therefore presents performance from inception rather than a full twelve-month return. Since inception, the Fund delivered a modest positive return (+7.82%), with the European defense complex experiencing a meaningful re-rating driven by heightened geopolitical developments and increased defense spending commitments, before partially consolidating those gains later in the period.
|
Top Contributors
|
|
|
↑
|
Kongsberg Gruppen ASA
|
|
↑
|
Indra Sistemas SA
|
|
↑
|
Elbit Systems Ltd.
|
|
Top Detractors
|
|
|
↓
|
Rocket Lab Corp.
|
|
↓
|
Aerovironment Inc.
|
|
↓
|
Hensoldt AG
|
CUMULATIVE TOTAL RETURN (%)
|
|
Since Inception
(09/25/2025) |
|
Tema International Defense Innovation ETF NAV
|
7.82
|
|
S&P 500® Total Return Index
|
4.15
|
Visit https://temaetfs.com/army for more recent performance information.
Visit https://temaetfs.com/army for more recent performance information.
KEY FUND STATISTICS (as of February 28, 2026)
|
Net Assets
|
$1,374,111
|
|
Number of Holdings
|
33
|
|
Net Advisory Fee
|
$7,230
|
|
Portfolio Turnover
|
9%
|
WHAT DID THE FUND INVEST IN? (as of February 28, 2026)
|
Top 10 Issuers
|
(% of net assets)
|
|
Kongsberg Gruppen ASA
|
5.7%
|
|
Elbit Systems Ltd.
|
5.2%
|
|
Saab AB
|
4.6%
|
|
Indra Sistemas SA
|
4.5%
|
|
Dassault Aviation SA
|
4.4%
|
|
BAE Systems PLC
|
4.4%
|
|
Leonardo SpA
|
4.1%
|
|
Rheinmetall AG
|
4.0%
|
|
Thales SA
|
3.9%
|
|
Babcock International Group PLC
|
3.9%
|
|
Top Sectors*
|
(% of net assets)
|
|
Industrials
|
92.3%
|
|
Information Technology
|
6.3%
|
|
Cash & Other
|
1.4%
|
Fund Name and Ticker Change:
Effective March 25, 2026, Tema International Defense Innovation ETF changed its name to Tema International Defense ETF, and changed its ticker from GDFN to ARMY.
WHAT WERE THE FUND COSTS FOR THE PAST YEAR? (based on a hypothetical $10,000 investment)
|
Fund Name
|
Costs of a $10,000 investment
|
Costs paid as a percentage of a $10,000 investment*,**
|
|
Tema International Durable Quality ETF
|
$29
|
0.60%
|
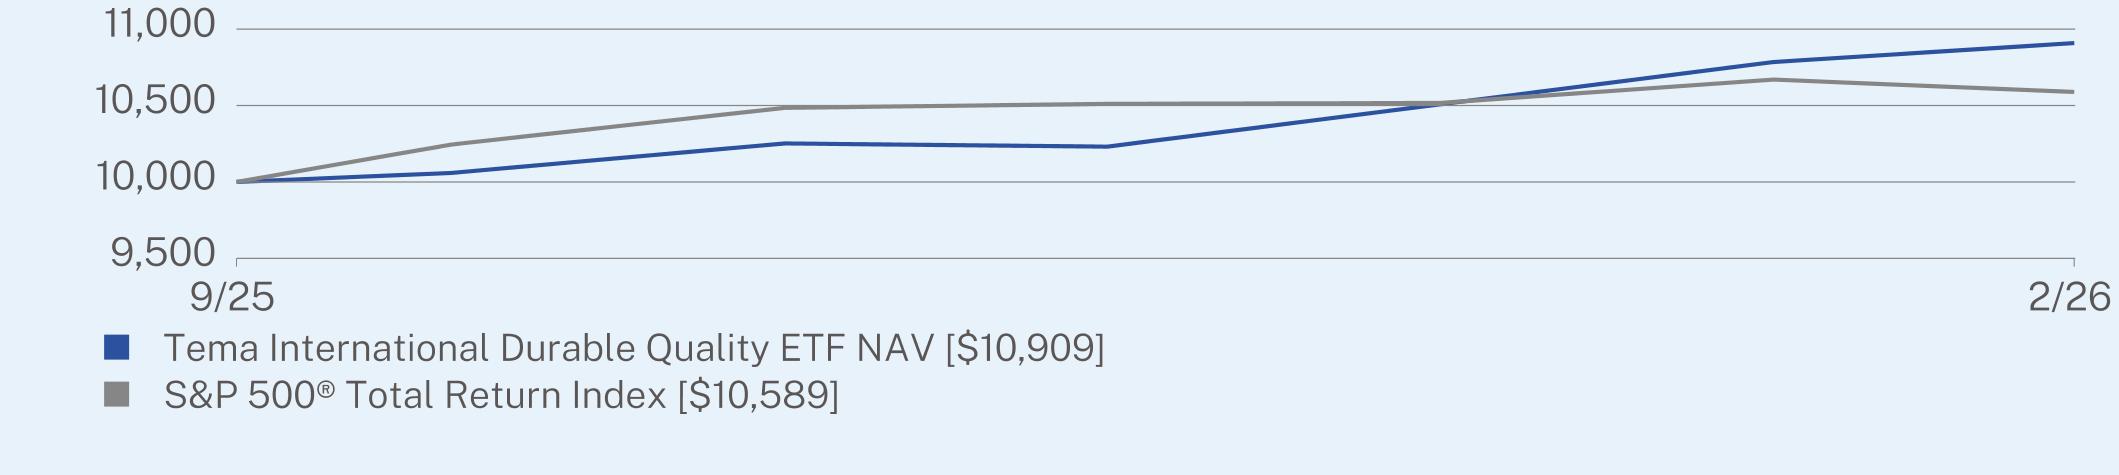
WHAT FACTORS INFLUENCED PERFORMANCE
The Fund launched during the annual period and therefore presents performance from inception rather than a full twelve-month return. Since inception, the Fund delivered a modest positive return (+9.18%), with its predominantly European and APAC quality-oriented holdings facing a more challenging environment than domestic US equities, reflecting uneven international earnings trends over the period.
|
Top Contributors
|
|
|
↑
|
Advantest Corp.
|
|
↑
|
Disco Corp.
|
|
↑
|
Schneider Electric SE
|
|
Top Detractors
|
|
|
↓
|
Icon PLC
|
|
↓
|
Intuit Inc.
|
|
↓
|
UBS Group
|
CUMULATIVE TOTAL RETURN (%)
|
|
Since Inception
(09/11/2025) |
|
Tema International Durable Quality ETF NAV
|
9.09
|
|
S&P 500® Total Return Index
|
5.89
|
Visit https://temaetfs.com/itol for more recent performance information.
Visit https://temaetfs.com/itol for more recent performance information.
KEY FUND STATISTICS (as of February 28, 2026)
|
Net Assets
|
$545,458
|
|
Number of Holdings
|
41
|
|
Net Advisory Fee
|
$10,811
|
|
Portfolio Turnover
|
7%
|
WHAT DID THE FUND INVEST IN? (as of February 28, 2026)
|
Top 10 Issuers
|
(% of net assets)
|
|
Advantest Corp.
|
5.7%
|
|
Safran SA
|
4.5%
|
|
Disco Corp.
|
4.4%
|
|
Taiwan Semiconductor Manufacturing Co. Ltd.
|
3.8%
|
|
Wheaton Precious Metals Corp.
|
3.4%
|
|
Ferrovial SE
|
3.3%
|
|
Titan SA
|
3.2%
|
|
Schneider Electric SE
|
3.1%
|
|
NXP Semiconductors NV
|
3.0%
|
|
AstraZeneca PLC
|
2.8%
|
|
Top Sectors*
|
(% of net assets)
|
|
Industrials
|
22.1%
|
|
Financials
|
22.1%
|
|
Information Technology
|
19.0%
|
|
Materials
|
10.9%
|
|
Consumer Discretionary
|
8.5%
|
|
Health Care
|
8.1%
|
|
Consumer Staples
|
7.3%
|
|
Communication Services
|
0.5%
|
|
Cash & Other
|
1.5%
|
WHAT WERE THE FUND COSTS FOR THE PAST YEAR? (based on a hypothetical $10,000 investment)
|
Fund Name
|
Costs of a $10,000 investment
|
Costs paid as a percentage of a $10,000 investment
|
|
Tema Oncology ETF
|
$93
|
0.75%
|
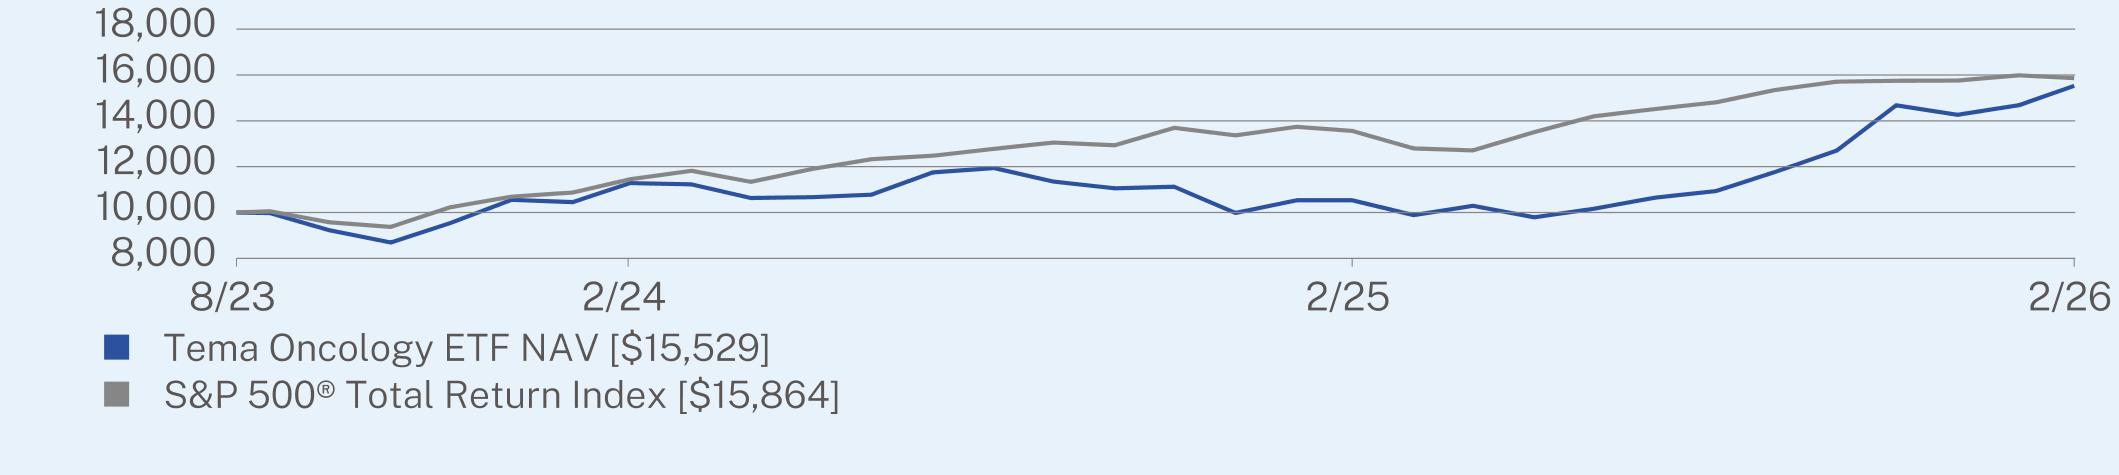
WHAT FACTORS INFLUENCED PERFORMANCE
During the annual period, the Fund delivered strong positive performance (+47.42%), reflecting a favorable environment for oncology-focused names. Key tailwinds included positive clinical data flow, active merger and acquisition activity within the oncology space, and strong earnings from large-cap pharmaceutical holdings, while binary clinical risk among smaller-cap positions represented the primary source of volatility during the period.
|
Top Contributors
|
|
|
↑
|
Revolution Medicines Inc.
|
|
↑
|
Cogent Biosciences Inc.
|
|
↑
|
Merus NV
|
|
Top Detractors
|
|
|
↓
|
Zai Lab Ltd.
|
|
↓
|
Legend Biotech Corp.
|
|
↓
|
Janux Therapeautics Inc.
|
ANNUAL AVERAGE TOTAL RETURN (%)
|
|
1 Year
|
Since Inception
(08/15/2023) |
|
Tema Oncology ETF NAV
|
47.42
|
18.90
|
|
S&P 500® Total Return Index
|
16.99
|
19.90
|
Visit https://temaetfs.com/canc for more recent performance information.
Visit https://temaetfs.com/canc for more recent performance information.
KEY FUND STATISTICS (as of February 28, 2026)
|
Net Assets
|
$159,877,544
|
|
Number of Holdings
|
56
|
|
Net Advisory Fee
|
$651,924
|
|
Portfolio Turnover
|
68%
|
WHAT DID THE FUND INVEST IN? (as of February 28, 2026)
|
Top 10 Issuers
|
(% of net assets)
|
|
Revolution Medicines, Inc.
|
6.3%
|
|
Novartis AG
|
5.0%
|
|
Bridgebio Pharma, Inc.
|
4.8%
|
|
AstraZeneca PLC
|
4.6%
|
|
Eli Lilly & Co.
|
4.3%
|
|
Bristol-Myers Squibb Co.
|
4.2%
|
|
Roche Holding AG
|
4.1%
|
|
Merck & Co., Inc.
|
3.8%
|
|
Arcellx, Inc.
|
3.4%
|
|
Cogent Biosciences, Inc.
|
3.3%
|
|
Top Sectors*
|
(% of net assets)
|
|
Health Care
|
99.3%
|
|
Cash & Other
|
0.7%
|
WHAT WERE THE FUND COSTS FOR THE PAST YEAR? (based on a hypothetical $10,000 investment)
|
Fund Name
|
Costs of a $10,000 investment
|
Costs paid as a percentage of a $10,000 investment*,**
|
|
Tema S&P 500® Historical Weight ETF Strategy
|
$18
|
0.18%
|
WHAT FACTORS INFLUENCED PERFORMANCE
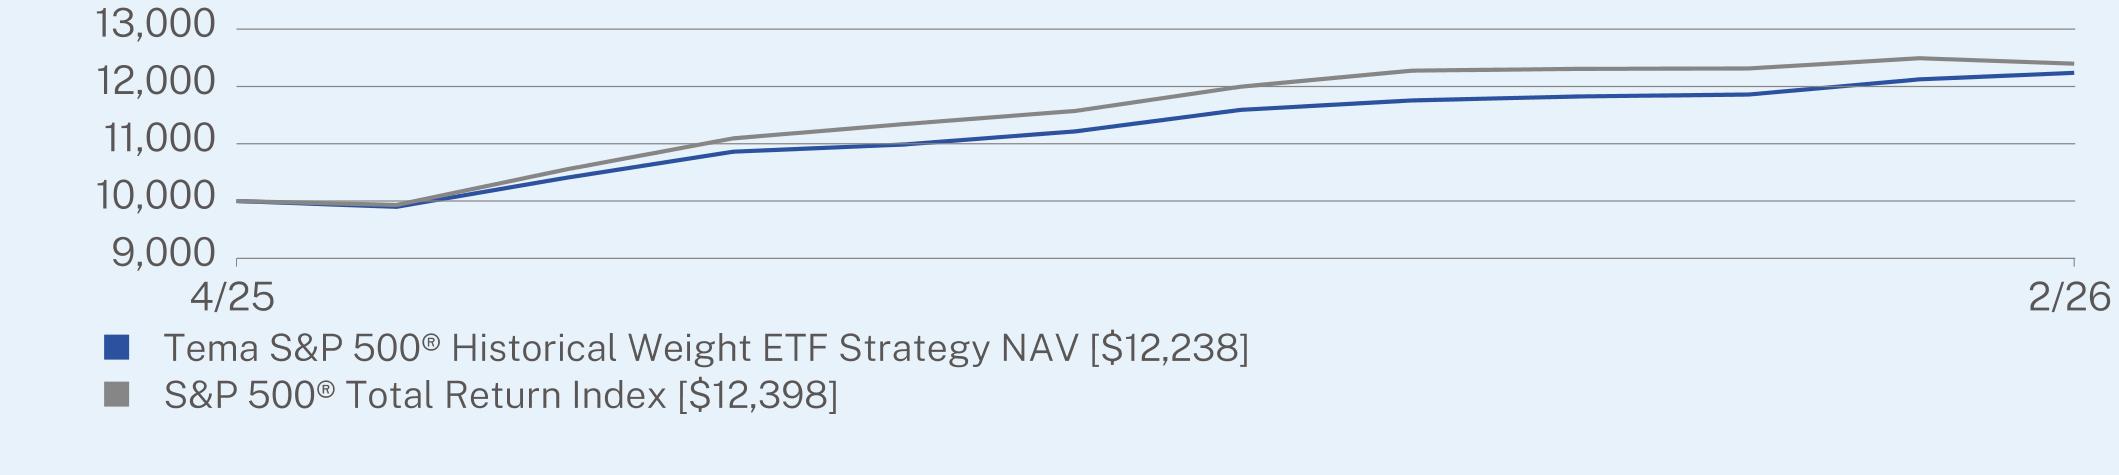
The Fund launched during the annual period and therefore presents performance from inception rather than a full twelve-month return. Since inception, the Fund delivered positive performance (+22.38%) consistent with its objective of reflecting the historical average weight of the constituents of the S&P 500, providing superior returns than equal-weight strategies in its peer group.
|
Top Contributors
|
|
|
↑
|
Nvidia Corp.
|
|
↑
|
Broadcom Inc.
|
|
↑
|
Alphabet Inc. - Class A
|
|
Top Detractors
|
|
|
↓
|
UnitedHealth Group Inc.
|
|
↓
|
Fiserv Inc.
|
|
↓
|
Salesforce Inc.
|
CUMULATIVE TOTAL RETURN (%)
|
|
Since Inception
(04/01/2025) |
|
Tema S&P 500® Historical Weight ETF Strategy NAV
|
22.38
|
|
S&P 500® Total Return Index
|
23.98
|
Visit https://temaetfs.com/dspy for more recent performance information.
Visit https://temaetfs.com/dspy for more recent performance information.
KEY FUND STATISTICS (as of February 28, 2026)
|
Net Assets
|
$805,918,604
|
|
Number of Holdings
|
505
|
|
Net Advisory Fee
|
$714,308
|
|
Portfolio Turnover
|
1%
|
WHAT DID THE FUND INVEST IN? (as of February 28, 2026)
|
Top 10 Issuers
|
(% of net assets)
|
|
NVIDIA Corp.
|
3.9%
|
|
Apple, Inc.
|
2.9%
|
|
Alphabet, Inc.
|
2.2%
|
|
Microsoft Corp.
|
2.0%
|
|
Amazon.com, Inc.
|
1.8%
|
|
Meta Platforms, Inc.
|
1.6%
|
|
Broadcom, Inc.
|
1.6%
|
|
Berkshire Hathaway, Inc.
|
1.4%
|
|
Tesla, Inc.
|
1.4%
|
|
Eli Lilly & Co.
|
1.3%
|
|
Top Sectors*
|
(% of net assets)
|
|
Information Technology
|
24.2%
|
|
Financials
|
14.6%
|
|
Health Care
|
12.2%
|
|
Industrials
|
12.0%
|
|
Consumer Discretionary
|
9.3%
|
|
Communication Services
|
7.2%
|
|
Consumer Staples
|
7.1%
|
|
Energy
|
4.6%
|
|
Utilities
|
3.1%
|
|
Cash & Other
|
5.7%
|
| [1] |
|
||
| [2] |
|
||
| [3] |
|
||
| [4] |
|
||
| [5] |
|
||
| [6] |
|
||
| [7] |
|
||
| [8] |
|
||
| [9] |
|
||
| [10] |
|
||
| [11] |
|
||
| [12] |
|
||
| [13] |
|
||
| [14] |
|
||
| [15] |
|
||
| [16] |
|
||
| [17] |
|