Concurrently with the Fund’s commencement of operations, the Fund acquired all of the assets and liabilities of the Predecessor Fund in the Reorganization. The Predecessor Fund had an investment objective and investment strategies that were similar as those of the Fund and the Fund has adopted the performance of the Predecessor Fund.
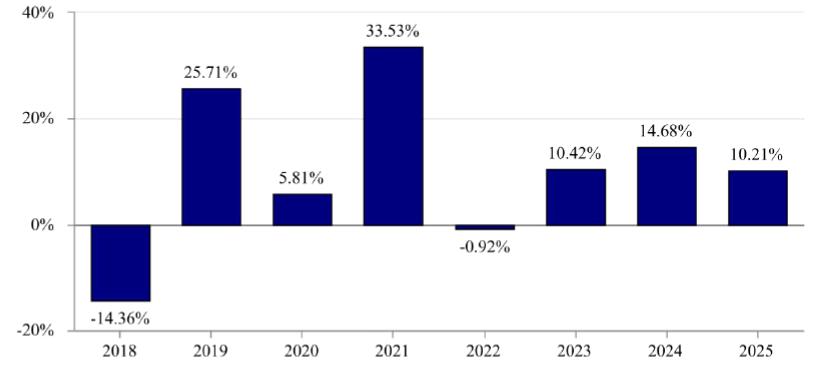
The bar chart and table below provide some indication of the risks of investing in the Fund. The Fund is adopting the performance of the Predecessor Fund as the result of the Reorganization. The bar chart shows changes in the Predecessor Fund’s performance from year to year. The table shows how the Predecessor Fund’s average annual returns for 1 year, 5 year and since inception periods compared with those of a broad-based securities market index. The Fund’s (and the Predecessor Fund’s) past performance (before and after taxes) is not necessarily an indication of how the Fund will perform in the future. Updated performance information for the Fund, including its current net asset value per share, is available on the Fund’s website at www.thruthsocialfunds.com or by calling toll-free at (201) 985-8300.
Effective with the commencement of operations of the Fund, the Index’s name changed from the Point Bridge America First Index to the Truth Social America First Index. Effective June 17, 2022, (i) the Index’s name changed from the Point Bridge GOP Stock Tracker Index to the Point Bridge America First Index; and (ii) the Index changed its methodology to remove a specific presidential campaign contribution screen and add a screen to eliminate companies that do not have U.S. assets greater than or equal to 50% of total assets. Consequently, the Predecessor Fund’s performance for periods prior to June 17, 2022, does not reflect the Fund’s current investment objective and principal investment strategy (or the Predecessor Fund’s performance since June 17, 2022). The Predecessor Fund’s performance may have differed if the Fund’s current strategy had been in place.
For the year-to-date period ended March 31, 2026, the Predecessor Fund’s total return was 4.28%.
During the period of time shown in the bar chart, the Predecessor Fund’s highest quarterly return was 22.88% for the quarter ended June 30, 2020, and the lowest quarterly return was -32.05% for the quarter ended March 31, 2020.
| Target Fund Performance | 1 Year | 5 Year | Since Inception (9/6/2017) |
| Return before Taxes | 10.21% | 13.05% | 10.84% |
| Return After Taxes on Distributions | 9.80% | 12.71% | 10.42% |
| Return After Taxes on Distributions and Sale of Fund Shares | 6.34% | 10.42% | 8.77% |
| Index Performance | |||
| Point Bridge America First Index (1) (reflects no deduction for fees, expenses or taxes) | 11.03% | 13.91% | 11.68% |
| S&P 500® Index (reflects no deduction for fees, expenses or taxes) | 17.88% | 14.42% | 14.95% |
| 1 | Effective with the commencement of operations of the Fund, the Index’s name changed from the Point Bridge America First Index to the Truth Social America First Index. Effective June 17, 2022, the Index’s name changed from the Point Bridge GOP Stock Tracker Index to the Point Bridge America First Index, and the Index changed its methodology to remove a specific presidential campaign contribution screen and add a screen to eliminate companies that do not have U.S. assets greater than or equal to 50% of total assets. |
After-tax returns are calculated using the historical highest individual federal marginal income tax rates during the period covered by the table above and do not reflect the impact of state and local taxes. Actual after-tax returns depend on an investor’s tax situation and may differ from those shown. After-tax returns shown are not relevant to investors who hold their Shares through tax-deferred arrangements such as an individual retirement account (“IRA”) or other tax-advantaged accounts. In certain cases, the figure representing “Return After Taxes on Distributions and Sale of Shares” may be higher than the other return figures for the same period. A higher after-tax return results when a capital loss occurs upon redemption and provides an assumed tax deduction that benefits the investor.