The Truth Social America First ETF (the “Fund”) seeks to track the performance, before fees and expenses, of the Truth Social America First Index (the “Index”).
The following table describes the fees and expenses you may pay if you buy, hold, and sell shares of the Fund (“Shares”). You may pay other fees, such as brokerage commissions and other fees to financial intermediaries, which are not reflected in the table and Example below.
| Annual Fund Operating Expenses(1) (expenses that you pay each year as a percentage of the value of your investment) | |
| Management Fees | 0.72% |
| Distribution and/or Service (12b-1) Fees | 0.00% |
| Other Expenses | 0.00% |
| Total Annual Fund Operating Expenses | 0.72% |
| (1) | The Fund’s investment adviser, Yorkville America Equities, LLC will pay all expenses incurred by the Fund (except for advisory fees ) excluding interest charges on any borrowings, dividends and other expenses on securities sold short, taxes, brokerage commissions and other expenses incurred in placing orders for the purchase and sale of securities and other investment instruments, acquired fund fees and expenses (“AFFE”), accrued deferred tax liability, distribution fees and expenses paid by the Fund under any distribution plan adopted pursuant to Rule 12b-1 under the Investment Company Act of 1940, as amended (the “1940 Act”) and litigation expenses, and other non-routine or extraordinary expenses (collectively, the “Excluded Expenses”). |
This Example is intended to help you compare the cost of investing in the Fund with the cost of investing in other funds. The Example assumes that you invest $10,000 in the Fund for the time periods indicated and then continue to hold or redeem all of your Shares at the end of those periods. The Example also assumes that your investment has a 5% return each year and that the Fund’s operating expenses remain the same. Although your actual costs may be higher or lower, based on these assumptions your costs would be:
| 1 Year | 3 Years | 5 Years | 10 Years |
| $74 | $230 | $401 | $894 |
| 1 Year | 3 Years | 5 Years | 10 Years |
| $74 | $230 | $401 | $894 |
The Fund pays transaction costs, such as commissions, when it buys and sells securities (or “turns over” its portfolio). A higher portfolio turnover rate may indicate higher transaction costs and may result in higher taxes when Shares are held in a taxable account. These costs, which are not reflected in annual fund operating expenses or in the Example, affect the Fund’s performance. Concurrently with the Fund’s commencement of operations, the Fund acquired all of the assets and liabilities of the Point Bridge America First ETF (the “Predecessor Fund”), in a tax-free reorganization (the “Reorganization”). In connection with the Reorganization, shares of the Predecessor Fund were exchanged for shares of the Fund. The Predecessor Fund had an investment objective and investment strategies that were similar as those of the Fund. The Fund’s turnover rate for periods prior to the commencement of operations for the Fund is that of the Predecessor Fund. For the fiscal year ended June 30, 2025, the Predecessor Fund’s portfolio turnover rate was 40% of the average value of its portfolio.
The Fund uses a “passive management” (or indexing) approach to track the performance, before fees and expenses, of the Index. The Index was developed by Point Bridge Capital, LLC, the Fund’s investment sub-adviser (“Point Bridge” or the “Sub-Adviser”).
Truth Social America First Index
The Index uses an objective, rules-based methodology to track the performance of U.S. companies whose employees and political action committees (“PACs”) are highly supportive of Republican candidates for election to the United States Congress, the Vice Presidency, or the Presidency (“Candidates”) and party-affiliated federal committees or groups that are subject to federal campaign contribution limits (e.g., Republican National Committee, National Republican Senatorial Committee) (“Committees”). Republican Candidates and Republican Committees receiving support from employees and/or PACs of companies in the Index have historically been more supportive of Republican policies than Democratic Candidates and Democratic Committees. The Index is composed of the common stock of public operating companies and real estate investment trusts (“REITs”).
Construction of the Index starts with an initial universe of the companies included in the Solactive GBS United States 500 Index. The Solactive GBS United States 500 Index intends to track the performance of the largest 500 companies from the US stock market. Constituents are selected based on company market capitalization and weighted by free-float market capitalization.
The universe is then screened by using (i) electoral campaign contribution data from the Federal Election Commission (the “FEC”) to eliminate companies whose employees and PACs have made aggregate reported political contributions of less than $25,000 across the two most recent election cycles and (ii) aggregated financial statement data from FactSet (or another market data source) to eliminate companies that do not have U.S. assets greater than or equal to 50% of total assets. Companies that do not have asset information available are still eligible for inclusion in the Index if their U.S. revenue is greater than or equal to 50% of total revenue.
Each election cycle spans two full calendar years, and the most recent election cycle ended December 31, 2024. FEC data typically includes only information pertaining to contributions from contributors who have given more than $200 to a campaign in an election cycle because smaller contributions are not required by U.S. campaign finance laws to be reported to the FEC.
Companies that satisfy the initial screening test are then ranked based on a proprietary screening process based primarily on the total dollars and the percentage of dollars given by a company’s employees and/or PAC to Republican Candidates and Republican Committees. The top 150 companies based on such rankings are included in the Index at the time of each reconstitution of the Index.
The Index is equally weighted and rebalanced (i.e., weights are reset to equal-weighted, but no companies are added or deleted) quarterly after the close of trading on the 1st Wednesday in each of February, May, August, and November. The Index will be reconstituted (i.e., companies are added or deleted based on the Index rules and weights are reset to equal-weighted) after the close of trading on the 3rd Friday of each June following the completion of an election cycle. The Index was reconstituted in June 2025, and the next scheduled reconstitution of the Index will take place in June 2027. Companies may also be added or removed from the Index upon their addition to or removal from the Solactive GBS United States 500 Index in accordance with the rules of the Index.
The Index was developed by the Sub-Adviser in 2017 prior to the commencement of operations of the Predecessor Fund.
Additional Information About the Index. The Adviser provides the Index to the Fund. Point Bridge created and is responsible for maintaining and applying the rules-based methodology of the Index. The Index is calculated by Solactive AG, an independent third-party (“Solactive AG” or the “Index Calculation Agent”) that is not affiliated with the Fund, the Adviser, the Sub-Adviser, the Trading Sub-Adviser, the Fund’s distributor, or any of their respective affiliates. The Index Calculation Agent provides information to the Fund about the Index constituents and does not provide investment advice with respect to the desirability of investing in, purchasing, or selling securities.
Eligibility for inclusion in the Index is based on political contributions made during the two most recent election cycles. Election cycles run for two calendar years with the most recent election cycle ending on December 31, 2024. Data regarding political contributions is sourced from the FEC and third parties (such as, for example, opensecrets.org, a U.S. nonprofit organization that tracks and publishes data on campaign finance and lobbying) that compile publicly available information from the FEC regarding political contributions. In constructing the Index, Point Bridge may rely upon third parties to compile data on a company’s political contributions. Point Bridge generally relies on third parties to determine whether political contributions to Committees are considered to be associated with the Republican or Democratic Party. To the extent a company is not reported on by the third parties Point Bridge uses to compile data, Point Bridge will pull the data on such company directly from the FEC website.
The Fund’s Investment Strategy
Under normal circumstances, at least 80% of the Fund’s net assets, plus borrowings for investment purposes, will be invested in the securities of U.S. companies. For purposes of this 80% policy, U.S. companies are companies that, at the time of purchase, have (i) U.S. assets greater than or equal to 50% of total assets or (ii) U.S. revenue greater than or equal to 50% of total revenue.
The Fund will generally use a “replication” strategy to achieve its investment objective, meaning it generally will invest in all of the component securities of the Index in approximately the same proportion as in the Index. However, the Fund may use a “representative sampling” strategy, meaning it may invest in a sample of the securities in the Index whose risk, return and other characteristics closely resemble the risk, return and other characteristics of the Index as a whole, when the Fund’s trading sub-adviser, Tuttle Capital Management, LLC (the “Trading Sub-Adviser”), believes it is in the best interests of the Fund (e.g., when replicating the Index involves practical difficulties or substantial costs, an Index constituent becomes temporarily illiquid, unavailable, or less liquid, or as a result of legal restrictions or limitations that apply to the Fund but not to the Index).
The Fund may invest in securities or other investments not included in the Index, but which the Fund’s Trading Sub-Adviser believes will help the Fund track the Index. For example, the Fund may invest in securities that are not components of the Index to reflect various corporate actions and other changes to the Index (such as reconstitutions, additions, and deletions).
To the extent the Index concentrates (i.e., holds more than 25% of its total assets) in the securities of a particular industry or group of related industries, the Fund will concentrate its investments to approximately the same extent as the Index. To the extent the Index is comprised of mid-capitalization companies, the Fund will invest in the securities of mid-capitalization companies.
As April 30, 2026, the Predecessor Fund invested a significant portion of its assets in the industrials, financials, and energy sectors; however, the Fund’s sector exposure may change from time to time.
Concurrently with the Fund’s commencement of operations, the Fund acquired all of the assets and liabilities of the Predecessor Fund in the Reorganization. The Predecessor Fund had an investment objective and investment strategies that were similar as those of the Fund and the Fund has adopted the performance of the Predecessor Fund.
The bar chart and table below provide some indication of the risks of investing in the Fund. The Fund is adopting the performance of the Predecessor Fund as the result of the Reorganization. The bar chart shows changes in the Predecessor Fund’s performance from year to year. The table shows how the Predecessor Fund’s average annual returns for 1 year, 5 year and since inception periods compared with those of a broad-based securities market index. The Fund’s (and the Predecessor Fund’s) past performance (before and after taxes) is not necessarily an indication of how the Fund will perform in the future. Updated performance information for the Fund, including its current net asset value per share, is available on the Fund’s website at www.thruthsocialfunds.com or by calling toll-free at (201) 985-8300.
Effective with the commencement of operations of the Fund, the Index’s name changed from the Point Bridge America First Index to the Truth Social America First Index. Effective June 17, 2022, (i) the Index’s name changed from the Point Bridge GOP Stock Tracker Index to the Point Bridge America First Index; and (ii) the Index changed its methodology to remove a specific presidential campaign contribution screen and add a screen to eliminate companies that do not have U.S. assets greater than or equal to 50% of total assets. Consequently, the Predecessor Fund’s performance for periods prior to June 17, 2022, does not reflect the Fund’s current investment objective and principal investment strategy (or the Predecessor Fund’s performance since June 17, 2022). The Predecessor Fund’s performance may have differed if the Fund’s current strategy had been in place.
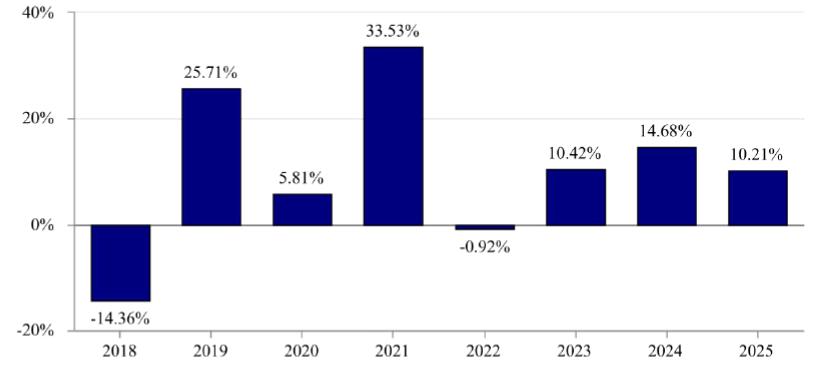
For the year-to-date period ended March 31, 2026, the Predecessor Fund’s total return was 4.28%.
During the period of time shown in the bar chart, the Predecessor Fund’s highest quarterly return was 22.88% for the quarter ended June 30, 2020, and the lowest quarterly return was -32.05% for the quarter ended March 31, 2020.
| Target Fund Performance | 1 Year | 5 Year | Since Inception (9/6/2017) |
| Return before Taxes | 10.21% | 13.05% | 10.84% |
| Return After Taxes on Distributions | 9.80% | 12.71% | 10.42% |
| Return After Taxes on Distributions and Sale of Fund Shares | 6.34% | 10.42% | 8.77% |
| Index Performance | |||
| Point Bridge America First Index (1) (reflects no deduction for fees, expenses or taxes) | 11.03% | 13.91% | 11.68% |
| S&P 500® Index (reflects no deduction for fees, expenses or taxes) | 17.88% | 14.42% | 14.95% |
| 1 | Effective with the commencement of operations of the Fund, the Index’s name changed from the Point Bridge America First Index to the Truth Social America First Index. Effective June 17, 2022, the Index’s name changed from the Point Bridge GOP Stock Tracker Index to the Point Bridge America First Index, and the Index changed its methodology to remove a specific presidential campaign contribution screen and add a screen to eliminate companies that do not have U.S. assets greater than or equal to 50% of total assets. |
After-tax returns are calculated using the historical highest individual federal marginal income tax rates during the period covered by the table above and do not reflect the impact of state and local taxes. Actual after-tax returns depend on an investor’s tax situation and may differ from those shown. After-tax returns shown are not relevant to investors who hold their Shares through tax-deferred arrangements such as an individual retirement account (“IRA”) or other tax-advantaged accounts. In certain cases, the figure representing “Return After Taxes on Distributions and Sale of Shares” may be higher than the other return figures for the same period. A higher after-tax return results when a capital loss occurs upon redemption and provides an assumed tax deduction that benefits the investor.