Pay vs Performance Disclosure - USD ($)
|
1 Months Ended |
11 Months Ended |
12 Months Ended |
Feb. 02, 2025 |
Dec. 31, 2025 |
Dec. 31, 2025 |
Dec. 31, 2024 |
Dec. 31, 2023 |
Dec. 31, 2022 |
Dec. 31, 2021 |
| Pay vs Performance Disclosure |
|
|
|
|
|
|
|
| Pay vs Performance Disclosure, Table |
|
|
The following table sets forth certain information with respect to Coursera’s financial performance and the compensation paid to our NEOs for the years ended December 31, 2025, 2024, 2023, 2022, and 2021. | | | | | | | | | | | | | | | | | | | | | | | | | | | | | | | | | | Pay Versus Performance | Year | Summary Compensation Table Total for PEO Maggioncalda(1) ($) | Compensation Actually Paid to PEO Maggioncalda(1)(2) ($) | Summary Compensation Table Total for PEO Hart(1) ($) | Compensation Actually Paid to PEO Hart(1)(2) ($) | Average Summary Compensation Table Total for Non-PEO NEOs(1) ($) | Average Compensation Actually Paid to Non-PEO NEOs(1)(2) ($) | Value of Initial Fixed $100 Investment Based On: | Net Loss(5) ($) | Company-Selected Measure: Revenue(6) ($) | Total Stockholder Return(3) ($) | Peer Group Total Stockholder Return(4) ($) | | | | | | | | | | | | | 2025 | 4,730,422 | | (4,464,697) | | 39,387,371 | | 36,134,649 | | 2,451,998 | | 1,679,721 | | 16 | | 161 | | (51,000,000) | | 757,500,000 | | | 2024 | 660,000 | | (21,769,084) | | — | | — | | 4,633,313 | | (1,362,579) | | 19 | | 153 | | (79,530,000) | | 694,670,000 | | | 2023 | 606,500 | | 21,167,366 | | — | | — | | 1,147,123 | | 6,956,342 | | 43 | | 122 | | (116,554,000) | | 635,764,000 | | | 2022 | 29,124,802 | | 19,912,204 | | — | | — | | 8,187,427 | | 3,364,720 | | 26 | | 77 | | (175,357,000) | | 523,756,000 | | | 2021 | 5,379,367 | | 9,345,438 | | — | | — | | 3,236,448 | | 7,133,735 | | 54 | | 120 | (145,215,000) | | 415,287,000 | |
|
|
|
|
|
| Company Selected Measure Name |
|
|
Revenue (Company Selected Measure)
|
|
|
|
|
| Named Executive Officers, Footnote |
|
|
The PEOs and NEOs included in the above table for each year were: | | | | | | | | | | PEOs | non-PEO NEOs | | | | | 2025 | Jeffrey Maggioncalda and Greg Hart | Michael Foley, Kenneth Hahn, Alan Cardenas, and Marcelo Modica | | 2024 | Jeffrey Maggioncalda | Kenneth Hahn, Alan Cardenas, Shravan Goli, and Marcelo Modica | | 2023 | Jeffrey Maggioncalda | Kenneth Hahn, Leah Belsky, Shravan Goli, and Alan Cardenas | | 2022 | Jeffrey Maggioncalda | Kenneth Hahn, Leah Belsky, Shravan Goli, and Richard Jacquet | | 2021 | Jeffrey Maggioncalda | Kenneth Hahn and Leah Belsky |
|
|
|
|
|
| Peer Group Issuers, Footnote |
|
|
The Total Stockholder Return (“TSR”) Peer Group consists of the S&P North American Technology Software Index, an independently prepared index. The amount for 2021 in this column has been corrected from the disclosure contained in our 2023 definitive proxy statement.
|
|
|
|
|
| PEO Total Compensation Amount |
|
|
|
$ 660,000
|
$ 606,500
|
$ 29,124,802
|
$ 5,379,367
|
| PEO Actually Paid Compensation Amount |
|
|
|
(21,769,084)
|
21,167,366
|
19,912,204
|
9,345,438
|
| Adjustment To PEO Compensation, Footnote |
|
|
Represents the amount of “compensation actually paid” to our PEOs and our non-PEO NEOs, as computed in accordance with Item 402(v). The amounts do not reflect the actual amount of compensation earned by or paid by each person during the applicable year. Rather, in accordance with the requirements of Item 402(v), the following adjustments were made to each individual’s total compensation for 2025 to determine the compensation actually paid; for information on the calculation of “compensation actually paid” for 2024, 2023, 2022, and 2021 please see the “pay versus performance” disclosure in our 2024, 2023 and 2022 definitive proxy statements filed with the SEC: | | | | | | | | | | | | | | | | | | | | | PEO Maggioncalda: 2025
($) | PEO Hart: 2025
($) | NEO: 2025
($) | | | | | | | | | | | Summary Compensation Table - Total Compensation | 4,730,422 | | 39,387,371 | | 2,451,998 | | | | — | Grant Date Fair Value of Stock Awards and Option Awards Granted in Fiscal Year* | (4,045,422) | | (38,273,570) | | (1,808,420) | | | | + | Fair Value at Fiscal Year-End of Outstanding and Unvested Stock Awards and Option Awards Granted in Fiscal Year* | — | | 35,020,848 | | 1,027,083 | | | | + | Year-over-Year Change in Fair Value of Outstanding and Unvested Stock Awards and Option Awards Granted in Prior Fiscal Years* | — | | — | | (436,142) | | | | + | Fair Value at Vesting of Stock Awards and Option Awards Granted in Fiscal Year that Vested During Fiscal Year* | — | | — | | 216,534 | | | | + | Year-over-Year Change in Fair Value as of Vesting Date of Stock Awards and Option Awards Granted in Prior Fiscal Years for Which Applicable Vesting Conditions Were Satisfied During Fiscal Year* | 616,840 | | — | | 228,667 | | | |
| | | | | | | | | | | | | | | | | | | | | PEO Maggioncalda: 2025
($) | PEO Hart: 2025
($) | NEO: 2025
($) | | | | | | | | | | — | Fair Value as of Prior Year-End of Stock Awards and Option Awards Granted in Prior Years that Failed to Meet Applicable Vesting Conditions During Fiscal Year* | (5,766,537) | | — | | — | | | | = | Compensation Actually Paid for Fiscal Year | (4,464,697) | | 36,134,649 | | 1,679,721 | | | |
|
|
|
|
|
| Non-PEO NEO Average Total Compensation Amount |
|
|
$ 2,451,998
|
4,633,313
|
1,147,123
|
8,187,427
|
3,236,448
|
| Non-PEO NEO Average Compensation Actually Paid Amount |
|
|
$ 1,679,721
|
(1,362,579)
|
6,956,342
|
3,364,720
|
7,133,735
|
| Adjustment to Non-PEO NEO Compensation Footnote |
|
|
Represents the amount of “compensation actually paid” to our PEOs and our non-PEO NEOs, as computed in accordance with Item 402(v). The amounts do not reflect the actual amount of compensation earned by or paid by each person during the applicable year. Rather, in accordance with the requirements of Item 402(v), the following adjustments were made to each individual’s total compensation for 2025 to determine the compensation actually paid; for information on the calculation of “compensation actually paid” for 2024, 2023, 2022, and 2021 please see the “pay versus performance” disclosure in our 2024, 2023 and 2022 definitive proxy statements filed with the SEC: | | | | | | | | | | | | | | | | | | | | | PEO Maggioncalda: 2025
($) | PEO Hart: 2025
($) | NEO: 2025
($) | | | | | | | | | | | Summary Compensation Table - Total Compensation | 4,730,422 | | 39,387,371 | | 2,451,998 | | | | — | Grant Date Fair Value of Stock Awards and Option Awards Granted in Fiscal Year* | (4,045,422) | | (38,273,570) | | (1,808,420) | | | | + | Fair Value at Fiscal Year-End of Outstanding and Unvested Stock Awards and Option Awards Granted in Fiscal Year* | — | | 35,020,848 | | 1,027,083 | | | | + | Year-over-Year Change in Fair Value of Outstanding and Unvested Stock Awards and Option Awards Granted in Prior Fiscal Years* | — | | — | | (436,142) | | | | + | Fair Value at Vesting of Stock Awards and Option Awards Granted in Fiscal Year that Vested During Fiscal Year* | — | | — | | 216,534 | | | | + | Year-over-Year Change in Fair Value as of Vesting Date of Stock Awards and Option Awards Granted in Prior Fiscal Years for Which Applicable Vesting Conditions Were Satisfied During Fiscal Year* | 616,840 | | — | | 228,667 | | | |
| | | | | | | | | | | | | | | | | | | | | PEO Maggioncalda: 2025
($) | PEO Hart: 2025
($) | NEO: 2025
($) | | | | | | | | | | — | Fair Value as of Prior Year-End of Stock Awards and Option Awards Granted in Prior Years that Failed to Meet Applicable Vesting Conditions During Fiscal Year* | (5,766,537) | | — | | — | | | | = | Compensation Actually Paid for Fiscal Year | (4,464,697) | | 36,134,649 | | 1,679,721 | | | |
|
|
|
|
|
| Compensation Actually Paid vs. Total Shareholder Return |
|
|
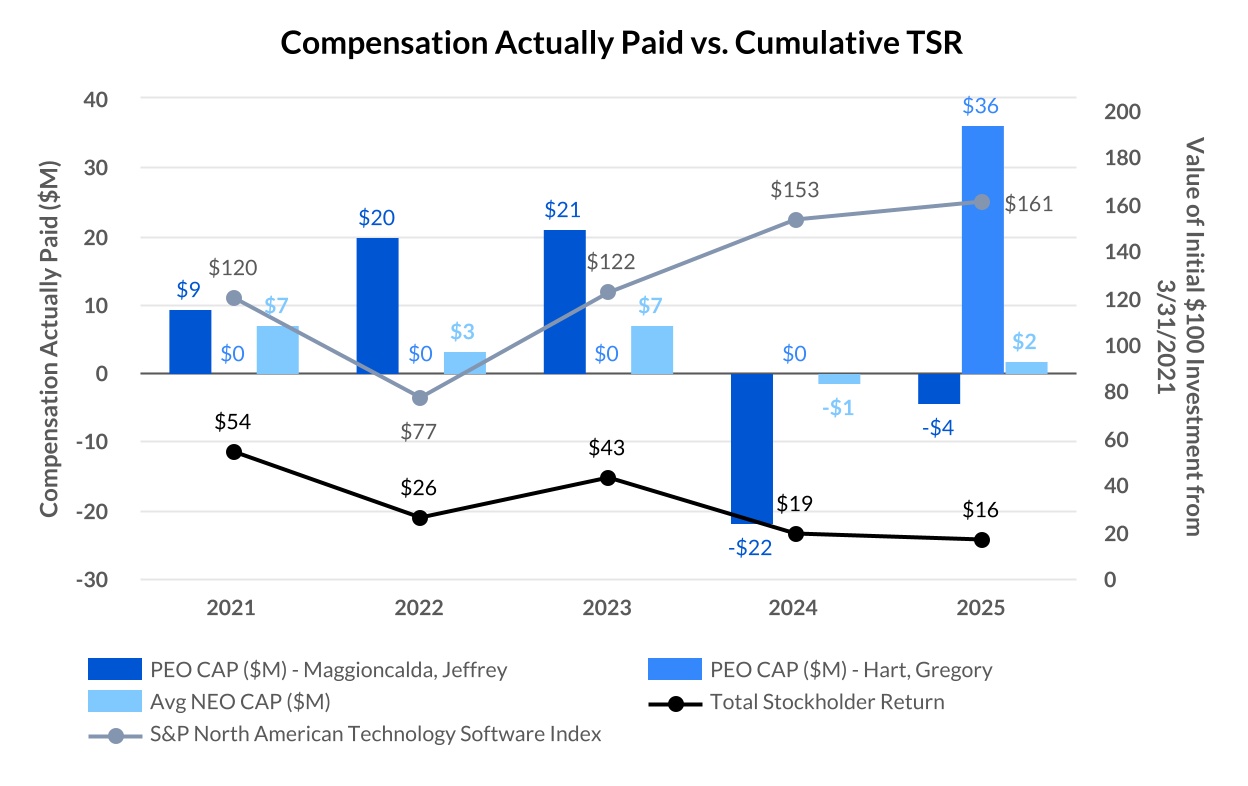
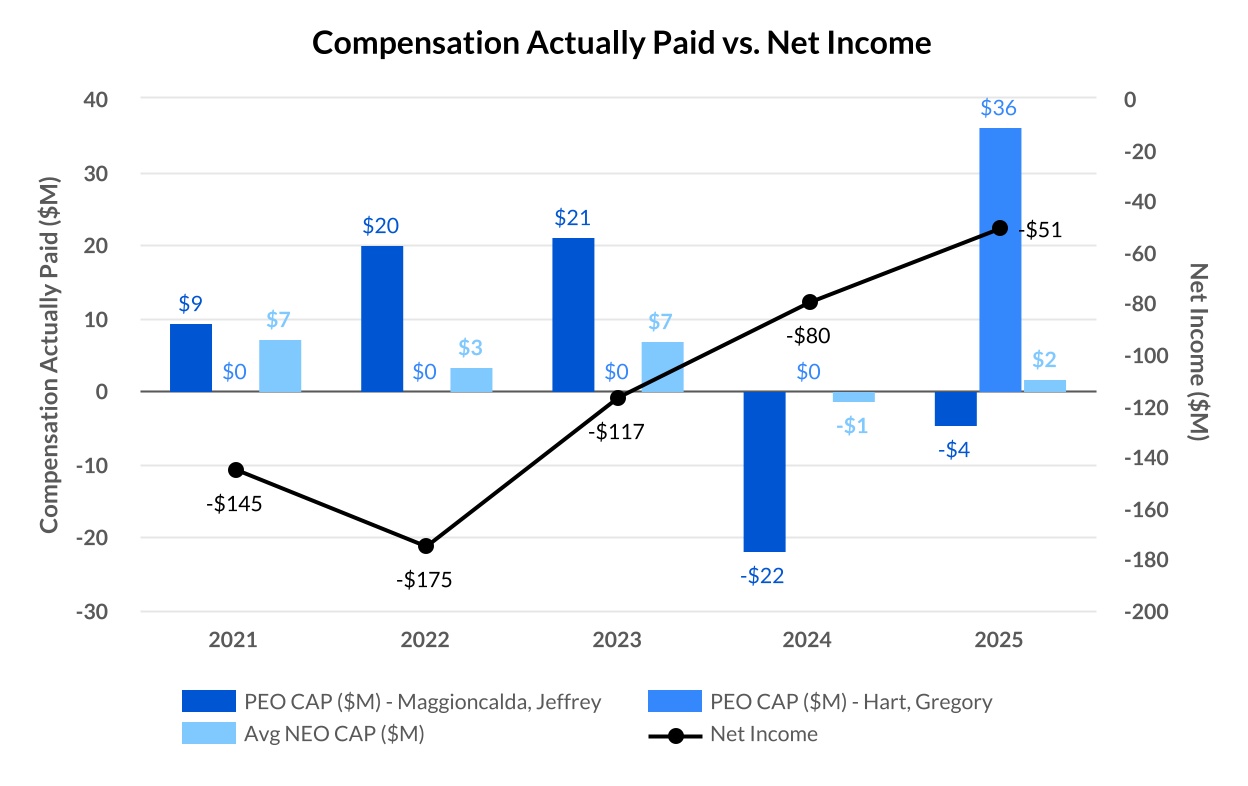
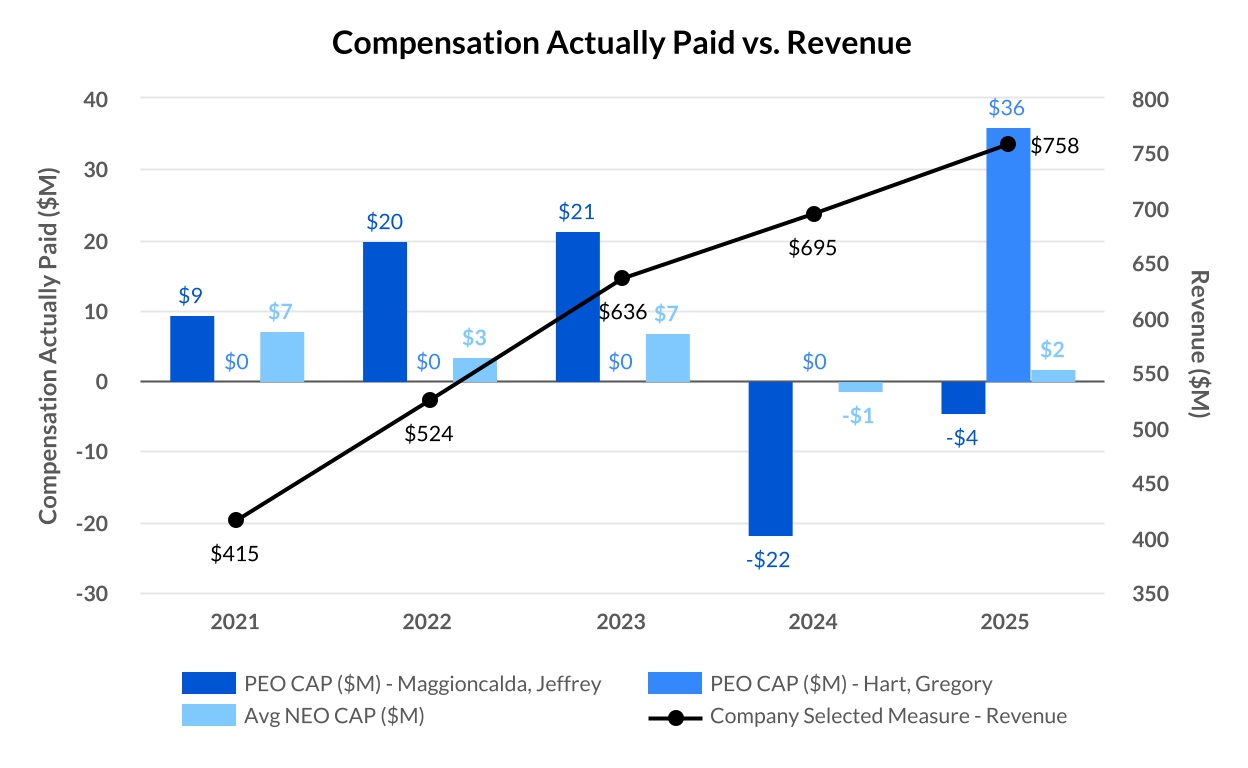
The following graphs show the relationship of compensation actually paid, as calculated under the SEC rules, to our PEO and non-PEO NEOs for 2025, 2024, 2023, 2022, and 2021 to (1) the total stockholder return for Coursera and for the S&P North American Technology Software Index, (2) our net loss, and (3) our revenue.
|
|
|
|
|
| Compensation Actually Paid vs. Net Income |
|
|
|
|
|
|
|
| Compensation Actually Paid vs. Company Selected Measure |
|
|
|
|
|
|
|
| Total Shareholder Return Vs Peer Group |
|
|
The following graphs show the relationship of compensation actually paid, as calculated under the SEC rules, to our PEO and non-PEO NEOs for 2025, 2024, 2023, 2022, and 2021 to (1) the total stockholder return for Coursera and for the S&P North American Technology Software Index, (2) our net loss, and (3) our revenue.
|
|
|
|
|
| Tabular List, Table |
|
|
As described in greater detail in our Compensation Discussion and Analysis, our executive compensation program reflects a variable pay-for-performance philosophy. The following list presents the corporate performance measures that Coursera considers to have been the most important measures used to link the compensation actually paid to our NEOs, for 2025, to Coursera’s performance (each as defined and described in the “Compensation Discussion and Analysis” section above): •Revenue (Company Selected Measure) •Consumer Revenue •Adjusted EBITDA* •Enterprise ACV* * See Appendix A for the definition of Adjusted EBITDA and the reconciliation of this non-GAAP financial measure to its comparable GAAP measure. Enterprise ACV is a non-GAAP financial measure for which there is no comparable GAAP measure. Non-GAAP financial measures should not be considered in isolation from, or as an alternative to, their comparable GAAP measures.
|
|
|
|
|
| Total Shareholder Return Amount |
|
|
$ 16
|
19
|
43
|
26
|
54
|
| Peer Group Total Shareholder Return Amount |
|
|
161
|
153
|
122
|
77
|
120
|
| Net Income (Loss), Including Portion Attributable to Noncontrolling Interest |
|
|
$ (51,000,000)
|
$ (79,530,000)
|
$ (116,554,000)
|
$ (175,357,000)
|
$ (145,215,000)
|
| Company Selected Measure Amount |
|
|
757,500,000
|
694,670,000
|
635,764,000
|
523,756,000
|
415,287,000
|
| Additional 402(v) Disclosure |
|
|
In accordance with Item 402(v), the comparison assumes $100 was invested in our common stock as of the close of the day of our IPO on March 31, 2021. Historic stock price performance is not necessarily indicative of future stock price performance.Net loss amounts reported on a GAAP basis.As noted in our Compensation Discussion and Analysis, for 2025, our HRC Committee determined that revenue continues to be viewed as a key indicator of our business performance and aligned with the creation of stockholder value.
|
|
|
|
|
| Measure:: 1 |
|
|
|
|
|
|
|
| Pay vs Performance Disclosure |
|
|
|
|
|
|
|
| Name |
|
|
Revenue (Company Selected Measure)
|
|
|
|
|
| Measure:: 2 |
|
|
|
|
|
|
|
| Pay vs Performance Disclosure |
|
|
|
|
|
|
|
| Name |
|
|
Consumer Revenue
|
|
|
|
|
| Measure:: 3 |
|
|
|
|
|
|
|
| Pay vs Performance Disclosure |
|
|
|
|
|
|
|
| Name |
|
|
Adjusted EBITDA*
|
|
|
|
|
| Measure:: 4 |
|
|
|
|
|
|
|
| Pay vs Performance Disclosure |
|
|
|
|
|
|
|
| Name |
|
|
Enterprise ACV*
|
|
|
|
|
| Jeffrey Maggioncalda [Member] |
|
|
|
|
|
|
|
| Pay vs Performance Disclosure |
|
|
|
|
|
|
|
| PEO Total Compensation Amount |
|
|
$ 4,730,422
|
|
|
|
|
| PEO Actually Paid Compensation Amount |
|
|
(4,464,697)
|
|
|
|
|
| PEO Name |
Mr. Maggioncalda
|
|
|
|
|
|
|
| Greg Hart [Member] |
|
|
|
|
|
|
|
| Pay vs Performance Disclosure |
|
|
|
|
|
|
|
| PEO Total Compensation Amount |
|
|
39,387,371
|
|
|
|
|
| PEO Actually Paid Compensation Amount |
|
|
36,134,649
|
|
|
|
|
| PEO Name |
|
Mr. Hart
|
|
|
|
|
|
| PEO | Jeffrey Maggioncalda [Member] | Aggregate Grant Date Fair Value of Equity Award Amounts Reported in Summary Compensation Table |
|
|
|
|
|
|
|
| Pay vs Performance Disclosure |
|
|
|
|
|
|
|
| Adjustment to Compensation, Amount |
|
|
(4,045,422)
|
|
|
|
|
| PEO | Jeffrey Maggioncalda [Member] | Year-end Fair Value of Equity Awards Granted in Covered Year that are Outstanding and Unvested |
|
|
|
|
|
|
|
| Pay vs Performance Disclosure |
|
|
|
|
|
|
|
| Adjustment to Compensation, Amount |
|
|
0
|
|
|
|
|
| PEO | Jeffrey Maggioncalda [Member] | Year-over-Year Change in Fair Value of Equity Awards Granted in Prior Years That are Outstanding and Unvested |
|
|
|
|
|
|
|
| Pay vs Performance Disclosure |
|
|
|
|
|
|
|
| Adjustment to Compensation, Amount |
|
|
0
|
|
|
|
|
| PEO | Jeffrey Maggioncalda [Member] | Vesting Date Fair Value of Equity Awards Granted and Vested in Covered Year |
|
|
|
|
|
|
|
| Pay vs Performance Disclosure |
|
|
|
|
|
|
|
| Adjustment to Compensation, Amount |
|
|
0
|
|
|
|
|
| PEO | Jeffrey Maggioncalda [Member] | Change in Fair Value as of Vesting Date of Prior Year Equity Awards Vested in Covered Year |
|
|
|
|
|
|
|
| Pay vs Performance Disclosure |
|
|
|
|
|
|
|
| Adjustment to Compensation, Amount |
|
|
616,840
|
|
|
|
|
| PEO | Jeffrey Maggioncalda [Member] | Prior Year End Fair Value of Equity Awards Granted in Any Prior Year that Fail to Meet Applicable Vesting Conditions During Covered Year |
|
|
|
|
|
|
|
| Pay vs Performance Disclosure |
|
|
|
|
|
|
|
| Adjustment to Compensation, Amount |
|
|
(5,766,537)
|
|
|
|
|
| PEO | Greg Hart [Member] | Aggregate Grant Date Fair Value of Equity Award Amounts Reported in Summary Compensation Table |
|
|
|
|
|
|
|
| Pay vs Performance Disclosure |
|
|
|
|
|
|
|
| Adjustment to Compensation, Amount |
|
|
(38,273,570)
|
|
|
|
|
| PEO | Greg Hart [Member] | Year-end Fair Value of Equity Awards Granted in Covered Year that are Outstanding and Unvested |
|
|
|
|
|
|
|
| Pay vs Performance Disclosure |
|
|
|
|
|
|
|
| Adjustment to Compensation, Amount |
|
|
35,020,848
|
|
|
|
|
| PEO | Greg Hart [Member] | Year-over-Year Change in Fair Value of Equity Awards Granted in Prior Years That are Outstanding and Unvested |
|
|
|
|
|
|
|
| Pay vs Performance Disclosure |
|
|
|
|
|
|
|
| Adjustment to Compensation, Amount |
|
|
0
|
|
|
|
|
| PEO | Greg Hart [Member] | Vesting Date Fair Value of Equity Awards Granted and Vested in Covered Year |
|
|
|
|
|
|
|
| Pay vs Performance Disclosure |
|
|
|
|
|
|
|
| Adjustment to Compensation, Amount |
|
|
0
|
|
|
|
|
| PEO | Greg Hart [Member] | Change in Fair Value as of Vesting Date of Prior Year Equity Awards Vested in Covered Year |
|
|
|
|
|
|
|
| Pay vs Performance Disclosure |
|
|
|
|
|
|
|
| Adjustment to Compensation, Amount |
|
|
0
|
|
|
|
|
| PEO | Greg Hart [Member] | Prior Year End Fair Value of Equity Awards Granted in Any Prior Year that Fail to Meet Applicable Vesting Conditions During Covered Year |
|
|
|
|
|
|
|
| Pay vs Performance Disclosure |
|
|
|
|
|
|
|
| Adjustment to Compensation, Amount |
|
|
0
|
|
|
|
|
| Non-PEO NEO | Aggregate Grant Date Fair Value of Equity Award Amounts Reported in Summary Compensation Table |
|
|
|
|
|
|
|
| Pay vs Performance Disclosure |
|
|
|
|
|
|
|
| Adjustment to Compensation, Amount |
|
|
(1,808,420)
|
|
|
|
|
| Non-PEO NEO | Year-end Fair Value of Equity Awards Granted in Covered Year that are Outstanding and Unvested |
|
|
|
|
|
|
|
| Pay vs Performance Disclosure |
|
|
|
|
|
|
|
| Adjustment to Compensation, Amount |
|
|
1,027,083
|
|
|
|
|
| Non-PEO NEO | Year-over-Year Change in Fair Value of Equity Awards Granted in Prior Years That are Outstanding and Unvested |
|
|
|
|
|
|
|
| Pay vs Performance Disclosure |
|
|
|
|
|
|
|
| Adjustment to Compensation, Amount |
|
|
(436,142)
|
|
|
|
|
| Non-PEO NEO | Vesting Date Fair Value of Equity Awards Granted and Vested in Covered Year |
|
|
|
|
|
|
|
| Pay vs Performance Disclosure |
|
|
|
|
|
|
|
| Adjustment to Compensation, Amount |
|
|
216,534
|
|
|
|
|
| Non-PEO NEO | Change in Fair Value as of Vesting Date of Prior Year Equity Awards Vested in Covered Year |
|
|
|
|
|
|
|
| Pay vs Performance Disclosure |
|
|
|
|
|
|
|
| Adjustment to Compensation, Amount |
|
|
228,667
|
|
|
|
|
| Non-PEO NEO | Prior Year End Fair Value of Equity Awards Granted in Any Prior Year that Fail to Meet Applicable Vesting Conditions During Covered Year |
|
|
|
|
|
|
|
| Pay vs Performance Disclosure |
|
|
|
|
|
|
|
| Adjustment to Compensation, Amount |
|
|
$ 0
|
|
|
|
|