As filed with the Securities and Exchange Commission on May 11, 2026.
Registration No. 333-
UNITED STATES
SECURITIES AND EXCHANGE COMMISSION
Washington, D.C. 20549
FORM S-1
REGISTRATION STATEMENT
Under
The Securities Act of 1933
NEPTUNE INSURANCE HOLDINGS INC.
(Exact name of registrant as specified in its charter)
Delaware | 6411 | 33-4189588 | ||
(State or other jurisdiction of incorporation or organization) | (Primary standard industrial code number) | (I.R.S. employer identification no.) |
400 6th Street S, Suite 2
St. Petersburg, Florida 33701
(727) 202-4815
(Address, including zip code, and telephone number, including area code, of registrant’s principal executive offices)
Trevor Burgess
Chief Executive Officer
Neptune Insurance Holdings Inc.
400 6th Street S, Suite 2
St. Petersburg, Florida 33701
(727) 202-4815
(Name, address, including zip code, and telephone number, including area code, of agent for service)
Copies to:
Michael J. Sullivan Mark Mushkin Albert Vanderlaan Orrick, Herrington & Sutcliffe LLP The Orrick Building 405 Howard Street San Francisco, CA 94105 (415) 773-5700 | Joseph A. Hall Pedro J. Bermeo Steven J. Glendon Davis Polk & Wardwell LLP 450 Lexington Avenue New York, NY 10017 United States (212) 450-4000 |
Approximate date of commencement of proposed sale to the public: As soon as practicable after the effective date of this registration statement.
If any of the securities being registered on this Form are to be offered on a delayed or continuous basis pursuant to Rule 415 under the Securities
Act of 1933, check the following box. ☐
If this Form is filed to register additional securities for an offering pursuant to Rule 462(b) under the Securities Act, check the following box and list the
Securities Act registration statement number of the earlier effective registration statement for the same offering. ☐
If this Form is a post-effective amendment filed pursuant to Rule 462(c) under the Securities Act, check the following box and list the Securities Act
registration statement number of the earlier effective registration statement for the same offering. ☐
If this Form is a post-effective amendment filed pursuant to Rule 462(d) under the Securities Act, check the following box and list the Securities Act
registration statement number of the earlier effective registration statement for the same offering. ☐
Indicate by check mark whether the registrant is a large accelerated filer, an accelerated filer, a non-accelerated filer, a smaller reporting company, or an
emerging growth company. See the definitions of “large accelerated filer,” “accelerated filer,” “smaller reporting company,” and “emerging growth company” in
Rule 12b-2 of the Exchange Act.
Large accelerated filer | ☐ | Accelerated filer | ☐ |
Non-accelerated filer | ☒ | Smaller reporting company | ☐ |
Emerging growth company | ☒ |
If an emerging growth company, indicate by check mark if the registrant has elected not to use the extended transition period for complying with any new
or revised financial accounting standards provided pursuant to Section 7(a)(2)(B) of the Securities Act ☐
The registrant hereby amends this registration statement on such date or dates as may be necessary to delay its effective date until the registrant shall file a
further amendment which specifically states that this registration statement shall thereafter become effective in accordance with Section 8(a) of the
Securities Act of 1933 or until the registration statement shall become effective on such date as the Commission, acting pursuant to said Section 8(a), may
determine.
The information in this preliminary prospectus is not complete and may be changed. The selling stockholders may not sell these securities until our
registration statement filed with the U.S. Securities and Exchange Commission is declared effective. This preliminary prospectus is not an offer to sell
these securities and it is not soliciting offers to buy these securities in any state or jurisdiction where the offer or sale is not permitted.
PROSPECTUS (Subject to Completion)
Issued , 2026
8,355,615 Shares

Neptune Insurance Holdings Inc.
CLASS A COMMON STOCK
The selling stockholders identified in this prospectus are offering 8,355,615 shares of our Class A common stock. We will not be selling any shares in this
offering and will not receive any of the proceeds from the sale of our Class A common stock being sold by the selling stockholders.
We intend to purchase from the underwriters 835,561 shares of our Class A common stock at a price per share equal to the price per share to be paid by
the underwriters to the selling stockholders. The underwriters will not receive any compensation for the shares of our Class A common stock being repurchased
by us. The completion of the share repurchase is contingent on the satisfaction of customary closing conditions and conditioned upon the completion of this
offering.
Our Class A common stock is listed on the NYSE under the symbol “NP.” On May 8, 2026, the last reported sale price of our Class A common stock was
$29.92 per share. The public offering price will be determined between us, the selling stockholders, and the underwriters at the time of pricing and may be at a
discount to the current market price. Accordingly, the recent market price used throughout this prospectus may not be indicative of the public offering price.
Our Chief Executive Officer and Chairman of our board of directors, Trevor Burgess, beneficially owns approximately 84.0% of the voting power of our
outstanding voting securities (and approximately 84.1% of the voting power of our outstanding voting securities after giving effect to this offering and the
share repurchase) and we are, and as long as Mr. Burgess beneficially owns more than 50% of the voting power of our company, we will be, a “controlled
company” within the meaning of the listing rules of the NYSE. As a result, we qualify for, and rely on, exemptions from certain corporate governance
requirements, and you will not have the same protections as those afforded to stockholders of companies that are subject to such governance requirements. See
“Prospectus Summary — Implications of Being a Controlled Company.” We are an “emerging growth company” as defined under the federal securities laws
and, as such, are eligible for reduced public company reporting requirements. See “Prospectus Summary — Implications of Being an Emerging Growth
Company.”
Investing in our Class A common stock involves risks that are described in the “Risk Factors” section beginning on page 35 of this prospectus.
PRICE $ A SHARE
Price to Public(1) | Underwriting Discounts and Commissions(2) | Proceeds, before expenses, to Selling Stockholders | |||
Per Share ................................................................................................................................................... | $ | $ | $ | ||
Total .......................................................................................................................................................... | $ | $ | $ |
__________________
(1)The 835,561 shares of Class A common stock that we expect to purchase from the underwriters in the share repurchase will be purchased at a price per share equal to the
price per share to be paid by the underwriters to the selling stockholders.
(2)See the section titled “Underwriting” for a description of the compensation payable to the underwriters. The underwriters will not receive any discount or commission on the
835,561 shares of our Class A common stock that we expect to repurchase from the underwriters in the share repurchase.
The selling stockholders have granted the underwriters the right to purchase up to an additional 1,253,342 shares of Class A common stock
from the selling stockholders.
Neither the Securities and Exchange Commission nor any other regulatory body has approved or disapproved of these securities or passed
upon the accuracy or adequacy of this prospectus. Any representation to the contrary is a criminal offense.
The underwriters expect to deliver the shares of Class A common stock against payment in New York, New York on or about ,
2026.
Joint Book-Runners | ||||
Morgan Stanley | J.P. Morgan | Goldman Sachs & Co. LLC | ||
i
TABLE OF CONTENTS
Page | |
Market and Industry Data ................................................................................................................................. | |
Select Defined Terms ........................................................................................................................................ | |
Prospectus Summary ......................................................................................................................................... | |
Risk Factors ...................................................................................................................................................... | |
Special Note Regarding Forward-Looking Statements .................................................................................... | |
Use of Proceeds ................................................................................................................................................. | |
Dividend Policy ................................................................................................................................................ | |
Capitalization .................................................................................................................................................... | |
Certain Relationships and Related Party Transactions ..................................................................................... | |
Principal and Selling Stockholders ................................................................................................................... | |
Description of Capital Stock ............................................................................................................................. | |
Stock .............................................................................................................................................................. | |
Underwriting ..................................................................................................................................................... | |
Legal Matters .................................................................................................................................................... | |
Experts .............................................................................................................................................................. | |
Where You Can Find Additional Information .................................................................................................. | |
Unless the context requires otherwise, the words “we,” “us,” “our,” the “Company,” and “Neptune” refer to
Neptune Insurance Holdings Inc. and its subsidiaries, taken as a whole, “Neptune Holdings” refers only to Neptune
Insurance Holdings Inc., and “Neptune Flood” refers only to Neptune Flood Incorporated. For purposes of this
prospectus, unless the context otherwise requires, the term “stockholders” shall refer to the holders of our Class A
common stock and Class B common stock.
We have not, and the selling stockholders and the underwriters have not, authorized anyone to provide you with
additional information or information that is different from or to make any representations other than those
contained in this prospectus or in any free-writing prospectus prepared by or on behalf of us to which we may have
referred you in connection with this offering. We, the selling stockholders and the underwriters, take no
responsibility for, and can provide no assurances as to the reliability of, any other information that others may give
you. This prospectus is an offer to sell only the shares offered hereby, but only under circumstances and in
jurisdictions where offers and sales are permitted. The information contained in this prospectus is accurate only as of
the date of this prospectus, regardless of the time of delivery of this prospectus or of any sale of our common stock.
Our business, financial condition, results of operations, and future growth prospects may have changed since that
date.
Through and including , 2026 (the 25th day after the date of this prospectus), U.S. federal
securities laws may require all dealers that effect transactions in our common stock, whether or not
participating in this offering, to deliver a prospectus. This is in addition to the dealers’ obligation to deliver a
prospectus when acting as underwriters and with respect to any unsold allotments or subscriptions.
For investors outside the United States, neither we, the selling stockholders nor any of the underwriters have
done anything that would permit this offering or possession or distribution of this prospectus in any jurisdiction
where action for that purpose is required, other than in the United States. Persons who come into possession of this
prospectus in jurisdictions outside the United States are required to inform themselves about and to observe any
restrictions as to this offering and the distribution of this prospectus and any such free-writing prospectus outside the
United States.
ii
TRADEMARKS, TRADE NAMES AND SERVICE MARKS
“Neptune,” “Neptune Flood,” “Triton,” the Neptune stylized design logo, and our other registered or common
law trademarks, trade names, and service marks appearing in this prospectus are our property. Solely for
convenience, our trademarks, trade names, and service marks referred to in this prospectus appear without the ®, ™,
and ℠ symbols, but those references are not intended to indicate, in any way, that we will not assert, to the fullest
extent under applicable law, our rights to these trademarks and trade names. This prospectus contains additional
trademarks, trade names, and service marks of other companies that are the property of their respective owners.
NON-GAAP FINANCIAL MEASURES AND KEY PERFORMANCE INDICATORS
This prospectus and the documents incorporated by reference herein contain certain financial measures,
including Adjusted EBITDA, Adjusted EBITDA margin, Adjusted net income, Adjusted EBITDA (basic and
diluted) per share, and Adjusted earnings (basic and diluted) per share, that are not required by, or prepared in
accordance with, U.S. generally accepted accounting principles. We refer to these measures as “non-GAAP”
financial measures. See “Management’s Discussion and Analysis of Financial Condition and Results of
Operations — Non-GAAP Financial Measures” in our Annual Report on Form 10-K for the year ended December
31, 2025 (the “Annual Report”) and our Quarterly Report on Form 10-Q for the quarter ended March 31, 2026 (the
“Q1 Quarterly Report”), respectively, each incorporated by reference herein, for our definitions of these non-GAAP
measures, information about how and why we use these non-GAAP measures and a reconciliation of each of these
non-GAAP measures to its most directly comparable financial measure calculated in accordance with GAAP.
This prospectus and the documents incorporated by reference herein also include certain key performance
indicators, including revenue per employee, Adjusted EBITDA per employee, premium in force, policies in force,
policy retention rate, premium retention rate, revenue retention rate, organic revenue, organic revenue growth, and
written premium, that Neptune’s management regularly reviews in managing its business to evaluate its business and
operations, guide decision-making, measure progress and understand growth and retention, and ultimately help drive
profitability. Organic revenue and organic revenue growth are common non-GAAP financial measures reported by
others in the insurance industry. We use “organic revenue” and “organic revenue growth” in this prospectus to
facilitate investors’ understanding of our operating performance and comparison with our peers. However, as of the
date of this prospectus and for the relevant periods presented or incorporated by reference herein, we have not
completed any relevant acquisitions or divestitures, therefore our organic revenue and organic revenue growth
reflect our total revenue and total revenue growth, respectively, as determined in accordance with GAAP. For
definitions of these key performance indicators, see “Management’s Discussion and Analysis of Financial Condition
and Results of Operations — Key Performance Indicators” in our Annual Report and our Q1 Quarterly Report,
respectively, each incorporated by reference herein.
1
MARKET AND INDUSTRY DATA
This prospectus and the documents incorporated by reference herein contain estimates and information
concerning our industry, our business, and the market for our products and solutions, including our general
expectations of our market position, market growth forecasts, our market opportunity, and size of the markets in
which we participate, that are based on industry publications, surveys, and reports that have been prepared by
independent third parties. This information involves assumptions and limitations, and you are cautioned not to give
undue weight to these estimates. Although we have not independently verified the accuracy or completeness of the
data contained in these industry publications, surveys, and reports, we believe the publications, surveys, and reports
are generally reliable, although such information is inherently subject to uncertainties and imprecision. The industry
in which we operate is subject to a high degree of uncertainty and risk due to a variety of factors, including those
described in the sections titled “Risk Factors” beginning on page 35 of this prospectus and in our Annual Report and
our Q1 Quarterly Report, each incorporated by reference herein. These and other factors could cause results to differ
materially from those expressed in these publications and reports.
The source of certain statistical data, estimates, and forecasts contained in this prospectus are the following
industry publications or reports that have been prepared by independent third parties:
•Federal Emergency Management Agency, “FEMA Exercises Borrowing Authority for National Flood
Insurance Program,” February 10, 2025 (accessed on May 25, 2025);
•National Association of Insurance Commissioners, Tableau dashboard (accessed on May 25, 2025);
•Congressional Budget Office, “Federal Spending for Flood Adaptations,” September 30, 2024 (accessed on
May 25, 2025);
•First Street ®, “First Street Foundation releases new data disclosing the flood risk of every home in the
contiguous U.S.,” June 29, 2020 (accessed on May 25, 2025);
•Federal Emergency Management Agency, OpenFEMA Dataset: FEMA NFIP Redacted Policies — v2
(accessed on May 25, 2025);
•U.S. Government Accountability Office, “Flood Insurance: FEMA’s New Rate-Setting Methodology
Improves Actuarial Soundness but Highlights Need for Broader Program Reform,” July 31, 2023 (accessed
on May 25, 2025);
•Federal Emergency Management Agency, “National Flood Insurance Program Continues to Pay Interest on
its Treasury Debt,” October 24, 2023 (accessed on May 25, 2025);
•Federal Emergency Management Agency, Risk Rating 2.0 (accessed on May 25, 2025);
•California Department of Insurance, “Earthquake Premium and Policy Count Data Call, Summary of 2023
Residential Totals” (accessed on May 25, 2025);
•United States Census Bureau, QuickFacts: California (accessed on May 25, 2025); and
•United States Government Accountability Office, “Better Planning and Analysis Needed to Address
Current and Future Flood Hazards,” October 2021 (accessed on May 25, 2025).
2
SELECT DEFINED TERMS
“2019 Stock Plan” means the stock plan adopted by Neptune Flood on April 23, 2019, and approved by the
stockholders of Neptune Flood on April 24, 2019.
“2025 Amended and Restated Credit Agreement” means the Amended and Restated Credit Agreement, dated
as of April 10, 2025, by and among Neptune Holdings, Neptune Flood, the other loan parties party thereto from time
to time, the lenders party thereto from time to time, and JPMorgan Chase Bank, N.A., as administrative agent.
“2025 Equity Incentive Plan” means our 2025 Equity Incentive Plan, which was adopted by our board of
directors on September 19, 2025, and approved by our stockholders on September 21, 2025, and which became
effective on September 29, 2025.
“AGI” means artificial general intelligence, which refers to the hypothetical ability of an intelligent computer to
understand or learn any intellectual task that a human being can. AGI is a theoretical stage in AI development that
has likely not yet been achieved.
“AI” means artificial intelligence. As discussed herein, the term “AI” refers to the broad discipline concerned
with developing systems capable of performing tasks that traditionally require human intelligence (including, but not
limited to, natural language understanding, pattern recognition, complex problem-solving, and decision-making)
while “machine learning” refers to a subset of AI that concentrates on enabling computers to learn from data and
enhance their performance over time without explicit programming for each specific task. In other words, AI
represents the overarching field dedicated to the development of intelligent systems, while machine learning
constitutes one of the primary methodologies for realizing this objective. The Company’s Triton and Poseidon
platforms each utilize “machine learning” models to conduct predictive analysis on prospective underwriting results
and generate pricing and coverage determinations. As we continue to advance and refine our Triton and Poseidon
systems, we intend to continue to leverage both AI and machine learning. See also “ML.”
“amended and restated bylaws” means our second amended and restated bylaws, effective as of October 2,
2025.
“amended and restated certificate of incorporation” means our second amended and restated certificate of
incorporation, filed with the Secretary of State of the State of Delaware on October 2, 2025, and effective as of
October 2, 2025.
“Amended and Restated 2019 Stock Plan” means the 2019 Stock Plan, as amended and restated on each of
May 8, 2023, and November 10, 2023.
“Amended and Restated 2025 Stock Plan” means the Amended and Restated 2019 Stock Plan, as assumed by
Neptune Holdings and amended and restated as of April 10, 2025.
“Annual Report” means our Annual Report on Form 10-K for the fiscal year ended December 31, 2025, filed
with the SEC on February 26, 2026.
“API” means application programming interface.
“Bregal Sagemount” means Bregal Sagemount Management, L.P.
“BSIV 101” means BSIV Hold 101, LP.
“BSIV 102” means BSIV Hold 102, LP.
“CAGR” means compound annual growth rate.
“capacity provider” means an insurance carrier or reinsurance company that partners with a managing general
agent to underwrite, manage, and take insurance risk related to insurance policies.
“Charles River Data” means Charles River Data LLC.
3
“Code” refers to the Internal Revenue Code of 1986, as amended.
“Congress” means the United States Congress.
“DGCL” means the Delaware General Corporation Law.
“Effective Time” means the time of effectiveness of the filing of our amended and restated certificate of
incorporation with the Secretary of State of the State of Delaware in connection with the IPO.
“EGC” means an emerging growth company, as defined in the JOBS Act.
“Exchange Act” means the Securities Exchange Act of 1934, as amended.
“FDPA” means the Flood Disaster Protection Act of 1973.
“FEMA” means the Federal Emergency Management Agency.
“FINRA” means the Financial Industry Regulatory Authority.
“fiscal year” means the fiscal year ended December 31, and references throughout this prospectus to a given
fiscal year are to the twelve months ended on that date.
“FTV VII” means FTV VII, L.P.
“FTV Capital” means FTV Management Company, L.P. and/or its affiliates (including its investment vehicles).
“FTV-NE Aggregator” means FTV-NE Aggregator, LLC.
“GAAP” means U.S. generally accepted accounting principles.
“Growth VII-Centre” means Growth VII-Centre, L.P.
“insurance carrier” means a company that issues, underwrites, manages, and takes economic risk related to
insurance policies.
“insurance program” means a structured arrangement with one or more insurance carriers designed to offer
specific types of insurance coverage.
“IPO” means the initial public offering of our Class A common stock, which the Company completed on
October 2, 2025.
“IRS” means the United States Internal Revenue Service.
“JOBS Act” means the Jumpstart Our Business Startups Act of 2012.
“Jumpstart” means Jumpstart Insurance Solutions.
“KPI” means a key performance indicator.
“MGA” means a managing general agent.
“ML” means machine learning, which is a subset of AI that concentrates on enabling computers to learn from
data and enhance their performance over time without explicit programming for each specific task. Machine learning
algorithms employ statistical models and computational techniques to analyze data, discern patterns, and generate
predictions or decisions. The principal objective of machine learning is to construct systems that can autonomously
improve through experience, thereby facilitating accurate predictions or decisions when presented with new data.
The Company’s Triton and Poseidon platforms each utilize “machine learning” models to conduct predictive
analysis on prospective underwriting results and generate pricing and coverage determinations. See also “AI”.
“NAIC” means the National Association of Insurance Commissioners.
4
“NFIP” means the National Flood Insurance Program.
“NYSE” means the New York Stock Exchange.
“policyholder” means the individual owner or named insured listed on an issued policy.
“Poseidon” means Neptune’s proprietary policy management platform.
“Proxy Statement” means our definitive proxy statement on Schedule 14A filed with the SEC on April 17,
2026.
“Q1 Quarterly Report” means our Quarterly Report on Form 10-Q for the quarter ended March 31, 2026, filed
with the SEC on April 29, 2026.
“reinsurance company” or “reinsurer” means a company that provides coverage to an insurance company
through a reinsurance agreement. The reinsurer agrees to cover certain losses incurred by the insurer in exchange for
reinsurance premiums, while the insurer continues to issue policies to policyholders.
“SEC” means the United States Securities and Exchange Commission.
“SFHA” means Special Flood Hazard Area, as designated by FEMA.
“U.S. Treasury” means the United States Department of the Treasury.
“Triton” means Neptune’s proprietary underwriting engine.
“Voting Threshold Date” means the first date falling after 11:59 p.m. (Eastern Time) on the date on which the
outstanding shares of our Class B common stock represent less than a majority of the combined voting power of our
then-outstanding Class A common stock and Class B common stock entitled to vote generally in the election of
directors.
“whole board of directors” means the total number of authorized directors on the board of directors of the
Company, whether or not there exist any vacancies in previously authorized directorships.
“written loss ratio” means a ratio, expressed as a percentage, of, (i) for any given period of time, (1) the losses
actually incurred (or expected to be incurred) for observed events during that period on all policies written during
that period, to (2) the aggregate amount of premiums written on policies that became effective during that period or,
(ii) for any given catastrophic event (1) the losses incurred (or expected to be incurred) in connection with that
event, to (2) the aggregate amount of premiums written on policies in force as of the event date.
“written premium” means the total premium we placed with insurance programs during a reporting period, less
“return premiums” refunded to policyholders due to cancellations, endorsement of policies, or otherwise.
5
PROSPECTUS SUMMARY
This summary highlights selected information contained in greater detail elsewhere in this prospectus. This
summary is not complete and does not contain all of the information you should consider in making your investment
decision. You should carefully read this entire prospectus and the information incorporated by reference herein,
including any free writing prospectus prepared by us or on our behalf, including the sections entitled “Risk
Factors” and “Forward-Looking Statements” included elsewhere in this prospectus and “Risk Factors,”
“Management’s Discussion and Analysis of Financial Condition and Results of Operations,” our audited
consolidated financial statements and related notes thereto in the Annual Report incorporated by reference herein,
and our unaudited interim consolidated financial statements and related notes thereto in the Q1 Quarterly Report
incorporated by reference herein, before making an investment decision. Some of the statements in this prospectus
are forward-looking statements. See “Special Note Regarding Forward-Looking Statements.”
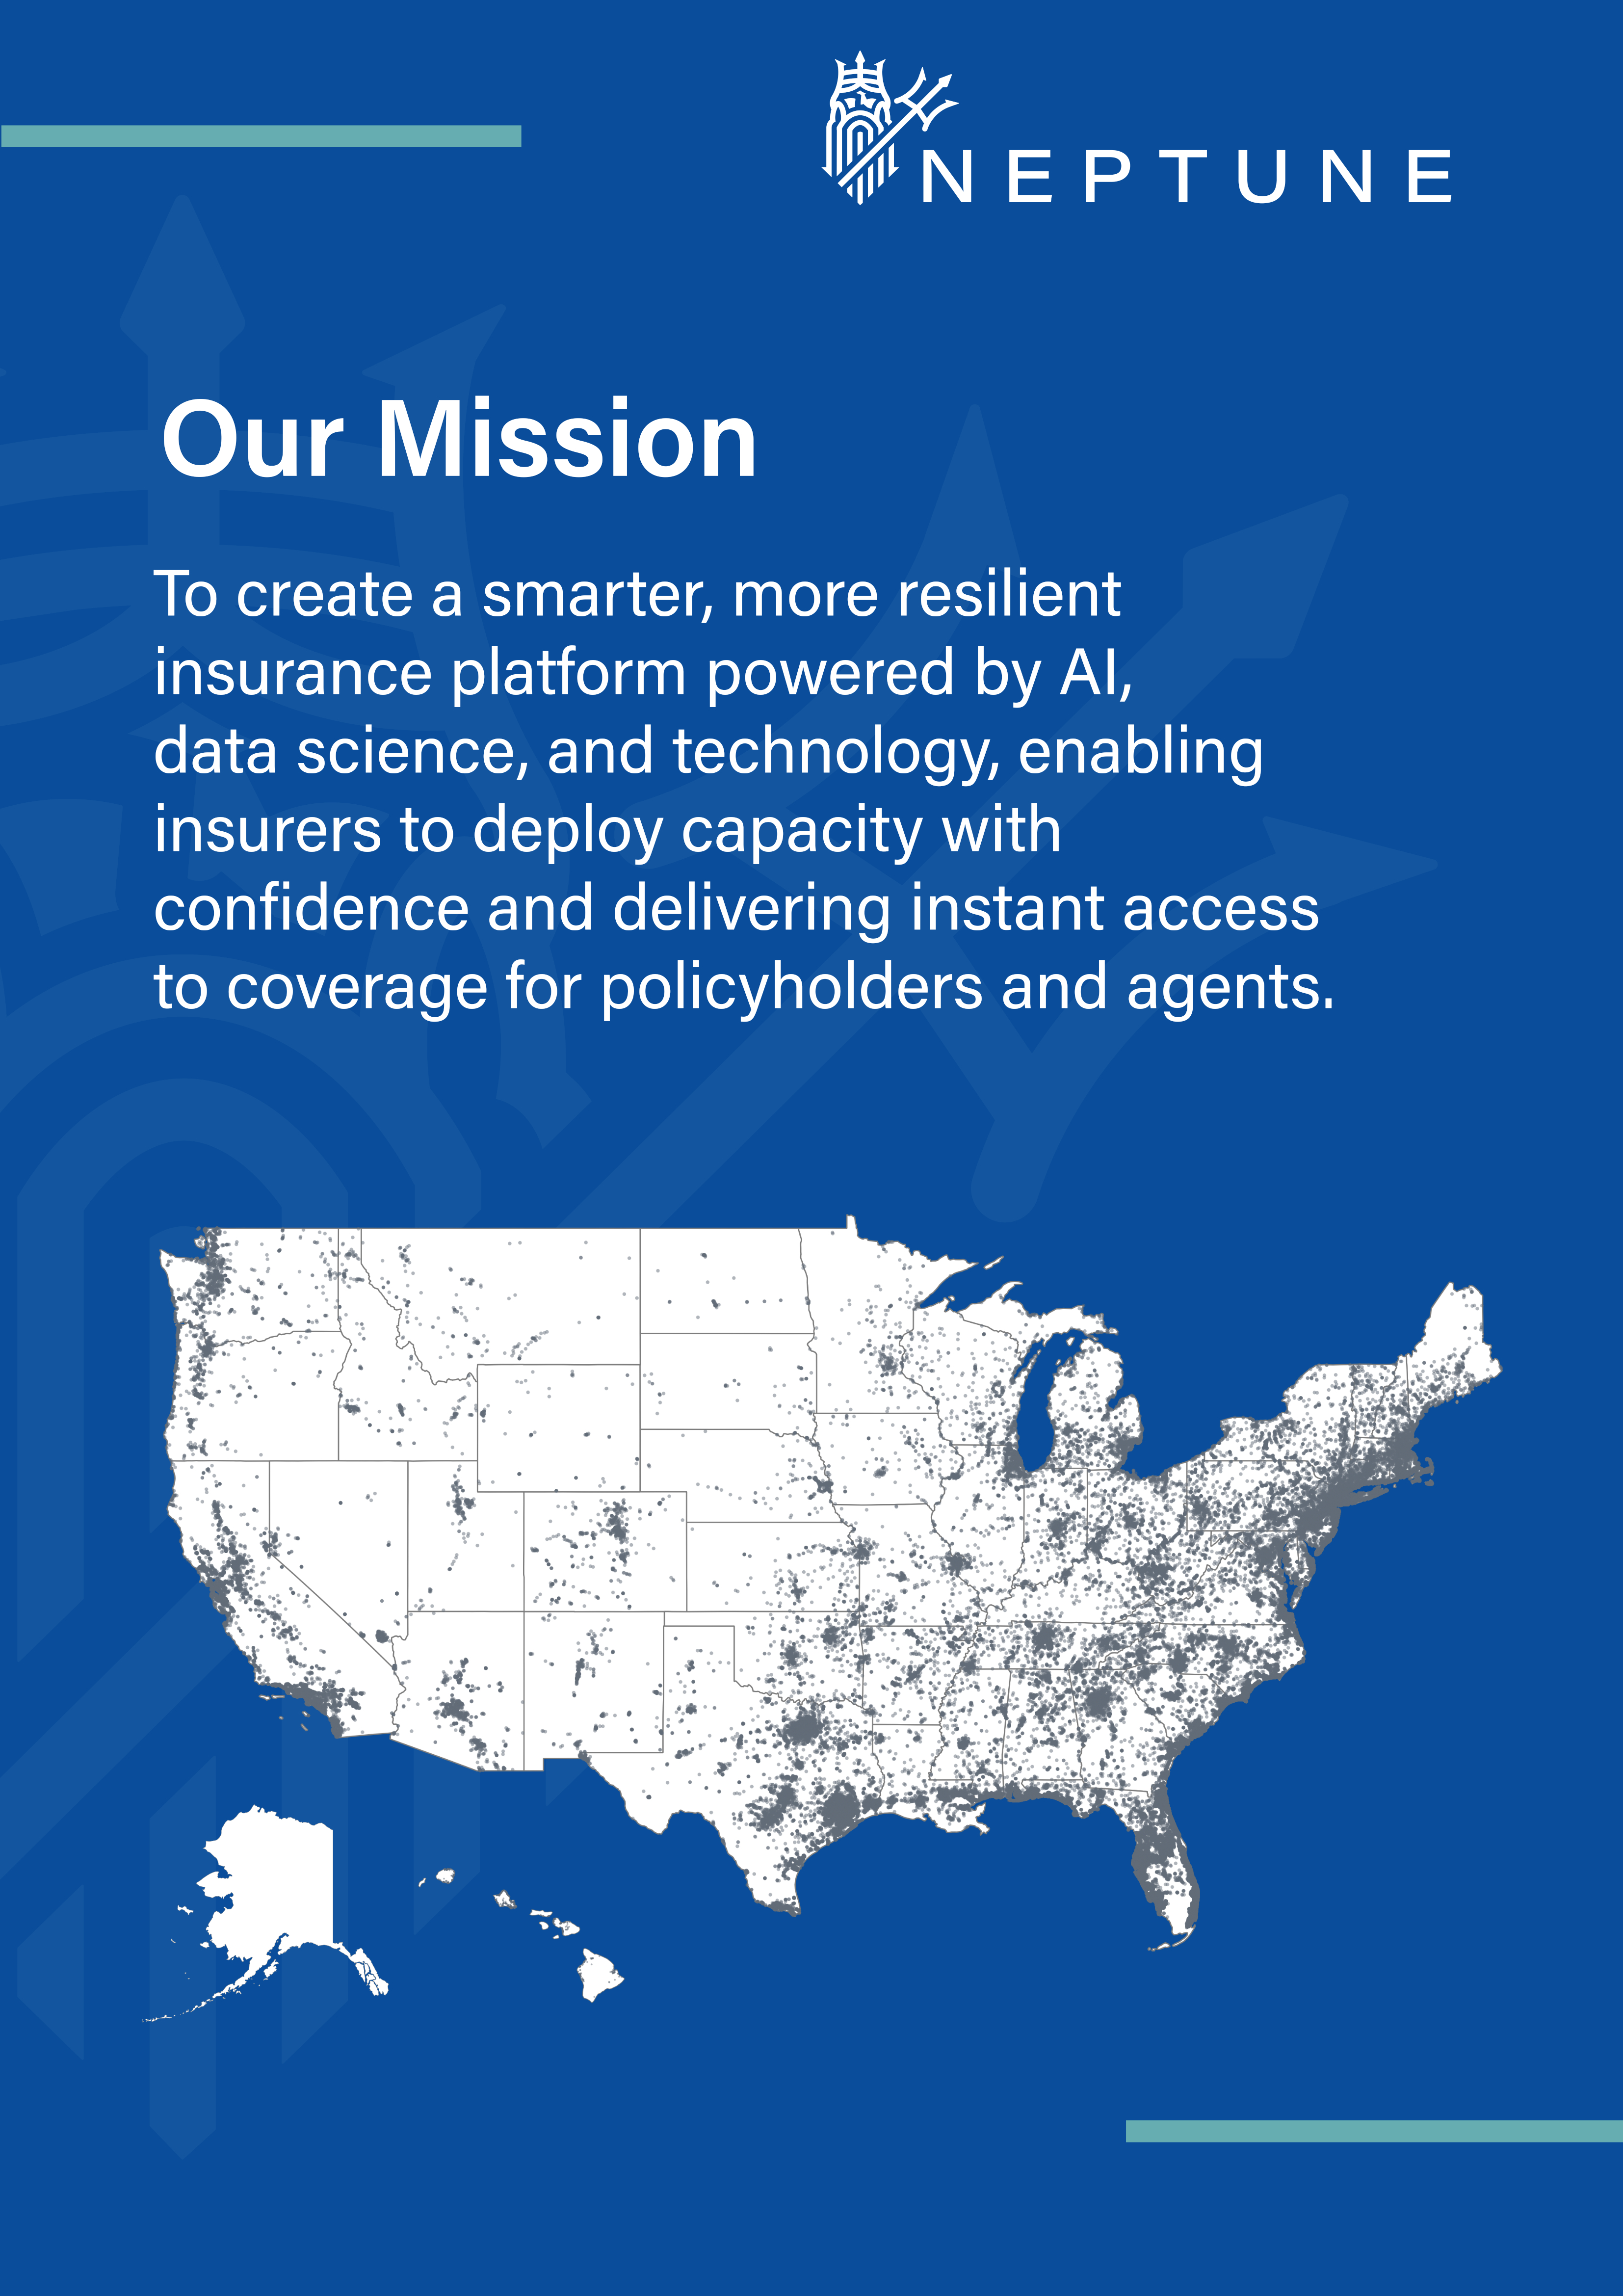
Our Mission
Our mission is to create a smarter, more resilient insurance platform powered by AI, data science, and
technology, enabling insurers to deploy capacity with confidence and delivering instant access to coverage for
policyholders and agents.
Company Overview
Neptune is a leading, high-growth, highly profitable, data-driven managing general agent that is revolutionizing
the way homeowners and businesses protect against the growing risks of flooding. We offer a range of easy-to-
purchase residential and commercial insurance products — including primary flood insurance, excess flood
insurance, and parametric earthquake insurance — distributed through a nationwide network of agencies. Neptune
does not take any balance sheet insurance risk or have claims handling responsibility relating to the policies we sell.
We underwrite and administer the issuance of insurance policies on behalf of a diverse panel of insurance and
reinsurance companies, whom we refer to as capacity providers, that manage both this risk and the associated claims
handling. From day one, we have built our business on a foundation of advanced data science and AI, leveraging
proprietary ML algorithms, which has led to superior underwriting results, outsized growth, recurring revenue, and
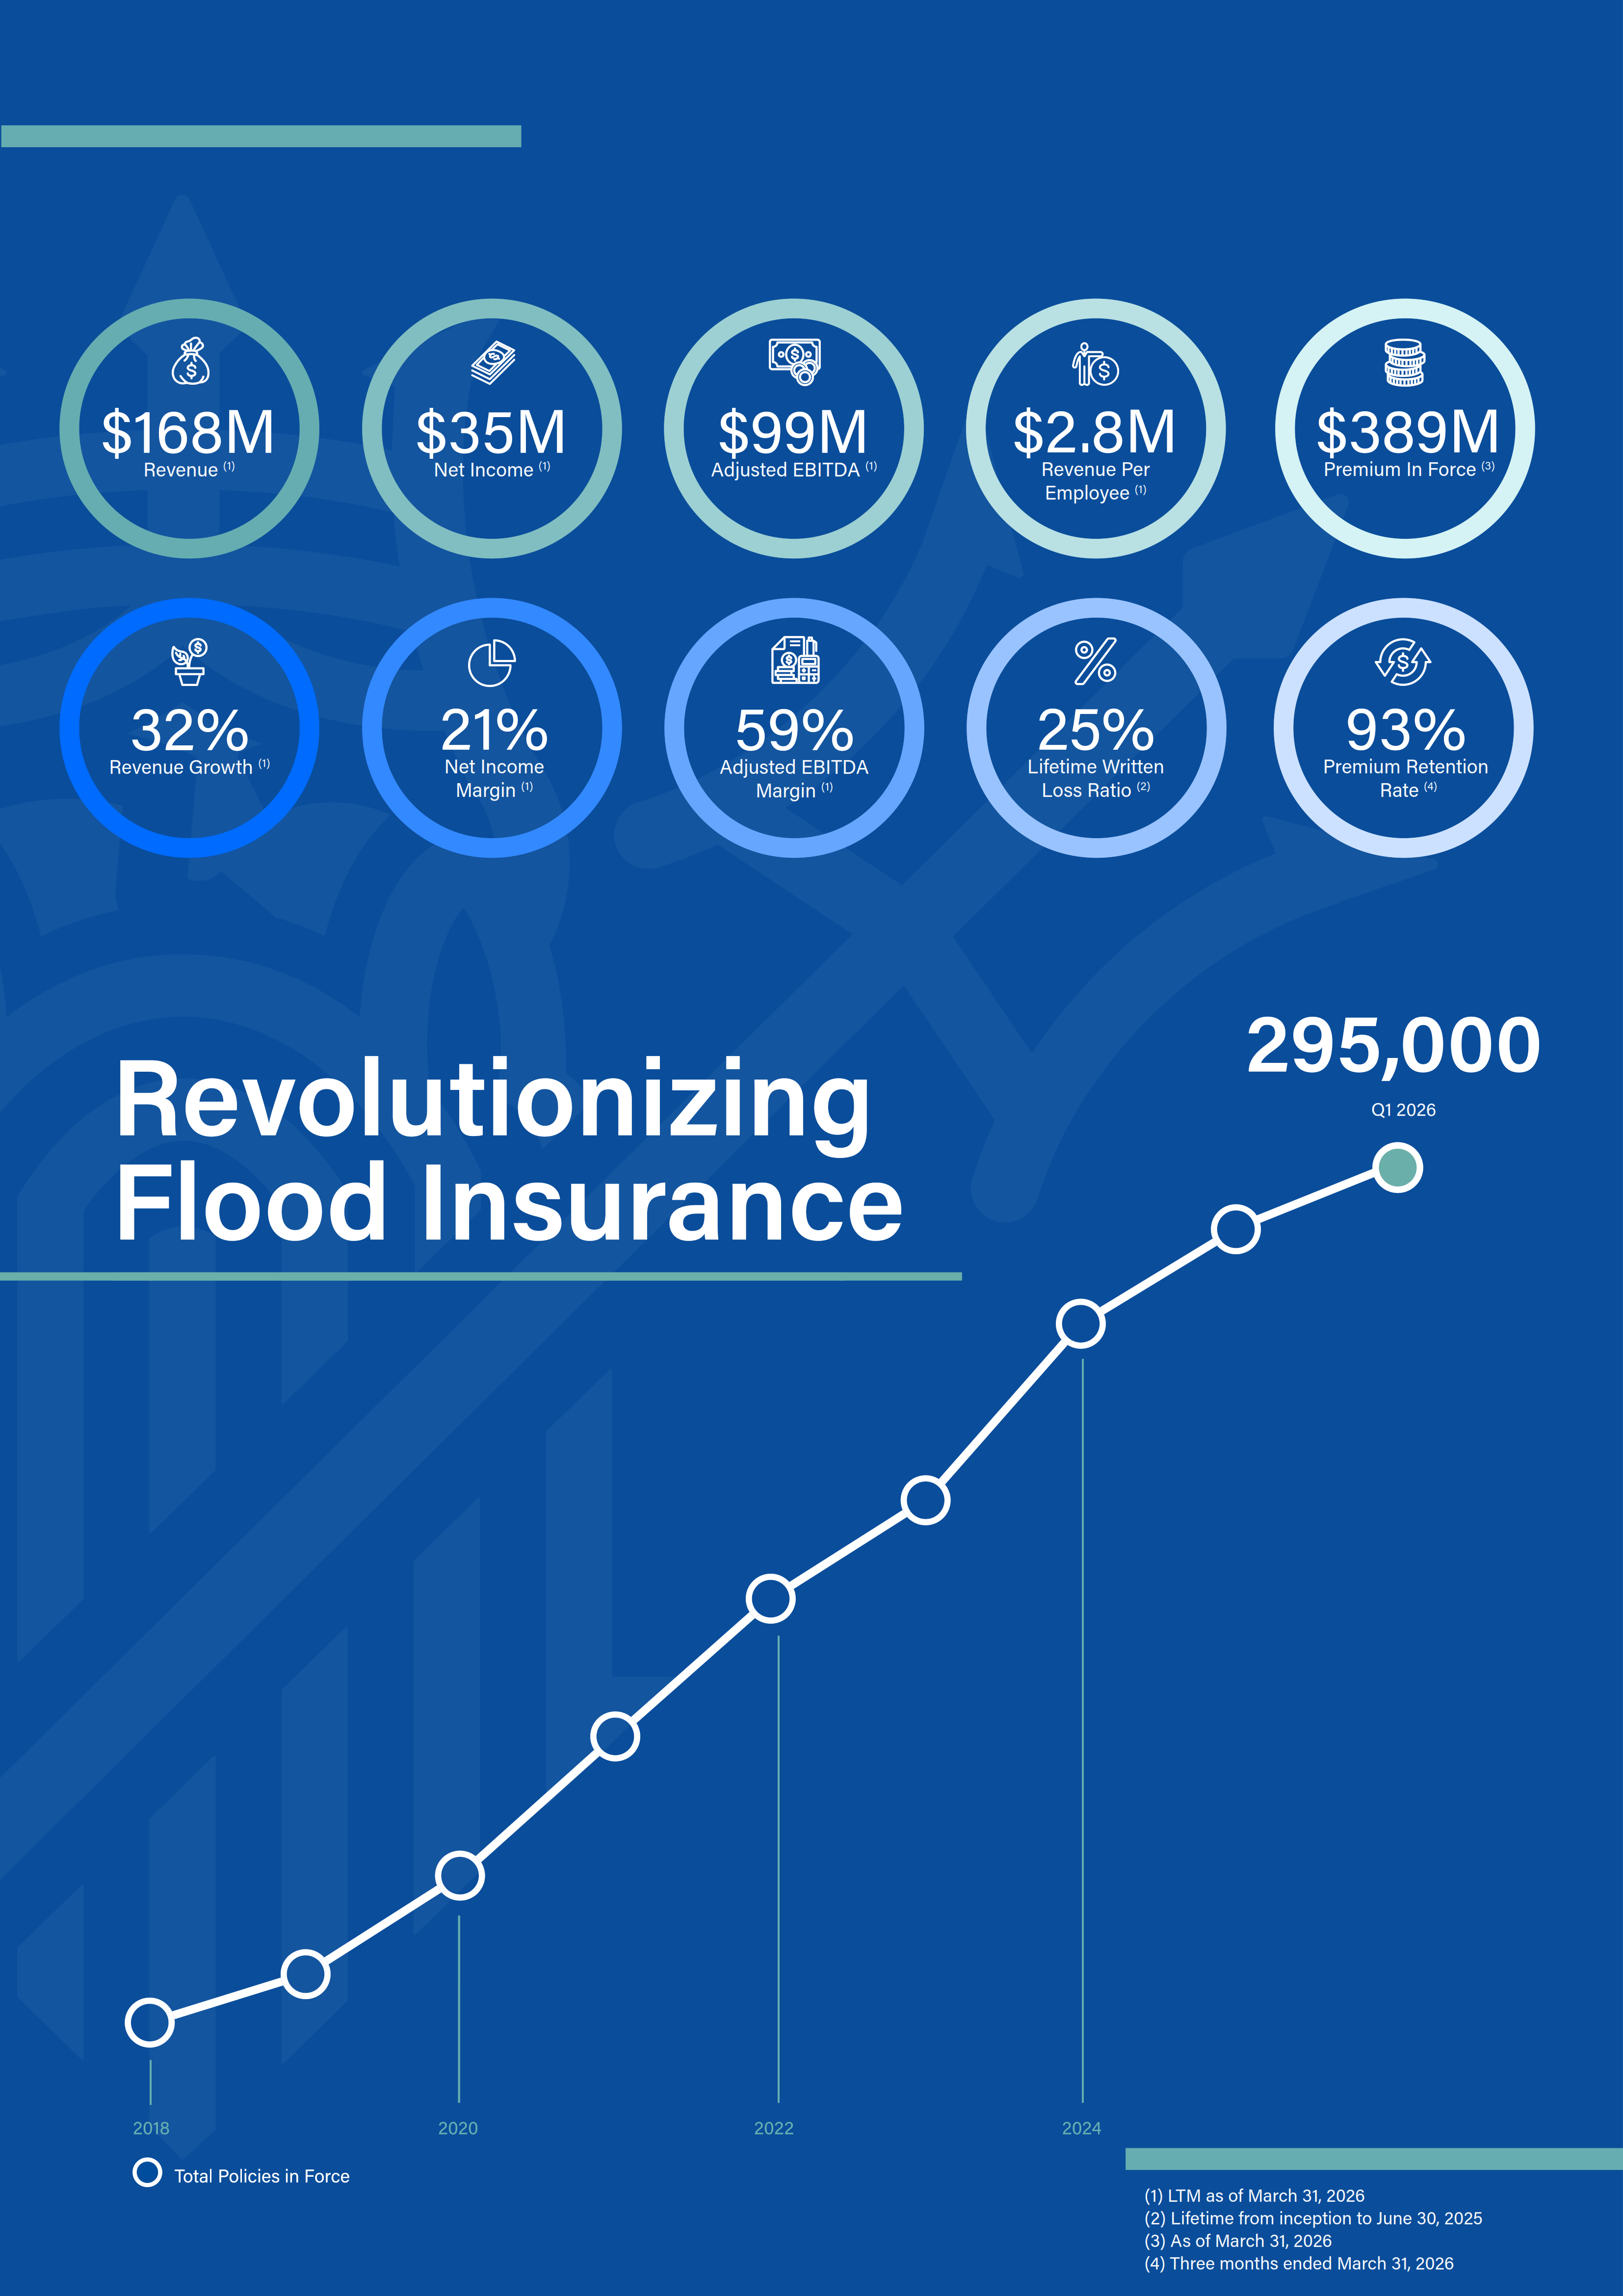
robust margins, including delivering a lifetime written loss ratio of just 24.7% to our capacity providers from our
inception through June 30, 2025. In addition, for the year ended December 31, 2025, we achieved 33.7% organic
revenue growth, 23.4% net income margin, and 59.5% Adjusted EBITDA margin, and for the three months ended
March 31, 2026, we achieved 28.8% organic revenue growth, 19.4% net income margin and 57.1% Adjusted
EBITDA margin.
Neptune was founded to solve the inefficiencies and poor product-market fit we saw in the traditional flood
insurance market, which we believe represents a significant and underpenetrated opportunity. According to the
American Housing Survey and the Energy Information Administration, there are over 100 million residential and
commercial buildings in the U.S., many of which face flood risk, yet only a small fraction are covered by flood
insurance. Today, the largest provider of flood insurance in the United States — and the holder of the majority
market share — is the National Flood Insurance Program, a U.S. government-run entity and our main competitor.
We believe purchasing insurance from the NFIP is relatively burdensome and time-consuming for policyholders and
agents, and that its limited product offerings often fail to meet policyholder needs. In addition, the NFIP has
historically received substantial government subsidies that have enabled it to limit premiums to rates that have been
challenging for private flood insurance providers to compete with, a dynamic that is shifting with the NFIP’s 2021
introduction of its “Risk Rating 2.0” pricing model, discussed in more detail below. Private market participation has
also historically been constrained by regulatory barriers, a lack of innovation expertise, and limited access to
sufficient claims and performance data to optimize pricing and underwriting decisions. We believe that Neptune’s
position as the first scaled private flood platform, including the years of claims and performance data we have
generated through our operations, provides a key early-mover advantage in addressing all of these challenges and
disrupting the industry.
With Neptune’s use of AI, our technology platform, and our data-driven approach, we believe we have
delivered the promise of disrupting the insurance industry. Not only have our innovation efforts delivered vastly
6
improved policyholder and agent experiences through the ease-of-use of our proprietary underwriting (Triton) and
policy management (Poseidon) platforms, we have also demonstrated superior risk selection and underwriting
through our top-tier financial performance and sustained growth. Utilizing AI and ML algorithms with no human
underwriters, Neptune has redefined how flood insurance can be underwritten, creating value for policyholders and
agents while producing consistent, long-term positive returns for our insurance and reinsurance partners. Further, as
the NFIP moves away from its historical subsidized pricing model, we believe our Triton platform, backed by years
of proprietary data derived from our business operations, positions us to optimize pricing determinations and
compete for existing NFIP policyholders in a way that would be challenging for a new entrant to replicate until it is
able to generate, or otherwise gain access to, comparable claims and performance data.
Technology and data science are the foundation of Neptune’s business model, driving our three core pillars:
•Our Underwriting Engine: Our entirely digital underwriting engine, Triton, uses advanced technology,
including proprietary AI and ML models, without any human underwriters, to assess risk with speed and
precision. Powered by predictive analytics and loss estimation, Triton has enabled Neptune’s policies to
consistently outperform the NFIP in written loss ratio despite 21 landfall hurricanes — including 4 of the
10 largest flood events in U.S. history — taking place since Neptune’s founding.
•Our Risk Relationships: Our risk relationships are built on performance and trust, and we currently have
42 capacity providers, including 34 reinsurance providers, backing 8 distinct insurance programs to help
minimize concentration risk while delivering consistent returns. In turn, the accuracy of our risk assessment
and our precision pricing have delivered hundreds of millions of dollars of underwriting profit for our
capacity providers since inception, leading to high rates of capacity renewals and increases in committed
capacity.
•Our Distribution: Our distribution strategy is primarily focused on deep partnerships across agencies
with tens of thousands of agents who benefit from the ease-of-use of our automated underwriting platform,
seamless API integrations, instantaneous bindable quotes and proprietary Agent Portal built with an AI-
powered sales enablement and education platform. We believe this is a meaningful departure from industry
norms and makes our approach to distribution attractive to the agents with whom we work.
The three pillars above interlock, creating a powerful and reinforcing loop. Unlike traditional insurance
underwriting that historically relied on humans, static models, and infrequent adjustments, we leverage an iterative
approach that allows us to consistently and rapidly integrate new data and models into our underwriting engine,
thereby refining our processes and adapting to evolving market and environmental conditions. As our models
constantly evolve and improve, they are able to deliver superior results that minimize losses for our capacity
providers, which in turn grant us additional underwriting capacity. With more capacity available, we can offer
coverages our policyholders want, enhancing the ability for our agency partners to easily sell policies while
expanding our distribution and reach. The resulting increase in quoted and bound policies provides us with access to
more data, enhancing the predictive capabilities of our underlying models.
We operate as an MGA, with a highly profitable, recurring, fee-based revenue model derived from two primary
sources: commissions paid by capacity providers, and fees paid by policyholders. Commissions are calculated as a
negotiated percentage of premium for each policy. As of March 31, 2026, our average commission rates have
increased by 4.7% since 2018, as capacity providers continue to recognize our superior underwriting performance.
Given our high retention rates to date, we believe that we have a high degree of visibility into our future revenue
streams. For example, for the three-month period ended March 31, 2026, our eligible policy and premium retention
rates at renewal were 86.2% and 92.9%, respectively. The difference between policy and premium retention rates
reflects increases to the rates charged to renewing policyholders.
As of December 31, 2018, the end of our first full year of operations, we had $4.4 million of premium in force
with one insurance program. As of March 31, 2026, we have achieved remarkable growth. Since 2018, our premium
in force has increased at a CAGR of 88.3% to $370.2 million as of December 31, 2025, and $388.7 million as of
March 31, 2026. For the year ended December 31, 2025, we generated $159.6 million in revenue, $37.4 million in
net income, and $95.0 million in Adjusted EBITDA, which translates to $2.8 million in revenue per employee and
7
$1.6 million in Adjusted EBITDA per employee, a 23.4% net income margin and a 59.5% Adjusted EBITDA
margin. In addition, for the three months ended March 31, 2026, we generated $37.8 million in revenue, $7.3 million
in net income, and $21.6 million in Adjusted EBITDA, which translates to a 19.4% net income margin and a 57.1%
Adjusted EBITDA margin. For the twelve months ended March 31, 2026, we generated $168.0 million in revenue,
$34.8 million in net income, and $99.5 million in Adjusted EBITDA, which translates to $2.8 million in revenue per
employee and $1.7 million in Adjusted EBITDA per employee, a 20.7% net income margin and a 59.2% Adjusted
EBITDA margin. Our Adjusted EBITDA margin has consistently exceeded 54.0% over the past four years, thanks
to the operational leverage inherent in our technology-first business model. Notably, our organic revenue for the
year ended December 31, 2025, increased by $40.3 million, or 33.7%, year-over-year. For the year ended
December 31, 2025, we also generated net cash provided by operating activities of $51.7 million. As of March 31,
2026, we had negative book value per share due to our history of paying dividends to our stockholders, which have
been financed through a combination of debt and redeemable, convertible preferred stock financings, and cash flows
generated from our business operations. Since inception, we have made dividend payments to our stockholders
totaling approximately $605.0 million.
Organic Revenue
($MM)

YoY Organic Revenue Growth % | 63% | 37% | 41% | 34% | 32% |
YoY Premium in Force Growth % | 61% | 41% | 36% | 33% | 32% |
Net Income
($MM)
Premium in Force
($MM)

Adjusted EBITDA
($MM)
Net Income Margin % | |||||
34% | 29% | 21% | 29% | 23% | 21% |
Adjusted EBITDA Margin % | |||||
50% | 55% | 57% | 60% | 60% | 59% |
8
Our Technology and AI
We built Neptune as an AI-native, API-first platform from the ground up with machine learning models that
underpin pricing, underwriting, portfolio management, and distribution across what we believe is the largest private
flood dataset in the United States. Approximately 40% of our employees are engineers or data scientists and by
design, our entire infrastructure was built to evolve. We believe AI is a tailwind for us – our workflows are natively
digital; we do not have manual underwriters to replace; and we are not burdened by legacy technology systems.
Additionally, our continued focus on automation, model enhancements, and platform scalability using the latest
tools continues to deliver measurable performance improvements and productivity gains. Our 12-month revenue per
employee increased 17.3% to $2.8 million and Adjusted EBITDA per employee increased 14.8% to $1.7 million.
Our flexible platform supports the scalability and reach of our business. The faster, easier, and more
comprehensive flood product we are able to offer to agents and customers, the more volume we see and the stronger
our dataset gets. Over years, we have assembled proprietary flood risk data, behavioral retention data, claims
performance insights, and real-time transaction signals that we believe no competitors can replicate by just adopting
a large language model. We believe the data at our scale in our domain is a structural barrier to entry and we believe
the moat widens over time.
Our Unique, Data-Driven Approach
Data science is our guiding principle, driving innovation that we believe enables us to deliver fast and accurate
insurance solutions that are policyholder-centric, more efficient for our agents, and that deliver consistent
underwriting profits for our capacity providers.
Our internally-developed and proprietary technology platforms include Triton, our underwriting engine, and
Poseidon, our policy management system, which are closely integrated and easy to use. The key features of our data
science approach that underpin our platforms include:
•Precise Pricing Models: Our models leverage advanced ML and data analysis to evaluate flood risks at
the individual property level. By incorporating real-time data, including from geospatial mapping as well as
predictive analytics, we deliver competitive, risk-adjusted pricing that reflects the unique risk of each
property. The precision of this data-driven approach empowers us to offer instant underwriting decisions
and bindable quotes at scale, with a level of intention and sophistication in our risk selection that we believe
sets us apart in the industry and that results in a high degree of predictability in our business outcomes.
•Automation and Efficiency: We operate with the mantra of “automating everything.” We constantly
focus on reducing manual processes across our operations and enabling our team to concentrate on more
complex and high-value tasks.
•Scalability: Our emphasis on automation in our technology infrastructure allows us to process tens of
thousands of quotes daily, providing the scale necessary for rapid growth and market expansion without a
proportional increase in headcount. The elevated volume we experienced during the federal government
shutdown in October and November 2025 highlighted the best-in-class, fully digital nature of our platform.
Increased activity drove strong growth in sign-ups, quotes, and bound policies, all while performance,
reliability, and service levels remained constant.
•Agility: Our platform has demonstrated a great degree of flexibility, seamlessly incorporating new perils
and geographies over time in response to the evolving needs of policyholders and agency partners, and with
minimal incremental costs.
•Ease of Use: Our platforms are designed with a focus on simplicity and accessibility. Agents and
policyholders can obtain quotes, purchase policies, and manage policyholder coverage in just minutes
through our streamlined online interface. In many cases, the creation of a Neptune quote is automatic and
instantaneous for agents via our API, allowing seamless cross-sell opportunities alongside standard home
and business insurance quotes. We believe this ease of use and quote-to-issue process differentiates
Neptune from traditional insurance providers and has been a key driver of our success.
9
Triton and Poseidon were built entirely in-house by our Neptune Engineering Group. These platforms are
powered by ML models centered around our vast proprietary datasets, which are developed and maintained by the
in-house Neptune Data Science Group and are generated from data collected through the operation of our business,
including quote requests, the policies we have bound, and the losses incurred on the policies we have sold. Triton
processes over 20,000 quotes on a typical day. As of March 31, 2026, Triton has provided approximately 34.4
million quotes, underwritten 13.3 million properties, and bound 1.4 million policies across the U.S. since inception,
providing Neptune with what we believe is the largest flood insurance sales and claims database outside of the
NFIP.
Our systems continually update and constantly learn and improve from the expansive datasets generated by our
daily operations, helping us stay ahead of the curve in understanding flood risk. In March 2026, we released the
570th product version of our underwriting model, demonstrating our commitment to continued improvements.
From a risk selection perspective, we believe our focus on data science has allowed us to provide a more
accurate estimate of likelihood of loss across our portfolio compared to the industry. This has allowed us to deliver
superior written loss ratios for our capacity providers. Despite navigating some of the largest flood disasters in
U.S. history, our Triton underwriting platform has delivered a lifetime written loss ratio of just 24.7% from our
inception through June 30, 2025. For example, in 2024, Hurricane Helene devastated parts of Florida and North
Carolina as the fourth most expensive flooding event in NFIP history. The written loss ratio on that storm for
policies sold by Neptune was 17.0% while the NFIP produced a written loss ratio of 169.6%. At the time of the
storm, we had approximately 74,000 policies in force in the affected states of Florida, North Carolina, and
Tennessee.
In 2024, we also implemented an ML-driven renewal optimization model, which has had a measurable impact
on policy retention rates. This model enabled more precise identification of policyholders at risk of non-renewal and
allowed for targeted engagement strategies, driving an increase in policy retention from 85.7% for the three months
ended March 31, 2025, to 86.2% for the three months ended March 31, 2026.
As our business grows, this strong retention rate has resulted in an increasing share of our portfolio consisting of
tenured policyholders. As of March 31, 2026, 68.5% of our premium in force was associated with policies in a
renewal term, and these policies accounted for 64.3% of our policies in force.
Our Industry
Our Market Opportunity
We operate in the large and growing flood insurance market. According to FEMA, flooding is the most
common and costly natural disaster in the U.S., causing damages that exceed $40 billion annually according to the
Congressional Budget Office, and is expected to continue to grow with progressing climate change. Despite the
growing risk, flood insurance penetration remains low.
10
In the U.S., there are more than 100 million residential and commercial buildings, and we believe more of these
buildings are likely to be at risk of flooding than is currently identified by FEMA. According to First Street’s First
National Flood Risk Assessment, in 2020 there were approximately 22 million buildings at risk of flooding and over
14 million buildings at risk of substantial flooding over the following 30 years. However, only approximately
9 million buildings are identified by FEMA as being within Special Flood Hazard Areas — regions with 1% or
higher annual probability of flooding. Properties in SFHAs with federally backed mortgages are required by the
FDPA and related regulations to have flood insurance. Yet FEMA has noted that flood maps that underlie the SFHA
designations are outdated and require extensive updates, as they do not currently take into account key types of
precipitation. This was highlighted during Hurricane Harvey (2017) when, despite lower flood insurance penetration
rates than in SFHAs, 68% of reported claims in Harris County were outside SFHAs according to Harris County
Flood Control District.
Outside SFHAs, we estimate that flood insurance uptake in general is inadequate, with only approximately 2%
of properties being covered by flood insurance, representing vast underinsurance and what we believe is a
significant and untapped addressable market for our products. Even in high-risk states such as Florida, Texas, and
Louisiana, combined residential penetration is below 13% according to NFIP Residential Penetration Rates as of
January 2, 2025. We believe this gap in flood insurance coverage, together with the limited designation of SFHAs,
creates significant financial vulnerabilities for millions of American home and business owners and lenders and
presents a substantial opportunity for innovative private-sector insurance solutions like Neptune.
NFIP Challenges and Developments
Historically, the flood insurance market offered limited options, as regulated lending institutions were required
to accept only policies underwritten by the NFIP to satisfy mortgage requirements. In 2012, however, Congress
passed the Biggert-Waters Flood Insurance Reform Act of 2012, mandating that lenders also accept private flood
insurance policies if written on an NFIP-equivalent form. Despite this regulatory opening, to date, the NFIP has
continued to dominate the market, as private insurers have lacked the expertise, innovation, and access to historical
claims data necessary to profitably underwrite flood risk. In addition, the NFIP historically received substantial
government subsidies that enabled it to limit premiums to rates that were challenging for private flood insurance
providers to compete with, a dynamic that is shifting with the NFIP’s introduction of “Risk Rating 2.0,” discussed in
more detail below.
As of December 31, 2025, the NFIP insured approximately 3.6 million properties and collected approximately
$5.5 billion in total policy cost, with an average annual policy cost of $1,548 per policy, according to FEMA. We
believe the NFIP falls short in meeting the evolving needs of homeowners and businesses. For decades, its policies
have provided low coverage limits that often fail to address the true costs of rebuilding. Moreover, the process of
purchasing NFIP coverage can be slow and cumbersome for both policyholders and agents, in contrast to the
instantaneous and accessible Neptune quote-to-issue process.
Operational and financial challenges have also persisted throughout the NFIP’s history. We believe these issues
stem from its subsidized and rudimentary pricing methodology, which has frequently failed to accurately reflect the
underlying risk of policies. As a result, the NFIP has accumulated substantial financial losses, currently owing
$22.525 billion to the U.S. Treasury and accruing approximately $2 million in daily interest, according to FEMA
and the Congressional Research Service.
In 2021, the NFIP launched Risk Rating 2.0, a new pricing methodology aimed at better aligning premiums
with the risk profile of a given property. Under Risk Rating 2.0, most policyholders will experience annual rate
increases of up to 18%, the maximum allowed under congressional caps, until their premiums reach full risk-based
levels. The U.S. Government Accountability Office estimates that approximately $27 billion in additional subsidies
will be required for the NFIP portfolio between 2022 and 2037 due to these price caps. While this subsidized pricing
model historically allowed the NFIP to price policies at rates that limited our ability to compete for those policies, as
subsidies phase out under Risk Rating 2.0, we expect the gap between NFIP rates and actual risk costs to narrow,
positioning Neptune to offer more affordable coverage to approximately 50-60% of current NFIP policyholders,
representing approximately 50-70% of the NFIP’s premium base.
11
We believe the NFIP’s legacy pricing model, cumbersome processes, and limited coverage have created
significant market dislocation and inefficiencies, resulting in a compelling opportunity for private flood insurers like
Neptune to capture market share.
Industry Tailwinds
We believe there are several additional structural shifts that will continue to drive opportunities in the flood
insurance market broadly and for private providers such as Neptune, including:
•Increased Demand Driven by Growing Natural Disaster and Flood Damage: As climate change
intensifies, areas with low perceived flood risk today (e.g., non-coastal regions) could face increased
frequency and intensity of flooding due to additional rainfalls and storms. As climate change continues to
intensify, associated with increasing severity of storms and resulting losses, we expect the demand for flood
insurance to increase. Additionally, more areas with severe inland flooding could be designated as
mandatory flood insurance zones for policyholders with federally-backed mortgages.
•Underlying Housing Market Backdrop: The housing market significantly influences property and flood
insurance sales, as a substantial portion of policies are purchased during home acquisitions or refinancings.
If housing market activity were to increase, a revitalized housing market would likely also stimulate growth
in the property and flood insurance sector, presenting opportunities for insurers to expand their
policyholder base and enhance market share. At the same time, with housing prices increasing above the
rate of inflation, the NFIP coverage limit of $250,000 — which was first implemented in 1994 and has
remained static since — grows more outdated each year, prompting policyholders to look to the private
market for excess or replacement coverage. We believe that Neptune, with its advanced technology,
policyholder and agent-first approach, coverage limit of over $7,000,000 for residential properties, and
innovative products, can be at the forefront of capitalizing on this potential growth, were it to materialize,
and closing the insurance gap.
Our Business Model
Our team’s energy is focused, every day, on advancing the three pillars of our business: underwriting, risk
relationships, and distribution.
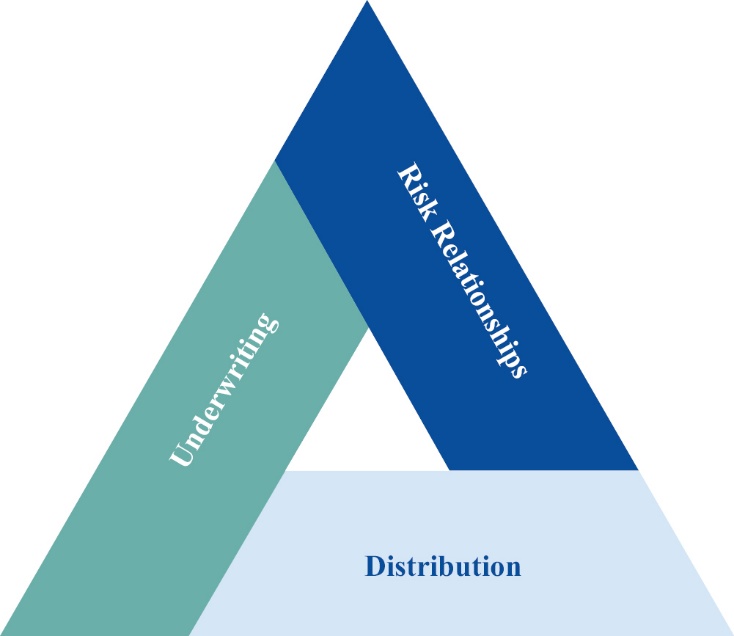
Underwriting
Our automated underwriting engine, Triton, is at the core of everything we do. Our use of the latest ML
technology, advanced data science, AI, and behavioral economics allows us to execute key underwriting
12
tasks — including risk selection, accurate risk pricing, aggregation management, and carrier assignment — in less
than two seconds. This combination of speed and precision provides robust scalability and enables us to process high
volumes of quotes and policies efficiently while maintaining industry-leading performance. We have no human
underwriters and 100% of our underwriting is performed instantaneously by our Triton engine.
__________________
(1)We had approximately 27,021 policies in force in states with flood insurance claims related to Hurricane Ida.
(2)We had approximately 51,562 policies in force in states with flood insurance claims related to Hurricane Ian.
(3)We had approximately 102,426 policies in force in states with flood insurance claims related to Hurricane Helene.
(4)We had approximately 80,266 policies in force in states with flood insurance claims related to Hurricane Milton.
Our underwriting engine has delivered positive results, including a lifetime written loss ratio of just 24.7% from
our inception through June 30, 2025. This performance has spanned some of the largest flooding disasters in
U.S. history — including four of the ten largest flooding events in U.S. history, as measured by NFIP insured loss:
Hurricane Ida (2021), Hurricane Ian (2022), Hurricane Helene (2024), and Hurricane Milton (2024). By contrast,
from 2018 to 2024, the NFIP has delivered an 86% written loss ratio according to FEMA and the U.S. property and
casualty industry in general has seen an average written loss ratio of 54% according to NAIC statutory data.
Our underwriting philosophy is generally built around three fundamental principles:
•Risk Selection: Our approach to risk selection is driven by data science and informed by what we believe
is the most comprehensive claims dataset in the private flood insurance market, generated predominantly
from our operations to date. With over a quarter billion dollars in paid claims across our portfolio since
inception, and our extensive analysis of industry claims and performance data, we have developed deep
insights into identifying and managing properties with the highest probability of flood losses.
We believe we can evaluate property-specific risks with exceptional accuracy. Our proprietary models
identify the characteristics and factors most likely to contribute to large-scale losses, allowing us to focus
on selecting risks that align with the risk tolerances of our capacity providers. This granular approach helps
us avoid adverse selection and has allowed us to deliver consistent, positive underwriting results. It has also
allowed us to provide quotes for 95% of all submissions, optimizing the identification of properties with the
highest probability of flood losses.
Through ongoing analysis of claims data and continuous refinement of our underwriting models, we ensure
that our risk selection process remains sophisticated and nimble. By focusing on selecting the right risks,
we aim to deliver value to both our capacity providers and our policyholders while maintaining a
sustainable and profitable portfolio.
•Pricing: Our pricing is a sophisticated, data-driven process that incorporates advanced ML and
behavioral economics to ensure accuracy and market competitiveness. Rather than relying on static or
13
simplistic pricing models, we use a proprietary technology-driven framework to evaluate the unique
characteristics of each property and its risk profile. Our pricing methodology is informed by a combination
of flood risk data, customer behavior, and market dynamics. Behavioral economics plays a crucial role in
determining how customers perceive and value coverage, and incorporating customer behavioral factors
into our methodology enables us to tailor pricing to increase adoption while maintaining underwriting
integrity. By understanding not only the risk, but also the behavior of customers, we believe we can
optimize premium structures to drive growth and retention.
Unlike traditional insurance underwriting, our pricing does not depend on manual adjustments or broad risk
groupings. Instead, it is dynamically informed by hundreds of data points to assess factors such as property
characteristics, geographic exposure, and historical loss data. This property-specific, data-first approach
allows us to quickly offer fair and competitive pricing while aligning with the risk tolerance of our capacity
providers and continuously improving the accuracy of our Triton underwriting system.
•Aggregation Management (Disaggregation): Our approach to aggregation management is a key
differentiator that sets us apart from industry norms. Traditional underwriting and risk assessment methods
often rely on generalized risk aggregation based on administrative boundaries, such as states or counties,
which serve as crude proxies for exposure to catastrophic events. In contrast, we have developed a patented
technology that enables us to manage maximum loss scenarios at the individual property level through an
analysis that uses radial circles to assess policy concentration in any given area in real time. This advanced
methodology, which we refer to as “disaggregation,” allows us to optimize risk exposure in real time and
align each policy with the specific risk appetite of our capacity providers.
By moving beyond man-made legacy geographic boundaries, we can more effectively distribute exposure
to minimize concentration risk while focusing on the actual drivers of loss, such as property-specific
vulnerability to flood. This precision also allows us to confidently underwrite in high-cost insurance
markets, including hurricane-prone areas, while continuously informing and refining our pricing models to
remain both responsive and data-driven.
Our disaggregation framework also leverages real-time data to adjust exposure dynamically as policies are
written. This sophisticated approach enables us to manage risk with precision, which we believe maintains our
capacity providers’ confidence in our ability to deliver consistent, positive underwriting performance. Through our
patented technology and innovative methodology, we not only provide accurate risk management for our capacity
providers but also ensure long-term scalability and sustainability for our business.
Risk Relationships
Neptune does not take any balance sheet insurance risk or have claims handling responsibility relating to the
policies we sell. We currently contract with 8 distinct insurance programs, which are supported by 34 reinsurance
providers, all of whom collectively provide underwriting capacity for the policies we sell. We refer to this panel of
global insurers and reinsurers as our “capacity providers,” who bear all of the balance sheet insurance risk associated
with our underwriting. Although we do not directly contract with the reinsurance providers who support our
insurance programs, we engage and cultivate relationships with them, and believe that the superior written loss ratios
and underwriting results we are able to deliver on the policies we sell incentivizes these reinsurance providers to
provide underwriting capacity in support of our insurance programs.
Over the past 8 years, we have built and expanded a panel of 42 capacity providers, including some of the
largest insurance and reinsurance companies in the world. The strength and reputation of our capacity providers
underscores the market’s confidence in our ability to deliver consistent results and manage risk effectively. Our
insurance carriers are high-quality international insurers with A.M. Best ratings of A- or higher and our 34
reinsurance providers, supporting 8 distinct insurance programs, diversify our risk across both program structures
and ultimate risk takers. As of March 31, 2026, our largest capacity provider accounted for 15.3% of our dollar-one
premium risk. In addition, all of our insurance programs are eligible to write policies in all 50 states and Washington
D.C. This approach mitigates concentration risk on both a financial and geographic basis, provides stability for both
14
our business and our capacity providers, and ensures our portfolios remain resilient with access to ample future
capacity to continue to grow our business.
In the twelve months ended March 31, 2026, we doubled the number of capacity providers on our panel,
growing reinsurance panels on existing programs, and adding two new programs. Included in this growth was a new
relationship with Palomar, through which Neptune became Palomar’s exclusive MGA for flood insurance.
The relationships we have cultivated with our capacity providers are built on transparency, trust, and our
unwavering commitment to delivering value. A key driver of our success is the availability of detailed data and
insights, paired with our ability to deliver results with speed and efficiency. We provide real-time access to
performance metrics, maintain an open and continuous dialogue with our capacity providers, and consistently
exceed expectations with profitable underwriting results.
We have also delivered consistent and substantial premium growth for our capacity providers and our proven
performance has been instrumental in driving partner confidence and growth and engagement with additional
reinsurers who may wish to provide underwriting capacity for our insurance programs. Through the exceptional
written loss ratios experienced by our capacity providers on policies sold by Neptune, driven by the dynamic, risk-
adjusted pricing and coverage decisions made by our Triton platform, we have been able to deliver superior returns,
even through some of the largest flooding events in U.S. history. As a result, we have delivered hundreds of millions
of dollars of underwriting profits for our capacity providers since inception and have delivered underwriting
profitability to every capacity provider in every contract year. These outcomes are a testament to our platform
capabilities and our success has led to an increase in the average commission paid to us by our capacity providers of
4.7% between 2018 and March 31, 2026.
These results, combined with our ability to provide actionable insights, have attracted new capacity providers
and strengthened relationships with existing ones. Our proven underwriting results have also generated meaningful
goodwill with our existing capacity providers, allowing us to enhance and develop our product offerings efficiently
to respond to agent and policyholder needs.
The following information showcases the expanding nature of our capacity relationships since inception.
Premium in Force by Program
($MM, colors represent each of the
respective insurance programs)
Capacity Providers
(#)

Programs
(#)
Distribution
Our distribution strategy is built to maximize market reach and provide seamless access to our innovative flood
insurance products with diversification across distribution partnerships. Leveraging a hybrid distribution model, we
utilize strong agency partnerships across the insurance industry and complement those with direct-to-customer sales
to drive efficiency, reach, and scale. Our platform is natively built in digital workflows, allowing us to seamlessly
respond to evolving consumer purchasing behaviors.
Agent and Broker Partnerships: The cornerstone of our distribution network is our deep relationships with
insurance agents and brokers. As of March 31, 2026, 96.8% of our policies in force are driven by these partnerships,
15
which include more than 25,000 unique agency codes that have bound a policy through Neptune and over 114,000
unique agency codes that have run a quote through our Triton platform.
Since inception, we have been able to grow our distribution network tremendously and uninterruptedly. As of
March 31, 2026, 25,098 cumulative agency codes have bound a policy with Neptune, an increase of 23.5% from
19,191 as of March 31, 2025.
Unique Agency Codes with Policy Bind
(thousands)
2018 | 2019 | 2020 | 2021 | 2022 | 2023 | 2024 | 2025 | |||||||||||||||||||||
Annual Growth: | 332% | 118% | 70% | 35% | 26% | 26% | 30% | |||||||||||||||||||||
More recently, we have moved from tracking agency codes to tracking individual users. With over 45,000
active users, we believe we have greater visibility into agent-level behavior, enabling more targeted outreach, better
enablement, and a clearer picture of where production opportunities exist.
We believe that Neptune delivers significant value to agents through a combination of ease of use, a superior
product-market fit, high availability — made possible by our quoting of 95% of all submissions — and our ability to
deepen agents’ relationships with policyholders. Historically, agents have had to undergo NFIP training and engage
in the cumbersome NFIP quoting process to sell flood insurance policies. With Neptune, agents can leverage our
user-friendly Agent Portal to quickly enter customer data and receive instantaneous quotes, which they can relay in
real-time, thereby democratizing the sale of flood insurance. To further enhance the agent experience, we have
developed deep technology integrations with many of our agency partners through API links directly into their
quoting systems, allowing them to quickly quote and bind flood policies alongside homeowner policies and provide
comprehensive solutions for their customers. In addition, our Agent Portal provides our agents with up to date, data-
driven insights about flood risk in the geographies where a quote is being sought, empowering our agents to drive
further demand for our products at the time of each quote. Our recently launched AI-powered sales assistant, Atlas+,
is an entirely redesigned and proactive approach to agent engagement. Built directly into our Agent Portal interface,
Atlas+ provides agents with actionable suggestions and information to improve their ability to convert leads into
sales. Through these innovations, our platform enables agents to grow their business by enhancing the overall value
of the policyholder relationship, while offering a product that seamlessly fits the needs of both agents and
policyholders. This in turn drives increasing adoption and higher conversion rates.
We believe our deep relationships with high quality agencies are critical in maintaining our early-mover
advantage. Our agency partners include carriers with large captive agent forces, wholesalers, agency networks, flood
specialists, and small, independent, family-owned agencies. Our ability to offer an alternative product that better fits
many customers’ needs has resonated with our agents and has been essential to driving over 60.0% of our new
policy sales in “non-mandatory flood zones” over the last three years. Furthermore, our policies in force are highly
16
diversified across a network of high-quality agents, without any material concentration risk or reliance on individual
agencies or agents. As of March 31, 2026, our largest agency partner contributed approximately 8.5% of our total
policyholder base. We maintain a robust pipeline of potential agencies interested in partnering with Neptune, while
our in-house sales team continually nurtures existing relationships, supporting strong alignment with our agency
partners and mutual growth. Our agency relationships are deeply entrenched at the agent level and play an active
role in both converting NFIP policyholders to Neptune and winning new customers to the flood insurance market to
enable our continued expansion.
Neptune Internal Agency: 2.1% of our policies in force as of March 31, 2026, were attributed to our in-
house agency, with a team of licensed agents managing a growing number of quotes from our website and a select
few of our distribution partners. These agents are also licensed to distribute NFIP policies in certain rare cases where
policies do not meet Triton’s underwriting criteria.
Direct-to-Customer Sales: 1.1% of our policies in force as of March 31, 2026, were attributed to our direct-
to-customer channel. Our easy-to-use online interface allows prospective customers in select states to quote, bind,
and manage policies directly. This option complements our agency partnerships and provides ease of access for all
property owners seeking flood insurance solutions. We support our online interface with our third-party agencies
and in-house agency able to assist when required or to otherwise finalize the sales process. We recently made
Neptune available as a native app inside ChatGPT, allowing consumers to get a preliminary quote in seconds and
explore coverage options in the chat interface. While we expect the agent channel to continue to play an important
role in expanding the market, our technology is designed to be able to capture new and evolving volume regardless
of the channel.
In addition to driving scalability and flexibility, as we rapidly expand into new markets and introduce additional
products, our distribution infrastructure is critical in reinforcing our data advantage. Our distribution and referral
partners submit over 20,000 quotes to Triton on a typical day, with approximately 34.4 million lifetime quotes and
1.4 million binds from inception through March 31, 2026. All these quotes (whether or not they lead to binds) and
binds fold into and grow our proprietary dataset, allowing us to continually build the competitive advantage
provided by our platform.
The following information illustrates the cumulative quotes and binds on our Triton and Poseidon systems since
inception in 2018.
Cumulative Triton Quotes
Proprietary Underwriting System
2018 | 2019 | 2020 | 2021 | 2022 | 2023 | 2024 | 2025 |
17
Cumulative Poseidon Binds
Proprietary Policy Management System
2018 | 2019 | 2020 | 2021 | 2022 | 2023 | 2024 | 2025 |
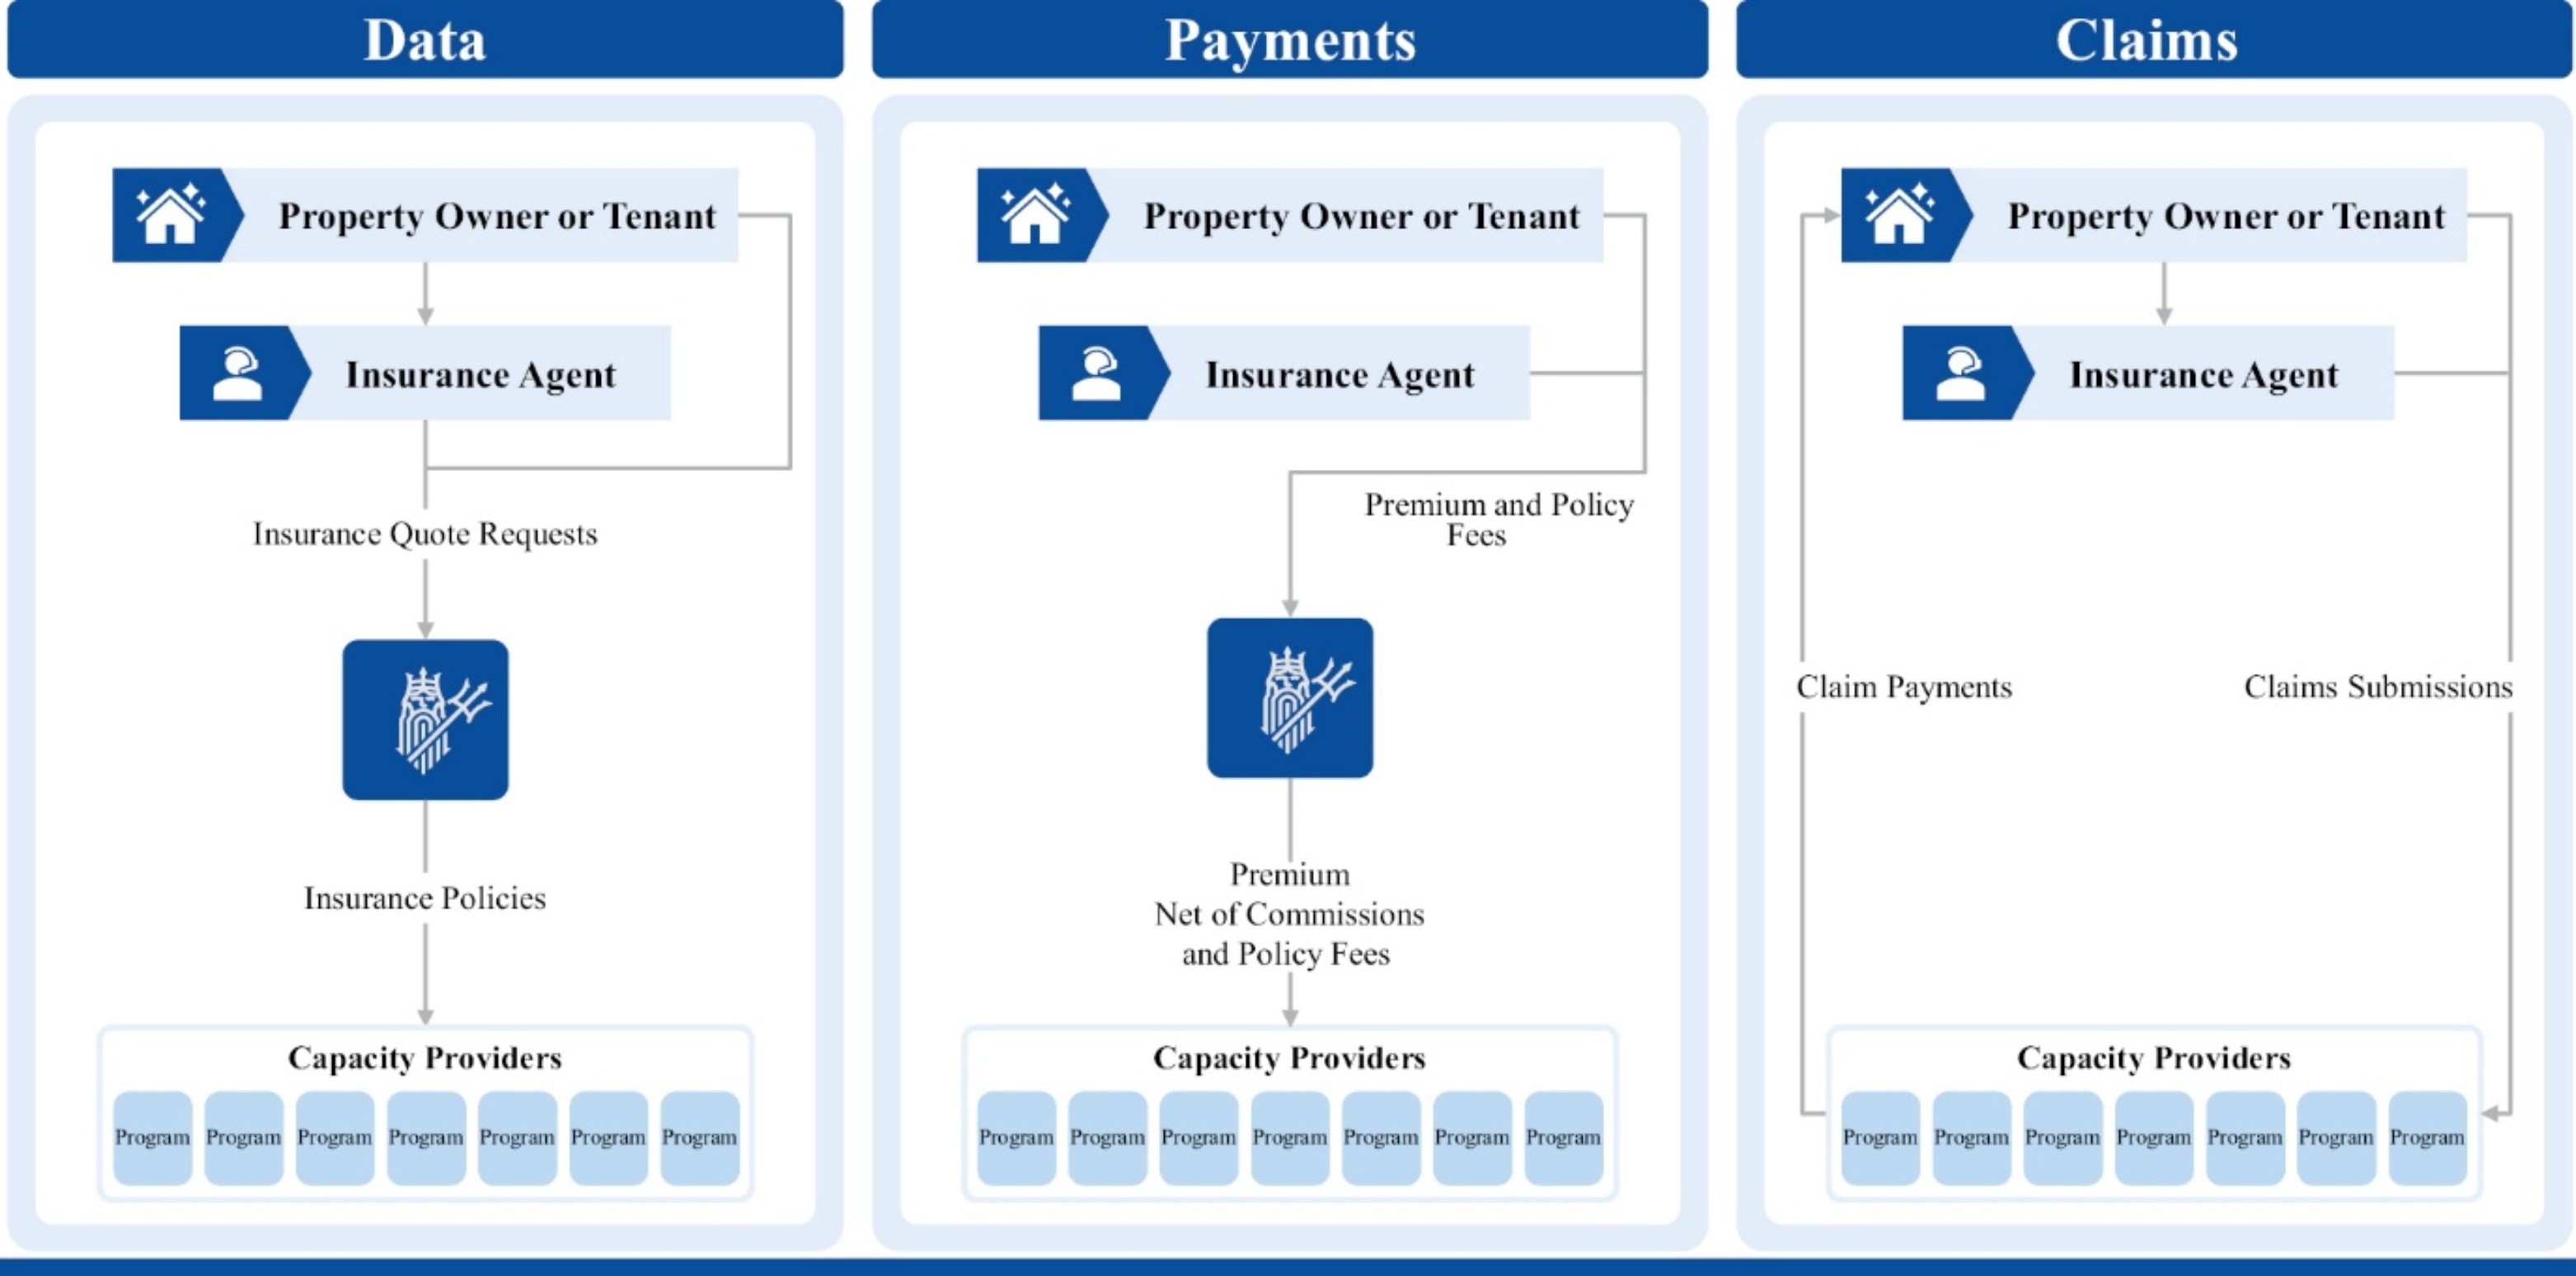
In addition, below is a chart demonstrating the roles we, our capacity providers, and our distribution partners
play in the flow of data and payments, and the role our capacity providers and distribution partners play in the flow
of claims from policyholders:
We offer a range of innovative insurance products designed to address the needs of residential and commercial
property owners facing flood and other natural disaster risks. As of March 31, 2026, across all of our insurance
product offerings, residential properties accounted for 88.1% of our premium in force and commercial properties
accounted for the remaining 11.9%. Our flagship primary residential flood insurance product accounted for 85.9% of
our premium in force as of March 31, 2026. In addition to the base policy, we offer enhanced protection through
expanded coverage options, which we believe make our flood insurance product a superior coverage alternative to
the NFIP. We also offer an excess flood insurance product, which we introduced in 2024. This product, which is
available to both residential and commercial property owners, represented 2.9% of our premium in force as of
March 31, 2026. Both our primary and excess flood insurance products are structured around the NFIP form and can
be used to supplement or fully replace existing NFIP coverage, as needed. In addition to our flood insurance
products, we offer a parametric earthquake insurance product, launched following our acquisition of Jumpstart in
September 2021, and in December 2025 we launched a beta test of an indemnity earthquake product to a small
group of agencies within the state of California. While currently less than 1% of our portfolio, these earthquake
insurance products allow us to collect data and expertise that we believe will allow us to eventually diversify into
other perils and address additional unmet insurance needs.
18
Our Geographic Presence
We operate nationwide and actively mitigate our concentration risk by expanding and diversifying our portfolio
across the country. As of December 31, 2025, Florida, Texas, and Louisiana accounted for only 48.9% of our
policies in force, compared to a much heavier exposure of 59.6% for the NFIP, according to the NFIP.
The Neptune Advantage
We believe that Neptune’s competitive advantage is driven by the three core pillars of our business model
(underwriting engine, risk relationships, and distribution) and is extended by the following:
•Technology and Data-First Culture: Technology is at the heart of our capabilities and success, enabling
us to deliver innovative, efficient, and optimized insurance solutions in a simple and accessible way. As of
March 31, 2026, 40% of our 62 employees were on our technology development team, with our proprietary
and internally-developed underwriting, policy management, and agent systems forming the backbone of our
operations.
◦Our technology infrastructure is built to support rapid expansion into new markets and product lines.
Whether adapting to regulatory changes, adding capacity relationships, or launching new offerings like
our excess flood product, our systems are designed to support growth without compromising speed or
reliability. We operate on a fully digital, AI-native, cloud-based computing infrastructure. Leveraging
cloud computing allows us to rapidly scale our underwriting, policy management, and analytics
capabilities in response to market demand. This infrastructure provides seamless remote access for our
distributed workforce, enhancing system reliability, and ensuring that our data science and ML models
can process vast amounts of information with minimal latency.
◦Our technology ecosystem is strengthened by our ML models and predictive analytics developed by
the Neptune Data Science Group. These models use vast datasets from our operations, as well as
geospatial mapping and real-time risk assessments, along with our proprietary data on the high
volumes of transactions effected on our systems, to evaluate flood risks at the individual property level
with precision. This enables us to provide instant underwriting decisions and dynamic, risk-adjusted
pricing for both residential and commercial properties, allowing us to provide coverage with
exceptional accuracy that incumbents and other players struggle to do.
19
◦We are committed to continuously refining and expanding our technology capabilities. Through
constant innovation, we ensure our platforms remain at the cutting edge of the insurance industry,
empowering us to stay ahead of market trends and deliver value to our capacity providers, agents, and
policyholders.
•Early-Mover Advantage in a Large, Evolving Market Dominated by the NFIP: As the first entrant in
the private flood insurance market with substantial scale and geographic presence, we have accumulated
proprietary datasets through our operations that continuously improve our predictive technology, designed
innovative products that we believe better suit evolving customer demand, and developed an extensive
distribution network with trusted relationships that ensures broad reach across the market. We believe this
measurable competitive edge positions us to capture greater market share as the industry evolves following
anticipated long-term structural shifts driven by NFIP risk re-rating, climate change, and growing housing
demand.
•Trusted Relationships with Capacity Providers: Through eight challenging storm seasons, we have
delivered underwriting profit to each of our capacity providers every year. This has enabled our capacity
providers to deliver consistent and predictable capacity to support our current and expected growth.
Additionally, as a result of our performance, our capacity providers have awarded us greater flexibility to
underwrite and bind policies, a contrast to industry norms where binding authority is typically set on
stricter negotiated limits and criteria. This flexibility allows us to control product design, risk aggregation,
and capacity allocation, and allows us to respond to opportunities and needs from agents and our
policyholders in an agile manner, continuing to reinforce our competitive advantage.
•Robust Track Record of Financial Performance with Strong Visibility into Future Earnings: We
have consistently outperformed our internal expectations, demonstrating a disciplined and reliable approach
to growth. Through 21 landfall hurricanes, we have delivered positive underwriting results and maintained
strong loss performance. This operational consistency has translated into substantial revenue and Adjusted
EBITDA growth since inception. Our business is supported by a high degree of recurring revenue and
predictable renewal patterns, providing strong visibility into revenue growth and profitability. For the
twelve months ended March 31, 2026, 67.4% of our revenue was derived from renewal business.
•Disciplined Leadership Team: We are a founder-led organization, with a unified strategic vision,
focused on delivering superior outcomes for our stakeholders. Our disciplined approach to risk
management and optimization has led to us being profitable since our second year of operation. Our lean
organizational footprint of 62 employees as of March 31, 2026, allows us to prioritize efficiency,
scalability, and flexibility in our operations, driving industry-leading profitability per employee.
Our Growth Strategy
The opportunities for growth in the Neptune portfolio are both broad and deep. We believe we will continue to
maintain strong revenue growth based on:
•Growth Across Existing Products and Geographies: We believe the U.S. primary and excess flood
insurance markets present immense growth opportunities for Neptune. Despite our significant achievements
and expanding scale to date, based on data from NAIC and NFIP, we estimate that as of December 31,
2025, we accounted for just 8.2% of the U.S. primary residential flood insurance market, with an even
smaller share of both the excess flood market, which we entered in 2024, and the commercial flood market.
This leaves substantial room for growth given the current insurance gap, increased market awareness of
flood risk, and evolving market conditions, particularly around anticipated developments related to the
NFIP’s implementation of Risk Rating 2.0. In addition, we believe our distribution strategy, which is
primarily focused on deep partnerships across agencies with tens of thousands of agents, facilitates
increased awareness of both our products and flood risk among our agents and prospective policyholders,
through the ease-of-use of our automated underwriting platform, seamless API integrations, instantaneous
bindable quotes, and proprietary Agent Portal. In many cases, the creation of a Neptune quote is automatic
and instantaneous for agents via our API, facilitating easy cross-sell opportunities alongside standard home
20
and business insurance quotes. In addition, our Agent Portal provides our agents with up to date, data-
driven insights they can share with prospective policyholders about flood risk in the geographies where a
quote is being sought, empowering our agents to drive further demand for our products at the time of each
quote. Through these innovations, we believe our platform enables agents to grow their business by
delivering added value to the policyholders, while creating further awareness in support of our growth
strategy.
•Ability to Scale with Limited Incremental Cost: Our technology infrastructure is built to support rapid
expansion, allowing us to scale our business using the same cost structure without requiring us to incur
material additional capital expenditures. We operate on a fully digital, cloud-based computing
infrastructure, which we can leverage to rapidly scale our underwriting, policy management and analytics
capabilities in response to market demand. This infrastructure provides seamless remote access for our
distributed workforce, enhancing system reliability, and ensuring that our data science and ML models can
process vast amounts of information with minimal latency. Further, because our entirely digital
underwriting engine, Triton, uses advanced algorithms, without any human underwriters, to assess risk with
speed and precision, we are able to price, quote, and bind additional policies at scale without any significant
expansions to our employee base. As a result, while many of our general and administrative (“G&A”) costs
are expected to scale with the size of our business (for example, as the number of policyholders increases,
customer support and cloud hosting costs may rise), we do not believe that growing our business or the
number of policies we sell will require any material changes to our cost structure. We intend to continue to
implement new technology from time to time, which we intend to build and maintain using our existing
technology development team, including our Neptune Engineering Group and Neptune Data Science
Group, to further improve efficiency and scalability.
•Expansion of Product Offerings: We have continued to innovate and broaden our product offerings to
capitalize on market trends and growth opportunities. In 2024, we launched an excess flood insurance
product designed to address a critical gap in coverage for policyholders who remain with the NFIP. Many
NFIP policyholders are unable to transition fully into the private market due to the economic benefit
provided by substantial government subsidies that limit their premiums. Our excess flood product allows
these policyholders to maintain their NFIP coverage while purchasing additional protection from Neptune,
providing more comprehensive protection for their homes and families. Growth within this market
represents a meaningful opportunity. With our innovative primary flood product and rapidly growing
excess flood offering, we are well-equipped to serve both residential and commercial property owners,
providing them with comprehensive and affordable coverage. As climate change likely continues to
increase the frequency and severity of flooding events, including in areas that have not historically been
considered flood prone, we believe increased awareness of flood risk among the general public can drive
further demand for Neptune products. As a result, we remain focused on leveraging technology and
delivering tailored solutions to meet the evolving needs of our policyholders. These market dynamics play
directly to Neptune’s strengths and reinforce our ability to grow market share. Additionally, as part of our
commitment to addressing long-standing market gaps and expanding our product portfolio, we are actively
exploring opportunities in additional perils beyond flood. In December 2025, we launched a beta test of a
new indemnity earthquake product in California, where there is a material insurance gap for earthquake
coverage, with approximately 89% of buildings uninsured. We believe the indemnity earthquake product
will provide true value to policyholders by addressing shortcomings in the options currently available on
the market, including long-term affordability and ease of purchase. The development of an indemnity
earthquake product builds on the expertise gained from our acquisition of Jumpstart and would respond to
the growing demand from both policyholders and our agency partners for comprehensive earthquake
protection. By leveraging our proprietary, entirely digital, and API-driven underwriting capabilities and
distribution infrastructure, we believe we can add adjacent perils and products that close protection gaps in
underserved markets with minimal incremental cost and without adding complexity or sacrificing our
margin.
•International Expansion: Flooding is a pervasive and growing global challenge, yet the flood peril
remains inadequately understood and underinsured in many countries around the world. Across the globe,
21
millions of residential and commercial properties face significant and rising flood risks, often without
sufficient insurance coverage to protect property owners from financial loss. In most international markets,
flood insurance penetration is minimal, with many regions relying on outdated risk models, government-
backed programs, or ad hoc relief efforts to address flooding events. These approaches often leave property
owners exposed to significant financial vulnerabilities, particularly as climate change likely exacerbates the
frequency and severity of flood events globally. This underinsurance may create an opportunity for
Neptune to expand into international markets and provide innovative, data-driven flood insurance solutions
to property owners in need. Leveraging our proprietary technology platform, advanced underwriting
capabilities, and experience in the U.S. market, we believe we are uniquely positioned in the coming years
to enter international markets and address the gaps left by traditional insurance providers. We expect our
scalable technology infrastructure, built for rapid deployment, would enable us to adapt quickly to the
regulatory requirements and unique risk profiles of different countries.
•Inorganic Growth Opportunities: From time to time, we may supplement our long-term organic growth
with strategic acquisitions, focused on gaining expertise or expanding and complementing our existing
portfolio. In recent years, we have completed a notable intellectual capital focused acquisition of Jumpstart,
a leading parametric insurance company, and expanded our expertise through the strategic hiring of the
employees of Charles River Data, a Boston-based data science consulting firm.
Potential Challenges
There are also a number of factors that we believe could present challenges to our strategic plans or limit our
ability to grow our business, including:
•Adverse NFIP Developments: The flood insurance market is highly concentrated, with the NFIP
holding approximately 80% of the market share. As the dominant provider, the NFIP benefits from strong
federal backing and widespread consumer recognition. Its significant market presence and subsidized
pricing in certain areas create challenges for private insurers, including Neptune, to compete effectively. If
the NFIP’s implementation of Risk Rating 2.0 is tolled or delayed or Congress elects to continue to
subsidize the NFIP consistent with historic levels, it could limit our potential growth opportunities relating
to existing NFIP policyholders. In addition, adjustments to the NFIP’s pricing, coverage options, or
underwriting guidelines could also significantly alter the competitive landscape. Although we believe
purchasing insurance from the NFIP is relatively burdensome and time-consuming for policyholders and
agents, and that its limited product offerings often fail to meet policyholder needs, if the NFIP were to
lower premiums, simplify its processes, or increase its coverage options, we could face increased difficulty
in retaining or growing our policyholder base.
•Continued Weakness in the Housing Market: Our performance and ability to issue new policies and
retain existing policies is closely tied to home sales, economic activity, construction costs, household
income, and employment levels, as well as commercial property markets. Elevated mortgage rates and
declining affordability have recently strained the housing market, leading to a decrease in first-time
homebuyers and overall housing market activity. As of January 2025, the average rate on a 30-year fixed
mortgage in the U.S. had risen to over 7%, marking its highest level since mid-2024. While this average
rate has since decreased below 7%, this surge has contributed to a decline in home sales, with existing
home sales in 2025 at the lowest level since 1995. Elevated mortgage rates, together with higher home
prices, can create affordability challenges, particularly for first-time buyers. For example, the National
Association of Home Builders estimates that in 2023, when mortgage rates on a 30-year fixed mortgage
rose from 6.25% to 6.5%, nearly 1.3 million households were priced out of the market for a median-priced
home. Continued weakness or a further decrease in housing market activity, particularly in areas where
flood coverage is needed, due to adverse economic conditions or other factors, could result in a decline in
the home insurance industry and reduction in the sale of our policies, reduced renewal rates, and increased
cancellations of existing policies, as many flood insurance purchases are driven by mortgage requirements
and a substantial portion of our flood insurance policies are purchased during home acquisitions or
refinancing.
22
•Access to Top Talent: Our success depends, in large part, on our ability to attract and retain talent, which
may be difficult due to the intense competition in our industry and the technology industry generally for
key employees with demonstrated ability. We rely on a team of highly skilled engineers, data scientists, and
other technical professionals who are responsible for the development, enhancement, and maintenance of
our proprietary technology. This team’s expertise in ML, geospatial analysis, and data modeling is vital to
ensuring our ongoing success and our ability to remain competitive. The financial services and technology
industries are highly competitive, and the demand for talented professionals in fields such as data science
and ML often exceeds supply. The loss of key technical talent or critical members of our engineering and
data science team, or any inability to hire additional talent as the needs of our business may require, could
impair our ability to refine our risk assessment capabilities, address evolving market needs, or respond
effectively to competitive pressures.
Risk Factor Summary
Investing in our Class A common stock involves a high degree of risk. You should carefully consider the risks
highlighted in the sections titled “Risk Factors” beginning on page 35 of this prospectus, and in our Annual Report
and our Q1 Quarterly Report, each incorporated by reference herein before making an investment decision. We may
be unable for many reasons, including those that are beyond our control, to implement our business strategy
successfully. Some of these risks are:
•Our business may be harmed if one or more of our relationships with capacity providers are terminated or
are reduced, if we fail to maintain good relationships with such capacity providers, if we become dependent
upon a limited number of capacity providers, or if we fail to develop new capacity provider relationships.
•Our distribution model depends on third-party agents and brokers, and any failure by those agents and
brokers to consistently promote our products or the loss of any key agent or broker relationships could
adversely affect our business.
•Rapid advancements in AI, including the development of AGI and ML technologies, could increase
competition and disrupt our business model.
•Errors in underwriting or data modeling could harm our reputation, competitive position, and financial
results.
•Reliance on cloud computing exposes us to technological disruptions and potential risks.
•We are highly dependent on the services of our senior management team, including our Chief Executive
Officer.
•Our business is dependent upon information processing systems. Cybersecurity events, data breaches,
cyberattacks, or other similar incidents, as well as defects, interruptions, or other failures, with respect to
our or our vendors’ information processing systems and data may hurt our business, damage our reputation,
negatively impact policyholder retention and capacity provider relationships, and expose us to financial and
legal liabilities.
•Failure to seek, obtain, maintain, protect, defend, or enforce our intellectual property rights, or allegations
that we have infringed, misappropriated, or otherwise violated the intellectual property rights of others,
could harm our reputation, ability to compete effectively, financial condition, and business.
•The insurance business is extensively regulated, and changes in regulation may reduce our profitability and
limit our growth.
•Compliance with insurance licensing requirements for MGAs and excess and surplus (E&S) lines agencies
and individual producers is critical to our operations, and any failure to maintain required licenses could
disrupt our business.
23
•We are subject to evolving laws and regulations on data privacy, data protection, and cybersecurity, which
can be complex and conflicting. We may face investigations, fines, and sanctions as a result of our or our
service providers’ or partners’ actual or perceived failure to comply with such laws and regulations and
incur increased operational costs in order to ensure future compliance.
•Changes in accounting principles and financial reporting requirements could impact our consolidated
results of operations and financial condition.
•We have debt outstanding that could adversely affect our financial flexibility and subjects us to restrictions
and limitations that could significantly impact our ability to operate our business.
•The concentration of our share ownership with those stockholders who held our stock prior to our IPO,
including our executive officers, directors, and holders of more than 5% of our capital stock, may limit our
investors’ ability to influence corporate matters.
•We are a “controlled company” within the meaning of the NYSE rules and, as a result, qualify for, and
have chosen to rely on, exemptions from certain corporate governance requirements that provide protection
to the stockholders of companies that are subject to such corporate governance requirements.
•We are a holding company, and our only material asset is our equity interest in Neptune Flood. As a result,
we depend on the ability of our subsidiaries to pay dividends and make other payments and distributions to
us in order to meet our obligations.
•The dual class structure of our common stock has the effect of concentrating voting control with our Chief
Executive Officer; this will limit or preclude your ability to influence corporate matters.
•Some provisions of Delaware law and our amended and restated certificate of incorporation and bylaws
may deter third parties from acquiring us and diminish the value of our Class A common stock.
If we are unable to adequately address these and other risks we face, our business, results of operations,
financial condition, and prospects may be adversely affected.
Corporate Structure
Neptune Flood was incorporated in Delaware on February 10, 2017. Neptune Holdings was incorporated in
Delaware on March 20, 2025, to implement a holding company organizational structure for Neptune Flood. We refer
to this transaction as our “corporate reorganization.”
Immediately prior to our corporate reorganization, Neptune Holdings was a direct, wholly-owned subsidiary of
Neptune Flood, and Neptune Insurance Merger Sub Inc., a Delaware corporation (“Merger Sub”), was a direct,
wholly-owned subsidiary of Neptune Holdings. Both Neptune Holdings and Merger Sub were organized for the sole
purpose of implementing our corporate reorganization. On April 10, 2025, Merger Sub merged with and into
Neptune Flood, with Neptune Flood continuing as the surviving corporation. Each issued and outstanding share of
common stock of Neptune Flood was converted into one share of common stock of Neptune Holdings and each
issued and outstanding share of convertible preferred stock of Neptune Flood was converted into one share of
convertible preferred stock of Neptune Holdings. The separate corporate existence of Merger Sub ceased and all the
issued and outstanding shares of Neptune Holdings owned by Neptune Flood were automatically canceled and
retired.
As a result of our corporate reorganization, each stockholder of Neptune Flood became a stockholder of
Neptune Holdings, holding the same proportional ownership and voting power as of immediately prior to our
corporate reorganization, and Neptune Flood became a direct, wholly-owned subsidiary of Neptune Holdings. The
certificate of incorporation and bylaws of Neptune Holdings were amended and restated to be substantially identical
to those of Neptune Flood as of immediately prior to our corporate reorganization. The corporate reorganization was
accounted for as a transaction between entities under common control, and accordingly, there was no change in the
basis of the underlying assets and liabilities.
24
Corporate Information
Our principal executive offices are located at 400 6th Street S., Suite 2, St. Petersburg, Florida 33701, and our
telephone number is (727) 202-4815. Our website address is www.neptuneflood.com. Our website and the
information contained therein or connected thereto are not incorporated into this prospectus or the registration
statement of which it forms a part.
Share Repurchase
We intend to purchase from the underwriters 835,561 shares of our Class A common stock at a price per share
equal to the price per share to be paid by the underwriters to the selling stockholders (the “Share Repurchase”). The
underwriters will not receive any compensation for the shares of our Class A common stock being repurchased by
us. We intend to fund the Share Repurchase using a combination of cash on hand and borrowings under our
revolving credit facility.
The closing of the Share Repurchase will be concurrent with the closing of this offering. The completion of the
Share Repurchase is contingent on the satisfaction of customary closing conditions and conditioned upon the
completion of this offering. We cannot assure you that this offering or the Share Repurchase will be consummated.
The Share Repurchase was approved by our board of directors. Any shares of our Class A common stock that
we repurchase in the Share Repurchase will be retired.
The description of and the other information in this prospectus regarding the Share Repurchase is included
solely for informational purposes. Nothing in this prospectus should be construed as an offer to sell, or the
solicitation of an offer to buy, any of our Class A common stock, subject to the Share Repurchase.
Channels for Disclosure of Information
We announce material information to the public through filings with the SEC, the Investor Relations page of
our website located at www.investors.neptuneflood.com, the Newsroom page of our website located at
www.neptuneflood.com/newsroom, press releases, public conference calls, and webcasts.
The information disclosed through these channels could be deemed material. Accordingly, we encourage
investors, the media, and others to monitor these channels and to review the information disclosed through them.
Any updates to the list of disclosure channels we use will be posted to the Investor Relations page of our
website. Information contained on or accessible through any of the foregoing channels is not incorporated by
reference herein.
Implications of Being a Controlled Company
Our Chief Executive Officer and Chairman of our board of directors, Trevor Burgess, beneficially owns
approximately 84.0% of the voting power of our outstanding voting securities (and approximately 84.1% of the
voting power of our outstanding voting securities after giving effect to this offering and the Share Repurchase) and
we are, and as long as Mr. Burgess beneficially owns more than 50% of the voting power of our company, we will
be, a “controlled company” within the meaning of the listing rules of the NYSE. As a result, we qualify for, and rely
on, exemptions from certain corporate governance requirements, and you will not have the same protections as those
afforded to stockholders of companies that are subject to such governance requirements. As a controlled company,
we are permitted to rely on certain exemptions from the NYSE’s corporate governance rules, including:
•Independent Board Requirements: We are not required to have a majority of independent directors on our
board of directors.
•Independent Committees: We are exempt from requirements to have a fully independent nominating and
corporate governance committee, or a fully independent compensation committee.
25
•Governance Oversight: The exemptions may reduce the level of oversight typically provided by
independent directors over management decisions, executive compensation, and director nominations.
Accordingly, we do not currently have a majority independent board of directors or nominating and corporate
governance committee, and nominating and corporate governance functions are managed by our full board of
directors. To the extent and for so long as we rely on these exemptions, you may not have the same protections
afforded to stockholders of companies that are subject to all of these corporate governance requirements. Although
we are not required to do so, we have established a compensation committee composed entirely of independent
directors.
These controlled company exemptions do not modify the independence requirements for our audit committee,
and we satisfy the member independence requirement for the audit committee provided under the NYSE’s listing
standards and SEC rules and regulations. In the event that we cease to be a “controlled company” and our Class A
common stock continues to be listed on the NYSE, we will be required to comply with these provisions within the
applicable transition periods. See “Risk Factors — Risks Relating to this Offering and Ownership of our Common
Stock — We are a ‘controlled company’ within the meaning of the NYSE rules and, as a result, qualify for, and rely
on, exemptions from certain corporate governance requirements that provide protection to the stockholders of
companies that are subject to such corporate governance requirements.” in our Annual Report, incorporated by
reference herein.
Implications of Being an Emerging Growth Company
As a company with less than $1.235 billion in revenues during our last completed fiscal year, we qualify as an
“emerging growth company” as defined in the JOBS Act. For as long as we remain an EGC, we may take advantage
of specified reduced reporting requirements and other burdens that are otherwise applicable generally to public
companies. These reduced reporting requirements include, but are not limited to:
•an exemption from compliance with the auditor attestation requirement on the effectiveness of our internal
control over financial reporting pursuant to the Sarbanes-Oxley Act;
•an exemption from compliance with any requirement that the Public Company Accounting Oversight
Board may adopt regarding a supplement to the auditor’s report providing additional information about the
audit and the financial statements;
•reduced disclosure about our executive compensation arrangements in our periodic reports, registration
statements, and proxy statements;
•an exemption from the requirements to obtain nonbinding advisory votes on executive compensation (“Say-
on-Pay”) or stockholder approval of any golden parachute arrangements; and
•extended transition periods for complying with new or revised accounting standards.
We will remain an EGC until the earliest to occur of: (i) the end of the first fiscal year in which our annual gross
revenues are $1.235 billion or more; (ii) the end of the first fiscal year in which we are deemed to be a “large
accelerated filer,” as defined in the Exchange Act; (iii) the date on which we have, during the previous three-year
period, issued more than $1.0 billion in non-convertible debt securities; and (iv) the last day of the fiscal year ending
after the fifth anniversary of the completion of the IPO. We may choose to take advantage of some, but not all, of
the available benefits under the JOBS Act. We are electing to use the extended transition periods available under the
JOBS Act for complying with new or revised accounting standards, and we currently intend to take advantage of the
other exemptions discussed above. Accordingly, the information contained herein may be different from the
information you receive from other public companies in which you hold stock.
26
The Offering
Class A common stock offered by the selling stockholders ................................................ | 8,355,615 shares | |
Underwriters’ option to purchase additional shares of Class A common stock offered by the selling stockholders ......................... | The underwriters have a 30-day option to purchase up to an additional 1,253,342 shares of Class A common stock from the selling stockholders at the public offering price set forth on the cover of this prospectus, less underwriting discounts and commissions. | |
Share Repurchase ........................................... | We intend to purchase from the underwriters 835,561 shares of our Class A common stock at a price per share equal to the price per share to be paid by the underwriters to the selling stockholders. We intend to fund the Share Repurchase using a combination of cash on hand and borrowings under our revolving credit facility. The closing of the Share Repurchase will be concurrent with the closing of this offering. The repurchased shares of Class A common stock will no longer be outstanding after this offering. The completion of the Share Repurchase is contingent on the satisfaction of customary closing conditions and conditioned upon the completion of this offering. We cannot assure you that this offering or the Share Repurchase will be consummated. See “— Share Repurchase.” | |
Class A common stock to be outstanding after this offering and the Share Repurchase .................................................. | 94,032,765 shares | |
Class B common stock to be outstanding after this offering and the Share Repurchase .................................................. | 43,435,000 shares | |
Total Class A common stock and Class B common stock to be outstanding after this offering and the Share Repurchase ............. | 137,467,765 shares | |
Use of proceeds .............................................. | We will not receive any proceeds from the sale of Class A common stock by the selling stockholders in this offering. See “Use of Proceeds.” | |
Controlled company ....................................... | We are a “controlled company” within the meaning of the applicable listing rules of the NYSE. See “Prospectus Summary — Implications of Being a Controlled Company.” | |
Voting rights ................................................... | We have two authorized classes of voting common stock, Class A common stock and Class B common stock. Each share of Class A common stock is entitled to one vote per share and each share of Class B common stock is entitled to ten votes per share. | |
27
Holders of Class A common stock and Class B common stock vote together as a single class on all matters (including the election of directors) submitted to a vote of stockholders, unless otherwise required by law or specified in our amended and restated certificate of incorporation. Our Chief Executive Officer and Chairman of our board of directors, Mr. Burgess, beneficially owns all of the outstanding shares of Class B common stock and collectively beneficially owns approximately 84.0% of the total combined voting power of our outstanding common stock (and approximately 84.1% of the total combined voting power of our outstanding common stock after giving effect to this offering and the Share Repurchase). As a result, current and future holders of the outstanding shares of Class B common stock will have the ability to control the outcome of matters submitted to our stockholders for approval, including the election of our directors and the approval of any change of control transaction. See “Description of Capital Stock — Class A Common Stock and Class B Common Stock — Voting Rights” for more information. | ||
Conversion and related rights ......................... | Our Class A common stock is not convertible into any other class of shares. | |
Our Class B common stock is convertible into shares of our Class A common stock on a one-for-one basis at the option of the holder. In addition, each share of Class B common stock will automatically convert into one share of Class A common stock upon the occurrence of certain events described in “Description of Capital Stock — Class A Common Stock and Class B Common Stock — Conversion.” | ||
Dividend policy .............................................. | We currently anticipate that we will retain our future earnings to repay debt and to finance the operation and expansion of our business and do not anticipate declaring or paying any cash dividends on our capital stock in the foreseeable future. Therefore, there can be no assurance that we will pay any dividends to holders of our common stock, or as to the amount of any such dividends. Any future determination to pay dividends on our common stock will be at the discretion of our board of directors and will depend upon, among other factors, our financial condition, operating results, earnings, current and anticipated liquidity and capital requirements, plans for expansion, level of indebtedness, contractual restrictions with respect to payment of dividends, restrictions imposed by Delaware law, general business conditions, and any other factors that our board of directors deems relevant in making such a determination. See “Dividend Policy.” | |
Risk factors ..................................................... | Investing in our Class A common stock involves a high degree of risk. See the sections titled “Risk Factors” beginning on page 35 of this prospectus, and in our Annual Report and our Q1 Quarterly Report, respectively, each incorporated by reference herein, and other information included in this prospectus for a discussion of factors that you should consider carefully before deciding to invest in our Class A common stock. | |
NYSE ticker symbol ...................................... | “NP” |
The number of shares of our Class A common stock and Class B common stock to be outstanding after this
offering and the Share Repurchase is based on 138,303,326 shares of our common stock outstanding on March 31,
2026, consisting of 94,868,326 shares of our Class A common stock and 43,435,000 shares of our Class B common
stock, and excludes:
•8,588,904 shares of our Class A common stock issuable upon the exercise of outstanding vested stock
options granted under our Amended and Restated 2025 Stock Plan, with a weighted average exercise price
of $5.80 per share;
28
•4,177,488 shares of our Class A common stock issuable upon settlement of certain restricted stock units
granted under our 2025 Equity Incentive Plan;
•1,945,845 shares of our Class A common stock reserved for future issuance under our 2025 Equity
Incentive Plan;
•1,484,444 shares of our Class A common stock reserved for future issuance under our 2025 Employee
Stock Purchase Plan.
Mr. Burgess also has a right (but not an obligation) to require us to exchange any of the 8,142,964 shares of our
Class A common stock that may be received by Mr. Burgess upon the exercise, vesting, and/or settlement of certain
equity awards held by Mr. Burgess, consisting of (i) 6,160,000 shares of our Class A common stock issuable upon
the exercise of outstanding stock options held by Mr. Burgess, and (ii) 1,982,964 shares of Class A common stock
issuable upon the vesting and settlement of certain restricted stock units held by Mr. Burgess, in each case for an
equivalent number of shares of Class B common stock.
Unless otherwise indicated, all information contained in this prospectus, including the number of shares of our
Class A common stock that will be outstanding after this offering and the Share Repurchase, assumes no exercise by
the underwriters of their option to purchase up to 1,253,342 additional shares of our Class A common stock from the
selling stockholders.
29
Summary Consolidated Financial Data
The following tables summarize certain of our consolidated financial data. The summary consolidated
statements of operations data presented on a quarterly basis for the first quarter of 2025 through the first quarter of
2026, and on a trailing twelve-month basis for the twelve months ended March 31, 2025 and 2026, have been
derived from our audited consolidated financial statements and related notes thereto included in our Annual Report
and our unaudited interim condensed consolidated financial statements and related notes thereto included in our Q1
Quarterly Report, each incorporated by reference herein. The tables also include certain non-GAAP financial
measures, including adjusted net income, adjusted EBITDA, and adjusted EBITDA margin. These non-GAAP
financial measures are not prepared in accordance with GAAP and should not be considered as alternatives to net
income or any other measure of financial performance calculated and presented in accordance with GAAP. For a
reconciliation of these non-GAAP financial measures to the most directly comparable GAAP measures, see
“Reconciliation of Non-GAAP Financial Measures” below. You should read the following summary consolidated
financial data in conjunction with “Management's Discussion and Analysis of Financial Condition and Results of
Operations” and our audited consolidated financial statements and related notes thereto in our Annual Report, and
our unaudited interim consolidated financial statements and related notes thereto in our Q1 Quarterly Report, each
incorporated by reference herein. Our historical results are not necessarily indicative of the results to be expected for
any other period in the future.
($ in thousands) | Q1 2025 | Q2 2025 | Q3 2025 | Q4 2025 | Q1 2026 | YoY (Q1’26 vs Q1’25)(1) | |||||
Commission income ............. | $22,707 | $32,062 | $33,916 | $33,318 | $29,034 | 27.9% | |||||
Fee income ........................... | 6,646 | 10,004 | 10,449 | 10,449 | 8,761 | 31.8% | |||||
Total revenues .................... | $29,353 | $42,066 | $44,365 | $43,767 | $37,795 | 28.8% | |||||
Agent commissions .............. | $8,940 | $12,736 | $13,840 | $13,549 | $11,352 | 27.0% | |||||
Employee compensation and benefits ............................. | 1,321 | 1,425 | 1,662 | 1,055 | 1,542 | 16.7% | |||||
General and administrative .. | 1,976 | 2,657 | 2,138 | 3,252 | 3,580 | 81.2% | |||||
Share-based compensation ... | 84 | 103 | 111 | 11,121 | 6,876 | NM | |||||
IPO transaction costs ............ | 531 | 2,943 | 4,966 | 473 | — | NM | |||||
Amortization expense ........... | 874 | 912 | 948 | 979 | 1,004 | 14.9% | |||||
Total operating expenses .. | $13,726 | $20,776 | $23,665 | $30,429 | $24,354 | 77.4% | |||||
Net income .......................... | $9,939 | $11,620 | $11,511 | $4,343 | $7,349 | (26.1)% | |||||
Adjusted net income ............ | $11,044 | $14,556 | $15,997 | $15,335 | $13,410 | 21.4% | |||||
Adjusted EBITDA ............. | $17,116 | $25,249 | $26,725 | $25,911 | $21,566 | 26.0% | |||||
Net income margin ............... | 33.9% | 27.6% | 25.9% | 9.9% | 19.4% | (14.4) pp | |||||
Adjusted EBITDA margin | 58.3% | 60.0% | 60.2% | 59.2% | 57.1% | (1.3) pp |
___________________
(1)Year-over-year changes in percentages are reported in percentage points (pp).
30
Twelve Months Ended March 31, | |||||
($ in thousands) | 2025 | 2026 | YoY ('26 vs '25) | ||
Commission income ....................................................................... | $96,601 | $128,330 | 32.8% | ||
Fee income ..................................................................................... | 30,485 | 39,663 | 30.1% | ||
Total revenues .............................................................................. | $127,086 | $167,993 | 32.2% | ||
Agent commissions ....................................................................................................... | 37,746 | 51,477 | 36.4% | ||
Employee compensation and benefits ............................................................... | 4,656 | 5,683 | 22.1% | ||
General and administrative ....................................................................................... | 8,100 | 11,627 | 43.5% | ||
Share-based compensation ........................................................................................ | 309 | 18,212 | NM | ||
IPO transaction costs ...................................................................... | 531 | 8,382 | NM | ||
Amortization expense .................................................................................................. | 3,213 | 3,843 | 19.6% | ||
Total Operating Expenses .......................................................... | $54,555 | $99,224 | 81.9% | ||
Net income .................................................................................... | $39,917 | $34,823 | (12.8)% | ||
Adjusted net income ...................................................................... | $47,222 | $59,298 | 25.6 % | ||
Adjusted EBITDA ....................................................................... | $76,914 | $99,451 | 29.3 % | ||
31
Key Performance Indicators
Neptune’s management regularly reviews certain KPIs, including the following key metrics, to evaluate our
business and operations, guide decision-making, and measure progress. We utilize a variety of operational metrics to
understand growth, retention, and ultimately drive profitability. For definitions of these KPIs, see “Management’s
Discussion and Analysis of Financial Condition and Results of Operations — Non-GAAP Financial Measures” in
our Q1 Quarterly Report, incorporated by reference herein.
The table below compares certain of our KPIs as of and for the three months ended March 31, 2026 and 2025,
respectively, and our revenue retention rate for the twelve months ended March 31, 2026 and 2025, respectively:
Three Months Ended March 31, | Change | |||||
(in thousands) | 2026 | 2025 | %/pp | |||
Premium in force (period-end) ...................................................... | $388,745 | $295,175 | 31.7% | |||
Policies in force (period-end) ........................................................ | 295,029 | 230,627 | 27.9% | |||
Policy retention rate(1) ................................................................... | 86.2% | 85.7% | 0.5 | |||
Premium retention rate(1) ............................................................... | 92.9% | 98.2% | (5.3) | |||
Revenue retention rate(1)(2) ............................................................ | 90.0% | 91.8% | (1.8) | |||
Written premium ........................................................................... | $86,574 | $68,751 | 25.9% | |||
__________________
(1)Year-over-year changes in percentages are reported in percentage points (pp).
(2)These rates are last twelve-month metrics.
The table below compares certain of our per-employee KPIs for the twelve months ended March 31, 2026 and
2025:
Twelve Months Ended March 31, | Change | |||||||
($ in thousands) | 2026 | 2025 | Amount | Percentage | ||||
Average number of employees .......................... | 59.9 | 53.2 | 6.7 | 12.6% | ||||
Total revenues .................................................... | $167,993 | $127,086 | $40,907 | 32.2% | ||||
Revenue per employee ....................................... | $2,804 | $2,389 | $415 | 17.3% | ||||
Adjusted EBITDA ............................................. | $99,451 | $76,914 | $22,537 | 29.3% | ||||
Adjusted EBITDA per employee ....................... | $1,660 | $1,446 | $214 | 14.8% | ||||
32
Reconciliation of Non-GAAP Financial Measures
This prospectus includes certain non-GAAP financial measures, including Adjusted EBITDA, Adjusted
EBITDA margin, and Adjusted net income. These non-GAAP financial measures are not prepared in accordance
with GAAP and should not be considered as alternatives to net income or any other measure of financial
performance calculated and presented in accordance with GAAP. For definitions of these non-GAAP measures and
information about how and why we use these measures, see “Management’s Discussion and Analysis of Financial
Condition and Results of Operations — Non-GAAP Financial Measures” in our Q1 Quarterly Report, incorporated
by reference herein. See below for reconciliations of these non-GAAP financial measures to their most directly
comparable measures reported under GAAP.
Adjusted EBITDA and Adjusted EBITDA Margin
Below is a reconciliation of Adjusted EBITDA to net income (the most directly comparable GAAP measure), as
well as of Adjusted EBITDA margin to net income margin (the most directly comparable GAAP measure), for each
of the three and twelve months ended March 31, 2026 and 2025.
Three Months Ended March 31, | Twelve Months Ended March 31, | ||||||||||
($ in thousands) | 2025 | 2026 | Change %/PP | 2025 | 2026 | Change %/PP | |||||
Total revenues ................. | $29,353 | $37,795 | 28.8% | $127,086 | $167,993 | 32.2% | |||||
Net income ........................ | $9,939 | $7,349 | (26.1)% | $39,917 | $34,823 | (12.8)% | |||||
Interest expense (net of interest income) ......... | $2,232 | $3,366 | 50.8% | $13,522 | $18,454 | 36.5% | |||||
Income tax expense ...... | $3,456 | $2,726 | (21.1)% | $13,666 | $15,492 | 13.4% | |||||
Loss on extinguishment of debt ....................... | $— | $— | NM | $5,426 | $— | NM | |||||
Amortization expense ... | $874 | $1,004 | 14.9% | $3,213 | $3,843 | 19.6% | |||||
Share-based compensation ............ | $84 | $6,912 | NM | $309 | $18,248 | NM | |||||
Corporate transaction related expenses ........ | $531 | $176 | NM | $631 | $8,558 | NM | |||||
One-time Expenses ....... | $— | $33 | NM | $230 | $33 | NM | |||||
Adjusted EBITDA .......... | $17,116 | $21,566 | 26.0% | $76,914 | $99,451 | 29.3% | |||||
Net income margin ............ | 33.9% | 19.4% | (14.5) | 31.4% | 20.7% | (10.7)% | |||||
Adjusted EBITDA margin .......................... | 58.3% | 57.1% | (1.2) | 60.5% | 59.2% | (1.3)% | |||||
Adjusted EBITDA was $21.6 million for the three months ended March 31, 2026, an increase of $4.5 million,
or 26.0%, from $17.1 million for the three months ended March 31, 2025. Our Adjusted EBITDA margin for the
three months ended March 31, 2026, was 57.1%, a decrease from 58.3% for the three months ended March 31, 2025.
This decrease was primarily due to the incurrence of certain public company-related expenses, including audit costs,
which were concentrated in the first quarter.
Adjusted EBITDA was $99.5 million for the twelve months ended March 31, 2026, an increase of $22.5
million, or 29.3%, from $76.9 million for the twelve months ended March 31, 2025. Our Adjusted EBITDA margin
for the twelve months ended March 31, 2026, was 59.2%, a decrease from 60.5% for the twelve months ended
March 31, 2025.
While our revenue and Adjusted EBITDA grew 32.2% and 29.3%, respectively, for the twelve months ended
March 31, 2026, from the twelve months ended March 31, 2025, our headcount increased by only around 12.6%
over the same period. The accelerated growth in revenue and Adjusted EBITDA relative to our growth in employees
illustrates the scalability of our existing platform and emphasis on efficient growth.
33
Adjusted Net Income
The table below presents a reconciliation of Adjusted Net Income to net income (the most directly comparable
GAAP measure), for each of the three and twelve months ended March 31, 2026 and 2025.
Three Months Ended March 31, | Twelve Months Ended March 31, | ||||||||||
(In thousands, except share and per share data) | 2025 | 2026 | Change % | 2025 | 2026 | Change % | |||||
Net income ........................................... | $9,939 | $7,349 | (26.1)% | 39,917 | 34,823 | (12.8)% | |||||
Income tax expense ........................ | 3,456 | 2,726 | (21.1)% | 13,666 | 15,492 | 13.4% | |||||
Loss on extinguishment of debt ..... | — | — | NM | 5,426 | — | NM | |||||
Amortization expense .................... | 874 | 1,004 | 14.9% | 3,213 | 3,843 | 19.6% | |||||
Share-based compensation ............. | 84 | 6,912 | NM | 309 | 18,248 | NM | |||||
Corporate transaction related expenses ....................................... | 531 | 176 | NM | 631 | 8,558 | NM | |||||
One-time expenses ......................... | — | 33 | NM | 230 | 33 | NM | |||||
Adjusted Income before income tax expense ........................................ | 14,884 | 18,200 | 22.3% | 63,392 | 80,997 | 27.8% | |||||
Adjusted income taxes (1) ............. | (3,841) | (4,790) | 24.7% | (16,170) | (21,700) | 34.2% | |||||
Adjusted net income ............... | $11,044 | $13,410 | 21.4% | 47,222 | 59,297 | 25.6% | |||||
__________________
(1)This represents the tax impact using effective tax rates of 27.1% and 25.8% for the three months ended March 31, 2026 and 2025,
respectively, and the tax impact using effective tax rates of 26.8% and 25.5% for the twelve months ended March 31, 2026 and 2025. These
tax rates exclude items that are non-deductible/non-taxable or subject to a specific tax treatment.
Quarterly Reconciliation
Adjusted EBITDA and Adjusted EBITDA Margin
The table below presents a reconciliation of Adjusted EBITDA and Adjusted EBITDA margin to net income
and net income margin, respectively (the most directly comparable GAAP measure) for each of the quarterly periods
presented.
Three months ended | ||||||||||
March 31, | June 30, | September 30, | December 31, | March 31, | ||||||
(In thousands) | 2025 | 2025 | 2025 | 2025 | 2026 | |||||
Total revenues ............................................................................ | $29,353 | $42,066 | $44,365 | $43,767 | $37,795 | |||||
Net income ................................................................................... | $9,939 | $11,620 | $11,511 | $4,343 | $7,349 | |||||
Interest expense (net of interest income) ...................................... | 2,232 | 5,621 | 5,237 | 4,230 | 3,366 | |||||
Income tax expense ...................................................................... | 3,456 | 4,049 | 3,952 | 4,765 | 2,726 | |||||
Loss on extinguishment of debt ................................................... | — | — | — | — | — | |||||
Amortization expense ................................................................... | 874 | 912 | 948 | 979 | 1,004 | |||||
Share-based compensation ........................................................... | 84 | — | 111 | 11,121 | 6,912 | |||||
Corporate transaction related ....................................................... | 531 | 2,943 | 4,966 | 473 | 176 | |||||
One-time expenses ....................................................................... | — | — | — | — | 33 | |||||
Adjusted EBITDA ..................................................................... | $17,116 | $25,249 | $26,725 | $25,911 | $21,566 | |||||
Net income margin ....................................................................... | 33.9% | 27.6% | 25.9% | 9.9% | 19.4% | |||||
Adjusted EBITDA margin ........................................................ | 58.3% | 60.0% | 60.2% | 59.2% | 57.1% | |||||
34
Adjusted Net Income
The table below presents a reconciliation of Adjusted net income to net income (the most directly comparable
GAAP measure) for each of the quarterly periods presented.
March 31, | June 30, | September 30, | December 31, | March 31, | |||||
(In thousands, except share and per share data) | 2025 | 2025 | 2025 | 2025 | 2026 | ||||
Net income ............................................ | $9,939 | $11,620 | $11,511 | $4,343 | $7,349 | ||||
Income tax expense ................................. | 3,456 | 4,049 | 3,952 | 4,765 | 2,726 | ||||
Loss on extinguishment of debt .............. | — | — | — | — | — | ||||
Amortization expense ............................. | 874 | 912 | 948 | 979 | 1,004 | ||||
Share-based compensation ...................... | 84 | 104 | 111 | 11,121 | 6,912 | ||||
Corporate transaction related expenses ... | 531 | 2,943 | 4,966 | 473 | 176 | ||||
One-time expenses .................................. | — | — | — | — | 33 | ||||
Adjusted Income before income tax expense ................................................ | $14,884 | $19,628 | $21,488 | $21,681 | $18,200 | ||||
Adjusted income taxes (1) ........................ | $(3,840) | $(5,072) | $(5,492) | $(6,346) | $(4,790) | ||||
Adjusted net income ............................. | $11,044 | $14,556 | $15,997 | $15,335 | $13,410 |
35
RISK FACTORS
Investing in our Class A common stock involves risk. The occurrence of any of the events or developments
described below and included in the documents incorporated by reference herein could materially and adversely
affect our business, financial condition, results of operations, and growth prospects. In such an event, the market
price of our Class A common stock could decline, and you may lose all or part of your investment. You should
consider carefully all of the information set forth in this prospectus and the documents incorporated by reference
herein, and, in particular, the risk factors described in our Annual Report and our Q1 Quarterly Report, each
incorporated by reference herein. Additional risks and uncertainties not presently known to us or that we currently
believe are not material may also impair our business, financial condition, results of operations, and growth
prospects.
Risks Relating to this Offering and Ownership of our Common Stock
We are a “controlled company” within the meaning of the NYSE rules and, as a result, qualify for, and rely on,
exemptions from certain corporate governance requirements that provide protection to the stockholders of
companies that are subject to such corporate governance requirements.
We are a “controlled company” as defined under the NYSE corporate governance rules because Mr. Burgess
holds more than 50% of the voting power of our outstanding capital stock. As a result, we qualify for, and have
chosen to rely on, exemptions from certain corporate governance requirements, including the requirements that a
majority of our board of directors consist of independent directors, that we have a fully independent nominating and
corporate governance committee, and that we have a fully independent compensation committee. While we believe
that our governance structure and the composition of our board of directors serves the best interests of Neptune and
its stockholders, reliance on these exemptions means that minority stockholders may have limited influence over
corporate governance matters. This could result in decisions that favor the interests of our controlling stockholder at
the expense of other stockholders. The implications of being a controlled company could materially and adversely
affect the perception of our corporate governance practices, stockholder confidence, and the market value of our
common stock. See “Prospectus Summary— Implications of Being a Controlled Company.”
The dual class structure of our common stock has the effect of concentrating voting control with our Chief
Executive Officer; this will limit or preclude your ability to influence corporate matters.
Our Class B common stock has ten votes per share, and our Class A common stock has one vote per share. Our
Chief Executive Officer and Chairman of our board of directors, Mr. Burgess, beneficially owns all of our
outstanding shares of Class B common stock, constituting approximately 84.0% of the voting power of our
outstanding capital stock as of March 31, 2026. In addition, we and Mr. Burgess are party to an equity exchange
right agreement (the “Class B Equity Exchange Agreement”), which gives Mr. Burgess a right (but not an
obligation) to require us to exchange any shares of Class A common stock received by Mr. Burgess upon the
exercise, vesting, and/or settlement of certain equity awards held by Mr. Burgess for an equivalent number of shares
of Class B common stock. If Mr. Burgess exercises his rights under the Class B Equity Exchange Agreement with
respect to all equity awards subject to such agreement as of March 31, 2026, Mr. Burgess will have approximately
84.5% of the voting power of our outstanding capital stock. Because of the ten-to-one voting ratio between our Class
B common stock and Class A common stock, Mr. Burgess controls, and will continue to control, a majority of the
combined voting power of our common stock and therefore is able to control all matters submitted to our
stockholders for approval so long as the shares of Class B common stock represent approximately at least 9.1% of
all outstanding shares of our Class A common stock and Class B common stock. Mr. Burgess may have conflicting
interests with holders of shares of our Class A common stock. Mr. Burgess’ concentrated control will limit or
preclude your ability to influence corporate matters for the foreseeable future. For example, during such period of
time, Mr. Burgess will have significant influence with respect to our management, business plans, and policies,
including the appointment and removal of our officers, decisions on whether to raise future capital, and whether to
amend our charter and bylaws, which govern the rights attached to our common stock. In particular, for so long as
Mr. Burgess continues to own a significant percentage of our common stock, Mr. Burgess will be able to cause or
prevent a change of control of Neptune or a change in the composition of our board of directors and could preclude
any unsolicited acquisition of us. The concentration of ownership could deprive you of an opportunity to receive a
36
premium for your shares of Class A common stock as part of a sale of us and ultimately might affect the market
price of our Class A common stock.
Each outstanding share of Class B common stock is convertible at any time at the option of the holder into one
share of Class A common stock. In addition, each share of Class B common stock will convert automatically into
one share of Class A common stock upon any transfer, whether or not for value, except for certain permitted
transfers, as further described in our amended and restated certificate of incorporation. In addition, each share of
Class B common stock will convert automatically into one share of Class A common stock upon the earlier of (i)
twelve months following the death or disability of Mr. Burgess or (ii) upon the first trading day on or after such date
that the outstanding shares of Class B common stock represent less than 5% of the then-outstanding Class A and
Class B common stock, which, in either instance, may be extended to 18 months upon affirmative approval of a
majority of our independent directors. The conversion of Class B common stock to Class A common stock will have
the effect, over time, of increasing the relative voting power of the remaining outstanding shares of Class B common
stock.
Our stock price may be volatile, and the value of our Class A common stock may decline.
The market price of our Class A common stock may be highly volatile and may fluctuate or decline
substantially as a result of a variety of factors, some of which are beyond our control, including:
•actual or anticipated fluctuations in our financial condition or results of operations;
•failure of securities analysts to initiate or maintain coverage of our company, changes in financial estimates
or ratings by any securities analysts who follow our company, or our failure to meet these estimates or the
expectations of investors;
•changes in operating performance and stock market valuations of insurance companies or technology
companies in general;
•changes in laws or regulations applicable to our business;
•announcements by us or our competitors of significant business developments, acquisitions, or new
offerings;
•significant data breaches, disruptions to, or other incidents involving our business;
•lawsuits threatened or filed against us;
•sales of large blocks of our Class A common stock, including sales by our executive officers and directors;
•price and volume fluctuations in the overall stock market;
•changes in senior management or key personnel;
•changes in our capital structure, such as future issuances of securities or the incurrence of additional debt;
short sales, hedging, and other derivative transactions involving our capital stock;
•changes in the anticipated future size and growth rate of our market; and
•general economic and market conditions.
In addition, stock markets have experienced extreme price and volume fluctuations that have affected and
continue to affect the market prices of equity securities of many companies. These fluctuations have often been
unrelated or disproportionate to the operating performance of those companies. Broad market and industry
fluctuations, as well as general economic, political, regulatory, and market conditions, such as recessions, interest
rate changes, or international currency fluctuations, may also negatively impact the market price of our Class A
common stock. In the past, companies that have experienced volatility in the market price of their securities have
37
been subject to securities class action litigation. We may be the target of this type of litigation in the future, which
could result in substantial expenses and divert our management’s attention.
Some provisions of Delaware law and our amended and restated certificate of incorporation and amended and
restated bylaws may deter third parties from acquiring us and diminish the value of our Class A common stock.
Our amended and restated certificate of incorporation and our amended and restated bylaws contain provisions
that could delay or prevent a change in control of our company. These provisions could also make it difficult for
stockholders to elect directors who are not nominated by current members of our board of directors or take other
corporate actions, including effecting changes in our management. These provisions:
•establish a classified board of directors so that not all members of our board of directors are elected at one
time;
•permit only the board of directors to establish the number of directors and fill vacancies on the board;
•provide that directors may only be removed “for cause” and only with the approval of two-thirds of our
stockholders;
•following the first date after the date on which the outstanding shares of our Class B common stock
represent less than a majority of the combined voting power of our then-outstanding Class A common stock
and Class B common stock entitled to vote generally in the election of directors (the “Voting Threshold
Date”), require super-majority voting to amend some provisions in our amended and restated certificate of
incorporation and amended and restated bylaws;
•authorize the issuance of “blank check” preferred stock that our board of directors could use to implement a
stockholder rights plan;
•prohibit cumulative voting;
•following the Voting Threshold Date, provide that our stockholders will only be able to take action at a
meeting of stockholders and not by written consent;
•provide that only the chairperson of our board of directors, the chief executive officer, or our board of
directors acting pursuant to a resolution adopted by a majority of the whole board of directors will be
authorized to call a special meeting of stockholders; and
•establish advance notice requirements for nominations for election to our board of directors or for
proposing matters that can be acted upon by stockholders at annual stockholder meetings.
These and other provisions in our amended and restated certificate of incorporation, our amended and restated
bylaws, and Delaware law could make it more difficult for stockholders or potential acquirers to obtain control of
our board of directors or initiate actions that are opposed by our then-current board of directors, including actions to
delay or impede a merger, tender offer, or proxy contest involving Neptune. The existence of these provisions could
negatively affect the price of our Class A common stock and limit opportunities for you to realize value in a
corporate transaction.
In addition, until the Voting Threshold Date, we have opted out of Section 203 of the DGCL, which prohibits a
publicly held Delaware corporation from engaging in a business combination transaction with an interested
stockholder for a period of three years after the interested stockholder became such unless the transaction fits within
an applicable exemption, such as board approval of the business combination or the transaction which resulted in
such stockholder becoming an interested stockholder.
38
Our certificate of incorporation designates the Court of Chancery of the State of Delaware as the exclusive forum
for certain litigation that may be initiated by our stockholders and the federal district courts of the U.S. as the
exclusive forum for litigation arising under the Securities Act, which could limit our stockholders’ ability to
obtain a favorable judicial forum for disputes with us.
Our amended and restated certificate of incorporation provides that the Court of Chancery of the State of
Delaware is the exclusive forum (or, if, and only if, the Court of Chancery of the State of Delaware lacks subject
matter jurisdiction, any state court located within the State of Delaware or, if, and only if, all such state courts lack
subject matter jurisdiction, the federal district court for the District of Delaware) for the following types of actions or
proceedings under Delaware statutory or common law: any derivative action, suit, or proceeding brought on our
behalf; any action, suit, or proceeding asserting a breach of a fiduciary duty; any action, suit, or proceeding asserting
a claim against us arising pursuant to the DGCL, our amended and restated certificate of incorporation, or bylaws;
any action, suit, or proceeding as to which the DGCL confers jurisdiction; or any action, suit, or proceeding
asserting a claim against us that is governed by the internal affairs doctrine. The provisions would not apply to suits
brought to enforce a duty or liability created by the Securities Act, the Exchange Act, or any other claim for which
the U.S. federal courts have exclusive jurisdiction. Furthermore, Section 22 of the Securities Act creates concurrent
jurisdiction for federal and state courts over all such Securities Act actions. Accordingly, both state and federal
courts have jurisdiction to entertain such claims. To prevent having to litigate claims in multiple jurisdictions and the
threat of inconsistent or contrary rulings by different courts, among other considerations, our amended and restated
certificate of incorporation provides that the federal district courts of the United States of America will be the
exclusive forum for resolving any complaint asserting a cause of action arising under the Securities Act. Investors
cannot waive compliance with the federal securities laws and the rules and regulations thereunder. Accordingly,
given the provision in Section 22 of the Securities Act for concurrent jurisdiction by federal and state courts, there is
uncertainty as to whether a court would enforce this forum selection provision with respect to claims arising under
the Securities Act.
We believe these provisions may benefit us by providing increased consistency in the application of Delaware
law and federal securities laws by chancellors and judges, as applicable, who are particularly experienced in
resolving corporate disputes, efficient administration of cases on a more expedited schedule relative to other forums
and protection against the burdens of multi-forum litigation. These choice of forum provisions may limit a
stockholder’s ability to bring a claim in a judicial forum that it finds favorable for disputes with us or our directors,
officers, or other employees. While the Delaware courts have determined that such choice of forum provisions are
facially valid, a stockholder may nevertheless seek to bring such a claim arising under the Securities Act against us,
our directors, officers, or other employees in a venue other than in the federal district courts of the United States of
America. In such instance, we would expect to vigorously assert the validity and enforceability of the exclusive
forum provisions of our amended and restated certificate of incorporation. This may require significant additional
costs associated with resolving such action in other jurisdictions, and there can be no assurance that the provisions
will be enforced by a court in those other jurisdictions.
If a substantial number of shares become available for sale and are sold in a short period of time, the market
price of our Class A common stock could decline.
As of March 31, 2026, we had 94,868,326 shares of Class A common stock outstanding, and 12,766,392 shares
of Class A common stock issuable upon exercise of outstanding equity awards or settlement of RSUs.
Certain of our outstanding shares of common stock are deemed “restricted securities,” as that term is defined
under Rule 144 of the Securities Act. In addition, in connection with this offering, we expect the selling
stockholders, our directors and executive officers, and certain other holders of our common stock to enter into lock-
up agreements with the underwriters restricting the sale of their shares for 90 days following the date of this
prospectus, subject to certain exceptions.
Following the expiration of these lock-up restrictions, such shares will be eligible for sale in the public market,
subject to compliance with Rule 144 under the Securities Act. Sales under Rule 144 by our affiliates or persons
selling shares on behalf of our affiliates are subject to certain manner of sale, volume limitation, and notice
provisions, and to the availability of current public information about us.
39
Further, pursuant to our registration rights agreement, dated October 2, 2025, certain holders of our Class A
common stock can, subject to certain conditions, require us to file registration statements for the public resale of
shares of our Class A common stock or to include such shares in registration statements that we may file for us or
other stockholders. See the section titled “Description of Capital Stock — Registration Rights” in this prospectus for
additional information regarding these registration rights.
Sales of a substantial number of shares of our common stock upon the expiration of the lock-up restrictions
described above or pursuant to the exercise of registration rights, or the perception that such sales may occur, could
cause the market price of our Class A common stock to decline or make it more difficult for you to sell your Class A
common stock at a time and price that you deem appropriate.
We do not intend to pay dividends on our common stock and, consequently, your ability to achieve a return on
your investment will depend on appreciation in the price of our Class A common stock.
While we have paid dividends in the past, we do not currently intend to pay any cash dividends for the
foreseeable future. We expect to retain future earnings, if any, to repay debt and to fund the development and growth
of our business. As a result, you may only receive a return on your investment in our Class A common stock if the
market price of our Class A common stock increases.
40
SPECIAL NOTE REGARDING FORWARD-LOOKING STATEMENTS
This prospectus and the documents incorporated by reference herein contain forward-looking statements. All
statements contained in this prospectus or the documents incorporated by reference herein other than statements of
historical fact, including statements regarding our future results of operations, financial position, market size and
opportunity, our business strategy and plans, the factors affecting our performance and our objectives for future
operations, are forward-looking statements. The words “believe,” “may,” “will,” “estimate,” “continue,”
“anticipate,” “intend,” “could,” “would,” “expect,” “objective,” “plan,” “potential,” “seek,” “grow,” “target,” “if”
and similar expressions are intended to identify forward-looking statements. We have based these forward-looking
statements largely on our current expectations and projections about future events and trends that we believe may
affect our financial condition, results of operations, business strategy, short-term and long-term business operations
and objectives and financial needs. These forward-looking statements are subject to a number of risks, uncertainties
and assumptions, including those described in the sections titled “Risk Factors” starting on page 35 and included in
our Annual Report and our Q1 Quarterly Report, respectively, each incorporated by reference herein. Moreover, we
operate in a very competitive and rapidly changing environment. New risks emerge from time to time. It is not
possible for our management to predict all risks, nor can we assess the impact of all factors on our business or the
extent to which any factor, or combination of factors, may cause actual results to differ materially from those
contained in any forward-looking statements we may make. In light of these risks, uncertainties and assumptions,
the future events and trends discussed in this prospectus may not occur and actual results could differ materially and
adversely from those anticipated or implied in the forward-looking statements. Forward-looking statements
contained in this prospectus include, but are not limited to, statements about:
•our ability to protect and enforce our intellectual property;
•our ability to effectively manage and sustain our rapid growth, which may place significant demands on our
resources, systems and personnel;
•adverse NFIP developments that create challenges for private insurers;
•the impact of slower housing market activity, especially in areas needing flood coverage, due to various
general economic and other factors;
•our ability to attract and retain talent, including highly skilled engineers, data scientists, and other technical
professionals;
•our reliance on third parties for critical functions such as processing policyholder payments and mailing
policy documents and notices;
•the highly competitive industry in which we operate;
•our reliance on the accuracy and performance of our AI-powered Triton platform, for underwriting and data
modeling;
•developments and projections relating to advancements in AI, our competitors, and our industry;
•our ability to successfully launch additional products or expand our product offerings, including into new
domestic and international markets;
•our ability to apply technology effectively in driving value for our policyholders through technology-based
solutions;
•the impact of current and future laws and regulations, especially those related to insurance regulations;
•potential cybersecurity risks with respect to our or our vendors’ information processing systems;
•the continued development and liquidity of a market for our common stock; and
•other risks and uncertainties, including those listed under the caption “Risk Factors.”
41
We caution you that the foregoing list may not contain all of the forward-looking statements made in this
prospectus.
You should not rely upon forward-looking statements as predictions of future events. The events and
circumstances reflected in the forward-looking statements may not be achieved or occur. Although we believe that
the expectations reflected in the forward-looking statements are reasonable, we cannot guarantee future results,
levels of activity, performance or achievements. All written and oral forward-looking statements attributable to us,
or persons acting on our behalf, are expressly qualified in their entirety by these cautionary statements as well as
other cautionary statements that are made from time to time in our other SEC filings and public communications.
You should evaluate all forward-looking statements made in this prospectus in the context of these risks and
uncertainties. The forward-looking statements included in this prospectus are made only as of the date hereof.
Except as required by law, we do not intend to update any of these forward-looking statements after the date of this
prospectus or to conform these statements to actual results or revised expectations.
You should read this prospectus and the documents that we reference in this prospectus and have filed with the
SEC as exhibits to the registration statement of which this prospectus is a part with the understanding that our actual
future results, levels of activity, performance and events and circumstances may be materially different from what
we expect.
42
USE OF PROCEEDS
We will not receive any proceeds from the sale of our Class A common stock by the selling stockholders in this
offering (including any proceeds from the sale of our Class A common stock that such selling stockholders may sell
pursuant to the underwriters’ option to purchase additional shares of our Class A common stock). The selling
stockholders will receive all of the proceeds from the sale of shares of our Class A common stock by such selling
stockholders. The selling stockholders have agreed to reimburse us for certain of our expenses relating to this
offering in excess of $75,000.
43
DIVIDEND POLICY
While we have paid dividends in the past, we do not currently intend to pay any cash dividends on our common
stock and we currently expect to retain any future earnings, if any, to repay debt and to fund the development and
growth of our business. Any future determination to pay dividends on our common stock will be at the discretion of
our board of directors and will depend upon, among other factors, our financial condition, operating results,
earnings, current and anticipated liquidity and capital requirements, plans for expansion, level of indebtedness,
contractual restrictions with respect to payment of dividends, restrictions imposed by Delaware law, general
business conditions, and other factors that our board of directors may deem relevant in making such a determination.
See “Risk Factors — Risks Relating to this Offering and Ownership of our Common Stock— We do not intend to pay
dividends on our common stock and, consequently, your ability to achieve a return on your investment will depend
on appreciation in the price of our Class A common stock.”
44
CAPITALIZATION
The following table sets forth our cash and cash equivalents and our capitalization as of March 31, 2026, on:
•an actual basis; and
•an as adjusted basis to give effect to (i) the sale of shares of our Class A common stock by the selling
stockholders in this offering, and (ii) the Share Repurchase.
The selling stockholders are selling all of the shares of Class A common stock to be sold in this offering. We
will not receive any of the proceeds from the sale of shares of Class A common stock by the selling stockholders,
including any proceeds from the sale of shares of Class A common stock that such selling stockholders may sell
pursuant to the underwriters’ option to purchase additional Class A common stock.
The selling stockholders have agreed to reimburse us for certain of our expenses relating to this offering, in
excess of $75,000.
You should read this information together with the section titled “Management’s Discussion and Analysis of
Financial Condition and Results of Operations” and our audited consolidated financial statements and related notes
thereto in our Annual Report, and our unaudited interim consolidated financial statements and related notes thereto
in our Q1 Quarterly Report, each incorporated by reference herein.
As of March 31, 2026 | ||||
(In thousands, except per share data) | Actual | As Adjusted | ||
Cash and cash equivalents(1) ..................................................................................... | $10,542 | $ | ||
Debt(2) ....................................................................................................................... | 227,000 | |||
Preferred stock, $0.00001 par value per share, 20,000,000 shares authorized and no shares issued and outstanding, actual; 20,000,000 shares authorized and no shares issued and outstanding, as adjusted ........................................................... | — | |||
Stockholders’ equity (deficit): | ||||
Class A common stock, $0.00001 par value per share, 428,422,036 shares authorized and 94,868,326 shares issued and outstanding, actual; 428,422,036 shares authorized and shares issued and outstanding, as adjusted ..... | 1 | |||
Class B common stock, $0.00001 par value per share, 51,577,964 shares authorized and 43,435,000 shares issued and outstanding, actual; 51,577,964 shares authorized and 43,435,000 shares issued and outstanding, as adjusted ..... | — | |||
Accumulated deficit ................................................................................................. | (507,002) | |||
Additional paid-in capital ......................................................................................... | 293,643 | |||
Total stockholders’ deficit ........................................................................................ | (213,358) | |||
Total capitalization ................................................................................................... | $24,184 | $ | ||
__________________
(1)As adjusted cash and cash equivalents, does not reflect reimbursement by the selling stockholders of any portion of the $148,212 in
expenses related to this offering that we incurred and paid prior to March 31, 2026, or any other expenses relating to this offering incurred
and paid, or expected to be incurred and paid, by us after March 31, 2026, or the reimbursement of any portion thereof by the selling
stockholders.
(2)As adjusted debt, does not reflect our payment of $5,000,000 of our outstanding revolving loan balance after March 31, 2026, using cash
generated from our operations.
The number of shares of our Class A common stock and Class B common stock to be outstanding after this
offering and the Share Repurchase is based on 138,303,326 shares of our common stock outstanding on March 31,
2026, consisting of 94,868,326 shares of our Class A common stock and 43,435,000 shares of our Class B common
stock, and excludes:
•8,588,904 shares of our Class A common stock issuable upon the exercise of outstanding vested stock
options granted under our Amended and Restated 2025 Stock Plan, with a weighted average exercise price
of $5.80 per share;
45
•4,177,488 shares of our Class A common stock issuable upon settlement of certain restricted stock units
granted under our 2025 Equity Incentive Plan;
•1,945,845 shares of our Class A common stock reserved for future issuance under our 2025 Equity
Incentive Plan; and
•1,484,444 shares of Class A common stock reserved for future issuance under our 2025 Employee Stock
Purchase Plan.
46
CERTAIN RELATIONSHIPS AND RELATED PARTY TRANSACTIONS
In addition to the compensation arrangements, including employment, termination of employment and change
of control arrangements and indemnification arrangements described in “Executive Compensation” and the
registration rights described in “Description of Capital Stock — Registration Rights,” the following is a description
of each transaction since January 1, 2023, and each currently proposed transaction in which:
•we have been or are to be a participant;
•the amount involved exceeds $120,000; and
•any of our directors, executive officers, or holders of more than 5% of our capital stock, or any immediate
family member of or person sharing the household with any of these individuals, had or will have a direct
or indirect material interest.
Neptune Holdings Corporate Reorganization
On April 10, 2025, we completed an internal corporate reorganization pursuant to which, after giving effect to
the corporate reorganization, Neptune Flood became a direct, wholly-owned subsidiary of Neptune Holdings. See
“Prospectus Summary — Corporate Structure.” As part of our corporate reorganization, each issued and outstanding
share of common stock of Neptune Flood prior to giving effect to the reorganization was converted into one share of
common stock of Neptune Holdings and each issued and outstanding share of convertible preferred stock prior to
giving effect to the reorganization was converted into one share of convertible preferred stock of Neptune Holdings,
in each case on a 1:1 basis. As a result of our corporate reorganization, each stockholder of Neptune Flood became a
stockholder of Neptune Holdings, holding the same proportional equity interests and voting power as of immediately
prior to our corporate reorganization. In connection with our corporate reorganization, Neptune Holdings also
assumed the Amended and Restated 2019 Stock Plan and amended and restated the plan in its entirety in the form of
our Pre-IPO 2025 Plan. The assumption of these agreements did not result in any changes to the terms, conditions,
or fair value of the shares. The other liabilities of Neptune Flood were not assumed by Neptune Holdings in our
corporate reorganization and therefore continue to be obligations of Neptune Flood, and the assets of Neptune Flood
were not transferred to Neptune Holdings and continue to be assets of Neptune Flood.
Pre-IPO Dividend
On April 10, 2025, our Board approved a cash dividend in the aggregate amount of $175 million, payable to
holders of our then outstanding common stock and redeemable, convertible preferred stock of record as of April 10,
2025. The dividend was funded from the proceeds of our expanded credit facility and was paid on April 10, 2025.
Convertible Preferred Stock Financing
On May 10, 2023, Neptune Flood sold an aggregate of 41,850,000 split-adjusted shares of convertible preferred
stock, at a split-adjusted purchase price of $5.495 per share for an aggregate purchase price of $230 million, to BSIV
102. In connection with the IPO, the shares of convertible preferred stock automatically converted into an aggregate
of 41,850,000 shares of Class A common stock. BSIV 102 was a joint venture between Bregal Sagemount and FTV
Capital, each of which beneficially owns more than 5% of our outstanding capital stock. Bregal Sagemount is
affiliated with Blair J. Greenberg and FTV Capital is affiliated with Mike Vostrizansky, members of our board of
directors. BSIV 101, FTV VII, FTV-NE Aggregator and Growth VII-Centre, the distributees of BSIV 102, are
entitled to specified registration rights. For additional detail on registration rights and equity holdings, see
“Description of Capital Stock — Registration Rights” and “Principal and Selling Stockholders,” respectively.
Stock Transfers and Acquisitions
On June 26, 2024, the Ann J Albert 2021 Irrevocable Grantor Trust, the James D Albert 2021 Irrevocable
Grantor Trust FBO Emily Polk Albert Goldman, and the James D Albert 2021 Irrevocable Grantor Trust FBO Laura
Elizabeth Albert Duckworth (together, the “Albert Trusts”), collectively a greater than 5% beneficial owner of our
common stock, sold an aggregate of 4,732,000 split-adjusted shares of our outstanding common stock for a split-
47
adjusted purchase price of $6.84 per share to FTV-NE Aggregator, a greater than 5% beneficial owner of our
common stock, in a private transaction, pursuant to the terms of a stock purchase agreement.
On November 1, 2024, FTV-NE Aggregator transferred 1,461,620 split-adjusted shares of our outstanding
common stock to its affiliated fund, Growth VII-Centre, for $10 million.
Charles River Data
From January 1, 2022, through April 30, 2024, Neptune Flood received consulting services for software
development and data analytics from a Boston-based data science consulting firm, Charles River Data, in which Mr.
Burgess, our Chief Executive Officer and Chairman of our board of directors, held a 20% equity interest. During
the years ended December 31, 2022, 2023, and 2024, Neptune Flood made payments to Charles River Data of
$0.3 million, $0.8 million and $0.4 million, respectively.
In May 2024, Neptune Flood hired all of the employees of Charles River Data through individual employment
arrangements.
Investors’ Rights, Voting, and Right of First Refusal Agreements
In May 2023, in connection with the convertible preferred stock financing, Neptune Flood entered into, and as
part of the corporate reorganization, Neptune Holdings assumed all rights and obligations under, an amended and
restated stockholders agreement, dated as of May 10, 2023, as amended (the “Pre-IPO Stockholders Agreement”)
with BSIV 102 and certain holders of our common stock containing, among other things, certain voting rights, board
designation rights, tag-along and drag-along rights, rights of first refusal, transfer restrictions, equity purchase rights,
and a commitment to enter into a registration rights agreement with BSIV 102 in connection with our initial public
offering. Pursuant to the Pre-IPO Stockholders Agreement, at the closing of the IPO, we entered into a registration
rights agreement (the “registration rights agreement”), with BSIV 101, FTV VII, FTV-NE Aggregator and Growth
VII-Centre, the distributees of BSIV 102. The parties to the Pre-IPO Stockholders Agreement included entities
affiliated with Mr. Burgess, the Albert Trusts, and BSIV. The Pre-IPO Stockholders Agreement terminated upon the
closing of the IPO, except with respect to our obligation to enter into the registration rights agreement, which is
more fully described in “Description of Capital Stock — Registration Rights.” Since January 1, 2023, we have
waived our right of first refusal in connection with the sale of certain shares of our capital stock. See the section
titled “Principal and Selling Stockholders” for additional information regarding beneficial ownership of our capital
stock.
Lease Agreement
In February 2021, Neptune Flood and TRB Rents, LLC (“TRB”), a Florida limited liability company, entered
into a commercial lease agreement (the “Lease Agreement”) for Neptune’s commercial office space in
St. Petersburg, Florida. Trevor Burgess and Jonathan Carlon, Neptune Flood’s Director of Corporate Development
and a member of our board of directors, are TRB’s managing members. The Lease Agreement is a month-to-month
lease with a monthly rent of $12,000 per month. During the years ended December 31, 2023, 2024, and 2025,
Neptune Flood paid $144,000, $144,000 and $144,000, respectively, in rent expense to TRB.
Executive Compensation and Employment Arrangements
Please see “Executive Compensation” in our Proxy Statement, which is incorporated by reference herein, for
information on compensation arrangements with our executive officers, including stock option grants and
agreements with executive officers.
Limitation of Liability and Indemnification of Directors and Officers
See “Certain Relationships and Related Party Transactions — Indemnification Agreements with our Directors
and Officers” in our Proxy Statement, which is incorporated by reference herein, for information on our
indemnification arrangements with our directors and executive officers.
48
Other Transactions
To facilitate the Class B Stock Exchange, we entered into an exchange agreement (the “Class B Exchange
Agreement”) with Mr. Burgess and entities affiliated with Mr. Burgess, pursuant to which, upon the Effective Time,
43,435,000 shares of our outstanding Class A common stock beneficially owned by Mr. Burgess as of the Effective
Time were automatically exchanged for an equivalent number of newly issued shares of our Class B common stock.
Pursuant to the Class B Exchange Agreement, the Company also agreed to be responsible for any filing fees and
related costs and expenses incurred in connection with the Hart-Scott-Rodino Antitrust Improvements Act of 1976,
as amended, in connection with the consummation of the Class B Stock Exchange. In addition, we entered into the
Class B Equity Exchange Agreement with Mr. Burgess pursuant to which, following the completion of the IPO,
Mr. Burgess has a right (but not an obligation), to require us to exchange any shares of Class A common stock
received by Mr. Burgess upon the exercise, vesting, and/or settlement of certain equity awards held by Mr. Burgess
for an equivalent number of shares of Class B common stock. As of the date of this prospectus, there were 8,142,964
shares of our Class A common stock subject to equity awards held by Mr. Burgess that may become exchangeable
for an equivalent number of shares of our Class B common stock.
Review, Approval or Ratification of Transactions with Related Parties
We have adopted a written related person transactions policy that our executive officers, directors, nominees for
election as a director, beneficial owners of more than 5% of our common stock and any members of the immediate
family of and any entity affiliated with any of the foregoing persons are not permitted to enter into a material related
person transaction with us without the review and approval of our audit committee or a committee composed solely
of independent directors in the event it is inappropriate for our audit committee to review such transaction due to a
conflict of interest. The policy provides that any request for us to enter into a transaction with an executive officer,
director, nominee for election as a director, beneficial owner of more than 5% of our common stock or with any of
their immediate family members or affiliates, in which the amount involved exceeds $120,000 will be presented to
our audit committee for review, consideration and approval. In approving or rejecting any such proposal, our audit
committee will consider the relevant facts and circumstances available and deemed relevant to the audit committee,
including, but not limited to, whether the transaction is on terms no less favorable than terms generally available to
an unaffiliated third party under the same or similar circumstances and the extent of the related person’s interest in
the transaction. Our related party transactions policy is available on the Investor Relations page of our website at
www.investors.neptuneflood.com.
Prior to our adoption of a written related party transactions policy, our board of directors reviewed and
approved any transaction where a director or officer had a financial interest, including all of the transactions
described above. Prior to approving such a transaction, the material facts as to a director’s or officer’s relationship or
interest as to the agreement or transaction were disclosed to our board of directors. Our board of directors would
take this information into account when evaluating the transaction and in determining whether such transaction was
fair to our company and in the best interest of all of our stockholders.
49
PRINCIPAL AND SELLING STOCKHOLDERS
The following table presents information as to the beneficial ownership of our common stock as of March 31,
2026, and as adjusted to reflect the selling stockholders’ sale of Class A common stock in this offering and the Share
Repurchase, by:
•each stockholder known by us to be the beneficial owner of more than 5% of our outstanding common
stock;
•each of our directors;
•each of our named executive officers;
•all selling stockholders; and
•all of our directors and executive officers as a group.
Beneficial ownership is determined in accordance with the rules of the SEC and generally includes any shares
over which a person exercises sole or shared voting or investment power. Unless otherwise indicated below, to our
knowledge, the persons and entities named in the table have sole voting and sole investment power with respect to
all shares beneficially owned by them, subject to community property laws where applicable. Shares of our common
stock subject to stock options that are currently exercisable or exercisable within 60 days of March 31, 2026, are
deemed to be outstanding and to be beneficially owned by the person holding such securities for the purpose of
computing the percentage ownership of that person, but are not treated as outstanding for the purpose of computing
the percentage ownership of any other person.
Percentage ownership of our common stock is based on 138,303,326 shares of our common stock outstanding
on March 31, 2026, consisting of 94,868,326 shares of our Class A common stock and 43,435,000 shares of our
Class B common stock. Percentage ownership of our common stock after the offering (assuming no exercise of the
underwriters’ option to purchase additional shares) also assumes the foregoing and assumes the sale of 8,355,615
shares of Class A common stock by the selling stockholders in this offering and our purchase of 835,561 shares of
Class A common stock in the Share Repurchase. Unless otherwise indicated, the address of each of the individuals
and entities named below is c/o Neptune Insurance Holdings Inc., 400 6th Street S, Suite 2, St. Petersburg, Florida
33701.
Shares Beneficially Owned Before the Offering and the Share Repurchase | Shares Beneficially Owned After the Offering and the Share Repurchase | |||||||||||||||||||
Class A Common Stock | Class B Common Stock | % of Total Voting Power† | Class A Common Stock | Class B Common Stock | % of Total Voting Power† | |||||||||||||||
Name of Beneficial Owner | Shares | % | Shares | % | Shares | % | Shares | % | ||||||||||||
Greater than 5% Stockholders and Selling Stockholders: | ||||||||||||||||||||
Entities affiliated with Bregal Sagemount(1) .. | 19,530,472 | 20.6% | — | — | 3.7% | 15,633,987 | 16.6% | — | — | 3.0% | ||||||||||
Entities affiliated with FTV Capital(2) ........... | 22,350,631 | 23.6% | — | — | 4.2% | 17,891,501 | 19.0% | — | — | 3.4% | ||||||||||
Entities affiliated with Trevor Burgess(3) ....... | 100,000 | * | 43,435,000 | 100.0% | 82.1% | 100,000 | * | 43,435,000 | 100% | 82.2% | ||||||||||
Entities affiliated with James D. Albert(4) ..... | 13,751,814 | 14.5% | — | — | 2.6% | 13,751,814 | 14.6% | — | — | 2.6% | ||||||||||
50
Shares Beneficially Owned Before the Offering and the Share Repurchase | Shares Beneficially Owned After the Offering and the Share Repurchase | |||||||||||||||||||
Class A Common Stock | Class B Common Stock | % of Total Voting Power† | Class A Common Stock | Class B Common Stock | % of Total Voting Power† | |||||||||||||||
Name of Beneficial Owner | Shares | % | Shares | % | Shares | % | Shares | % | ||||||||||||
Entities affiliated with Jonathan Carlon(5) ..................................... | 5,110,000 | 5.4% | — | — | 1.0% | 5,110,000 | 5.4% | — | — | 1.0% | ||||||||||
Named Executive Officers and Directors: | ||||||||||||||||||||
Trevor Burgess(3)(6) ......................... | 100,000 | * | 49,595,000 | 100.0% | 84.0% | 100,000 | * | 49,595,000 | 100.0% | 84.1% | ||||||||||
Jim Steiner(7) ................................... | 3,944,550 | 4.2% | — | — | * | 3,944,550 | 4.2% | — | — | * | ||||||||||
Matt Duffy(8) ................................... | 1,255,500 | 1.3% | — | — | * | 1,255,500 | 1.3% | — | — | * | ||||||||||
Jonathan Carlon(5)(9) ........................ | 5,690,000 | 6.0% | — | — | 1.1% | 5,690,000 | 6.1% | — | — | 1.1% | ||||||||||
Blair J. Greenberg .......................... | — | — | — | — | — | — | — | — | — | — | ||||||||||
Cristian Melej ................................. | 20,000 | * | — | — | * | 20,000 | * | — | — | * | ||||||||||
Mike Vostrizansky(2) ...................... | 23,000 | * | — | — | * | 23,000 | * | — | — | * | ||||||||||
All executive officers and directors as a group (7 persons) ................................... | 11,033,050 | 11.6% | 49,595,000 | 100.0% | 85.8% | 11,033,050 | 11.7% | 49,595,000 | 100.0% | 85.9% | ||||||||||
__________________
*Represents less than 1%.
†Percentage of total voting power represents voting power with respect to all shares of common stock, as a single class. Each share of Class
A common stock is entitled to one vote per share and each share of Class B common stock is entitled to ten votes per share.
(1)Consists of 19,530,472 shares of Class A common stock held by BSIV 101. BSIV 101 is managed by BSIV Hold 101 GP, LLC (“BSIV 101
GP”), its general partner, which is managed by Bregal Sagemount IV General Partner Jersey Limited (“Bregal GP”), its sole member, which
is managed by a board of directors and is ultimately 100% owned by Gene Yoon. Bregal Sagemount Management LP, which is majority
owned by Gene Yoon, is registered as an SEC Relying Advisor of Bregal Investments, Inc., an SEC Registered Investment Advisor. Bregal
Sagemount Management LP is the investment advisor to BSIV 101. Gene Yoon, as managing director of Bregal Sagemount Management
LP may be deemed to have or share beneficial ownership of the Class A common stock held directly by BSIV 101. The address of BSIV,
BSIV 101, BSIV 101 GP, Bregal Sagemount Management LP and Bregal Investments, Inc. is 200 Park Avenue, 45th Floor, New York, NY
10166. The address of Bregal GP is Second Floor, Windward House, La Route de la Liberation, St. Helier, Jersey JE2 3BQ, Channel
Islands.
(2)Consists of (a) 14,556,518 shares of Class A common stock held by FTV VII; (b) 6,434,159 shares of Class A common stock held by FTV-
NE Aggregator; and (c) 1,359,954 shares of Class A common stock held by Growth VII-Centre. FTV-NE Aggregator is managed by FTV
VII, its sole member, which is managed by FTV Management VII, L.P. (“FTV Management”), its general partner, which is managed by
FTV VII GP, L.L.C. (“FTV VII GP”), its general partner. Growth VII-Centre is managed by FTV Management, its general partner. Michael
Vostrizansky, a member of our Board, is a member of the investment committee of FTV Management, which directs investments by and the
disposition of investments of FTV VII. The address of FTV-NE Aggregator, Growth VII-Centre, FTV VII, FTV Management and FTV VII
GP is 601 California Street, Floor 19, San Francisco, CA 94108.
(3)Consists of (a) 25,039,000 shares of Class B common stock held by Trevor R. Burgess, Trustee of the Burgess Family SLAT, u/a/d March
26, 2025 (the “Burgess Family SLAT”); (b) 17,885,000 shares of Class B common stock held by Jonathan W. Meyer and David J.
Rectenwald, Co-Trustees of the Trevor R. Burgess Irrevocable Trust of 2020, u/a/d March 24, 2025 (the “Burgess Irrevocable Trust”); and
(c) 100,000 shares of Class A common stock and 511,000 shares of Class B common stock held by Trevor R. Burgess, Trustee of the Trevor
R. Burgess Revocable Trust, u/a/d September 30, 2024, which are affiliated with Mr. Burgess, our Chief Executive Officer and Chairman of
our Board. Each of the three trusts holds sole voting power over its respective shares of Class B common stock. By virtue of his relationship
with the Burgess Irrevocable Trust, Mr. Burgess is deemed to have an indirect beneficial interest in the shares of Class B common stock
held by the Burgess Irrevocable Trust. Mr. Burgess disclaims beneficial ownership of the shares held by the Burgess Irrevocable Trust.
(4)Consists of (a) 9,420,156 shares of Class A common stock held by James D. Albert, as trustee of the Ann J. Albert Irrevocable Grantor
Trust, dated June 9, 2021 (“Albert Irrevocable Grantor Trust”); (b) 2,165,829 shares of Class A common stock held by Emily Polk Albert
Goldman, as trustee of the James D. Albert 2021 Irrevocable Grant Trust FBO Emily Polk Albert Goldman, dated February 23, 2021
(“Trust FBO E. Albert Goldman”); and (c) 2,165,829 shares of Class A common stock held by Laura Elizabeth Albert Duckworth, as
trustee of the James D. Albert 2021 Irrevocable Grant Trust FBO Laura Elizabeth Albert Duckworth, dated February 23, 2021 (“Trust FBO
L. Albert Duckworth”). Emily Polk Albert Goldman and Laura Elizabeth Albert Duckworth are children of James D. Albert. Each of the
three trusts holds sole voting power over its respective shares of Class A common stock. The address of Albert Irrevocable Grantor Trust is
390 Coffee Pot Riviera NE, St. Petersburg, FL 33704. The address of Trust FBO E. Albert Goldman is 355 15th Ave. NE, St. Petersburg,
FL 33704. The address of Trust FBO L. Albert Duckworth is 1315 Wilton Ln, Kirkwood, MO 63122.
(5)Consists of (a) 4,599,000 shares of Class A common stock held by Jonathan Carlon and Steve Wynne, as trustees of the JWC Irrevocable
Trust; and (b) 511,000 shares of Class A common stock held by Jonathan Carlon and Alexis Carlon, as trustees of the Carlon Family Trust,
dated May 7, 2024. Each of the two trusts holds sole voting power over its respective shares of Class A common stock.
(6)Includes 6,160,000 shares of Class B common stock issuable to Mr. Burgess in accordance with the Class B Equity Exchange Agreement in
exchange for 6,160,000 shares of Class A common stock issuable upon exercise of stock options held by Mr. Burgess, that are exercisable
within 60 days of April 17, 2026.
(7)Consists of (a) 3,730,000 shares of Class A common stock held by James Steiner, as trustee of the Living Trust of James Edward Steiner
(“Steiner Living Trust”), of which 475,000 shares of Class A common stock are pledged as collateral to secure certain personal
indebtedness of Mr. Steiner; (b) 95,500 shares of Class A common stock subject to options held by Mr. Steiner that are exercisable within
60 days of April 17, 2026; and (c) 119,050 shares of Class A common stock purchased by the Steiner Living Trust through the Company’s
directed share program in connection with the IPO.
51
(8)Consists of (a) 1,160,000 shares of Class A common stock held by Mr. Duffy, which are pledged as collateral to secure certain personal
indebtedness of Mr. Duffy; and (b) 95,500 shares of Class A common stock subject to options held by Mr. Duffy that are exercisable within
60 days of April 17, 2026.
(9)Includes 580,000 shares of Class A common stock held by Mr. Carlon.
52
DESCRIPTION OF CAPITAL STOCK
The following description summarizes the most important terms of our capital stock. Because it is only a
summary, it does not contain all the information that may be important to you, and the descriptions herein are
qualified by reference to our amended and restated certificate of incorporation and amended and restated bylaws.
For a complete description, you should refer to our amended and restated certificate of incorporation, amended and
restated bylaws and registration rights agreement, which are included as exhibits to the registration statement of
which this prospectus forms a part, and to the applicable provisions of Delaware law.
Capital Stock
Authorized Capital Stock
Our amended and restated certificate of incorporation provides for two classes of common stock: Class A
common stock and Class B common stock. Our authorized capital stock consists of 500,000,000 shares, each with a
par value of $0.00001 per share, of which:
•428,422,036 shares are designated as Class A common stock;
•51,577,964 shares are designated as Class B common stock; and
•20,000,000 shares are designated as undesignated preferred stock.
As of March 31, 2026, there were 138,303,326 shares of our common stock outstanding, consisting of
94,868,326 shares of our Class A common stock and 43,435,000 shares of our Class B common stock, held by 20
stockholders of record, and no shares of our preferred stock outstanding. Our board of directors is authorized,
without stockholder approval except as required by the listing standards of the NYSE, to issue additional shares of
our capital stock.
Voting Rights
Holders of our Class A common stock are entitled to one vote per share, and the holders of our Class B common
stock are entitled to ten votes per share. The holders of our common stock will generally vote together as a single
class on all matters (including the election of directors) submitted to a vote of our stockholders, unless otherwise
required by the DGCL or our amended and restated certificate of incorporation.
The DGCL could require holders of our common stock to vote separately as a single class in the following
circumstances:
•if we amended our amended and restated certificate of incorporation to increase or decrease the par value of
the shares of a class of stock, then the holders of the shares of that class would be required to vote
separately to approve the proposed amendment;
•if we amended our amended and restated certificate of incorporation in a manner that altered or changed the
powers, preferences, or special rights of the shares of a class stock so as to affect them adversely, then the
holders of the shares of that class would be required to vote separately to approve the proposed amendment.
Our amended and restated certificate of incorporation and amended and restated bylaws establish a classified
board of directors that is divided into three classes with staggered three-year terms. Only the directors in one class
are subject to election by a plurality of the votes cast at each annual meeting of our stockholders, with the directors
in the other classes continuing for the remainder of their respective three-year terms. Our amended and restated
certificate of incorporation does not provide for cumulative voting for the election of directors.
Dividends
Subject to preferences that may apply to shares of preferred stock outstanding at the time, the holders of
outstanding shares of our common stock are entitled to receive dividends out of funds legally available at the times
and in the amounts that our board of directors may determine.
53
Liquidation Rights
Upon our liquidation, dissolution, or winding-up, the assets legally available for distribution to our stockholders
would be distributable ratably among the holders of our Class A common stock and Class B common stock and any
participating preferred stock outstanding at that time, subject to any preferential or other rights, if any, on any
outstanding shares of preferred stock.
Conversion
Each outstanding share of our Class B common stock is convertible at any time at the option of the holder into
one share of Class A common stock.
In addition, each share of our Class B common stock will convert automatically into one share of our Class A
common stock upon any transfer, whether or not for value, except for certain permitted transfers described in our
amended and restated certificate of incorporation. Each share of our Class B common stock will also convert
automatically into one share of our Class A common stock upon the earlier of:
•twelve months following the death or disability of Mr. Burgess; or
•the first trading day on or after such date that the outstanding shares of our Class B common stock represent
less than 5% of the then-outstanding common stock.
Either such period may be extended to eighteen months upon affirmative approval of a majority of the
independent directors. Once converted into Class A common stock, the Class B common stock will not be reissued.
Shares of Class A common stock are not convertible into any other class of our capital stock.
Future transfers of our Class B common stock by the holders of our Class B common stock will result in the
corresponding shares of our Class B common stock converting into shares of our Class A common stock, other than
transfers to a “permitted transferee”, which includes:
•a trust for the benefit of Mr. Burgess, provided Mr. Burgess or his permitted transferees do not receive
consideration in exchange for the transfer (other than as a settlor or beneficiary of such trust);
•a trust for the benefit of persons other than Mr. Burgess, provided Mr. Burgess or his permitted transferees
do not receive consideration in exchange for the transfer;
•a trust under the terms of which Mr. Burgess or his family members have retained a “qualified interest”
within the meaning of Section 2702(b)(1) of the Code and/or a reversionary interest;
•Mr. Burgess’s estate, any one or more of Mr. Burgess’s family members, or any revocable or irrevocable
trust for the primary benefit of Mr. Burgess or one or more of Mr. Burgess’s family members;
•any charitable organization, private foundation, supporting organization, donor advised or donor directed
fund, or any other charitable fund or similar entity established by Mr. Burgess;
•an Individual Retirement Account, as defined in Section 408(a) of the Code, or a pension, profit sharing,
stock bonus, or other type of plan or trust of which Mr. Burgess or his permitted transferees are participants
or beneficiaries and which satisfies the requirements for qualification under Section 401 of the Code; or
•a corporation, partnership, or limited liability company owned or controlled, directly or indirectly, by Mr.
Burgess or his permitted transferees, in each case, so long as Mr. Burgess, his family members, or a trustee
of a trust described above retain sole dispositive power and voting control with respect to the shares of our
Class B common stock.
No Preemptive or Similar Rights
Our common stock is not entitled to preemptive rights and are not subject to conversion (except as described
above), redemption, or sinking fund provisions.
54
Fully Paid and Non-Assessable
All of the outstanding shares of our common stock are fully paid and non-assessable.
Preferred Stock
All of our previously outstanding shares of convertible preferred stock were converted into Class A common
stock, and there are no authorized shares of convertible preferred stock. We have no shares of convertible preferred
stock outstanding. Under the terms of our amended and restated certificate of incorporation, our board of directors
has the authority, without further action by our stockholders, to issue up to 20,000,000 shares of preferred stock in
one or more series, to establish from time to time the number of shares to be included in each such series, to fix the
designation, vesting, powers (including voting powers), preferences and relative, participating, optional, or other
rights (and the qualifications, limitations or restrictions thereof), and to increase or decrease the number of shares of
any such series, but not below the number of shares of such series then outstanding.
Our board of directors may authorize the issuance of preferred stock with voting, dividend rights, liquidation
rights, redemption rights, or conversion rights that could adversely affect the voting power or other rights of the
holders of our common stock. The issuance of preferred stock, while providing flexibility in connection with
possible acquisitions and other corporate purposes, could, among other things, have the effect of delaying, deferring,
or preventing a change of control of our company and may adversely affect the market price of our Class A common
stock and the voting and other rights of the holders of our common stock. We have no current plans to issue any
shares of preferred stock.
Options
As of March 31, 2026, pursuant to our Amended and Restated 2025 Stock Plan, we had outstanding options to
purchase an aggregate of 8,588,904 shares of our Class A common stock, with a weighted average exercise price of
$5.80 per share, all of which are fully vested.
Registration Rights
In connection with the IPO, we entered into a registration rights agreement with BSIV 101 and FTV VII, FTV-
NE Aggregator and Growth VII-Centre (together with FTV VII and FTV-NE Aggregator, the “FTV Entities” and
together with BSIV 101, the “RRA Investors”). Under this agreement, the RRA Investors and certain of their
permitted transferees have certain registration rights relating to certain shares of our Class A common stock held by
them. The registration of such shares of our Class A common stock through the exercise of such registration rights
would enable the RRA Investors to sell such shares without restriction under the Securities Act at such time as the
applicable registration statement with respect to the resale of those shares is declared effective, following the
expiration or termination of any applicable lock-up restrictions.
The registration rights agreement provides for both demand and piggyback registration rights, including the
ability to request shelf registrations and underwritten offerings, subject to specified minimum size thresholds and
frequency limitations. The FTV Entities may register up to 14,556,518 shares of Class A common stock and BSIV
101 may register up to 20,350,595 shares of Class A common stock under the registration rights agreement,
including the shares offered by the selling stockholders pursuant to this prospectus.
Class A common stock held by any RRA Investor will cease to constitute registrable securities under the
registration rights agreement at the earliest of such time as (i) such common stock is sold under an effective
registration statement, (ii) such common stock is sold pursuant to Rule 144 of the Securities Act, (iii) such common
stock has been otherwise transferred and delegended and can thereafter be sold without registration, (iv) with respect
to any RRA Investor, when such RRA Investor beneficially owns less than 1% of our then-outstanding Class A
common stock and all such shares are eligible to be sold without limitation under Rule 144 in any 90-day period
thereunder, and (v) with respect to each of BSIV 101 and the FTV Entities, respectively, when such RRA Investors
have sold up to their maximum number of shares registrable under the registration rights agreement pursuant to their
demand or piggyback registration rights.
55
The RRA Investors will pay any fees and expenses, as well as underwriting discounts and commissions,
incurred by them with respect to any registration effected under the terms of the registration rights agreement, and,
other than with respect to any piggyback registration, the reasonable expenses incurred by or on behalf of the
Company in connection with any such registration in excess of $75,000, subject to certain limitations and
exceptions, including any other selling stockholders being required to bear their portion of such expenses on a
ratable basis. In an underwritten offering, the underwriters have the right, subject to specified conditions, to limit the
number of shares such holders may include. In addition, in connection with this offering, each RRA Investor has
agreed that they will not, subject to limited exceptions, directly or indirectly sell, dispose of or hedge any shares of
our Class A common stock or any securities convertible into or exchangeable or exercisable for shares of our Class
A common stock for a period of 180 days after the date of this prospectus. See the section titled “Underwriting” for
additional information.
Form S-1 Demand Registration Rights
Certain holders of our Class A common stock are entitled to certain demand registration rights. At any time
beginning 180 days after the date of the IPO prospectus (which period has lapsed), the RRA Investors may request
that we register the resale of all or a portion of their shares on a registration statement on Form S-1, so long as the
shares registered on such resale registration statement are anticipated to have an aggregate offering price of no less
than $200 million.
Form S-3 Demand Registration Rights
At any time beginning one year after the date of the IPO, the RRA Investors will be entitled to request that we
register the resale of their shares on a registration statement on Form S-3, so long as the shares registered on such
resale registration statement are anticipated to have an aggregate offering price of no less than $200 million. If such
a request is made, then the RRA Investors will have the right to demand underwritten Form S-3 registrations,
including underwritten block trades, from time to time, so long as such underwritten registrations are anticipated to
have an aggregate offering price of no less than $50 million. We will not be required to initiate more than 4 such
registrations in any 12-month period, or more than 1 such registration in any calendar quarter.
Piggyback Registration Rights
After the date of the IPO, in the event that we propose to register any of our securities under the Securities Act,
either for our own account or for the account of other stockholders, the RRA Investors are entitled to certain
piggyback registration rights allowing the RRA Investors to include their shares in such registration, subject to
certain marketing and other limitations. As a result, whenever we propose to file a registration statement under the
Securities Act, other than with respect to (i) a registration relating solely to the sale of securities to participants in
our stock plan, (ii) a registration relating to a transaction covered by Rule 145 under the Securities Act, (iii) any
registration on any form which does not include substantially the same information as would be required to be
included in a registration statement covering the sale of registrable securities, or (iv) a registration in which the only
stock being registered is common stock upon conversion of debt securities also being registered, the RRA Investors
are entitled to notice of the registration and have the right to include their shares in the registration, subject to
limitations that the underwriters may impose on the number of shares included in the offering.
Our obligations to effect demand and piggyback registrations are subject to customary limitations, including
certain rights to suspend or delay the effectiveness of any registration effected under the registration rights
agreement.
Anti-Takeover Effects of Delaware Law and Our Certificate of Incorporation and Bylaws
Some provisions of the DGCL, our amended and restated certificate of incorporation, and our amended and
restated bylaws contain or will contain provisions that could make the following transactions more difficult:
•an acquisition of us by means of a tender offer;
•an acquisition of us by means of a proxy contest or otherwise; or
56
•the removal of our incumbent officers and directors.
It is possible that these provisions could make it more difficult to accomplish or could deter transactions that
stockholders may otherwise consider to be in their best interest or in our best interests, including transactions which
provide for payment of a premium over the market price for our shares.
These provisions, summarized below, are intended to discourage coercive takeover practices and inadequate
takeover bids. These provisions are also designed to encourage persons seeking to acquire control of us to first
negotiate with our board of directors.
Dual Class Stock
So long as the outstanding shares of our Class B common stock represent a majority of the combined voting
power of our then-outstanding Class A common stock and Class B common stock, Mr. Burgess will effectively
control all matters submitted to our stockholders for a vote, as well as the overall management and direction of the
Company, which will have the effect of delaying, deferring or discouraging another person from acquiring control of
our company.
Stockholder Meetings
Our amended and restated certificate of incorporation provides that, prior to the Voting Threshold Date, our
stockholders will be able to take action by written consent. From and after the Voting Threshold Date, our
stockholders will no longer be able to take action by written consent, and will only be able to take action at an
annual or special meeting of our stockholders. Our amended and restated certificate of incorporation further provides
that only the chairperson of our board of directors, the chief executive officer, or our board of directors acting
pursuant to a resolution adopted by a majority of the whole board of directors will be authorized to call a special
meeting of stockholders.
Requirements for Advance Notification of Stockholder Nominations and Proposals
Our amended and restated bylaws establish advance notice procedures with respect to stockholder proposals to
be brought before a stockholder meeting and the nomination of candidates for election as directors, other than
nominations made by or at the direction of the board of directors or a committee of the board of directors.
Staggered Board
Our board of directors is divided into three classes. The directors in each class serve for a three-year term, one
class being elected each year by our stockholders. This system of electing and removing directors may tend to
discourage a third-party from making a tender offer or otherwise attempting to obtain control of us, because it
generally makes it more difficult for stockholders to replace a majority of the directors.
Removal of Directors
Our amended and restated certificate of incorporation provides that no member of our board of directors may be
removed from office by our stockholders except for cause and, in addition to any other vote required by law, upon
the approval of not less than two-thirds of the total voting power of all of our outstanding voting stock then entitled
to vote in the election of directors.
Stockholders Not Entitled to Cumulative Voting
Our amended and restated certificate of incorporation does not permit stockholders to cumulate their votes in
the election of directors. Accordingly, the holders of a majority of the outstanding shares of our common stock
entitled to vote in any election of directors can elect all of the directors standing for election, if they choose.
Undesignated Preferred Stock
The ability to authorize undesignated preferred stock makes it possible for our board of directors to issue
preferred stock with voting or other rights or preferences that could impede the success of any attempt to acquire us.
57
These and other provisions may have the effect of deferring or preventing hostile takeovers or delaying or
preventing changes in control or management of our company.
Supermajority Approvals
Our amended and restated certificate of incorporation provides that, from and after the Voting Threshold Date,
certain amendments to our amended and restated certificate of incorporation will require the approval of two-thirds
of the combined voting power of our then-outstanding shares of our common stock, provided that, if such
amendments are approved by two-thirds of the whole board of directors, they will only require the approval of a
majority of the combined voting power of all the then-outstanding shares of our common stock. In addition, prior to
the Voting Threshold Date, our amended and restated bylaws may be amended by the affirmative vote of a majority
of the combined voting power of all the then-outstanding shares of our common stock, and after the Voting
Threshold Date, the affirmative vote of at least two-thirds of the combined voting power of all the then-outstanding
shares our common stock.
Delaware Anti-Takeover Statute
In general, Section 203 of the DGCL prohibits persons deemed to be “interested stockholders” from engaging in
a “business combination” with a publicly held Delaware corporation for three years following the date these persons
become interested stockholders unless the business combination is, or the transaction in which the person became an
interested stockholder was, approved in a prescribed manner or another prescribed exception applies. Generally, an
“interested stockholder” is a person who, together with affiliates and associates, owns, or within three years prior to
the determination of interested stockholder status did own, 15% or more of a corporation’s voting stock. Generally, a
“business combination” includes a merger, asset, or stock sale, or other transaction resulting in a financial benefit to
the interested stockholder.
We have expressly elected not to be governed by the “business combination” provisions of Section 203 of the
DGCL, until after we are no longer a controlled company. At that time, such election shall be automatically
withdrawn and we will thereafter be governed by the “business combination” provisions of Section 203 of the
DGCL.
Choice of Forum
Our amended and restated certificate of incorporation provides that the Court of Chancery of the State of
Delaware (or, if, and only if, the Court of Chancery of the State of Delaware lacks subject matter jurisdiction, any
state court located within the State of Delaware or, if, and only if, all such state courts lack subject matter
jurisdiction, the federal district court for the District of Delaware) will be the exclusive forum for the following
types of actions or proceedings under Delaware statutory or common law:
•any derivative action or proceeding brought on our behalf;
•any action asserting a claim of breach of a fiduciary duty or other wrongdoing by any of our directors,
officers, employees, or agents to us or our stockholders;
•any action asserting a claim against the Company or any director or officer of the Company arising
pursuant to any provision of the DGCL or our amended and restated certificate of incorporation or amended
and restated bylaws;
•any action, suit, or proceeding as to which the DGCL confers jurisdiction on the Court of Chancery of the
State of Delaware; or
•any other action asserting a claim against the Company or any director or officer of the Company that is
governed by the internal affairs doctrine.
The provisions would not apply to suits brought to enforce a duty or liability created by the Securities Act, the
Exchange Act, or any other claim for which the U.S. federal courts have exclusive jurisdiction. Furthermore, our
amended and restated certificate of incorporation provides that the federal district courts of the United States of
58
America will be the exclusive forum for resolving any complaint asserting a cause of action arising under the
Securities Act.
While courts in Delaware and several other jurisdictions have determined that such choice of forum provisions
are facially valid, a stockholder may nevertheless seek to bring a claim in a venue other than those designated in the
exclusive forum provisions. In such instance, we would expect to vigorously assert the validity and enforceability of
the exclusive forum provisions of our amended and restated certificate of incorporation. This may require significant
additional costs associated with resolving such action and there can be no assurance that the provisions will be
enforced by a court.
Stock Exchange Listing
Our Class A common stock is listed on the NYSE under the symbol “NP.”
Transfer Agent and Registrar
The transfer agent and registrar for our Class A common stock and Class B common stock is Vinyl Equity, Inc.
The transfer agent’s address is PO Box 247, Winnetka, IL 60093, and its telephone number is 888-808-4695.
59
CERTAIN MATERIAL U.S. FEDERAL INCOME TAX CONSIDERATIONS FOR NON-U.S. HOLDERS
OF OUR CLASS A COMMON STOCK
The following is a summary of certain material U.S. federal income tax consequences to “non-U.S. holders” (as
defined below) relating to the ownership and taxable disposition of our Class A common stock, but does not purport
to be a complete analysis of all the potential tax considerations relating thereto. This summary is based upon the
provisions of the Code, U.S. Treasury regulations promulgated thereunder, administrative rulings and judicial
decisions, all as in effect on the date hereof. These authorities may be changed, possibly retroactively, so as to result
in U.S. federal income tax consequences different from those set forth below. We have not sought any ruling from
the IRS, with respect to the statements made and the conclusions reached in the following summary, and there can
be no assurance that the IRS or a court will agree with such statements and conclusions.
This discussion does not address the tax considerations arising under the alternative minimum tax, the net
investment income tax, the laws of any state, local or non-U.S. jurisdiction, or under U.S. federal gift and estate tax
laws. In addition, this discussion does not address tax considerations applicable to an investor’s particular
circumstances or to investors that may be subject to special tax rules, including, without limitation:
•banks, insurance companies or other financial institutions;
•partnerships or entities or arrangements treated as partnerships or other pass-through entities for
U.S. federal income tax purposes (or investors in such entities);
•corporations that accumulate earnings to avoid U.S. federal income tax;
•tax-exempt or governmental organizations or tax-qualified retirement plans;
•real estate investment trusts or regulated investment companies;
•controlled foreign corporations or passive foreign investment companies;
•persons who acquired our Class A common stock pursuant to the exercise of an employee stock option or
otherwise as compensation for services;
•brokers or dealers in securities or currencies;
•traders in securities that elect to use a mark-to-market method of accounting for their securities holdings;
•persons that own, or are deemed to own, more than 5% of our Class A common stock;
•certain former citizens or long-term residents of the United States;
•persons who hold our Class A common stock as a position in a hedging transaction, “straddle,” “conversion
transaction,” or other risk reduction transaction;
•persons required to accelerate the recognition of any item of gross income with respect to our Class A
common stock as a result of such income being recognized on an applicable financial statement;
•persons who do not hold our Class A common stock as a capital asset within the meaning of Section 1221
of the Code (generally, for investment purposes); or
•persons deemed to sell our Class A common stock under the constructive sale provisions of the Code.
In addition, if a partnership or entity classified as a partnership for U.S. federal income tax purposes is a
beneficial owner of our Class A common stock, the tax treatment of a partner in the partnership or an owner of the
entity will depend upon the status of the partner or owner and the activities of the partnership or entity. Accordingly,
this discussion does not address U.S. federal income tax considerations applicable to partnerships that hold our
Class A common stock, and partners in such partnerships should consult their tax advisors.
60
You are urged to consult your tax advisor with respect to the application of the U.S. federal income tax
laws to your particular situation, as well as any tax consequences of the purchase, ownership and taxable
disposition of our Class A common stock arising under the U.S. federal estate or gift tax rules or under the
laws of any state, local, non-U.S. or other taxing jurisdiction or under any applicable tax treaty.
Non-U.S. Holder Defined
For purposes of this section, a “non-U.S. holder” is any beneficial owner of our Class A common stock, other
than an entity taxable as a partnership for U.S. federal income tax purposes, that is not:
•an individual who is a citizen or resident of the United States for U.S. federal income tax purposes;
•a corporation, or other entity taxable as a corporation for U.S. federal income tax purposes, created or
organized under the laws of the United States, any state therein or the District of Columbia or otherwise
treated as such for U.S. federal income tax purposes;
•a trust that (1) is subject to the primary supervision of a U.S. court and one or more “United States
persons,” as defined under the Code, have the authority to control all substantial decisions of the trust or
(2) has a valid election in effect under applicable U.S. Treasury regulations to be treated as a United States
person; or
•an estate whose income is subject to U.S. federal income tax regardless of source.
Distributions
If we make a distribution of cash or other property (other than certain pro rata distributions of our common
stock) in respect of our Class A common stock, the distribution will be treated as a dividend to the extent it is paid
from our current or accumulated earnings and profits (as determined under U.S. federal income tax principles). If the
amount of a distribution exceeds our current and accumulated earnings and profits, such excess first will be treated
as a tax-free return of capital to the extent of the non-U.S. holder’s adjusted tax basis in our Class A common stock,
and thereafter will be treated as capital gain. Distributions treated as dividends on our Class A common stock held
by a non-U.S. holder generally will be subject to U.S. federal withholding tax at a rate of 30%, or at a lower rate if
provided by an applicable income tax treaty and the non-U.S. holder has provided the documentation required to
claim benefits under such treaty. Generally, to claim the benefits of an applicable tax treaty, a non-U.S. holder will
be required to provide a properly executed IRS Form W-8BEN (or other applicable form).
If, however, a dividend is effectively connected with the conduct of a trade or business in the U.S. by the non-
U.S. holder (and, if an applicable tax treaty so provides, is attributable to a permanent establishment or fixed base
maintained by the non-U.S. holder in the U.S.), the dividend will not be subject to the 30% U.S. federal withholding
tax (provided the non-U.S. holder has provided the appropriate documentation, generally an IRS Form W-8ECI, to
the withholding agent), but the non-U.S. holder generally will be subject to U.S. federal income tax in respect of the
dividend on a net income basis in substantially the same manner as if the non-U.S. holder were a United States
person. Dividends received by a non-U.S. holder that is a corporation for U.S. federal income tax purposes and
which are effectively connected with the conduct of a U.S. trade or business may also be subject to a branch profits
tax at the rate of 30% (or a lower rate if provided by an applicable tax treaty).
Sale of Class A common stock
Subject to the discussion below of FATCA and backup withholding, a non-U.S. holder generally will not be
subject to U.S. federal income or withholding tax on any gain realized on the sale or other taxable disposition of our
Class A common stock unless:
•such non-U.S. holder is an individual who is present in the U.S. for 183 days or more in the taxable year of
such sale or disposition, and certain other conditions are met;
61
•such gain is effectively connected with the conduct by the non-U.S. holder of a trade or business in the
U.S. (and, if an applicable tax treaty so provides, is attributable to a permanent establishment or a fixed
base maintained by the non-U.S. holder in the U.S.); or
•our Class A common stock constitutes a U.S. real property interest by reason of our status as a
“United States real property holding corporation” for U.S. federal income tax purposes (a “USRPHC”), at
any time within the shorter of the five-year period preceding the disposition or the non-U.S. holder’s
holding period for our Class A common stock.
A non-U.S. holder that is an individual and who is present in the U.S. for 183 days or more in the taxable year
of such sale or disposition, if certain other conditions are met, will be subject to tax at a gross rate of 30% on the
amount by which such non-U.S. holder’s taxable capital gains allocable to U.S. sources, including gain from the sale
or other disposition of our Class A common stock, exceed capital losses allocable to U.S. sources, except as
otherwise provided in an applicable tax treaty.
Gain realized by a non-U.S. holder that is effectively connected with such non-U.S. holder’s conduct of a trade
or business in the U.S. generally will be subject to U.S. federal income tax on a net income basis in substantially the
same manner as a United States person (except as provided by an applicable tax treaty). In addition, if such non-
U.S. holder is a corporation for U.S. federal income tax purposes, it may also be subject to a branch profits tax at the
rate of 30% (or a lower rate if provided by an applicable tax treaty).
Generally, a corporation is a USRPHC if the fair market value of its U.S. real property interests equals or
exceeds 50% of the sum of the fair market value of its worldwide real property interests and its other assets used or
held for use in a trade or business (all as determined for U.S. federal income tax purposes). We do not believe that
we currently are a USRPHC, however there can be no assurances that we are not now nor will become a USRPHC
in the future. If, however, we were a USRPHC during the applicable testing period, as long as our Class A common
stock is regularly traded on an established securities market, our Class A common stock will be treated as U.S. real
property interests only for a non-U.S. holder who actually or constructively holds (at any time within the shorter of
the five-year period preceding the disposition or the non-U.S. holder’s holding period) more than 5% of such
Class A common stock.
Backup Withholding and Information Reporting
Generally, we must report annually to the IRS the amount of dividends paid with respect to our Class A
common stock to a non-U.S. holder and the amount of tax withheld, if any. A similar report is sent to the non-
U.S. holder. Pursuant to applicable income tax treaties or other agreements, the IRS may make these reports
available to tax authorities in the non-U.S. holder’s country of residence.
Payments of dividends or of proceeds on the disposition with respect to our Class A common stock made to a
non-U.S. holder may be subject to information reporting and backup withholding unless the non-U.S. holder
establishes an exemption, for example by properly certifying the non-U.S. holder’s status on a Form W-8BEN or
another appropriate form. Notwithstanding the foregoing, backup withholding and information reporting may apply
if either we or our paying agent has actual knowledge, or reason to know, that the non-U.S. holder is a United States
person.
Backup withholding is not an additional tax; rather, the U.S. income tax liability of persons subject to backup
withholding will be reduced by the amount of tax withheld. If withholding results in an overpayment of taxes, a
refund or credit may generally be obtained from the IRS, provided that the required information is furnished to the
IRS in a timely manner.
Foreign Account Tax Compliance Act — FATCA
Under Section 1471 through 1474 of the Code (such Sections commonly referred to as “FATCA”), U.S. federal
withholding tax of 30% is imposed on certain types of U.S. source “withholdable payments” (including dividends
and the gross proceeds from the sale, exchange or other taxable disposition of U.S. stock) to “foreign financial
institutions,” which are broadly defined for this purpose, and other non-U.S. entities in connection with the failure to
62
comply with certain certification and information reporting requirements regarding U.S. account holders or owners
of such institutions or entities. The obligation to withhold under FATCA applies to any dividends on our Class A
common stock. While withholding under FATCA would have applied to gross proceeds from the sale, exchange or
other taxable disposition of our Class A common stock and to certain “passthru” payments received with respect to
instruments held through foreign financial institutions after the date on which applicable final U.S. Treasury
regulations are issued, proposed U.S. Treasury regulations eliminate FATCA withholding on payments of gross
proceeds entirely and limit FATCA withholding on these “passthru” payments to those payments made two years
after the date on which applicable final U.S. Treasury regulations are issued. Taxpayers generally may rely on these
proposed U.S. Treasury regulations until final U.S. Treasury regulations are issued. An intergovernmental agreement
between the United States and an applicable foreign country may modify the requirements described in this
paragraph. Non-U.S. holders should consult their own tax advisors regarding the possible implications of FATCA on
their investment in our Class A common stock.
The preceding discussion of U.S. federal income tax considerations is for general information only. It is
not tax advice. Each prospective investor should consult its own tax advisor regarding the particular
U.S. federal, state, local and non-U.S. tax consequences of the sale, exchange or other taxable disposition of
our Class A common stock, including the consequences of any proposed change in applicable laws.
63
UNDERWRITING
Under the terms and subject to the conditions in an underwriting agreement dated the date of this prospectus, the
underwriters named below, for whom Morgan Stanley & Co. LLC and J.P. Morgan Securities LLC are acting as
representatives, have severally agreed to purchase, and the selling stockholders have agreed to sell to them,
severally, the number of shares of our Class A common stock indicated below:
Name | Number of Shares | |
Morgan Stanley & Co. LLC ................................................................................................................ | ||
J.P. Morgan Securities LLC ................................................................................................................. | ||
Goldman Sachs & Co. LLC ................................................................................................................. | ||
Total ..................................................................................................................................................... |
Subject to the closing of this offering, we intend to purchase from the underwriters 835,561 shares of our Class
A common stock at a price per share equal to the price per share to be paid by the underwriters to the selling
stockholders. The underwriters will not receive any compensation for the shares of our Class A common stock being
repurchased by us. There can be no assurance that the Share Repurchase will be completed. The completion of this
offering is not conditioned upon the completion of the Share Repurchase. See “Prospectus Summary — Share
Repurchase”.
The underwriters and the representatives are collectively referred to as the “underwriters” and the
“representatives,” respectively. The underwriters are offering the shares of Class A common stock subject to their
acceptance of the shares from the selling stockholders and subject to prior sale. The underwriting agreement
provides that the obligations of the several underwriters to pay for and accept delivery of the shares of Class A
common stock offered by this prospectus are subject to the approval of certain legal matters by their counsel and to
certain other conditions. The underwriters are obligated to take and pay for all of the shares of Class A common
stock offered by this prospectus if any such shares are taken. However, the underwriters are not required to take or
pay for the shares covered by the underwriters’ option described below.
The underwriters initially propose to offer part of the shares of Class A common stock that are not subject to the
Share Repurchase directly to the public at the offering price listed on the cover page of this prospectus and part to
certain dealers, which may include the underwriters, at a price that represents a concession not in excess of $
per share under the public offering price. After the initial offering of the shares of Class A common
stock, the offering price and other selling terms may from time to time be varied by the representatives.
The selling stockholders have granted to the underwriters an option, exercisable for 30 days from the date of
this prospectus, to purchase up to 1,253,342 additional shares of Class A common stock at the public offering price
listed on the cover page of this prospectus, less underwriting discounts and commissions. To the extent the option is
exercised, each underwriter will become obligated, subject to certain conditions, to purchase about the same
percentage of the additional shares of Class A common stock as the number listed next to the underwriter’s name in
the preceding table bears to the total number of shares of Class A common stock listed next to the names of all
underwriters in the preceding table.
The following table shows the per share and total public offering price, underwriting discounts and
commissions, and proceeds before expenses to the selling stockholders. These amounts are shown assuming both no
exercise and full exercise of the underwriters’ option to purchase up to an additional 1,253,342 shares of Class A
common stock.
Per Share | Without Option | With Option | ||||
Public offering price ...................................................................... | $ | $ | $ | |||
Underwriting discount(1) ................................................................ | $ | $ | $ | |||
Proceeds, before expenses, to the selling stockholders ................. | $ | $ | $ |
64
__________________
(1)The underwriters will not receive any discount or commission on the 835,561 shares of our Class A common stock we repurchase from the
underwriters in the Share Repurchase.
The expenses of the offering, not including the underwriting discount, are estimated at $ million. We
have agreed to reimburse the underwriters for certain expenses relating to clearance of this offering with FINRA.
The selling stockholders have agreed to reimburse us for certain of our expenses relating to this offering in excess of
$75,000 and the expenses of the offering payable by us are estimated at $75,000.
Our Class A common stock is listed on the NYSE under the trading symbol “NP.”
We have agreed that, without the prior written consent of the representatives on behalf of the underwriters, we
will not, and will not publicly disclose an intention to, during the period ending 90 days after the date of this
prospectus (the “restricted period”) (1) offer, pledge, sell, contract to sell, sell any option or contract to purchase,
purchase any option or contract to sell, grant any option, right or warrant to purchase, lend, or otherwise transfer or
dispose of, directly or indirectly, any shares of Class A common stock (“lock-up securities”) or any securities
convertible into or exercisable or exchangeable for lock-up securities or (2) enter into any swap or other
arrangement that transfers to another, in whole or in part, any of the economic consequences of ownership of lock-
up securities, whether any such transaction described in clause (1) or (2) above is to be settled by delivery of lock-up
securities or such other securities, in cash or otherwise or (3) file any registration statement with the Commission
relating to the offering of any shares of lock-up securities or any securities convertible into or exercisable or
exchangeable for lock-up securities, other than (A) lock-up securities to be sold in this offering, (B) the issuance by
us of shares of lock-up securities upon the exercise or settlement of equity awards (including any “net” or “cashless”
exercises or settlements) or forfeiture of equity awards granted pursuant to the equity compensation plans described
herein, or the conversion of a security outstanding on the date of this prospectus as described herein, (C) facilitating
the establishment or modification of a trading plan on behalf of our stockholders, officers or directors pursuant to
Rule 10b5-1 under the Exchange Act for the transfer of shares of lock-up securities, provided that (i) such plan does
not provide for the transfer of lock-up securities during the restricted period and (ii) to the extent a public
announcement or filing under the Exchange Act, if any, is required of or voluntarily made during the restricted
period by us regarding the establishment or modification of such plan, such announcement or filing shall include a
statement to the effect that no transfer of lock-up securities stock may be made under such plan during the restricted
period, (D) grants of options, stock awards, restricted stock or other equity awards and the issuance of lock-up
securities or securities convertible into or exercisable for lock-up securities (whether upon the exercise of stock
options or otherwise) to our employees, officers, directors, advisors or consultants pursuant to the terms of a plan in
effect on the date of this prospectus and as described herein, provided that we will cause each recipient of such grant
to be bound by the market standoff provisions that are enforceable by us or execute and deliver to the representatives
a signed lock-up agreement substantially in the form of the lock-up agreement entered into by the lock-up party if
such recipient has not already delivered one, (E) the issuance by us of shares of lock-up securities upon the
conversion or exchange of shares of our Class B common stock, (F) the issuance by us of shares of Class B common
stock upon the exercise of stock options or the settlement of restricted stock units (including any “net” or “cashless”
exercises or settlements), or the award, if any, of stock options, restricted stock, or restricted stock units in
accordance with our equity plans or programs that are outstanding as of the date of this prospectus and as described
herein and the form of award agreement thereunder, (G) the exchange or conversion (or other means by which
shares of one class or series can become another class or series) of shares of any class or series of our capital stock
for shares of any other class or series of our capital stock, in each case as described herein, (H) the filing by us of
any registration statement on Form S-8 pursuant to any employee benefit plans, qualified stock option plans or other
employee compensation plans, described herein, relating to (i) the resale of equity awards granted or (ii) to register
lock-up securities issuable under any such plans, or (I) the offer or issuance or agreement to issue by us of lock-up
securities or securities convertible into, exercisable for or which are otherwise exchangeable for or represent the
right to receive lock-up securities in connection with an acquisition, merger, joint venture, strategic alliance,
commercial or other collaborative relationship or the acquisition or license by us or any of our subsidiaries of the
securities, business, property or other assets of another person or entity or pursuant to any employee benefit plan as
assumed by us in connection with any such acquisition or transaction, provided that the aggregate number of shares
of lock-up securities, securities convertible into, exercisable for or which are otherwise exchangeable for or
65
represent the right to receive lock-up securities (on an as-converted, as-exercised, or as-exchanged basis) that we
may sell or issue or agree to sell or issue pursuant to this clause (I) shall not exceed 5.0% of the total number of
shares of lock-up securities outstanding immediately following the offering and provided further that we shall cause
each recipient of such grant to execute and deliver to the representatives a signed lock-up agreement substantially in
the form of the lock-up agreement entered into by the lock-up party if such recipient has not already delivered one.
The selling stockholders and all directors and officers and certain of the other holders of our outstanding
common stock and stock options (such persons or entities, the “lock-up parties”) have agreed that, without the prior
written consent of the representatives on behalf of the underwriters, they will not, and will not publicly disclose an
intention to, during the restricted period (1) offer, pledge, sell, contract to sell, sell any option or contract to
purchase, purchase any option or contract to sell, grant any option, right or warrant to purchase, lend, or otherwise
transfer or dispose of, directly or indirectly, any shares of lock-up securities beneficially owned by them or any other
securities so owned convertible into or exercisable or exchangeable for lock-up securities, (2) enter into any swap or
other arrangement that transfers to another, in whole or in part, any of the economic consequences of ownership of
lock-up securities, whether any such transaction described in clause (1) or (2) above is to be settled by delivery of
lock-up securities or such other securities, in cash or otherwise. The lock-up parties further agreed that the foregoing
precluded them from engaging in any hedging or other transaction designed or intended, or which could reasonably
be expected to lead to or result in, a sale or disposition of any shares of lock-up securities, or any securities
convertible into or exercisable or exchangeable for lock-up securities, even if any such sale or disposition
transaction or transactions would be made or executed by or on behalf of someone else.
The restrictions described in the immediately preceding paragraph shall not apply to (a) transactions relating to
shares of lock-up securities or other securities acquired in this offering or in open market transactions after the
completion of this offering, provided that no filing under Section 16(a) of the Exchange Act shall be voluntarily
made during the restricted period in connection with subsequent sales of lock-up securities or other securities
acquired in this offering or in such open market transactions and that, if required, any filing under Section 16(a) of
the Exchange Act during the restricted period shall clearly indicate in the footnotes thereto that the filing relates to
the circumstances described in this clause (a); (b) transfers of lock-up securities or any security convertible into or
exercisable or exchangeable for lock-up securities (i) as a bona fide gift, (ii) for bona fide estate planning purposes,
(iii) as a charitable contribution, (iv) to an immediate family member or to any trust for the direct or indirect benefit
of the lock-up party or an immediate family member of the lock-up party, (v) to any corporation, partnership, limited
liability company, investment fund, trust or other entity controlled or managed, or under common control or
management by, the lock-up party, (vi) upon death or by will, other testamentary document or intestate succession to
the legal representative, heir, beneficiary or an immediate family member of the lock-up party, or (vii) if the lock-up
party is a trust, to any beneficiary of the lock-up party or the estate of any such beneficiary; (c) distributions,
transfers or dispositions of shares of lock-up securities or any security convertible into or exercisable or
exchangeable for lock-up securities to current or former general or limited partners, managers or members,
stockholders, other equityholders or direct or indirect affiliates of the lock-up party or the estates of any lock-up
party; provided that in the case of any donation, transfer or distribution pursuant to clause (b) or (c), (i) each donee,
transferee, or distributee shall sign and deliver a lock-up agreement substantially in the form of the lock-up
agreement entered into by the lock-up party and (ii) no filing under Section 16(a) of the Exchange Act, reporting a
reduction in beneficial ownership of shares of lock-up securities, shall be voluntarily made during the restricted
period and that, if required, any filing required under Section 16(a) of the Exchange Act during the restricted period
shall clearly indicate in the footnotes thereto that the filing relates to the circumstances described in clause (b) or (c);
(d) any sales of lock-up securities by the lock-up party to the underwriters pursuant to the underwriting agreement;
(e) the transfer to us of lock-up securities or any securities convertible into or exercisable or exchangeable for lock-
up securities to satisfy any tax, including estimated tax, remittance, or other payment obligations of the lock-up party
arising in connection with a vesting event of our securities, upon the settlement of restricted stock units or the
payment due for the exercise of options (including a transfer to us for the “net” or “cashless” exercise of such
securities) or other rights to purchase our securities, in all such cases pursuant to equity awards granted under a stock
incentive plan or other equity award plan described herein; provided that any remaining shares of lock-up securities
received upon such vesting, settlement or exercise shall be subject to the terms of the lock-up agreement of such
lock-up party; and provided further, that no public disclosure or filing shall be made voluntarily during the restricted
period nor shall be required within 30 days after the date of this prospectus, and after such 30th day, any filing under
66
Section 16(a) of the Exchange Act during the restricted period shall clearly indicate in the footnotes thereto that the
filing relates to the circumstances described in this clause (e); (f) the establishment or modification of a trading plan
on behalf of one of our stockholders, officers or directors pursuant to Rule 10b5-1 under the Exchange Act for the
transfer of lock-up securities, provided that (i) such plan does not provide for the transfer of lock-up securities
during the restricted period and (ii) to the extent a public announcement or filing under the Exchange Act, if any, is
required of or voluntarily made during the restricted period by or on behalf of the lock-up party or us regarding the
establishment or modification of such plan, such announcement or filing shall include a statement to the effect that
no transfer of lock-up securities may be made under such plan during the restricted period; (g) the transfer of lock-
up securities or any security convertible into or exercisable or exchangeable for lock-up securities that occurs by
operation of law pursuant to a qualified domestic order or in connection with a divorce settlement, divorce decree,
separation agreement or other court order, provided that (i) the transferee shall sign and deliver a lock-up agreement
substantially in the form of the lock-up agreement entered into by the lock-up party and (ii) any filing required under
Section 16(a) of the Exchange Act during the restricted period shall clearly indicate in the footnotes thereto that the
filing relates to the circumstances described in this clause (g); (h) certain permitted transfers of shares of Class B
common stock or the conversion of Class B common stock into Class A common stock as described herein,
provided that, in each case, (i) such shares received upon conversion shall continue to be subject to the restrictions
on transfer set forth in the lock-up agreement of such lock-up party; and (ii) any filing required under Section 16(a)
of the Exchange Act during the restricted period shall clearly indicate in the footnotes thereto that the filing relates to
the circumstances described in this clause (h); (i) the transfer of lock-up securities or any security convertible into or
exercisable or exchangeable for lock-up securities pursuant to a bona fide third-party tender offer, merger,
consolidation or other similar transaction that is approved by our board of directors, made to all holders of Class A
common stock involving a change of control, provided that, in the event that the tender offer, merger, consolidation
or other such transaction is not completed, the lock-up securities owned by the lock-up party shall remain subject to
the restrictions contained in the lock-up agreement of such lock-up party; (j) in “sell to cover” or similar open
market transactions to satisfy any exercise price or tax withholding obligations as a result of the exercise, vesting
and/or settlement of Company equity awards (including options) held by the lock-up party and issued pursuant to a
plan or arrangement described herein, provided that, any such lock-up securities retained by the lock-up party after
giving effect to this clause (j) shall be subject to the terms of the lock-up agreement of such lock-up party, and
provided further, that no public disclosure or filing shall be made voluntarily during the restricted period nor shall be
required within 30 days after the date of this prospectus, and after such 30th day, any filing under Section 16(a) of
the Exchange Act during the restricted period shall clearly indicate in the footnotes thereto that the filing relates to
the circumstances described in this clause (j), (k) for certain stock splits, transfers to us in connection with any other
exchange, conversion or reclassification (or other means by which shares of any class or series can become another
class or series) of shares of any class or series of our capital stock for shares of any other class or series of shares of
our capital stock as described herein, including pursuant to the Class B Exchange Agreement and the Class B Equity
Exchange Agreement, or as required pursuant to our amended and restated certificate of incorporation, to be
effective upon the completion of this offering (including as a result of any automatic conversion of shares of Class B
common stock to shares of lock-up securities pursuant to the provisions of our amended and restated certificate of
incorporation); provided that any such shares of our capital stock received upon such exchange, conversion or
reclassification shall be subject to terms of the lock-up agreement of such lock-up party; (l) any pledge, charge, lien,
mortgage, hypothecation or other granting of a security interest in respect of lock-up securities or any security
convertible into or exercisable or exchangeable for lock-up securities, including the Class B Common Stock
(including any sale, transfer, appropriation or other disposition with respect to such securities in connection with any
such pledge, charge, lien, mortgage, hypothecation or other granting of a security interest) to or for the benefit of
one or more banks, financial or other lending institutions or other finance counterparties (as well as any security
agent, securities intermediary and/or custodian) as collateral or security for or in connection with any margin loan or
other loans, advances or extensions of credit or other financing transaction entered into by the lock-up party or any
of its direct or indirect affiliates, and any sales, transfers appropriations or other dispositions of such securities to the
applicable pledgee(s) or other third parties upon or following foreclosure upon or enforcement of such securities in
accordance with the terms of the documentation governing any margin loan or other loan, advance, or extension of
credit or other financing transaction (including, without limitation, pursuant to any agreement or arrangement
existing as of the date of execution of the lock-up agreement); provided that, with respect to any pledge, charge, lien,
mortgage, hypothecation or other granting of a security interest under this clause (l) after the execution of the lock-
up agreement, the applicable pledgee(s) shall, upon any foreclosure on the pledged securities during the restricted
67
period, sign and deliver a lock-up agreement substantially in the form of the lock-up agreement entered into by the
lock-up party, and provided further that no filing under the Exchange Act, or any other public filing or disclosure, by
or on behalf of the lock-up party, shall be voluntarily made during the restricted period in connection therewith; or
(m) transactions as permitted with the prior written consent of the representatives.
In order to facilitate the offering of the Class A common stock, the underwriters may engage in transactions that
stabilize, maintain, or otherwise affect the price of the Class A common stock. Specifically, the underwriters may
sell more shares than they are obligated to purchase under the underwriting agreement, creating a short position. A
short sale is covered if the short position is no greater than the number of shares available for purchase by the
underwriters under the option. The underwriters can close out a covered short sale by exercising the option or
purchasing shares in the open market. In determining the source of shares to close out a covered short sale, the
underwriters will consider, among other things, the open market price of shares compared to the price available
under the option. The underwriters may also sell shares in excess of the option, creating a naked short position. The
underwriters must close out any naked short position by purchasing shares in the open market. A naked short
position is more likely to be created if the underwriters are concerned that there may be downward pressure on the
price of the Class A common stock in the open market after pricing that could adversely affect investors who
purchase in this offering. As an additional means of facilitating this offering, the underwriters may bid for, and
purchase, shares of Class A common stock in the open market to stabilize the price of the Class A common stock.
These activities may raise or maintain the market price of the Class A common stock above independent market
levels or prevent or retard a decline in the market price of the Class A common stock. The underwriters are not
required to engage in these activities and may end any of these activities at any time.
We, the selling stockholders and the underwriters have agreed to indemnify each other against certain liabilities,
including liabilities under the Securities Act.
A prospectus in electronic format may be made available on websites maintained by one or more underwriters,
or selling group members, if any, participating in this offering. The representatives may agree to allocate a number
of shares of Class A common stock to underwriters for sale to their online brokerage account holders. Internet
distributions will be allocated by the representatives to underwriters that may make Internet distributions on the
same basis as other allocations.
The underwriters and their respective affiliates are full service financial institutions engaged in various
activities, which may include securities trading, commercial and investment banking, financial advisory, investment
management, investment research, principal investment, hedging, financing and brokerage activities. Certain of the
underwriters and their respective affiliates have, from time to time, performed, and may in the future perform,
various financial advisory and investment banking services for us, for which they received or will receive customary
fees and expenses. In particular, some of the underwriters or their affiliates also serve as the agent or lenders under
our 2025 Amended and Restated Credit Agreement and have received, and may in the future receive, customary fees
and commissions with respect to their roles thereunder.
In addition, in the ordinary course of their various business activities, the underwriters and their respective
affiliates may make or hold a broad array of investments and actively trade debt and equity securities (or related
derivative securities) and financial instruments (including bank loans) for their own account and for the accounts of
their customers and may at any time hold long and short positions in such securities and instruments. Such
investment and securities activities may involve our securities and instruments. The underwriters and their
respective affiliates may also make investment recommendations or publish or express independent research views
in respect of such securities or instruments and may at any time hold, or recommend to clients that they acquire, long
or short positions in such securities and instruments.
Pricing of the Offering
Our Class A common stock is listed on the NYSE under the symbol “NP.” The public offering price will be
determined by negotiations between us and the representatives. Among the factors considered in determining the
public offering price were our future prospects and those of our industry in general, our sales, earnings and certain
other financial and operating information in recent periods, and the price-earnings ratios, price-sales ratios, market
68
prices of securities, and certain financial and operating information of companies engaged in activities similar to
ours.
Selling Restrictions
European Economic Area
In relation to each Member State of the European Economic Area (each, a “Member State”), no shares of our
Class A common stock have been offered or will be offered pursuant to the offering to the public in that Member
State prior to the publication of a prospectus in relation to our Class A common stock which has been approved by
the competent authority in that Member State or, where appropriate, approved in another Member State and notified
to the competent authority in that Member State, all in accordance with the Prospectus Regulation, except that offers
of our Class A common stock may be made to the public in that Member State at any time under the following
exemptions under the Prospectus Regulation:
(1)to any legal entity which is a qualified investor as defined in the Prospectus Regulation;
(2)to fewer than 150 natural or legal persons (other than qualified investors as defined in the Prospectus
Regulation), subject to obtaining the prior consent of the representatives; or
(3)in any other circumstances falling within Article 1(4) of the Prospectus Regulation,
provided that no such offer of shares shall require us or any of the representatives to publish a prospectus
pursuant to Article 3 of the Prospectus Regulation or supplement a prospectus pursuant to Article 23 of the
Prospectus Regulation, and each person who initially acquires any shares or to whom any offer is made will be
deemed to have represented, acknowledged and agreed to and with each of the representatives and us that it is a
“qualified investor” within the meaning of Article 2(e) in the Prospectus Regulation.
In the case of any shares being offered to a financial intermediary as that term is used in Article 5 of the
Prospectus Regulation, each such financial intermediary will be deemed to have represented, acknowledged, and
agreed that the shares acquired by it in the offer have not been acquired on a nondiscretionary basis on behalf of, nor
have they been acquired with a view to their offer or resale to, persons in circumstances which may give rise to an
offer of any shares to the public other than their offer or resale in a Member State to qualified investors as so defined
or in circumstances in which the prior consent of the representatives has been obtained to each such proposed offer
or resale.
For the purposes of this provision, the expression an “offer of shares to the public” in relation to any shares in
any Member State means the communication in any form and by any means of sufficient information on the terms of
the offer and the shares of our Class A common stock to be offered so as to enable an investor to decide to purchase
or subscribe for any shares of our Class A common stock, the expression “Prospectus Regulation” means Regulation
(EU) 2017/1129 (as amended).
United Kingdom
This prospectus has been prepared on the basis that the offering of the securities falls within one of the
exceptions specified in Part 1 of Schedule 1 of the Public Offers and Admissions to Trading Regulations 2024 (the
“POATRs”) and accordingly there will not be a prospectus prepared or published for the purposes of the POATRs.
This prospectus does not constitute a prospectus for the purposes of the POATRs.
Each underwriter has represented and agreed that it has not made and will not make an offer of securities which
are the subject of this prospectus to the public in the United Kingdom except that it may make an offer:
(1)at any time to any legal entity which is a qualified investor as defined in paragraph 15 of Schedule 1 to the
POATRs;
69
(2)at any time to fewer than 150 persons (other than qualified investors as defined in paragraph 15 of Schedule
1 to the POATRs) in the United Kingdom subject to obtaining the prior consent of the relevant Manager or
Managers nominated by the Issuer for any such offer; or
(3)at any time in any other circumstances falling within Part 1 of Schedule 1 to the POATRs.
For the purposes of this provision, the expression an offer of securities to the public in relation to any securities
means the communication in any form and by any means of sufficient information on the terms of the offer and the
securities to be offered so as to enable an investor to decide to buy or subscribe for the securities.
Japan
No registration pursuant to Article 4, paragraph 1 of the Financial Instruments and Exchange Law of Japan
(Law No. 25 of 1948, as amended) (the “FIEL”), has been made or will be made with respect to the solicitation of
the application for the acquisition of the shares of Class A common stock.
Accordingly, the shares of Class A common stock have not been, directly or indirectly, offered or sold and will
not be, directly or indirectly, offered or sold in Japan or to, or for the benefit of, any resident of Japan (which term as
used herein means any person resident in Japan, including any corporation or other entity organized under the laws
of Japan) or to others for re-offering or re-sale, directly or indirectly, in Japan or to, or for the benefit of, any resident
of Japan except pursuant to an exemption from the registration requirements, and otherwise in compliance with, the
FIEL and the other applicable laws and regulations of Japan.
For Qualified Institutional Investors
Please note that the solicitation for newly-issued or secondary securities (each as described in Paragraph 2,
Article 4 of the FIEL) in relation to the shares of Class A common stock constitutes either a “QII only private
placement” or a “QII only secondary distribution” (each as described in Paragraph 1, Article 23-13 of the FIEL).
Disclosure regarding any such solicitation, as is otherwise prescribed in Paragraph 1, Article 4 of the FIEL, has not
been made in relation to the shares of Class A common stock. The shares of Class A common stock may only be
transferred to QIIs.
For Non-QII Investors
Please note that the solicitation for newly-issued or secondary securities (each as described in Paragraph 2,
Article 4 of the FIEL) in relation to the shares of Class A common stock constitutes either a “small number private
placement” or a “small number private secondary distribution” (each as is described in Paragraph 4, Article 23-13 of
the FIEL). Disclosure regarding any such solicitation, as is otherwise prescribed in Paragraph 1, Article 4 of the
FIEL, has not been made in relation to the shares of Class A common stock. The shares of Class A common stock
may only be transferred en bloc without subdivision to a single investor.
Brazil
The offer and sale of our shares of Class A common stock has not been, and will not be, registered (or exempted
from registration) with the Brazilian securities commission, Comissão de Valores Mobiliários (“CVM”), and,
therefore, will not be carried out by any means that would constitute a public offering in Brazil under CVM
resolution No. 160, dated July 13, 2022, as amended, or unauthorized distribution under Brazilian laws and
regulations. The shares of our Class A common stock will be authorized for trading on organized non-Brazilian
securities markets and may only be offered to Brazilian professional investors (as defined by the applicable CVM
regulation), who may only acquire our shares of Class A common stock through a non-Brazilian account, with
settlement outside Brazil in non-Brazilian currency. The trading of these securities on regulated securities markets in
Brazil is prohibited.
Switzerland
The shares of Class A common stock may not be publicly offered in Switzerland and will not be listed on the
SIX Swiss Exchange (“SIX”) or on any other stock exchange or regulated trading facility in Switzerland.
70
This document does not constitute a prospectus within the meaning of, and has been prepared without regard to
the disclosure standards for issuance prospectuses under art. 652a or art. 1156 of the Swiss Code of Obligations or
the disclosure standards for listing prospectuses under art. 27 ff. of the SIX Listing Rules or the listing rules of any
other stock exchange or regulated trading facility in Switzerland. Neither this document nor any other offering or
marketing material relating to the shares of our Class A common stock or the offering may be publicly distributed or
otherwise made publicly available in Switzerland. Neither this document nor any other offering or marketing
material relating to the offering, us, or the shares of our Class A common stock have been or will be filed with or
approved by any Swiss regulatory authority. In particular, this document will not be filed with, and the offer of our
Class A common stock will not be supervised by, the Swiss Financial Market Supervisory Authority, and the offer
of Class A common stock has not been and will not be authorized under the Swiss Federal Act on Collective
Investment Schemes (“CISA”). The investor protection afforded to acquirers of interests in collective investment
schemes under the CISA does not extend to acquirers of shares of our Class A common stock.
Canada
The shares of Class A common stock may be sold only to purchasers purchasing, or deemed to be purchasing,
as principal that are accredited investors, as defined in National Instrument 45-106 Prospectus Exemptions or
subsection 73.3(1) of the Securities Act (Ontario), and are permitted clients, as defined in National
Instrument 31-103 Registration Requirements, Exemptions and Ongoing Registrant Obligations. Any resale of the
shares of Class A common stock must be made in accordance with an exemption from, or in a transaction not
subject to, the prospectus requirements of applicable securities laws.
Securities legislation in certain provinces or territories of Canada may provide a purchaser with remedies for
rescission or damages if this prospectus (including any amendment thereto) contains a misrepresentation, provided
that the remedies for rescission or damages are exercised by the purchaser within the time limit prescribed by the
securities legislation of the purchaser’s province or territory. The purchaser should refer to any applicable provisions
of the securities legislation of the purchaser’s province or territory for particulars of these rights or consult with a
legal advisor.
Pursuant to section 3A.3 (or, in the case of securities issued or guaranteed by the government of a non-Canadian
jurisdiction, section 3A.4) of National Instrument 33-105 Underwriting Conflicts (“NI 33-105”), the underwriters
are not required to comply with the disclosure requirements of NI 33-105 regarding underwriter conflicts of interest
in connection with this offering.
Hong Kong
Shares of our Class A common stock may not be offered or sold by means of any document other than (i) in
circumstances which do not constitute an offer to the public within the meaning of the Companies Ordinance (Cap.
32, Laws of Hong Kong), (ii) to “professional investors” within the meaning of the Securities and Futures Ordinance
(Cap. 571, Laws of Hong Kong) and any rules made thereunder, or (iii) in other circumstances which do not result in
the document being a “prospectus” within the meaning of the Companies Ordinance (Cap. 32, Laws of Hong Kong),
and no advertisement, invitation or document relating to shares of our Class A common stock may be issued or may
be in the possession of any person for the purpose of issue (in each case whether in Hong Kong or elsewhere), which
is directed at, or the contents of which are likely to be accessed or read by, the public in Hong Kong (except if
permitted to do so under the laws of Hong Kong) other than with respect to shares of our Class A common stock
which are or are intended to be disposed of only to persons outside Hong Kong or only to “professional investors”
within the meaning of the Securities and Futures Ordinance (Cap. 571, Laws of Hong Kong) and any rules made
thereunder.
Singapore
This prospectus has not been registered as a prospectus with the Monetary Authority of Singapore. Accordingly,
this prospectus and any other document or material in connection with the offer or sale, or invitation for subscription
or purchase, of shares of our Class A common stock may not be circulated or distributed, nor may the shares of
Class A common stock be offered or sold, or be made the subject of an invitation for subscription or purchase,
whether directly or indirectly, to persons in Singapore other than (i) to an institutional investor pursuant to
71
Section 274 of the Securities and Futures Act, Chapter 289 of Singapore (the “SFA”), (ii) to a relevant person or any
person pursuant to Section 275(1A) of the SFA, and in accordance with the conditions specified in Section 275 of
the SFA, or (iii) otherwise pursuant to, and in accordance with the conditions of, any other applicable provision of
the SFA.
Where shares of Class A common stock are subscribed or purchased under Section 275 by a relevant person
which is:
(1)a corporation (which is not an accredited investor (as defined in Section 4A of the SFA)) the sole business
of which is to hold investments and the entire share capital of which is owned by one or more individuals,
each of whom is an accredited investor; or
(2)a trust (where the trustee is not an accredited investor) whose sole purpose is to hold investments and each
beneficiary of the trust is an individual who is an accredited investor, securities or securities based
derivatives contracts (each as defined in Section 2(1) of the SFA) of that corporation or the beneficiaries’
rights and interest in that trust shall not be transferable within six months after that corporation or that trust
has acquired shares of Class A common stock under Section 275 of the SFA except:
(1)to an institutional investor or to a relevant person, or to any person pursuant to Section 275(1A), and in
accordance with the conditions, specified in Section 275 of the SFA;
(2)where no consideration is or will be given for the transfer;
(3)where the transfer is by operation of law;
(4)as specified in Section 276(7) of the SFA; or
(5)as specified in Regulation 37A of the Securities and Futures (Offers of Investments) (Securities and
Securities based Derivatives Contracts) Regulation 2018.
Solely for purposes of the notification requirements under Section 309B(1)(c) of the SFA, we have determined,
and hereby notify all relevant persons, that the shares are “prescribed capital markets products” (as defined in the
Securities and Futures (Capital Markets Products) Regulations 2018) and Excluded Investment Products (as defined
in MAS Notice SFA 04-N12: Notice on the Sale of Investment Products and MAS Notice FAA-N16: Notice on
Recommendations on Investment Products).
Australia
No placement document, prospectus, product disclosure statement or other disclosure document has been
lodged with the Australian Securities and Investments Commission in relation to the offering. This prospectus does
not constitute a prospectus, product disclosure statement or other disclosure document under the Corporations
Act 2001(the “Corporations Act”), and does not purport to include the information required for a prospectus, product
disclosure statement or other disclosure document under the Corporations Act.
Any offer in Australia of the shares may only be made to persons (the “Exempt Investors”) who are
“sophisticated investors” (within the meaning of section 708(8) of the Corporations Act), “professional
investors” (within the meaning of section 708(11) of the Corporations Act) or otherwise pursuant to one or more
exemptions contained in section 708 of the Corporations Act so that it is lawful to offer the shares without disclosure
to investors under Chapter 6D of the Corporations Act.
The shares applied for by Exempt Investors in Australia must not be offered for sale in Australia in the period of
12 months after the date of allotment under the offering, except in circumstances where disclosure to investors under
Chapter 6D of the Corporations Act would not be required pursuant to an exemption under section 708 of the
Corporations Act or otherwise or where the offer is pursuant to a disclosure document which complies with
Chapter 6D of the Corporations Act. Any person acquiring shares must observe such Australian on-sale restrictions.
72
This prospectus contains general information only and does not take into account the investment objectives,
financial situation or particular needs of any particular person. It does not contain any securities recommendations or
financial product advice. Before making an investment decision, investors need to consider whether the information
in this prospectus is appropriate for their needs, objectives and circumstances, and, if necessary, seek expert advice
on those matters.
Dubai International Financial Centre
This prospectus relates to an Exempt Offer in accordance with the Offered Securities Rules of the Dubai
Financial Services Authority (the “DFSA”). This prospectus is intended for distribution only to persons of a type
specified in the Offered Securities Rules of the DFSA. It must not be delivered to, or relied on by, any other person.
The DFSA has no responsibility for reviewing or verifying any documents in connection with Exempt Offers. The
DFSA has not approved this prospectus nor taken steps to verify the information set forth herein and has no
responsibility for the prospectus. The shares of Class A common stock to which this prospectus relates may be
illiquid and/or subject to restrictions on their resale. Prospective purchasers of the shares offered should conduct
their own due diligence on the shares. If you do not understand the contents of this prospectus you should consult an
authorized financial advisor.
Bermuda
Shares of Class A common stock may be offered or sold in Bermuda only in compliance with the provisions of
the Investment Business Act of 2003 of Bermuda which regulates the sale of securities in Bermuda. Additionally,
non-Bermudian persons (including companies) may not carry on or engage in any trade or business in Bermuda
unless such persons are permitted to do so under applicable Bermuda legislation.
73
LEGAL MATTERS
The validity of the Class A common stock being offered by this prospectus will be passed upon for us by
Orrick, Herrington & Sutcliffe LLP, San Francisco, California. Certain legal matters relating to this offering will be
passed upon for the underwriters by Davis Polk & Wardwell LLP, New York, New York.
EXPERTS
The financial statements incorporated in this Prospectus by reference to the Annual Report on Form 10-K for
the year ended December 31, 2025, have been so incorporated in reliance on the report of PricewaterhouseCoopers
LLP, an independent registered public accounting firm, given on the authority of said firm as experts in auditing and
accounting.
WHERE YOU CAN FIND ADDITIONAL INFORMATION
We have filed with the SEC this registration statement on Form S-1 under the Securities Act with respect to the
shares of Class A common stock being offered by this prospectus. This prospectus, which constitutes a part of this
registration statement, does not contain all of the information in this registration statement and its exhibits. For
further information with respect to us and the Class A common stock offered by this prospectus, you should refer to
this registration statement and the exhibits filed as a part of this document. Statements contained in this prospectus
as to the contents of any contract or any other document referred to are not necessarily complete, and in each
instance, we refer you to the copy of the contract or other document filed as an exhibit to this registration statement.
Each of these statements is qualified in all respects by this reference.
We are subject to the informational requirements of the Exchange Act and, in accordance with the Exchange
Act, are required to file annual, quarterly and current reports, proxy statements and other information with the SEC.
You can read our SEC filings, including this registration statement, over the internet on the SEC’s website at http://
www.sec.gov. We also maintain a website at www.neptuneflood.com. You may access these materials free of charge
as soon as reasonably practicable after they are electronically filed with, or furnished to, the SEC. The information
contained on our website is not a part of this prospectus and the inclusion of our website address in this prospectus is
an inactive textual reference only.
INCORPORATION BY REFERENCE OF CERTAIN DOCUMENTS
We are incorporating by reference specified documents that we have filed with the SEC, which means that we
can disclose important information to you by referring you to those documents that are considered part of this
prospectus. We incorporate by reference into this prospectus the documents listed below (other than portions of
these documents furnished under Item 2.02 or Item 7.01 of a Current Report on Form 8-K):
•Our Annual Report on Form 10-K for the year ended December 31, 2025, filed with the SEC on February
26, 2026 (including information specifically incorporated by reference into such Annual Report on Form
10-K from our Proxy Statement for our 2026 Annual Meeting of Stockholders filed with the SEC on April
17, 2026);
•Our Quarterly Report on Form 10-Q for the quarter ended March 31, 2026, filed with the SEC on April 29,
2026;
•Our Current Report on Form 8-K, filed with the SEC on April 22, 2026; and
•The description of our Class A common stock set forth in Exhibit 4.3 to our Annual Report on Form 10-K
for the fiscal year ended December 31, 2025, filed with the SEC on February 26, 2026.
Any statement contained in a document incorporated by reference herein will be deemed to be modified or
superseded for purposes of this prospectus to the extent that a statement contained in this prospectus or any other
subsequently filed document that is incorporated by reference herein modifies or supersedes the statement. Any
statement so modified or superseded will not be deemed, except as so modified or superseded, to constitute a part of
this prospectus.
74
Our filings with the SEC, including our Annual Report on Form 10-K, Quarterly Reports on Form 10-Q,
Current Reports on Form 8-K and amendments to those reports, are available free of charge on our website (https://
investors.neptuneflood.com/) as soon as reasonably practicable after they are filed with, or furnished to, the SEC.
Our website and the information contained on that site, or connected to that site, are not incorporated into and are
not a part of this prospectus except for the documents specifically incorporated by reference as noted above. You
may also obtain a copy of these filings at no cost by writing or telephoning us at the following address:
Neptune Insurance Holdings Inc.
Investor Relations
400 6th Street S., Suite 2
St. Petersburg, Florida 33701
Tel. No. (727) 387-6467

II-1
Part II
Information Not Required in Prospectus
Item 13. Other Expenses of Issuance and Distribution
The following table sets forth the costs and expenses in connection with the sale of the shares of common stock
being registered hereby. All amounts are estimates except for the SEC registration fee and the FINRA filing fee and
the listing fee.
SEC registration fee .............................................................................................................................. | $32,445.08 |
FINRA filing fee ................................................................................................................................... | $35,090.85 |
Printing and engraving expenses .......................................................................................................... | $65,000.00 |
Legal fees and expenses ........................................................................................................................ | $425,000.00 |
Accounting fees and expenses .............................................................................................................. | $275,000.00 |
Transfer agent and registrar fees and expenses ..................................................................................... | $5,000.00 |
Miscellaneous fees and expenses .......................................................................................................... | $5,000.00 |
Total ...................................................................................................................................................... | $842,535.93 |
__________________
Item 14. Indemnification of Directors and Officers.
Section 145 of the DGCL authorizes a corporation to indemnify its directors and officers against liabilities
arising out of actions, suits and proceedings to which they are made or threatened to be made a party by reason of
the fact that they have served or are currently serving as a director or officer to a corporation. The indemnity may
cover expenses (including attorneys’ fees) judgments, fines, and amounts paid in settlement actually and reasonably
incurred by the director or officer in connection with any such action, suit or proceeding. Section 145 permits
corporations to pay expenses (including attorneys’ fees) incurred by directors and officers in advance of the final
disposition of such action, suit or proceeding. In addition, Section 145 provides that a corporation has the power to
purchase and maintain insurance on behalf of its directors and officers against any liability asserted against them and
incurred by them in their capacity as a director or officer, or arising out of their status as such, whether or not the
corporation would have the power to indemnify the director or officer against such liability under Section 145.
As permitted by the DGCL, our amended and restated certificate of incorporation contains provisions that
eliminate the personal liability of its directors and certain of its officers for monetary damages for any breach of
fiduciary duties as a director or officer, except liability for the following:
•any breach of the director’s duty of loyalty to us or our stockholders;
•acts or omissions not in good faith or that involve intentional misconduct or a knowing violation of law;
•for directors, any under Section 174 of the DGCL (regarding unlawful dividends and stock purchases);
•any transaction from which the director derived an improper personal benefit; or
•for officers, for any action by or in the right of the Company.
As permitted by the DGCL, our amended and restated bylaws provide that:
•we are required to indemnify our directors and officers to the fullest extent permitted by the DGCL, as it
now exists or may in the future be amended;
•we may indemnify our other employees and agents as set forth in the DGCL;
•we are required to advance expenses, as incurred, to our directors and officers in connection with a legal
proceeding to the fullest extent permitted by the DGCL, subject to limited exceptions; and
II-2
•the rights conferred in the bylaws are not exclusive.
We have entered, and intend to continue to enter, into separate indemnification agreements with our current
directors and executive officers to provide these directors and executive officers additional contractual assurances
regarding the scope of the indemnification set forth in our amended and restated certificate of incorporation and
amended and restated bylaws and to provide additional procedural protections. The indemnification provisions in
our amended and restated certificate of incorporation, amended and restated bylaws and the indemnification
agreements entered into or to be entered into between us and each of our directors and executive officers may be
sufficiently broad to permit indemnification of our directors and executive officers for liabilities arising under the
Securities Act.
We have directors’ and officers’ liability insurance that covers certain liabilities of our directors and officers
arising out of claims based on acts or omissions in their capacities as directors or officers.
The underwriting agreement filed as Exhibit 1.1 to this registration statement provides for indemnification of us
and our directors and officers by the underwriters against certain liabilities under the Securities Act and the
Exchange Act.
Item 15. Recent Sales of Unregistered Securities.
Set forth below is information regarding shares of capital stock issued by us since January 1, 2023, that were not
registered under the Securities Act. Also included is the consideration, if any, received by us for such shares and
information relating to the section of the Securities Act or SEC rule under which exemption from registration was
claimed. All information below has been adjusted for the 10-for-1 stock split of our capital stock that was effected
on September 9, 2025.
•From January 1, 2023, to September 26, 2025, we granted stock options to purchase an aggregate of
18,088,500 shares of our Class A common stock under our Amended and Restated 2025 Stock Plan, with
a weighted average exercise price of $7.52 per share, of which 448,500 options were forfeited prior to the
IPO in accordance with their terms, 2,835,000 options were exercised prior to the IPO with a weighted
average exercise price of $5.50, 5,880,000 options terminated at the time of the IPO in accordance with
their terms and the remainder are fully vested.
•On May 10, 2023, we issued and sold an aggregate of 41,850,000 shares of our convertible preferred stock,
at a purchase price of $5.495 per share for an aggregate purchase price of $230 million.
•On April 10, 2025, pursuant to our corporate reorganization, Neptune Holdings issued 93,350,000 shares of
its common stock and 41,850,000 shares of its convertible preferred stock to the prior holders of shares of
common stock and convertible preferred stock, respectively, of Neptune Flood. Pursuant to the
reorganization, (i) each issued and outstanding share of common stock of Neptune Flood was converted
into one share of common stock of Neptune Holdings, (ii) each issued and outstanding share of convertible
preferred stock of Neptune Flood was converted into one share of convertible preferred stock of Neptune
Holdings, and (iii) the issued, outstanding and unexercised portions, whether or not vested or exercisable,
of all options to purchase Neptune Flood common stock granted under the Neptune Flood stock plan were
assumed by Neptune Holdings and thereafter became exercisable for the same number of shares of
common stock of Neptune Holdings.
None of the foregoing transactions involved any underwriters, underwriting discounts or commissions, or any
public offering. The sales of the above securities were deemed to be exempt from registration under the Securities
Act in reliance upon Section 4(a)(2) of the Securities Act (or of Regulation D promulgated thereunder) or pursuant
to benefit plans and contracts relating to compensation as provided under Rule 701. The recipients of the securities
in each of these transactions represented their intentions to acquire the securities for investment only and not with a
view to or for sale in connection with any distribution thereof, and appropriate legends were placed upon the stock
certificates issued in these transactions.
II-3
Item 16. Exhibits and Financial Statement Schedules.
(a) Exhibits.
Exhibit Number | Exhibit Title | |
1.1* | ||
2.1 | ||
3.1 | ||
3.2 | ||
4.1 | ||
4.2 | ||
5.1* | ||
10.1 | ||
10.2+ | ||
10.3+ | ||
10.4+ | ||
10.5+ | ||
10.6 | ||
10.7⸸ | ||
10.8 | ||
10.9 | ||
10.10⸸ | ||
21.1 | ||
23.1* |
II-4
__________________
* Filed herewith.
+ Indicates a management contract or compensatory plan or arrangement.
⸸ Certain of the exhibits and schedules to this exhibit have been omitted in accordance with Regulation S-K Item 601(a)(5). The Company
agrees to furnish a copy of all omitted exhibits and schedules to the SEC upon its request.
(b) Financial Statement Schedules.
All other financial statement schedules are omitted because they are not applicable or because the information is
included in the Company’s audited consolidated financial statements or related notes.
Item 17. Undertakings.
The undersigned Registrant hereby undertakes to provide to the underwriters at the closing specified in the
underwriting agreement certificates in such denominations and registered in such names as required by the
underwriters to permit prompt delivery to each purchaser.
Insofar as indemnification for liabilities arising under the Securities Act may be permitted to directors, officers
and controlling persons of the Registrant pursuant to provisions described in Item 14 above, or otherwise, the
Registrant has been advised that in the opinion of the SEC such indemnification is against public policy as expressed
in the Securities Act and is, therefore, unenforceable. In the event that a claim for indemnification against such
liabilities (other than the payment by the Registrant of expenses incurred or paid by a director, officer or controlling
person of the Registrant in the successful defense of any action, suit or proceeding) is asserted by such director,
officer or controlling person in connection with the securities being registered, the Registrant will, unless in the
opinion of its counsel the matter has been settled by controlling precedent, submit to a court of appropriate
jurisdiction the question whether such indemnification by it is against public policy as expressed in the Securities
Act and will be governed by the final adjudication of such issue.
The undersigned Registrant hereby undertakes that:
(1)for purposes of determining any liability under the Securities Act, the information omitted from the
form of prospectus filed as part of this registration statement in reliance upon Rule 430A and
contained in a form of prospectus filed by the Registrant pursuant to Rule 424(b)(1) or (4) or
497(h) under the Securities Act shall be deemed to be part of this registration statement as of the time
it was declared effective.
(2)for the purpose of determining any liability under the Securities Act, each post-effective amendment
that contains a form of prospectus shall be deemed to be a new registration statement relating to the
securities offered therein, and the offering of such securities at that time shall be deemed to be the
initial bona fide offering thereof.
II-5
Signatures
Pursuant to the requirements of the Securities Act, the Registrant has duly caused this Registration Statement to
be signed on its behalf by the undersigned, thereunto duly authorized, in the City of St. Petersburg, State of Florida,
on May 11, 2026.
Neptune Insurance Holdings Inc. | ||
By: | /s/ Trevor Burgess | |
Trevor Burgess | ||
Chief Executive Officer and Chairman of the Board of Directors | ||
KNOW ALL PERSONS BY THESE PRESENTS, that each individual whose signature appears below
constitutes and appoints Trevor Burgess and Jim Steiner, and each of them, such individual’s true and lawful
attorneys-in-fact and agents with full power of substitution, for such individual and in such individual’s name, place
and stead, in any and all capacities, to sign any and all amendments (including post-effective amendments) to this
Registration Statement, and to sign any registration statement for the same offering covered by the Registration
Statement that is to be effective upon filing pursuant to Rule 462(b) promulgated under the Securities Act, and all
post-effective amendments thereto, and to file the same, with all exhibits thereto and any and all applications and
other documents in connection therewith, with the SEC, granting unto said attorneys-in-fact and agents, and each of
them, full power and authority to do and perform each and every act and thing requisite and necessary to be done in
and about the premises, as fully to all intents and purposes as such individual might or could do in person, hereby
ratifying and confirming all that said attorneys-in-fact and agents, or any of them or their substitute or substitutes,
may lawfully do or cause to be done or by virtue hereof.
Pursuant to the requirements of the Securities Act, this Registration Statement has been signed by the following
persons in the capacities and on the dates indicated:
Name | Title | Date | ||
/s/ Trevor Burgess | Chief Executive Officer and Chairman of the Board of Directors (principal executive officer) | May 11, 2026 | ||
Trevor Burgess | ||||
/s/ Jim Steiner | Chief Financial Officer and Director (principal financial and accounting officer) | May 11, 2026 | ||
Jim Steiner | ||||
/s/ Jonathan Carlon | Director | May 11, 2026 | ||
Jonathan Carlon | ||||
/s/ Blair J. Greenberg | Director | May 11, 2026 | ||
Blair J. Greenberg | ||||
/s/ Cristian Melej | Director | May 11, 2026 | ||
Cristian Melej | ||||
/s/ Mike Vostrizansky | Director | May 11, 2026 | ||
Mike Vostrizansky |
By: | /s/ Trevor Burgess | |
Trevor Burgess | ||
Attorney-in-Fact |