As filed with the U.S. Securities and Exchange Commission on May 11, 2026.
Registration No. 333-295165
UNITED STATES
SECURITIES AND EXCHANGE COMMISSION
Washington, D.C. 20549
FORM S-1
Amendment No. 3 to
REGISTRATION STATEMENT
UNDER
THE SECURITIES ACT OF 1933
Fervo Energy Company
(Exact name of registrant as specified in its charter)
Delaware | 4911 | 823168838 |
(State or other jurisdiction of incorporation or organization) | (Primary Standard Industrial Classification Code Number) | (I.R.S. Employer Identification No.) |
811 Main Street,
Suite 1700
Houston, TX 77002
(832) 554-3253
(Address, including zip code, and telephone number, including area code, of registrant’s principal executive offices)
Gustavo Torres
811 Main Street,
Suite 1700
Houston, TX 77002
(832) 554-3253
(Name, address, including zip code, and telephone number, including area code, of agent for service)
Copies to:
Ryan J. Maierson Nick S. Dhesi John J. Slater Latham & Watkins LLP 811 Main Street, Suite 3700 Houston, Texas 77002 (713) 546-5400 | Sarah K. Morgan Jackson A. O’Maley Alexandra M. Lewis Vinson & Elkins L.L.P. 845 Texas Avenue, Suite 4700 Houston, Texas 77002 (713) 758-2222 |
APPROXIMATE DATE OF COMMENCEMENT OF PROPOSED SALE TO THE PUBLIC: AS SOON AS PRACTICABLE AFTER THIS
REGISTRATION STATEMENT IS DECLARED EFFECTIVE.
If any of the securities being registered on this form are to be offered on a delayed or continuous basis pursuant to Rule 415 under the Securities Act of 1933, check
the following box. ☐
If this form is filed to register additional securities for an offering pursuant to Rule 462(b) under the Securities Act, check the following box and list the Securities
Act registration statement number of the earlier effective registration statement for the same offering. ☐
If this form is a post-effective amendment filed pursuant to Rule 462(c) under the Securities Act, check the following box and list the Securities Act registration
statement number of the earlier effective registration statement for the same offering. ☐
If this form is a post-effective amendment filed pursuant to Rule 462(d) under the Securities Act, check the following box and list the Securities Act registration
statement number of the earlier effective registration statement for the same offering. ☐
Indicate by check mark whether the registrant is a large accelerated filer, an accelerated filer, a non-accelerated filer, a smaller reporting company, or an emerging
growth company. See the definitions of “large accelerated filer,” “accelerated filer,” “smaller reporting company” and “emerging growth company” in Rule 12b-2 of
the Exchange Act.
Large accelerated filer | ☐ | Accelerated filer | ☐ |
Non-accelerated filer | ☒ | Smaller reporting company | ☒ |
Emerging growth company | ☒ |
If an emerging growth company, indicate by check mark if the registrant has elected not to use the extended transition period for complying with any new or revised
financial accounting standards provided pursuant to Section 7(a)(2)(B) of the Securities Act. ☐
The Registrant hereby amends this Registration Statement on such date or dates as may be necessary to delay its effective date until the Registrant shall
file a further amendment which specifically states that this Registration Statement shall thereafter become effective in accordance with Section 8(a) of the
Securities Act of 1933 or until the Registration Statement shall become effective on such date as the Securities and Exchange Commission, acting pursuant
to said Section 8(a), may determine.

The information in this preliminary prospectus is not complete and may be changed. These securities may not be sold until the registration statement filed
with the Securities and Exchange Commission is effective. This preliminary prospectus is not an offer to sell these securities, and it is not soliciting an offer
to buy these securities in any jurisdiction where the offer or sale is not permitted.
Subject to Completion. Dated May 11, 2026.
70,000,000 Shares

Fervo Energy Company
Class A Common Stock
This is the initial public offering of shares of Class A common stock of Fervo Energy Company. We are offering 70,000,000 shares of our Class A common
stock.
Prior to this offering, there has been no public market for our Class A common stock. We expect that the initial public offering price per share of our Class A
common stock will be between $25.00 and $26.00. We intend to apply to list our Class A common stock on the NASDAQ under the symbol “FRVO.”
Following this offering, we will have two series of authorized common stock, Class A common stock and Class B common stock. The rights of the holders of
our Class A common stock and Class B common stock are identical, except with respect to voting, conversion and transfer rights. Each share of our Class A
common stock is entitled to one vote per share. Each share of our Class B common stock is entitled to 40 votes per share and is convertible at any time, subject to
the satisfaction of certain conditions as described herein, into one share of Class A common stock. Immediately following the completion of this offering, all
outstanding shares of Class B common stock will be beneficially owned by Tim Latimer, our Chief Executive Officer and Chair of our board of directors, and Jack
Norbeck, PhD., our Chief Technical Officer. Assuming no exercise of the underwriters’ option to purchase additional shares to cover over-allotments, if any, and
assuming Mr. Latimer and Dr. Norbeck do not purchase any shares of Class A common stock pursuant to the reserved share program, Mr. Latimer and Dr. Norbeck
will beneficially own, in the aggregate, approximately 2.75% of our outstanding capital stock and control approximately 53.03% of the voting power of our
outstanding capital stock. As a result, Mr. Latimer and Dr. Norbeck may have significant influence over the outcome of matters submitted to our stockholders for
approval, including the election of our directors and the approval of any change of control transaction. See “Principal Stockholders.”
We are an “emerging growth company” and a smaller reporting company as defined under the federal securities laws, and, as such, may elect to comply with
certain reduced public company reporting requirements. See “Prospectus Summary — Implications of Being an Emerging Growth Company and Smaller Reporting
Company.”
Investing in our Class A common stock involves risks. See “Risk Factors” beginning on page 39 to read about factors you should consider before
buying shares of our Class A common stock.
Per Share | Total | ||
Initial public offering price .............................................................................................................................................................. | $ | $ | |
Underwriting discounts and commissions(1) ..................................................................................................................................... | $ | $ | |
Proceeds, before expenses, to us ...................................................................................................................................................... | $ | $ |
__________________
(1)See the section titled “Underwriting” for a description of the compensation payable to the underwriters.
At our request, an affiliate of BofA Securities, Inc., a participating underwriter has reserved for sale, at the initial public offering price, up to 5% of the shares
of Class A common stock to be issued by us and offered by this prospectus for sale, to some of our directors, officers and employees and related persons. If these
persons purchase reserved shares it will reduce the number of shares available for sale to the general public. Any reserved shares that are not so purchased will be
offered by the underwriters to the general public on the same basis as the other shares offered by this prospectus. See “Underwriting—Reserved Share Program.”
We have granted the underwriters an option for a period of 30 days from the date of this prospectus to purchase up to an additional 10,500,000 shares of our
Class A common stock from us at the initial public offering price, less the underwriting discounts and commissions.
Atlas Point Energy Infrastructure Fund, LLC, Norges Bank Investment Management, a division of Norges Bank, Wellington Management, and one or more
funds and/or accounts managed by Capital Research Global Investors (collectively, the “Cornerstone Investors”) have, severally and not jointly, indicated an interest
in purchasing up to an aggregate of $350 million in shares of our Class A common stock in this offering at the initial public offering price and on the same terms and
conditions as the other purchasers in this offering. The shares of Class A common stock to be purchased by the Cornerstone Investors will not be subject to a lock-
up agreement with the underwriters. Because this indication of interest is not a binding agreement or commitment to purchase, the Cornerstone Investors may
determine to purchase more, fewer, or no shares in this offering, or the underwriters may determine to sell more, fewer, or no shares to the Cornerstone Investors.
The underwriters will receive the same underwriting discount on any shares of our Class A common stock purchased by the Cornerstone Investors as they will from
the other shares sold to the public in this offering.
Neither the Securities and Exchange Commission nor any state securities commission or any other regulatory body has approved or disapproved of these
securities or passed upon the accuracy or adequacy of this prospectus. Any representation to the contrary is a criminal offense.
The underwriters expect to deliver the shares to purchasers on or about , 2026.
Joint Lead Bookrunning Managers
J.P. Morgan | BofA Securities | RBC Capital Markets | Barclays |
Bookrunning Managers
Baird | BBVA | Guggenheim Securities | MUFG |
Societe Generale | William Blair | Piper Sandler | Wolfe | Nomura Alliance |
Prospectus dated , 2026.


i
TABLE OF CONTENTS
Page | |
Letter from Tim Latimer, Chief Executive Officer ........................................................................................... | |
Prospectus Summary ......................................................................................................................................... | |
The Offering ...................................................................................................................................................... | |
Market and Industry Data ................................................................................................................................. | |
Estimates of Capacity Potential ........................................................................................................................ | |
Cautionary Note Regarding Forward-Looking Statements .............................................................................. | |
Risk Factors ...................................................................................................................................................... | |
Use of Proceeds ................................................................................................................................................. | |
Dividend Policy ................................................................................................................................................ | |
Capitalization .................................................................................................................................................... | |
Dilution ............................................................................................................................................................. | |
Management's Discussion and Analysis of Financial Condition and Results of Operations ........................... | |
Business ............................................................................................................................................................ | |
Management ...................................................................................................................................................... | |
Executive and Director Compensation ............................................................................................................. | |
Principal Stockholders ...................................................................................................................................... | |
Certain Relationships and Related Party Transactions ..................................................................................... | |
Description of Capital Stock ............................................................................................................................. | |
Shares Eligible for Future Sale ......................................................................................................................... | |
Material U.S. Federal Income Tax Considerations for Non-U.S. Holders of Common Stock ........................ | |
Underwriting ..................................................................................................................................................... | |
Legal Matters .................................................................................................................................................... | |
Experts .............................................................................................................................................................. | |
Where You Can Find More Information .......................................................................................................... | |
Through and including , 2026 (the 25th day after the date of this prospectus), all dealers effecting
transactions in these securities, whether or not participating in this offering, may be required to deliver a
prospectus. This is in addition to a dealer’s obligation to deliver a prospectus when acting as an underwriter
and with respect to an unsold allotment or subscription.
You should rely only on the information contained in this prospectus, any amendment or supplement to this
prospectus or any free writing prospectus we may authorize to be delivered or made available to you. Neither we nor
the underwriters have authorized anyone to provide you with additional or different information. If anyone provides
you with additional, different or inconsistent information, you should not rely on it. Offers to sell, and solicitations
of offers to buy, shares of our Class A common stock are being made only in jurisdictions where offers and sales are
permitted. The information contained in this prospectus, any amendment or supplement to this prospectus or any
applicable free writing prospectus is accurate only as of its date, regardless of the time of delivery of this prospectus,
any amendment or supplement to this prospectus, any applicable free writing prospectus or of any sale of our Class
A common stock. Our business, financial condition, operating results and prospects may have changed since such
date.
ii
You should not consider any information in this prospectus, any amendment or supplement to this prospectus or
any applicable free writing prospectus to be investment, legal or tax advice. You should consult your own counsel,
accountant and other advisors for legal, tax, business, financial and related advice regarding the purchase of our
Class A common stock. Neither we nor any underwriter (nor any of our or their affiliates) are making any
representation to you regarding the legality of an investment in our Class A common stock by you under applicable
investment or similar laws.
For investors outside the United States: Neither we nor any of the underwriters have done anything that would
permit this offering or possession or distribution of this prospectus, any amendment or supplement to this prospectus
or any applicable free writing prospectus in any jurisdiction where action for that purpose is required, other than in
the United States. Persons outside of the United States who come into possession of this prospectus, any amendment
or supplement to this prospectus or any applicable free writing prospectus must inform themselves about, and
observe any restrictions relating to, this offering of our Class A common stock and the distribution of this
prospectus, any amendment or supplement to this prospectus or any applicable free writing prospectus outside of the
United States.
1
Table of Contents
DEFINED TERMS AND PRESENTATION
As used in this prospectus, unless the context otherwise requires, references to “we,” “us,” “our,” the
“Company,” “Fervo Energy,” and similar references refer to Fervo Energy Company and its subsidiaries. In
addition, the terms below that are used frequently in this prospectus have the following meanings:
•“2019 Plan” means the Fervo Energy Company 2019 Stock Incentive Plan, as amended.
•“2026 Plan” means the Fervo Energy Company 2026 Incentive Award Plan.
•“Amended Bylaws” means our amended and restated bylaws.
•“Amended Charter” means our amended and restated certificate of incorporation.
•“BLM” means the Bureau of Land Management.
•“Cape Station” means our GeoCluster located in Milford, Utah, the first approximately 100 megawatts of
which we expect will be delivered to the grid by early 2027.
•“Carbon-free” (or similar constructs) means carbon-free solely with respect to electricity generation from
our EGS processes once our facilities are producing. The term is not intended to capture nor represent any
other GHG emissions in our value chain, including other Scope 1 emissions (directly arising from
operations), Scope 2 (indirect emissions from purchased electricity), or Scope 3 (upstream and downstream,
including transportation and distribution). We do not make any claims regarding lifecycle greenhouse gas
accounting.
•“Class A common stock” means Class A common stock, par value $0.0001 per share, of Fervo Energy
Company.
•“Class B common stock” means Class B common stock, par value $0.0001 per share, of Fervo Energy
Company.
•“COD” means commercial operation date.
•“Code” means the U.S. Internal Revenue Code of 1986, as amended.
•“Co-Founders” means, together, Tim Latimer and Jack Norbeck, PhD.
•“Credit Agreement” means that certain Credit Agreement, dated November 20, 2024, as amended on May
21, 2025, July 23, 2025 and March 6, 2026 with Mercuria Energy Trading SA.
•“Credit Facility” means the $100.0 million term loan facility governed by the Credit Agreement and $80.0
million letter of credit facility governed by the Letter of Credit Facility Agreement.
•“D&M” means DeGolyer and MacNaughton, an independent engineering consulting firm.
•“EGS” means enhanced geothermal systems.
•“ESPP” means the Fervo Energy Company 2026 Employee Stock Purchase Plan.
•“Exchange Act” means the U.S. Securities and Exchange Act of 1934, as amended.
•“FERC” means the Federal Energy Regulatory Commission.
•“FervoFlex” means our approach to delivering flexible, dispatchable geothermal power by using our EGS
systems to provide long-duration, in-reservoir energy storage and rapid load following capability. During
periods of low electricity demand or high renewable generation, production wells are choked back,
allowing for pressure buildup within the reservoir. When grid demand rises, production wells are opened,
releasing stored thermal energy and rapidly ramping power output. This operational flexibility enables
geothermal to complement variable renewables and support a stable, decarbonized grid.
2
•“GAAP” means accounting principles generally accepted in the United States.
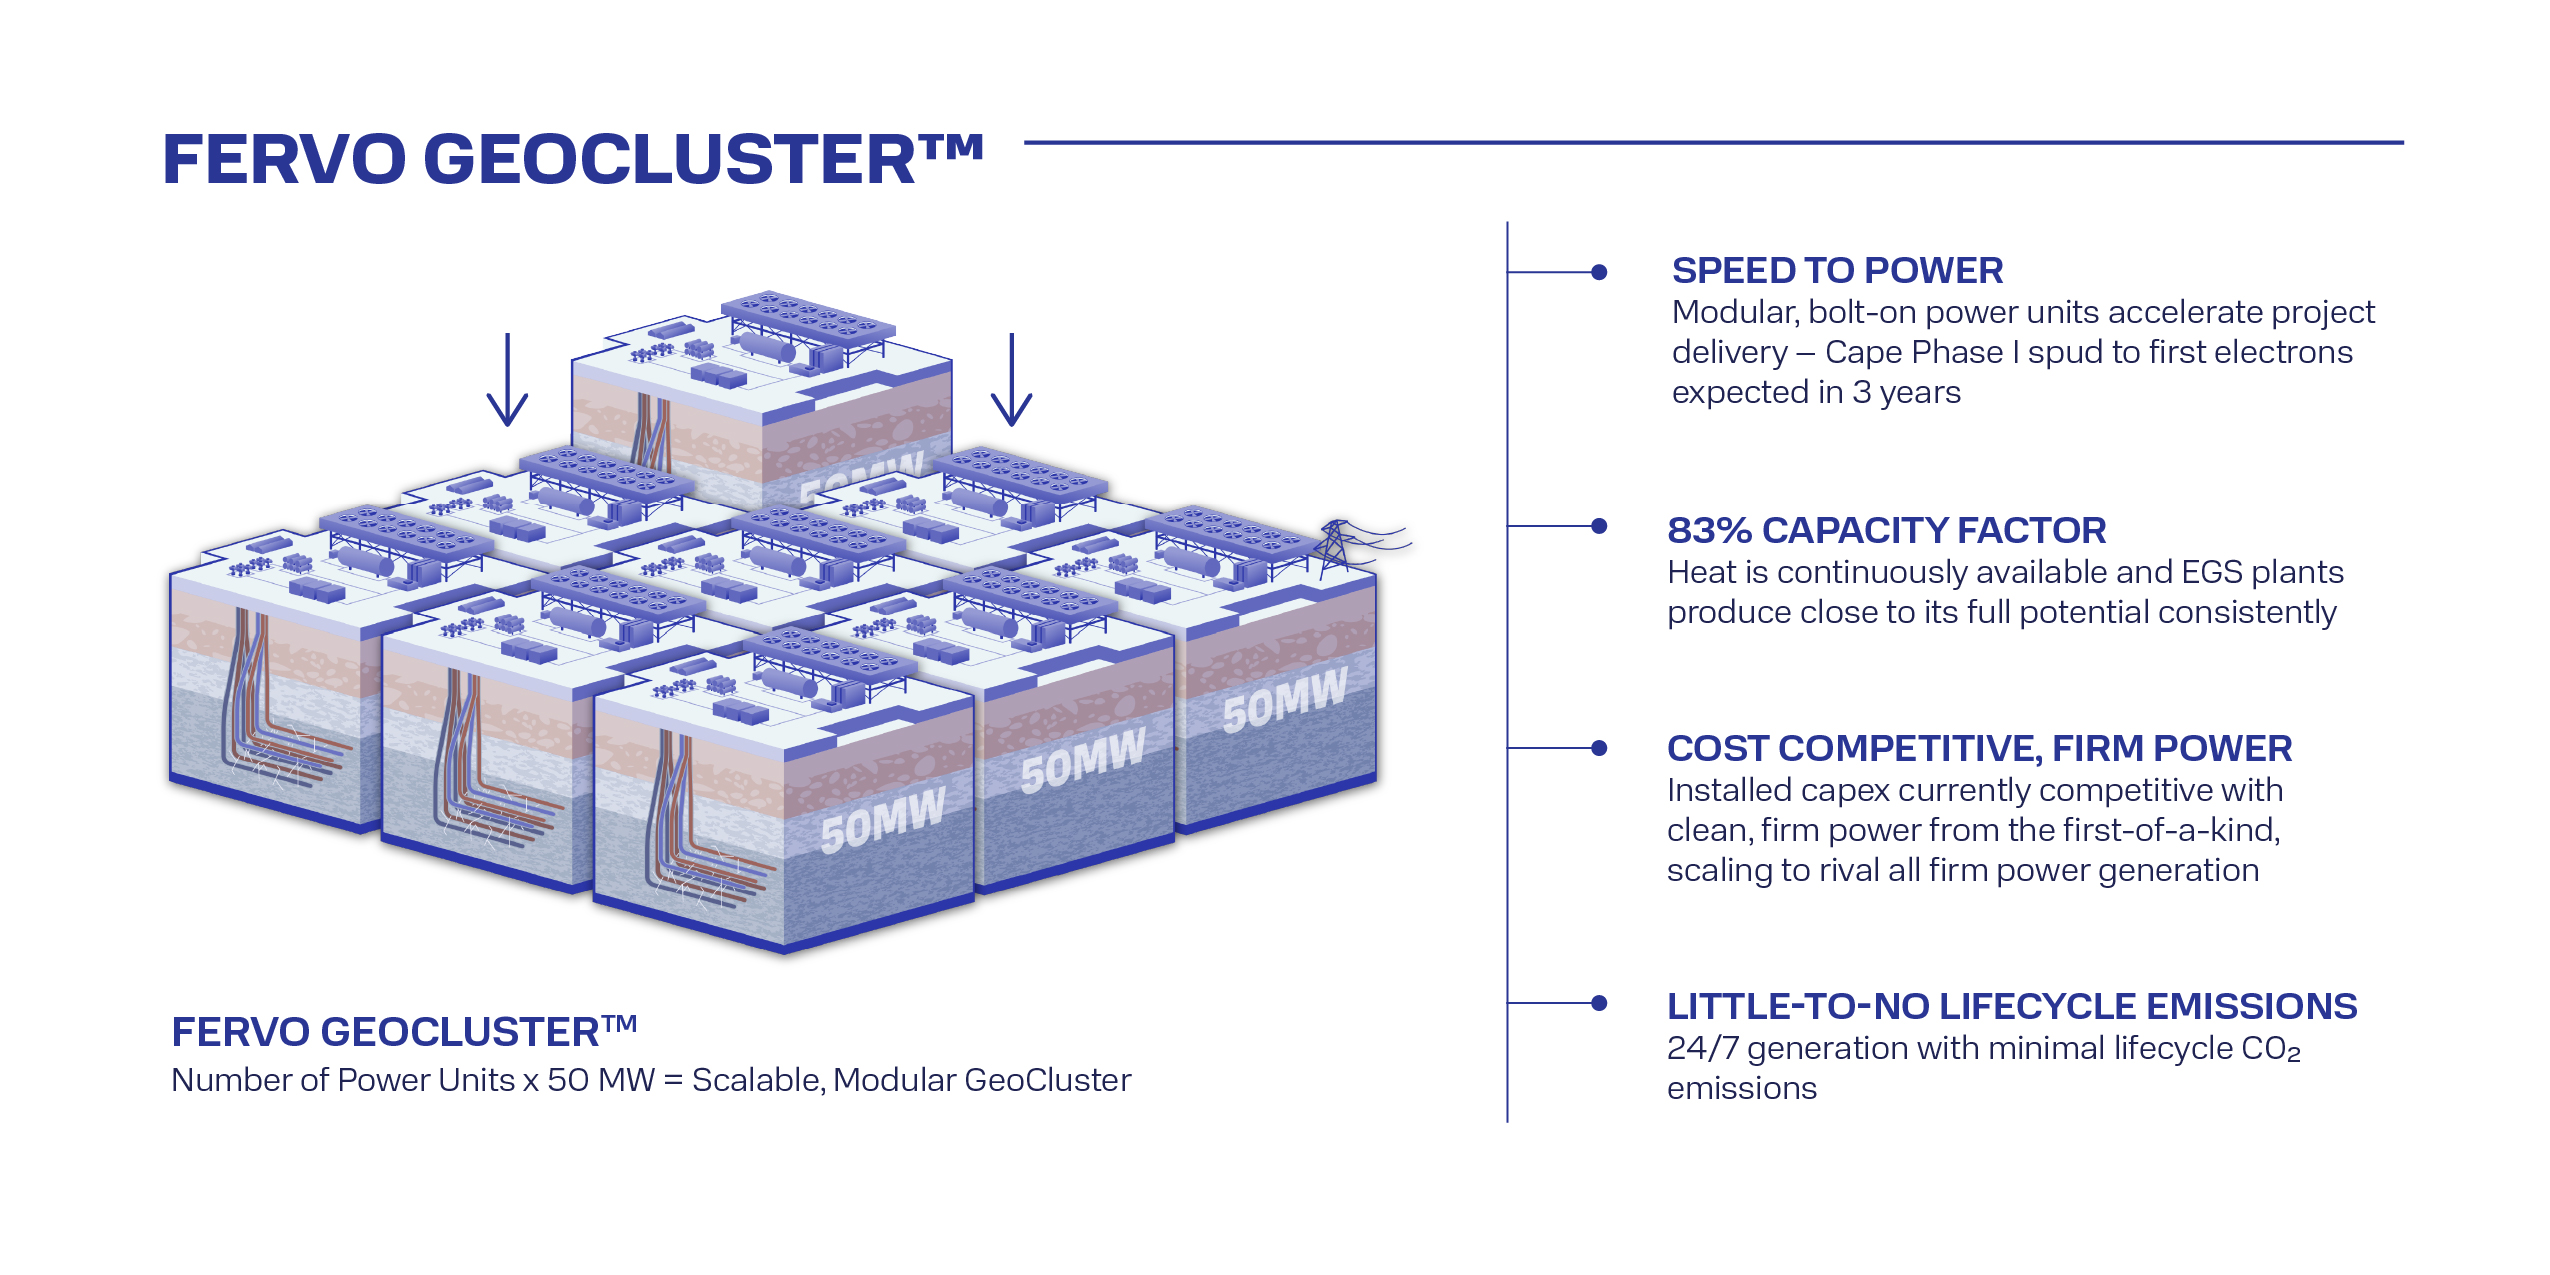
•“GeoBlock” means our standardized, 50-megawatt Organic Rankine Cycle power plants.
•“GeoClusters” means our leased acreage positions that we expect to support multi-gigawatt power
developments.
•“Geothermal resources” means thermal energy derived from the Earth’s natural heat and stored in a
reservoir.
•“GFA” means the Geothermal Framework Agreement, dated March 19, 2026, with Google Energy LLC.
•“GWh” means gigawatt-hours.
•“HIIP” or “heat initially in place” means those estimates of quantities of thermal energy generated from
geothermal resources.
•“LCOE” means levelized cost of energy.
•“Letter of Credit Facility Agreement” means that certain Letter of Credit Facility Agreement, dated
November 20, 2024, with Mercuria Energy Trading SA.
•“NEPA” means the National Environmental Policy Act.
•“NERC” means the North American Electric Reliability Corporation.
•“ORC” means Organic Rankine Cycle.
•“PPAs” means power purchase agreements or any other agreements pursuant to which we sell power or
related attributes to our customers.
•“Project Red” means our commercial pilot use of horizontal wells in an EGS system in northern Nevada,
which was a limited-scope, proof-of-concept initiative designed to demonstrate certain technical
capabilities.
•“Project Granite Facility” means the construction loan facility, ITC Transfer bridge loan facility, letter of
credit facilities, and a term loan facility, dated March 6, 2026 in the aggregate amount of approximately
$421.4 million.
•“R&D” means research and development.
•“SEC” means Securities and Exchange Commission.
•“Securities Act” means the U.S. Securities Act of 1933, as amended.
•“Stock Split” means the 0.7194-for-1 reverse stock split of our common stock, which will occur upon the
filing of our Amended Charter after the effectiveness of the registration statement to which this offering
relates and prior to the completion of this offering.
•“TWh” means terawatt-hours.
•“VRE” means variable renewable energy.
•“XRC Facility” means three promissory notes in the aggregate amount of $145.6 million under a loan
agreement with XRL ALC, LLC. This facility was terminated on April 14, 2026.
Certain monetary amounts, percentages, and other figures included in this prospectus have been subject to
rounding adjustments. Percentage amounts included in this prospectus have not in all cases been calculated on the
basis of such rounded figures, but on the basis of such amounts prior to rounding. For this reason, percentage
amounts in this prospectus may vary from those obtained by performing the same calculations using the figures in
3
our consolidated financial statements included elsewhere in this prospectus. Certain other amounts that appear in this
prospectus may not sum due to rounding.
This prospectus includes our registered or common law trademarks, service marks and trade names, including
but not limited to our design logo, Fervo Energy™, FervoFlex™, FERVO50 GEOBLOCK™, GEOCLUSTER™,
GEOBLOCK™, GEOCLUSTERS™ and GEOBLOCKS™, which are protected under applicable intellectual
property laws. This prospectus also contains trademarks, trade names, and service marks of other companies, which
are the property of their respective owners. We do not intend our use or display of other parties’ trademarks, service
marks or trade names to imply, and such use or display should not be construed to imply, a relationship with, or
endorsement or sponsorship of us by, these other parties. Solely for convenience, trademarks, service marks and
trade names referred to in this prospectus may appear without the ®, ™, or SM symbols, but such references are not
intended to indicate, in any way, that we will not assert, to the fullest extent permitted under applicable law, our
rights or the right of the applicable licensor to these trademarks, service marks and trade names.
Our audited consolidated financial statements as of and for the years ended December 31, 2025 and 2024
included in this prospectus have been prepared in accordance with GAAP.
4
LETTER FROM TIM LATIMER, CHIEF EXECUTIVE OFFICER
American economic prosperity has always depended on affordable, reliable energy. And as the U.S. confronts a
global AI race, and increasing geopolitical and environmental uncertainty, this fundamental truth will only deepen.
There is no AI revolution without power for data centers. There is no industrial renaissance without power for
manufacturing facilities and military bases. There is no future where we address the emissions causing climate
change without power for mass electrification.
But energy abundance is not guaranteed. In the 1970s, a prolonged energy crisis stifled American growth. Fuel
rations became commonplace, and across U.S. cities, lines at gas stations stretched for miles as drivers clamored for
fuel.
This crisis eventually gave rise to the Shale Revolution. Unwilling to accept stagnant domestic oil production,
policymakers, companies, and investors pushed for unconventional fossil fuel extraction. Horizontal drilling and
hydraulic fracturing offered an answer. And with continuous engineering improvements enabled by learning curves
and economies of scale, developers unlocked oil and gas in previously inaccessible locations. By the early-2010s,
horizontal drilling and hydraulic fracturing had transformed the global energy landscape by providing a new way to
access affordable energy.
The U.S. now faces a new energy crisis, a crisis driven by breakneck AI advancements, competition with China,
and climate instability. And though this crisis is novel, the technology needed to solve it is not.
The EGS approach we have pioneered on the back of over a decade of learnings from the Shale Revolution is
now sparking a revolution in clean, around-the-clock geothermal power. Fervo launched in 2017 with a simple
thesis: the same tools and engineering undergirding shale can make geothermal a scalable, cost-competitive clean
energy solution capable of addressing dramatic load growth. Unlike shale, which depletes hydrocarbons, EGS
leverages a heat reservoir for steady, renewable output. And while shale playbooks front-load production with
depletion and declines thereafter, EGS enables long-term, steady electricity generation.
To date, this thesis has proven correct. Horizontal drilling and hydraulic fracturing remove geographic
constraints on geothermal production, increasing capacity potential by orders of magnitude. According to Rystad,
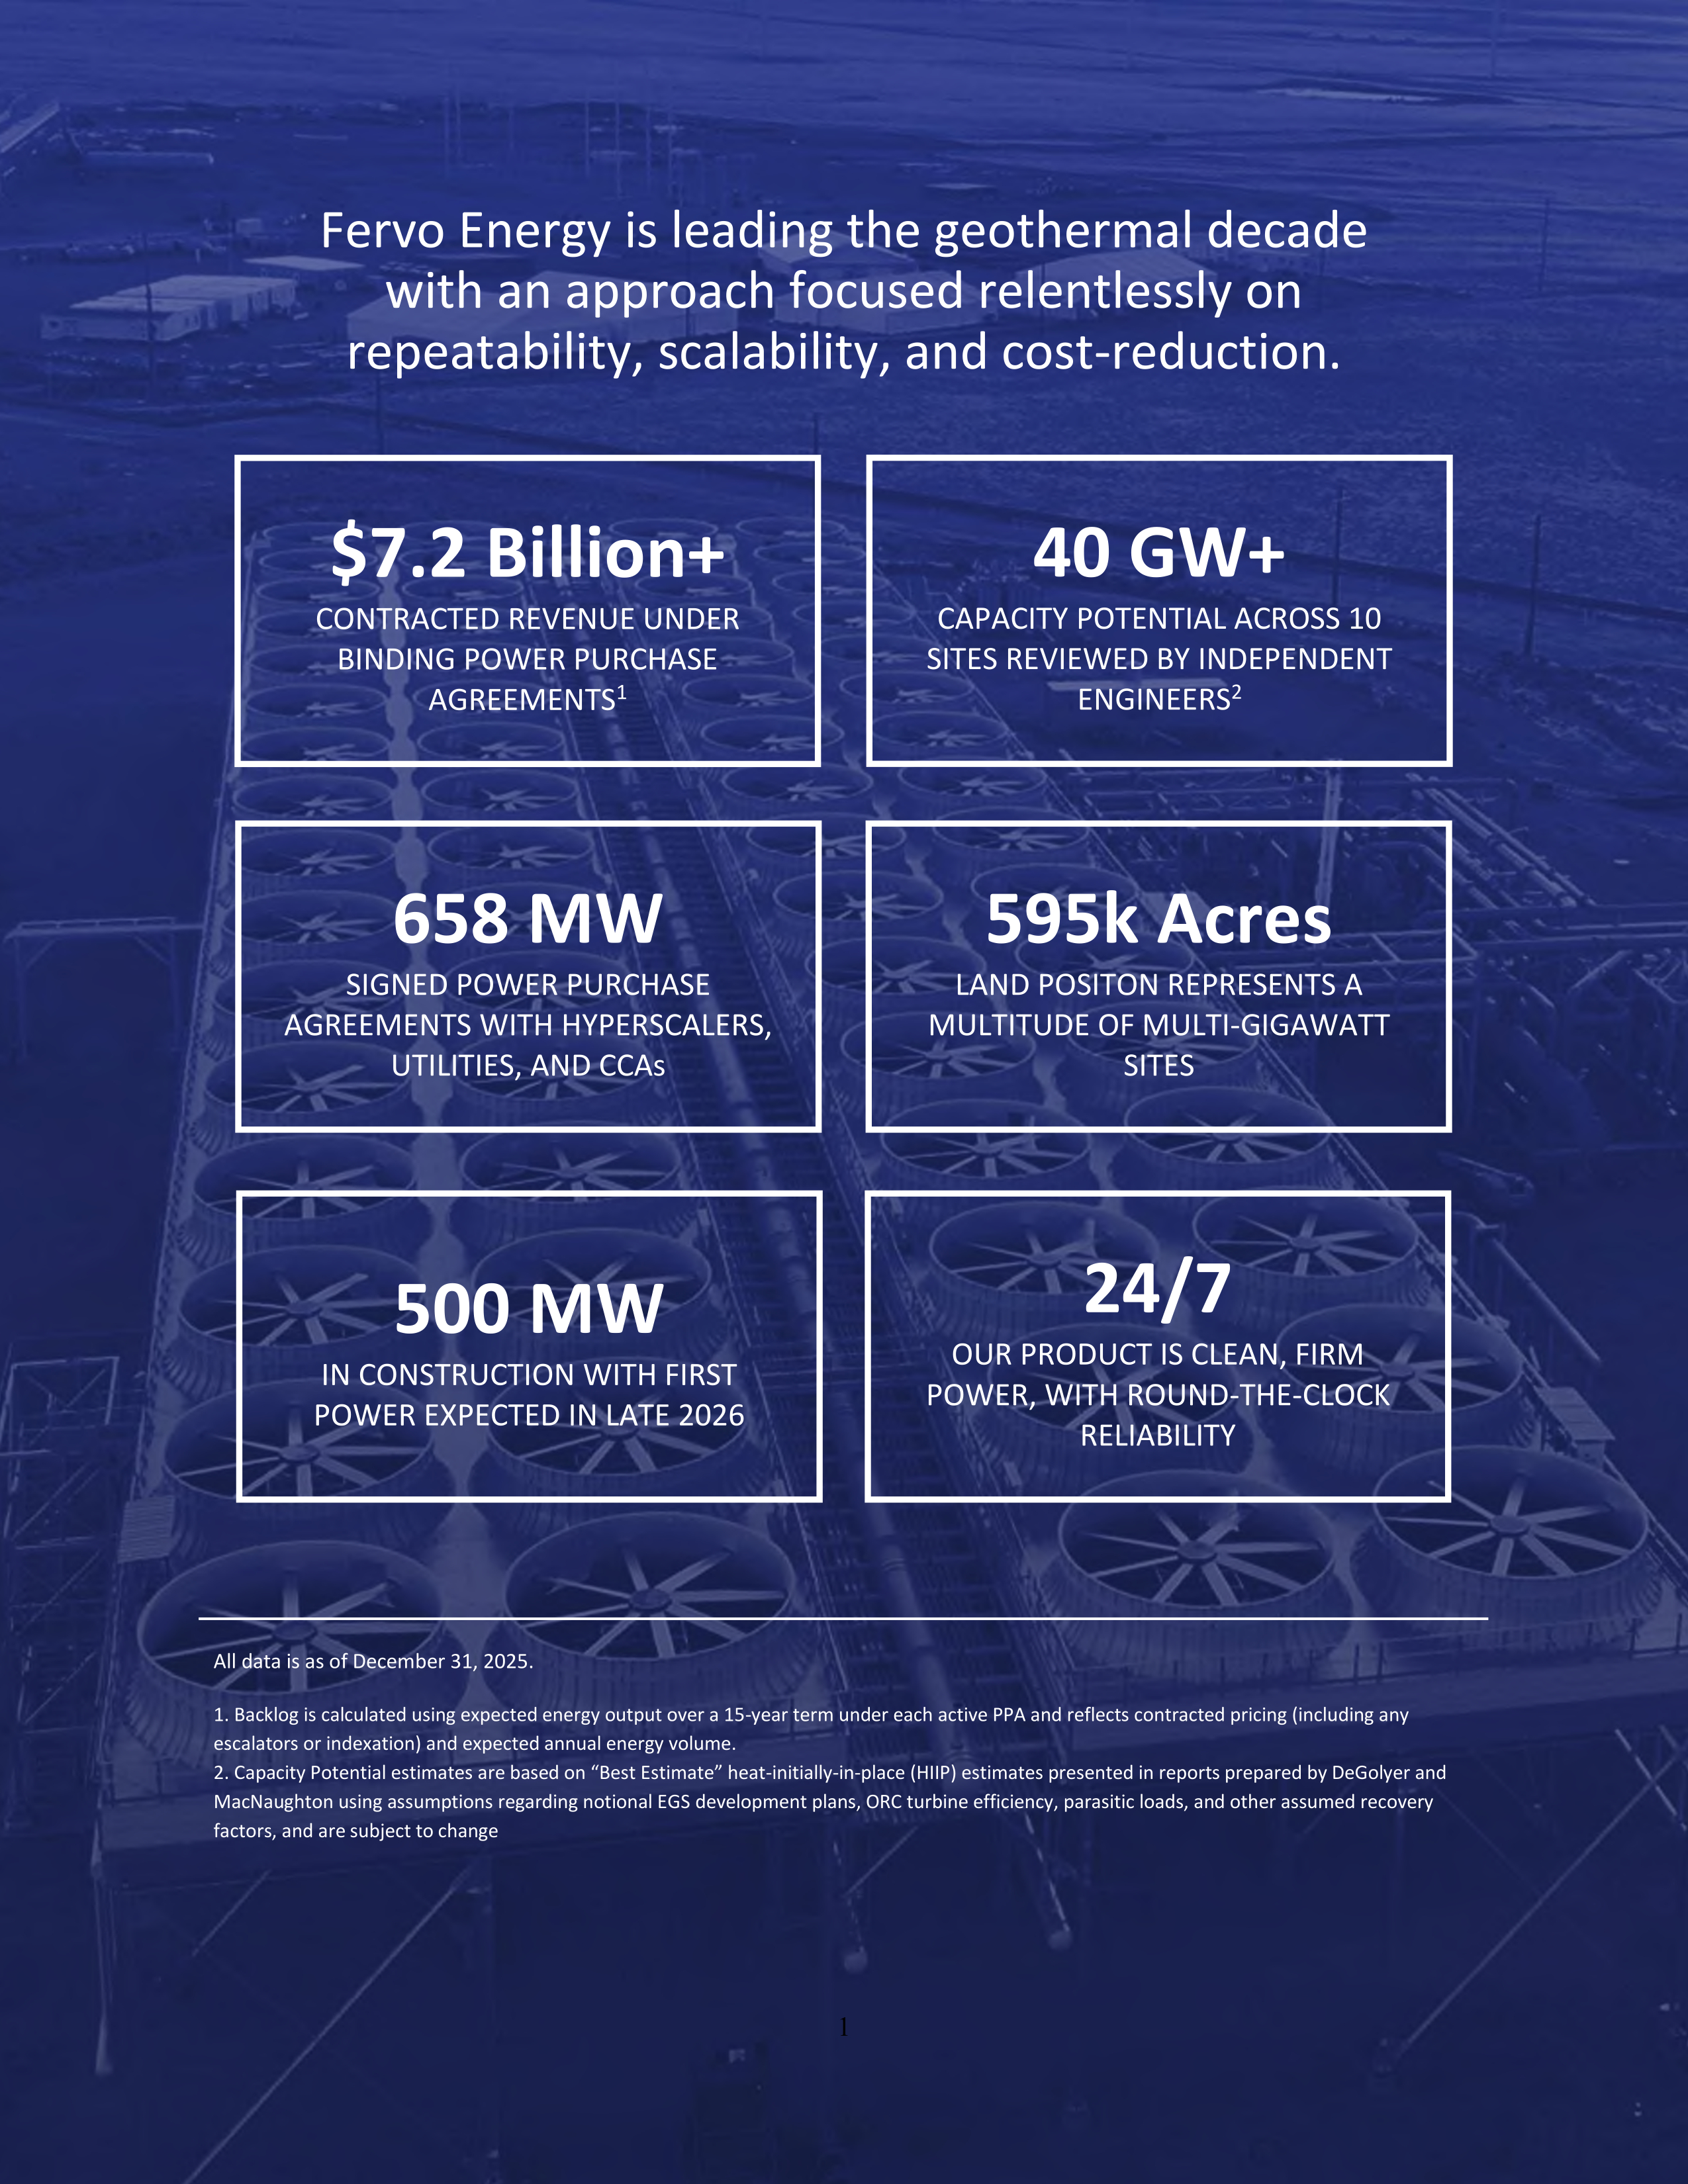
conventional geothermal currently supplies the U.S. with roughly 3.8 gigawatts of energy. By contrast, Fervo’s Cape
Station site alone offers approximately 4.3 gigawatts of capacity potential, while a broader subset of our reviewed
leases represents over 40 gigawatts. EGS has the potential to make geothermal generation as ubiquitous as solar
generation is in the U.S. today.
Rapid buildout is already underway. Fervo has 500 megawatts currently under construction and 658 megawatts
of contracted offtake with tier-one partners like Southern California Edison, Google / NV Energy, and Shell,
providing a clear roadmap for potential near-term growth. We have entered a new era of geothermal development.
Relying on proven oil and gas technology allows for this scale. We do not need to build domestic supply chains
from scratch; we can leverage existing oilfield services providers. We do not need to retrain or reskill hundreds of
workers to drill our wells; we can leverage the U.S.’s robust oil and gas labor force. Our ability to provide reliable,
carbon-free electricity and also tap the traditional oil and gas industry workforce has made geothermal a bipartisan
solution, even as other resources become politically polarized.
Ultimately, though, the engineering mentality behind the Shale Revolution is just as important to our success as
the underlying technology. Shale transformed American energy thanks to learning curves—meaningful cost
reduction over repeated operations. In conventional oil and gas, producers targeted unique and complex systems
hoping for outsized returns. Shale, however, prioritized highly predictable basins spanning hundreds of square miles.
Repetitive basin-wide drilling allowed for standardization and simplification, increasing per-well productivity while
lowering costs.
This powerful combination—standardization and simplification—is critical to technology revolutions. It helped
Toyota become a global automotive juggernaut, leveraging “lean manufacturing” to popularize Japanese cars. It
helped SpaceX reinvigorate space travel, reducing rocket system complexity from the Raptor 1 to the Raptor 2 to the
5
Raptor 3. It will now help Fervo provide 24/7 clean energy at the speed, scale, and cost needed to achieve an
American-led AI future.
Fervo is working to build a different type of energy company—one that treats each geothermal power facility as
a repeatable product, not a one-off, complicated project. We intend to deliver power in standardized, 50-megawatt
ORC units, relentlessly reducing complexity with every well drilled and every turbine installed. With few locational
constraints on our subsurface operations, we can develop sites to multi-gigawatt sites, harnessing learning curves to
drive continuous improvement and make geothermal cheaper than it has ever been.
Our first utility-scale deployment in the Cape Station site will provide a baseline for our core product. We
expect that each power unit built thereafter will improve on this baseline by using learnings to streamline
engineering design.
Our commitment to continuous improvement rests on four core corporate values that have guided Fervo since
our inception. First, we Build Things That Last, prioritizing health, safety, and the environment above all else. No
matter how quickly we grow, we will not compromise the safety of our workers or the communities in which we
operate.
Second, we Do What We Say We Are Going To Do, assessing each task honestly and holding employees, and
the company, accountable to transparent, quantifiable performance targets.
Third, we Innovate Through Collaboration, seeking ideas from all sources and forging relationships with best-
in-class partners.
Finally, we Stop And Smell The Roses, because a company that celebrates its wins and genuinely values the
wellbeing of its people is a company positioned for lasting, sustainable growth. By keeping employees for the long
term, we can realize the engineering and commercial learning curves so central to our business.
Together, these four values define Fervo’s culture.
Today, miles-long lines for gasoline have been replaced by lines for electricity. Tech companies compete for
megawatts to claim AI market share. Manufacturers jockey for power to strengthen American industry. Utilities
demand clean, firm electricity to stabilize the grid. Fervo is prepared to serve all of these customers. Not with
complex, idiosyncratic projects but with a simplified, standardized product capable of delivering around-the-clock,
carbon-free power using proven oil and gas technology.
American economic dynamism has long depended on reliable energy. The reliable energy of our time is next-
generation geothermal.
6
PROSPECTUS SUMMARY
This summary highlights selected information that is presented in greater detail elsewhere in this prospectus.
This summary does not contain all of the information you should consider before investing in our Class A common
stock. You should read this entire prospectus carefully, including the sections titled “Risk Factors,” “Special Note
Regarding Forward-Looking Statements,” and “Management’s Discussion and Analysis of Financial Condition and
Results of Operations,” and our consolidated financial statements and related notes included elsewhere in this
prospectus, before making an investment decision. Unless the context otherwise requires, the terms “Fervo,” the
“Company,” “we,” “us,” and “our” in this prospectus refer to Fervo Energy Company and its consolidated
subsidiaries.
Our Mission
To transform geothermal energy into America’s most dependable and affordable source of clean, 24/7 power.
Fervo Energy
The U.S. is in critical need of firm, reliable power. Rapid growth in data centers, the resurgence of domestic
manufacturing, and accelerating electrification are driving electricity demand that outpaces new planned generation.
Rystad reports that by 2035, the country is expected to face a 98-gigawatt accredited capacity shortfall, highlighting
an urgent need for new, scalable sources of 24/7 power.
As the pioneer of enhanced geothermal systems (“EGS”), we are commercializing a new category of firm power
that is scalable, rapidly deployable, readily available, and geographically flexible. By applying proven technologies
like horizontal drilling and multi-stage hydraulic fracturing, we are transforming geothermal energy from a niche
resource into a utility-scale power solution that is clean, reliable, cost-competitive, and suited to the needs of
hyperscalers and utilities alike.
Geothermal is a highly attractive energy resource – it is clean, firm, and reliable. But traditional geothermal
projects depend on rare geologic conditions like volcanic systems with highly conductive natural fracture networks,
which has constrained development to places like Iceland, Kenya, California, and Hawaii. Additionally, traditional
geothermal projects have carried significant development risk because wells either succeed or fail entirely with
natural fracture networks. This uncertainty has made these projects unpredictable, expensive, and hard to scale.
Our EGS technology addresses the scalability limitations and key development risks of traditional geothermal
energy. By designing and controlling subsurface flow pathways, we can predictably recover heat without relying on
naturally occurring permeability. Additionally, we deploy innovative subsurface monitoring technologies such as
AI-enhanced fiber optic sensing that enable us to monitor and predict geothermal heat transfer at high spatial and
temporal resolution. We believe these capabilities will enable us to standardize project development, optimize power
facility placement and design, and capture economies of scale previously unavailable to the geothermal industry. We
expect this innovative approach to position us to deliver predictable, cost-effective, and scalable geothermal power
that follows learning curve cost declines, thereby providing the dependable energy needed to help close the nation’s
capacity shortfall.
Our EGS technology has been delivering clean electrons to the grid and generating revenue since 2023 at our
commercial pilot called Project Red, differentiating us from certain other energy alternatives still grappling with
technology risk, long development timelines, permitting uncertainty and supply chain constraints. Expanding upon
this success, we are now building Cape Station, a 500-megawatt greenfield project, where we expect to deliver first
power by late 2026. Our proven technical approach and track record of execution has generated meaningful
commercial traction. Across our full portfolio, we have signed 658 megawatts of binding power purchase
agreements (“PPAs”) with investment-grade utility and corporate energy buyers including Southern California
Edison and Shell. Beyond our current contracted backlog, we have also entered into a 3-gigawatt framework
agreement with Google (the “Geothermal Framework Agreement” or “GFA”) to advance and structure potential
power offtake opportunities for current and planned data centers in both grid-connected and alternative energy
solutions.
7
Our Project Pipeline
We are a geothermal energy developer that builds, owns, and operates geothermal power facilities. We construct
projects in phases across leased acreage positions that can support multi-gigawatt power developments
(“GeoClusters”). Our leasing strategy is focused on securing high-quality, geothermal resources in prime locations,
the vast majority of which have existing deep wells that confirm significantly elevated temperatures at shallow
depths and near-term commercial viability. We pair detailed geologic analysis with commercial assessments, such as
transmission access, market conditions, and permitting, so that each opportunity meets our development standards.
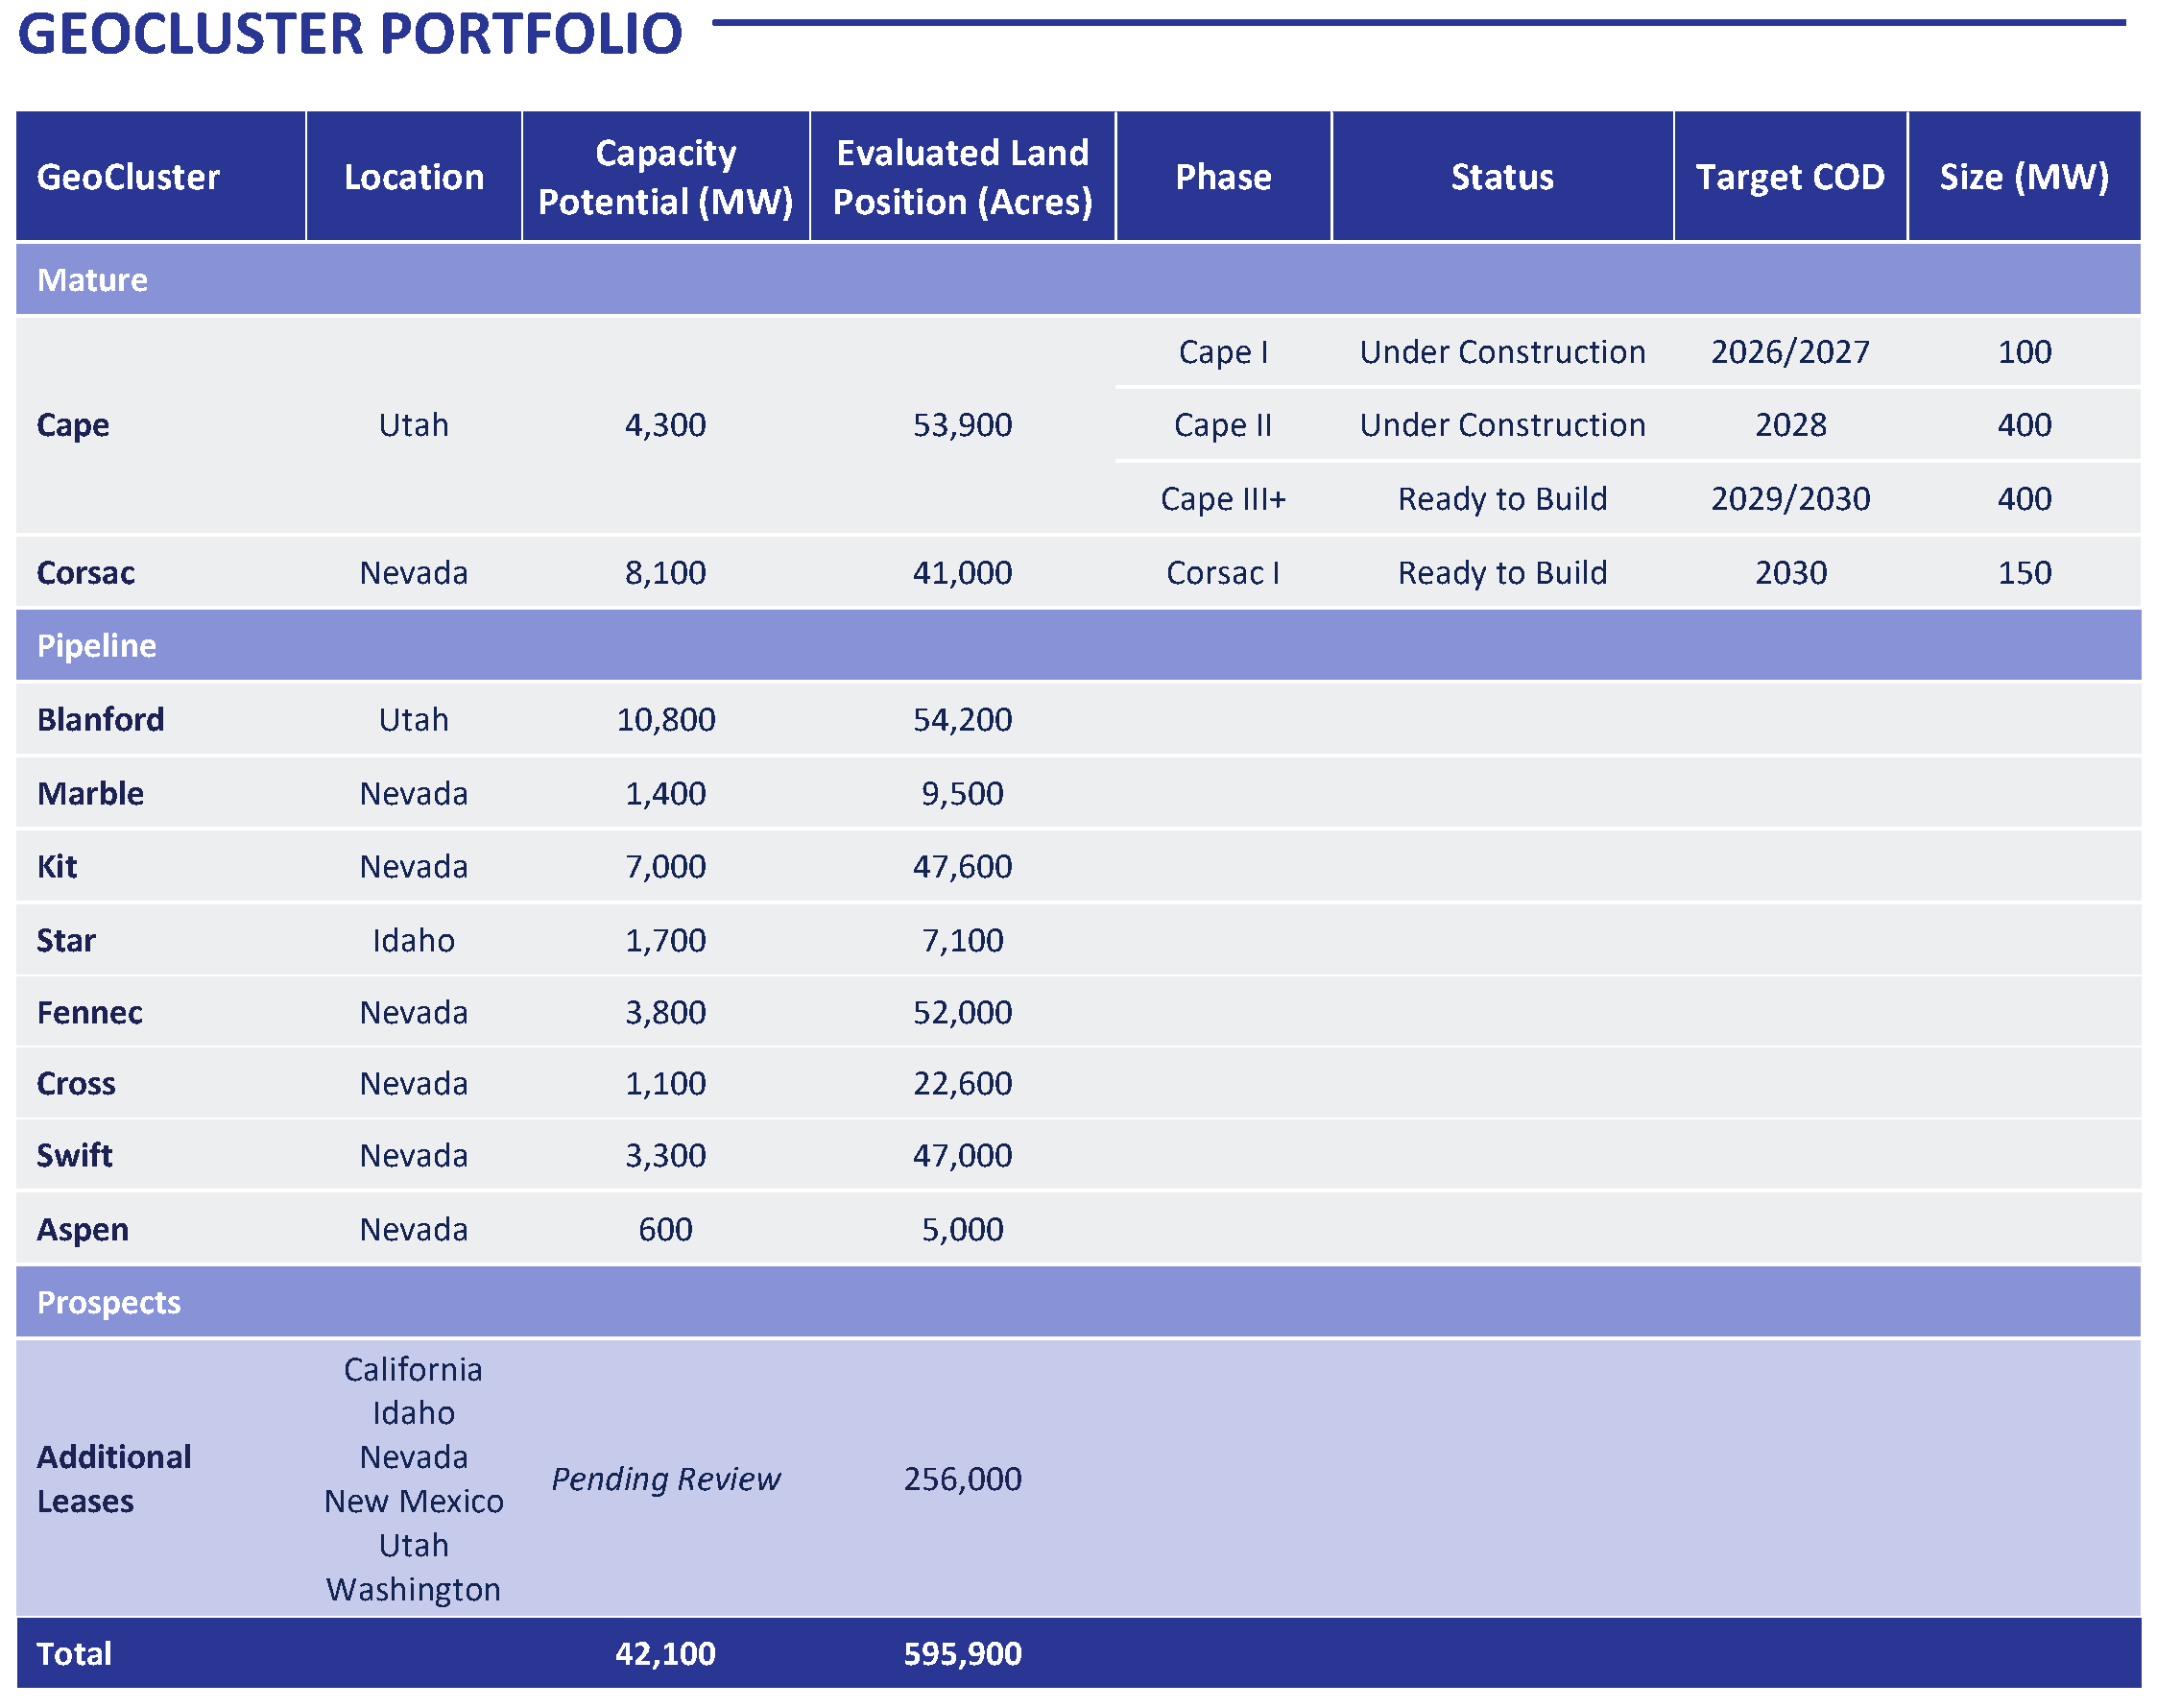
In June 2023, we broke ground on our first GeoCluster – Cape Station – located in Milford, Utah, which we
expect will become the world’s largest EGS project in terms of total installed capacity. At Cape Station, we have
500 megawatts under construction and expect to deliver first power in late 2026, reaching approximately 100
megawatts of operating capacity by early 2027. These 500 megawatts represent only the first two phases of the Cape
Station GeoCluster. We also have a permit in place to develop an incremental 1.5 gigawatts at the site, and based
upon a combination of internal estimates and findings from an independent engineer assessment, estimate that we
have a total of approximately 4.3 gigawatts of capacity potential at Cape Station.
Cape Station is expected to be the first in a large portfolio of high-capacity factor, carbon-free, baseload power
GeoClusters, supporting the company’s runway for significant, near-term organic growth across our 595,900 acre
land position as of December 31, 2025.
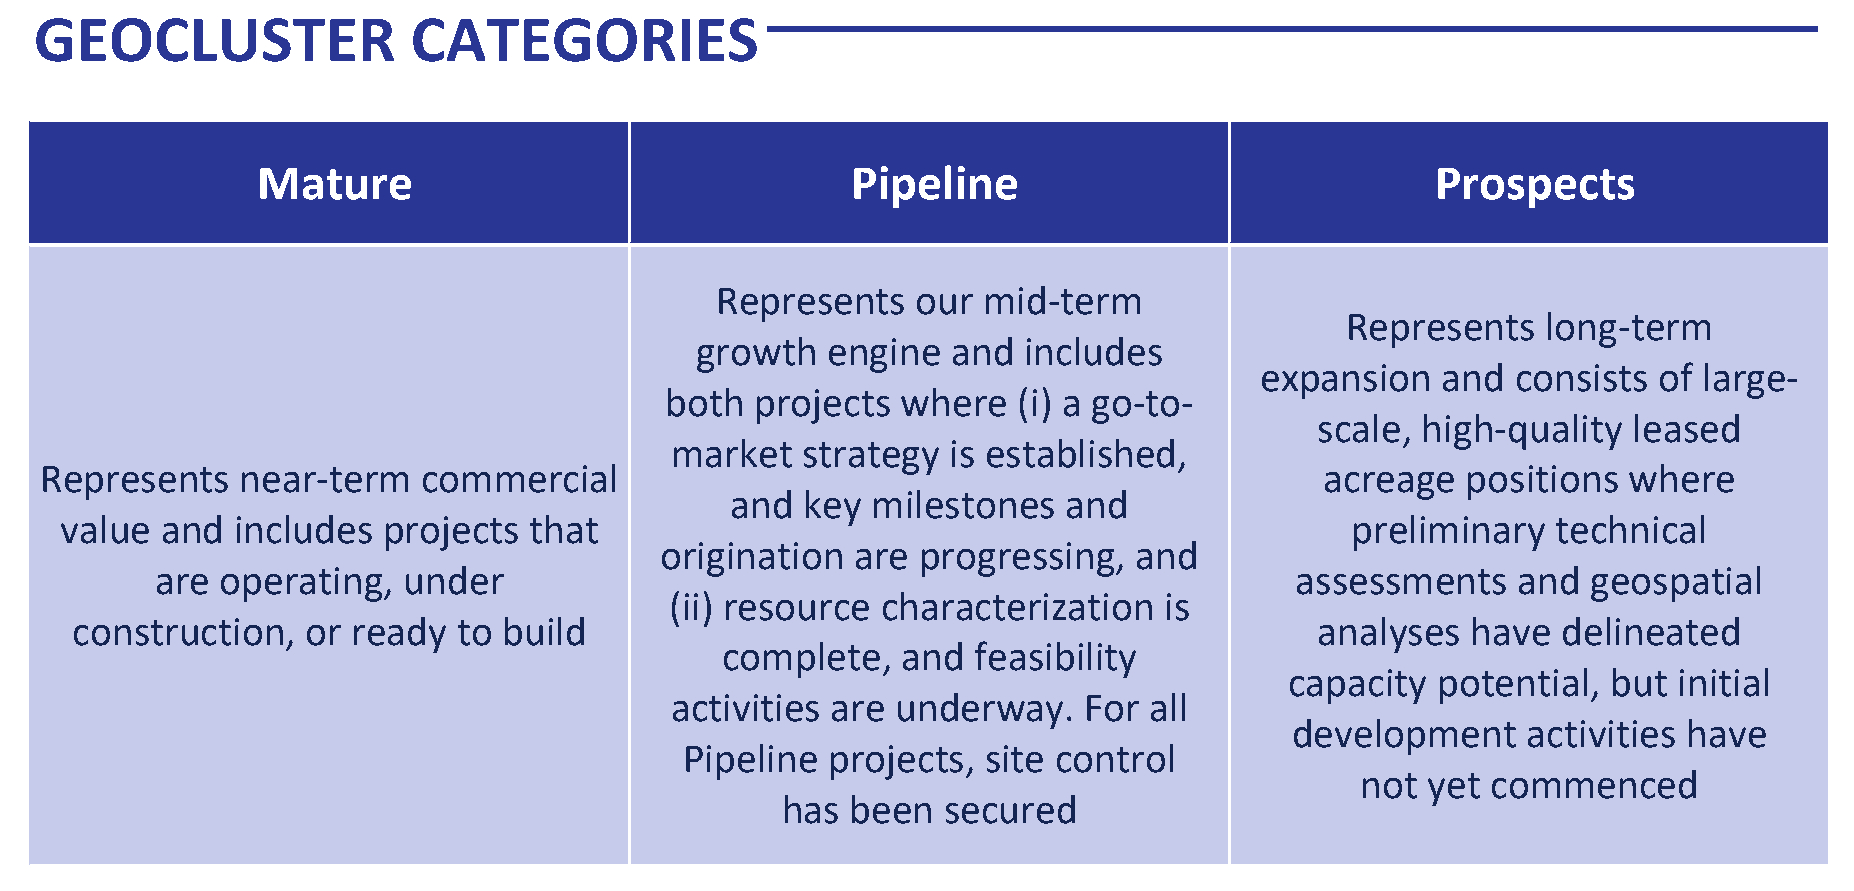
We classify our portfolio into three distinct categories: Mature, Pipeline, and Prospects.
As of December 31, 2025, our Mature, Pipeline, and Prospects portfolio consisted of the following:
Mature
•Operating: 3 megawatts are currently online and generating power from our pilot project, Project Red.
•Under Construction: 500 megawatts are currently in construction at Cape Station, with commercial
contracts in place and physical work underway.
•Ready to Build: 550 megawatts across two different GeoClusters were shovel-ready with initial permits
secured to begin construction. These megawatts are backed by calibrated subsurface models, validated
against well data and geophysical surveys, and have a clear wellfield development strategy in place.
8
Commercially, we have secured or are in advanced negotiation for offtake and have either obtained
interconnection or established a clear, achievable path.
Pipeline
•Advanced Development: 2.6 gigawatts were in advanced development. These projects have a go-to-market
strategy established, with key development milestones progressing and active origination efforts underway.
Typical activities include preliminary permit filings, on-site geological studies work, and submission of
interconnection applications.
•Early Development: Over 38 gigawatts were in early-stage development across ten GeoClusters where we
have commissioned and received independent HIIP studies and are conducting feasibility activities to
validate and confirm the path toward commercial development.
Prospects
•Land Holdings: Our remaining portfolio consists of approximately 256,000 acres of leased acreage as of
December 31, 2025, with differentiated geothermal resource quality currently maintained in our portfolio.
For this category, we have secured leases and identified project areas, but have not commenced initial
development work.
These three categories (Mature, Pipeline and Prospects) represent the expected progression of our megawatts
from those in early development stages to revenue-generating operations.
9
As of December 31, 2025, our generation portfolio was comprised of the following:
__________________
Note: Capacity Potential estimates are based on “Best Estimate” HIIP estimates presented in reports prepared by D&M using assumptions
regarding notional EGS development plans, ORC turbine efficiency, parasitic loads, and other assumed recovery factors, and are subject to
change with additional data.
Our Project Economics
Our business model combines technological innovation with disciplined project development and seeks to
deliver predictable returns and strong cash generation. In addition to advancing the technical boundaries of
geothermal energy, we are implementing a development approach that leverages repeatability, enhanced production
performance, and economies of scale. We believe relentless focus on these three areas will enable us to
systematically improve the economics of geothermal power generation and increase the value of each megawatt
produced across our portfolio.
•Repeatability – Freed from the constraints of conventional geothermal systems, our approach emphasizes
standardization and repetition in order to capture and integrate geological, technical, and experiential
learnings to meaningfully reduce costs. Since 2022, the company has demonstrated a steep drilling learning
curve, reducing drilling times by approximately 75% from 2022 to 2025 and lowering per-foot drilling
costs by approximately 70% over the same period. We employ advanced data analytics and proprietary AI-
based modeling to better predict operational conditions and accelerate design optimization, drawing on
more than 500 terabytes of high-fidelity operational data collected to date. To extend these efficiencies
from the wellfield to the surface facilities, we plan to deploy standardized 50-megawatt ORC power plants
10
that we call GeoBlocks—which aggregated together form GeoClusters— that we expect will yield power
projects that are modular and reliable. By modularizing capacity into standardized 50‑megawatt GeoBlocks
and scaling them in GeoClusters, we believe we can create a repeatable, bolt-on development model that
compounds learning across projects, shortens delivery timelines, and enables predictable, utility‑scale
expansion. The chart below illustrates the impact of learning curves on our business over time,
demonstrating the decrease in cost per foot and days spent drilling to total depth per well across our Project
Red and initial Cape Station subsurface construction.
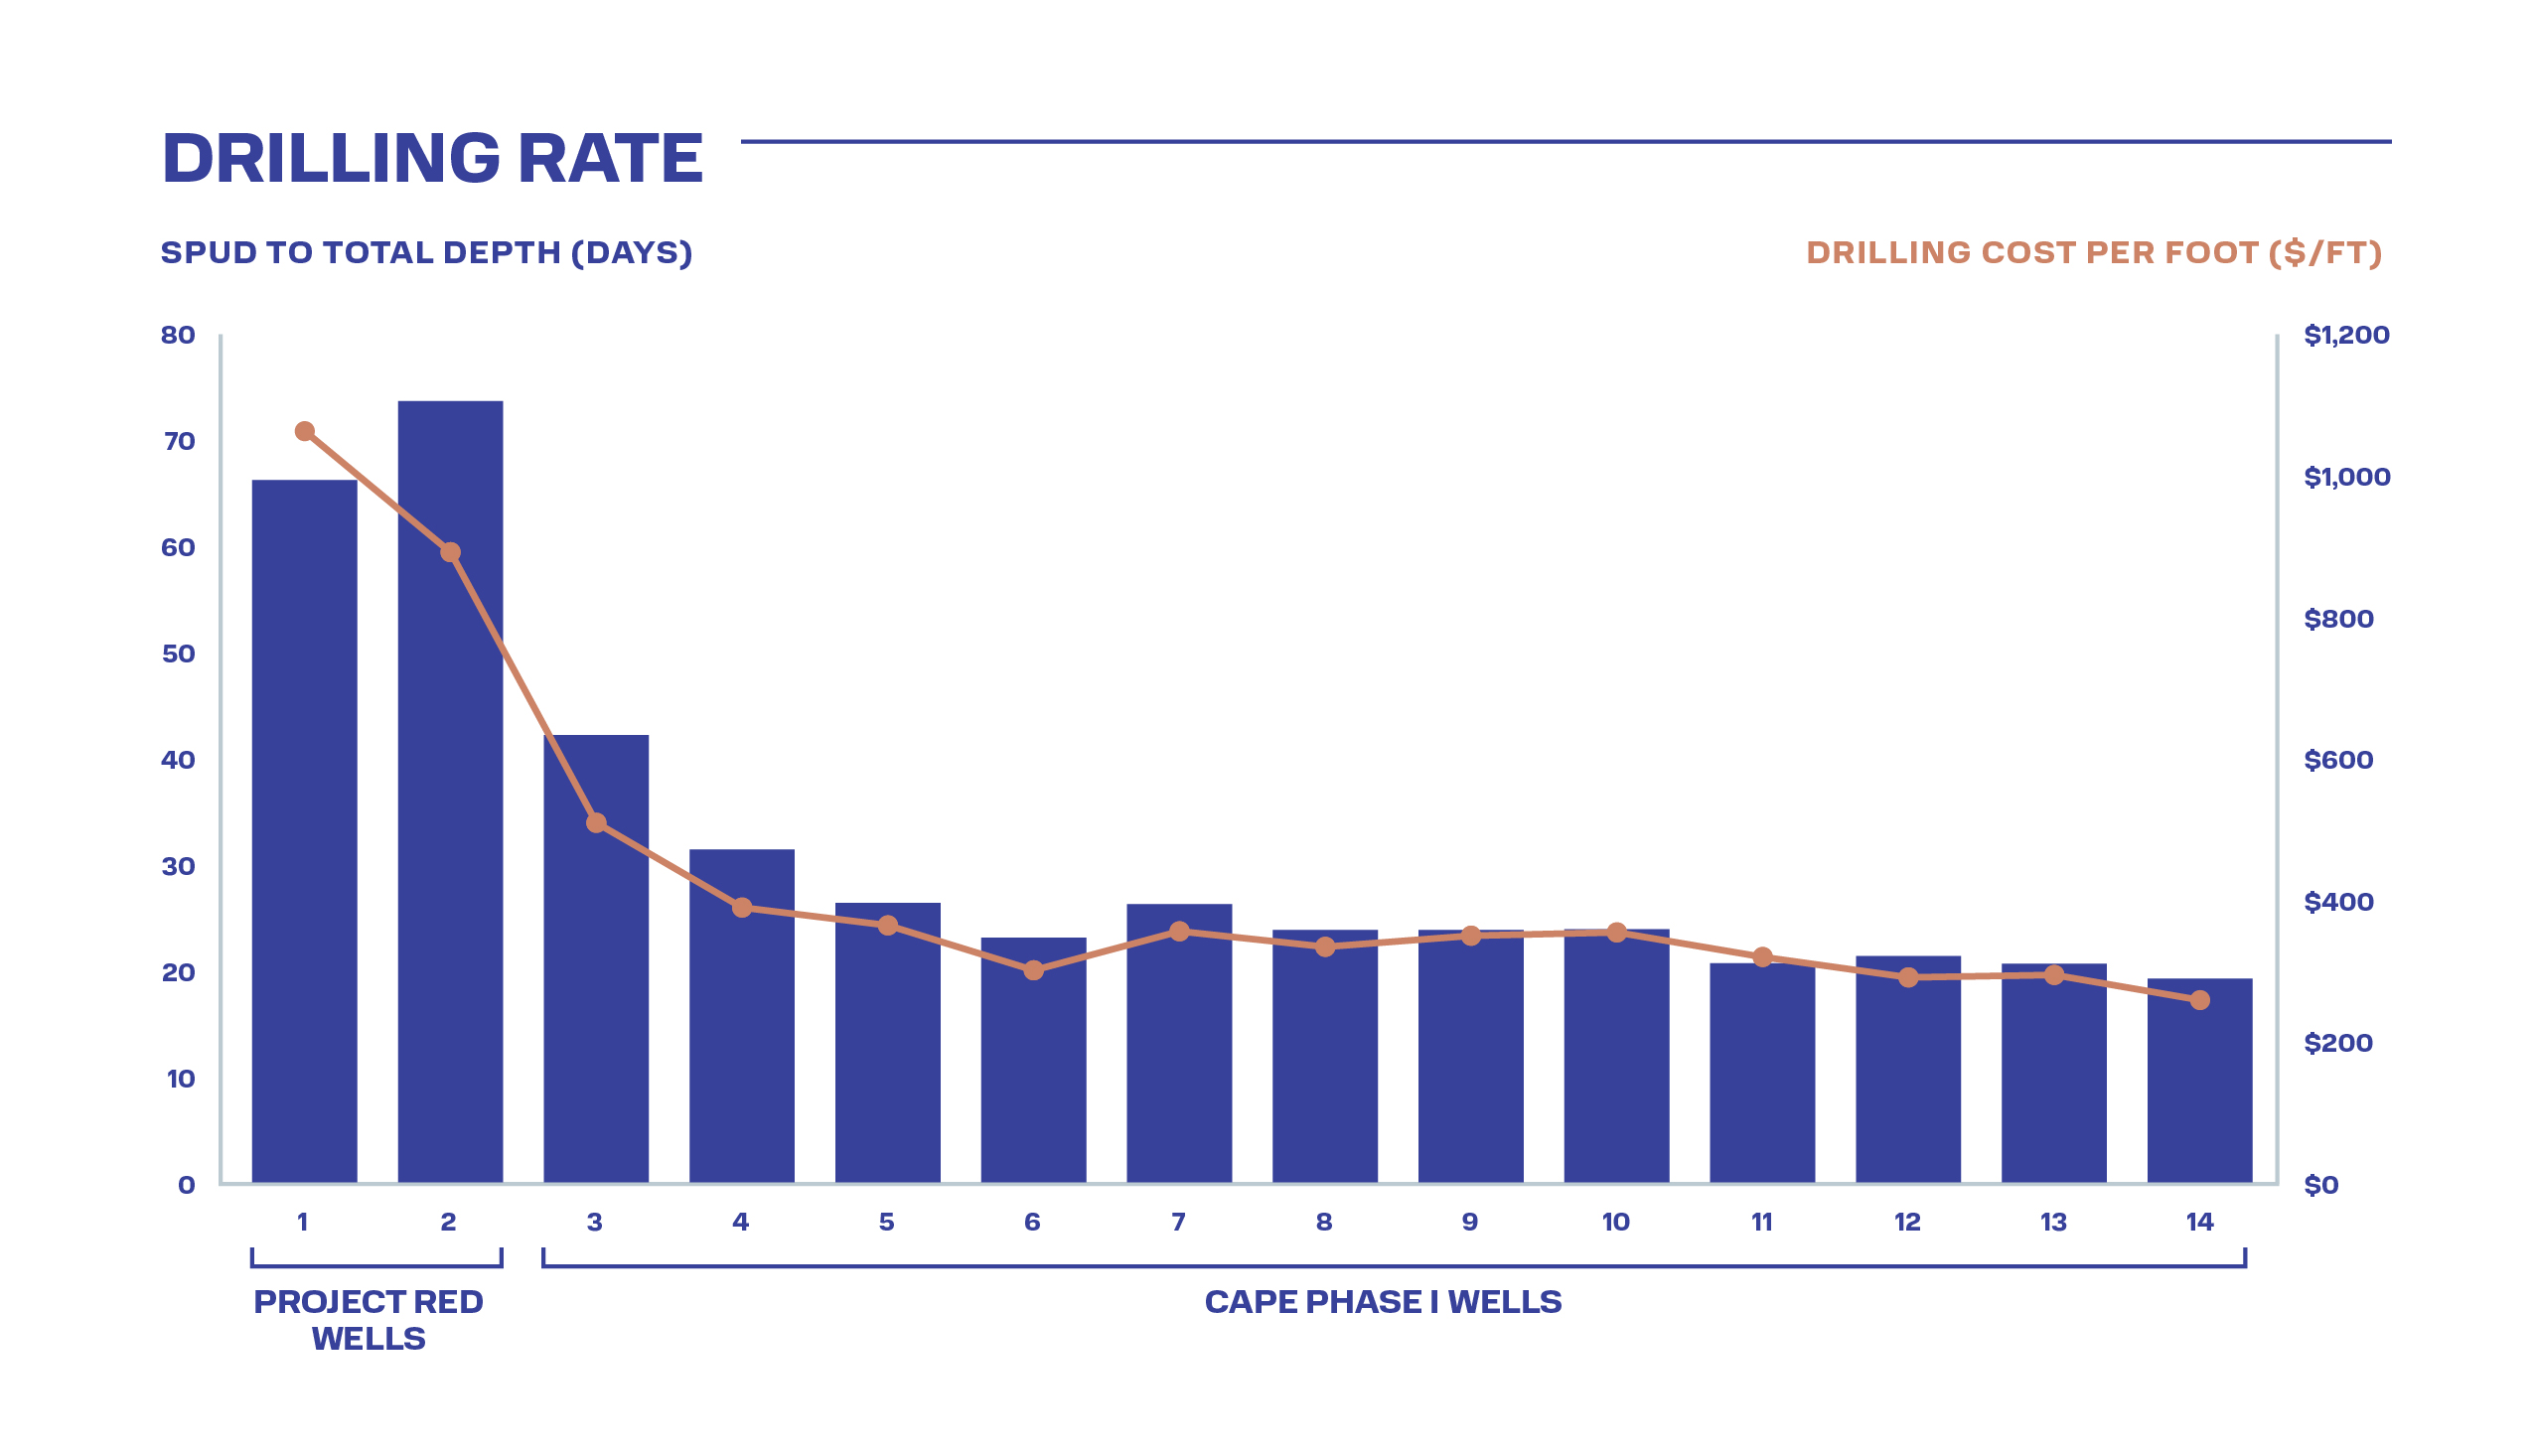
Source: Fervo Data
For our two Project Red wells, total vertical depths were approximately 7,500 feet and total measured depths
were approximately 11,000 feet, with a horizontal section of approximately 3,000 feet. For our Cape Station Phase I
subsurface construction, we increased the total vertical depths to approximately 9,000 feet and total measured depths
to approximately 14,000 feet, with a horizontal section of approximately 5,000 feet. We plan to drill approximately
8–10 wells per standardized GeoBlock. Planned well depths will vary and will be refined based on site‑specific
geology and geography, including subsurface thermal gradient, stress conditions, and structural or tectonic setting
pertinent to EGS, to intersect target heat‑bearing formations at the depths required for effective reservoir creation.
•Enhanced Production Performance – We seek to continue to increase output and efficiency through
improvements in well design, reservoir engineering, and surface facility optimization. We have already
deployed progressively longer lateral wells and have targeted progressively higher temperature formations
to enhance heat recovery from each well and improve power conversion efficiency. For example, our
Project Red wells have maximum lateral lengths of approximately 3,000 feet and target formation
temperatures of approximately 350°F, whereas the Cape Station Phase I wells have maximum lateral
lengths of approximately 5,000 feet and target higher formation temperatures of approximately 400°F.
These design choices reflect our progression toward longer laterals and hotter reservoirs in successive
phases, with Cape Station Phase I representing a step-change relative to Project Red. Proprietary
stimulation techniques and real-time monitoring allow us to optimize flow distribution and thermal
recovery. We continuously refine our approaches to drilling, completions, and facility configuration to
deliver incremental performance gains with each successive phase of each project.
11
•Economies of Scale – Our GeoCluster-focused approach supports the development of shared infrastructure
and streamlined supply chains. By replicating uniform GeoBlocks across multiple sites, the company
achieves procurement leverage, lowering capital intensity and increasing the predictability of long-lead
time equipment supply. We expect multi-gigawatt GeoClusters will allow us to capture scale efficiencies
across engineering, construction, manufacturing, workforce, and operations, further enhancing project
returns and improving overall company economics.
Together, we believe these capabilities create a compounding advantage across our portfolio. We expect that
repeatability, enhanced production performance, and economies of scale will contribute to lower capital intensity
and higher margins on a per-megawatt basis and enhance project-level cash generation. As additional GeoBlocks are
deployed across GeoClusters, we expect continued reductions in cost per megawatt and improvements in return on
invested capital, reinforcing the company’s ability to deliver sustained value.
Source: Midpoint for geothermal capacity factor, Rystad Energy.
Our Opportunity
Driven by surging load from AI and data centers and accelerating electrification across transportation,
buildings, and industry, the U.S. power market is approaching a decisive inflection point as electricity demand
outpaces new planned generation. At the same time, Rystad notes that roughly 66 gigawatts of aging accredited
capacity are expected to retire by 2035, which is projected to lead to a nationwide accredited capacity shortfall of
approximately 98 gigawatts by 2035. Underlying this accredited capacity shortfall is the disproportionate retirement
of baseload power sources, namely coal, which comprises 80% of net power retirement through 2035. To close the
projected capacity shortfall, the market will require substantial incremental firm generation.
A firm energy resource, like geothermal, natural gas, nuclear or coal, can reliably deliver electricity at consistent
levels for long durations and typically has a capacity factor above 75%. Because of its reliable nature, firm power is
critical for the inflexible demand profiles of data centers, as well as industrial and commercial consumers. However,
market participants expect the projected shortfall in firm power generation to be increasingly plugged by intermittent
renewables (wind, solar, often paired with batteries to extend availability); Rystad predicts that renewables could
comprise 32% of all U.S. power generation by 2035. Meanwhile, rising peak demand, in conjunction with planned
firm power retirements, is driving down reserve margins across the U.S., making additional firm capacity critical.
This mismatch in supply and demand has manifested itself in progressively higher PPA prices for firm energy
resources. Rystad reports that clean, firm energy sources, like EGS, can command pricing in the range of $100-130
per megawatt-hour.
12
According to Rystad, if EGS were to meet the emerging accredited capacity gap in the U.S. alone, the annual
addressable market would be approximately $70.0 billion by 2035. Assuming a 30-year asset life, this represents a
$2.1 trillion revenue potential opportunity.
We believe we are well positioned to meet this moment. Our EGS technology is proven and scalable. Our
modular engineering approach supports rapid deployment. Our commercial pipeline is advanced, our wellfield
supply chain and labor force are mature, and our intellectual property is broad, while our acreage holdings contain
approximately 595,900 acres of geothermal leases that provide significant room for expansion. These advantages
position us to become one of the largest providers of scalable, carbon-free baseload power over the next decade.
The following factors highlight the structural demand-supply imbalance in U.S. power markets and underscore
why we believe that scalable, firm, carbon-free solutions like EGS are positioned to capture outsized value in the
decade ahead.
•All-Time High Power Demand – After two decades of relatively stable load growth between 2000 and
2020, energy demand is rising steeply and rapidly driven by the artificial intelligence (“AI”) boom,
renewed onshoring of manufacturing and economy-wide electrification. The chart below demonstrates the
accelerating pace of load growth in the United States.
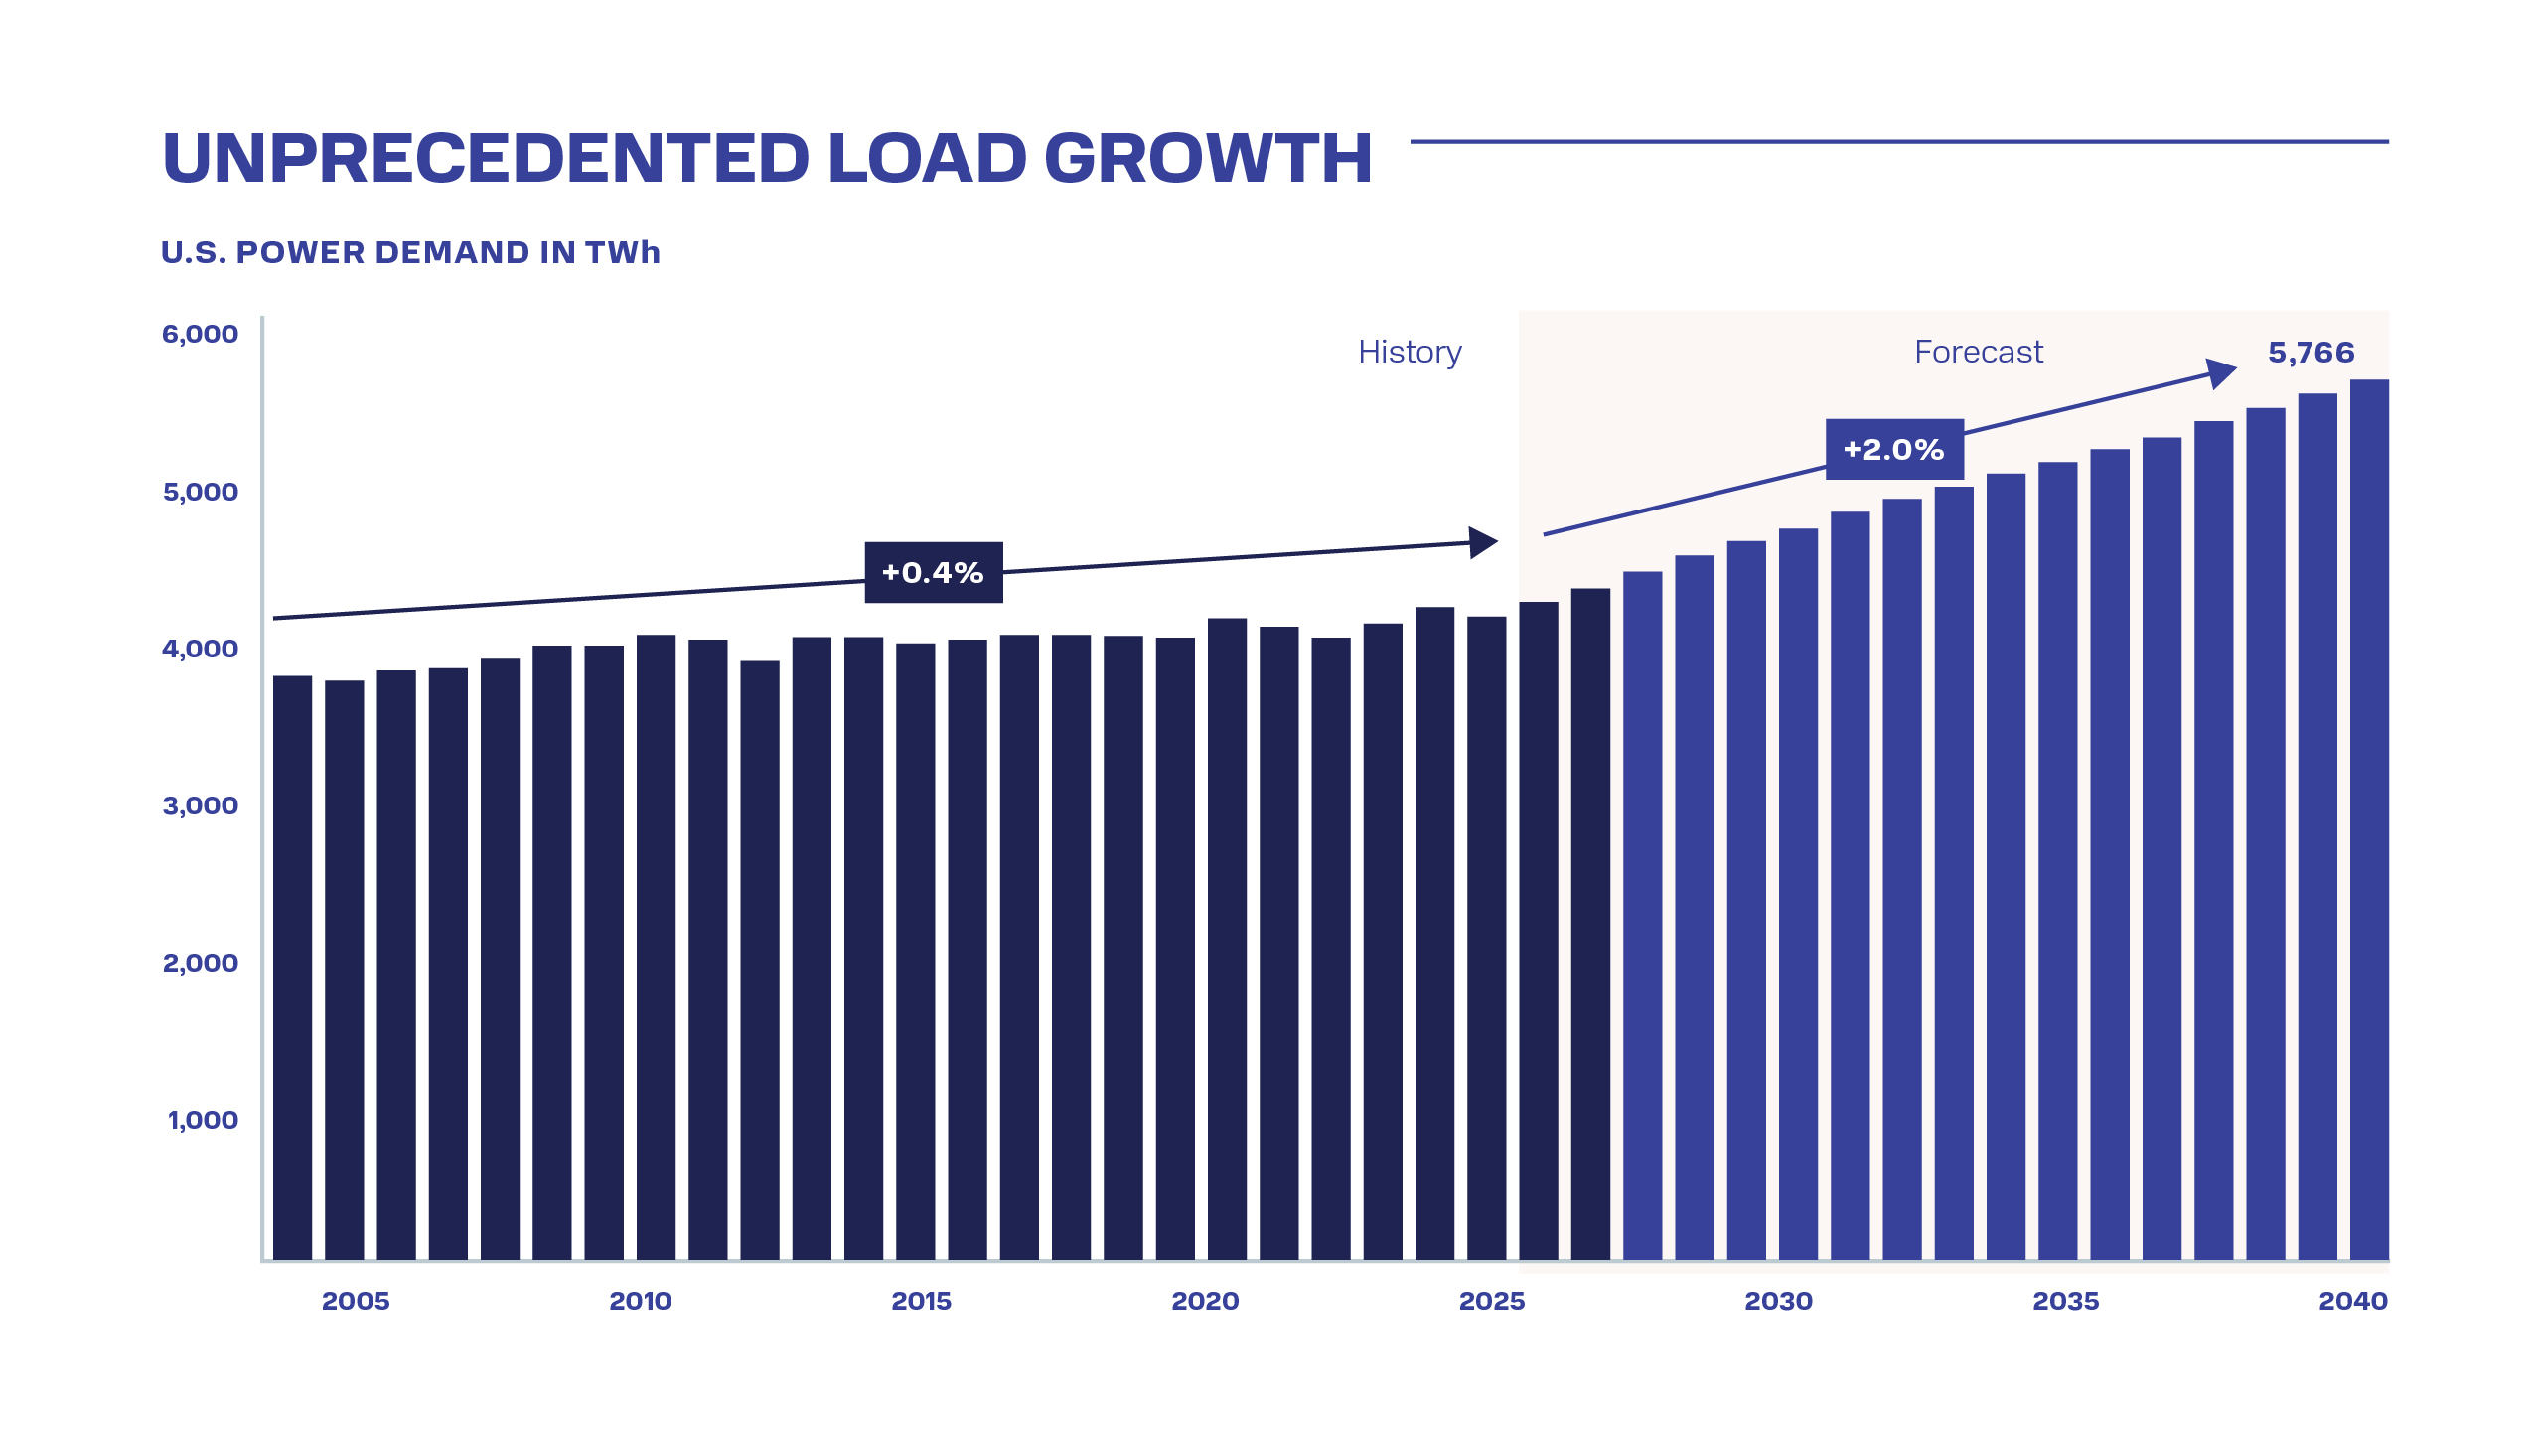
Source: Rystad Energy.
13
•Deficient Supply Alternatives. – The U.S. energy system is facing a severe supply constraint caused by
insufficient new capacity additions and aging infrastructure. Existing power supply alternatives face various
limitations in this time of great need. Variable renewable energy resources (“VREs”) like solar and wind
have expanded rapidly but can only meet certain hours of demand, even when coupled with battery storage.
Firm energy resources like natural gas face supply chain bottlenecks and volatile fuel pricing. Nuclear
power remains a critical firm energy resource, but new large-scale projects are battling high costs and long
development timelines. The charts below demonstrate the lack of baseload power expected to be added to
the U.S. energy system, and the particular impact on the Western U.S., our current area of operations.
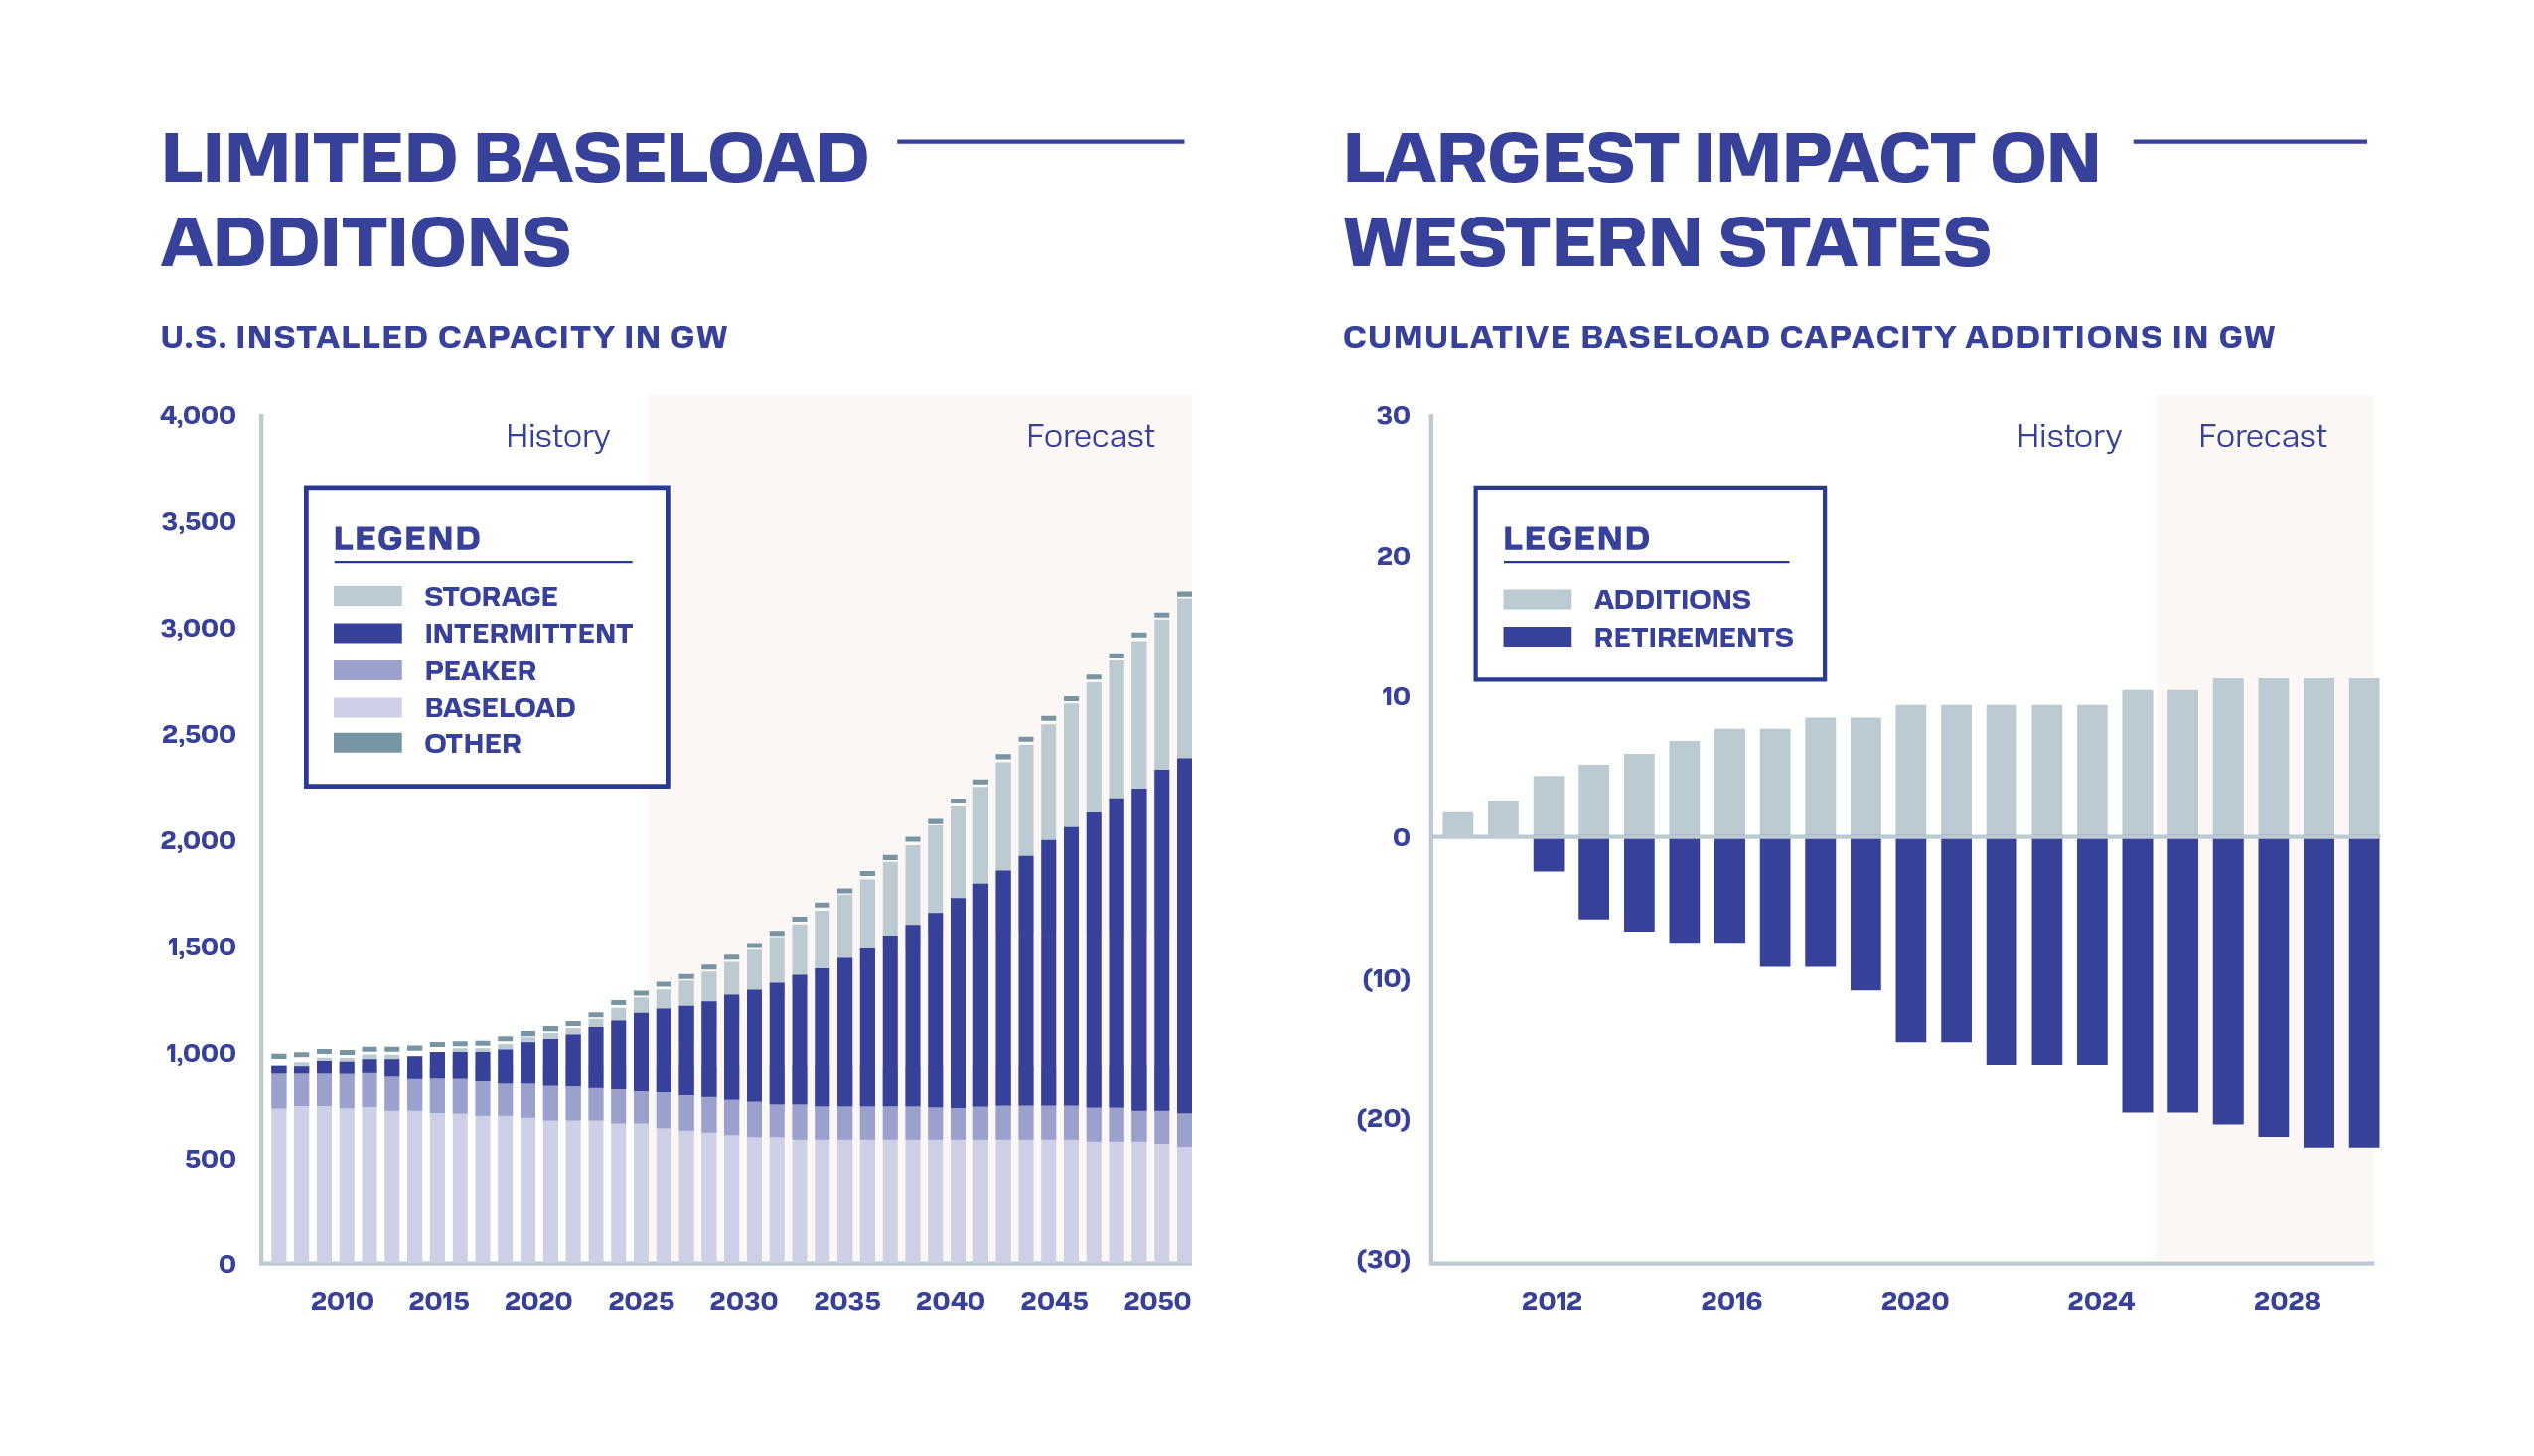
Source: Rystad Energy.
Our Innovative Solution
We have successfully applied proven technological innovations from the American oil and gas industry to
kickstart what we expect to be another great American industry: next-generation geothermal. Across every layer of
our technology stack, we endeavor to target and systematically eliminate key constraints to traditional geothermal
development to make geothermal energy the most dependable and affordable source of power in America.
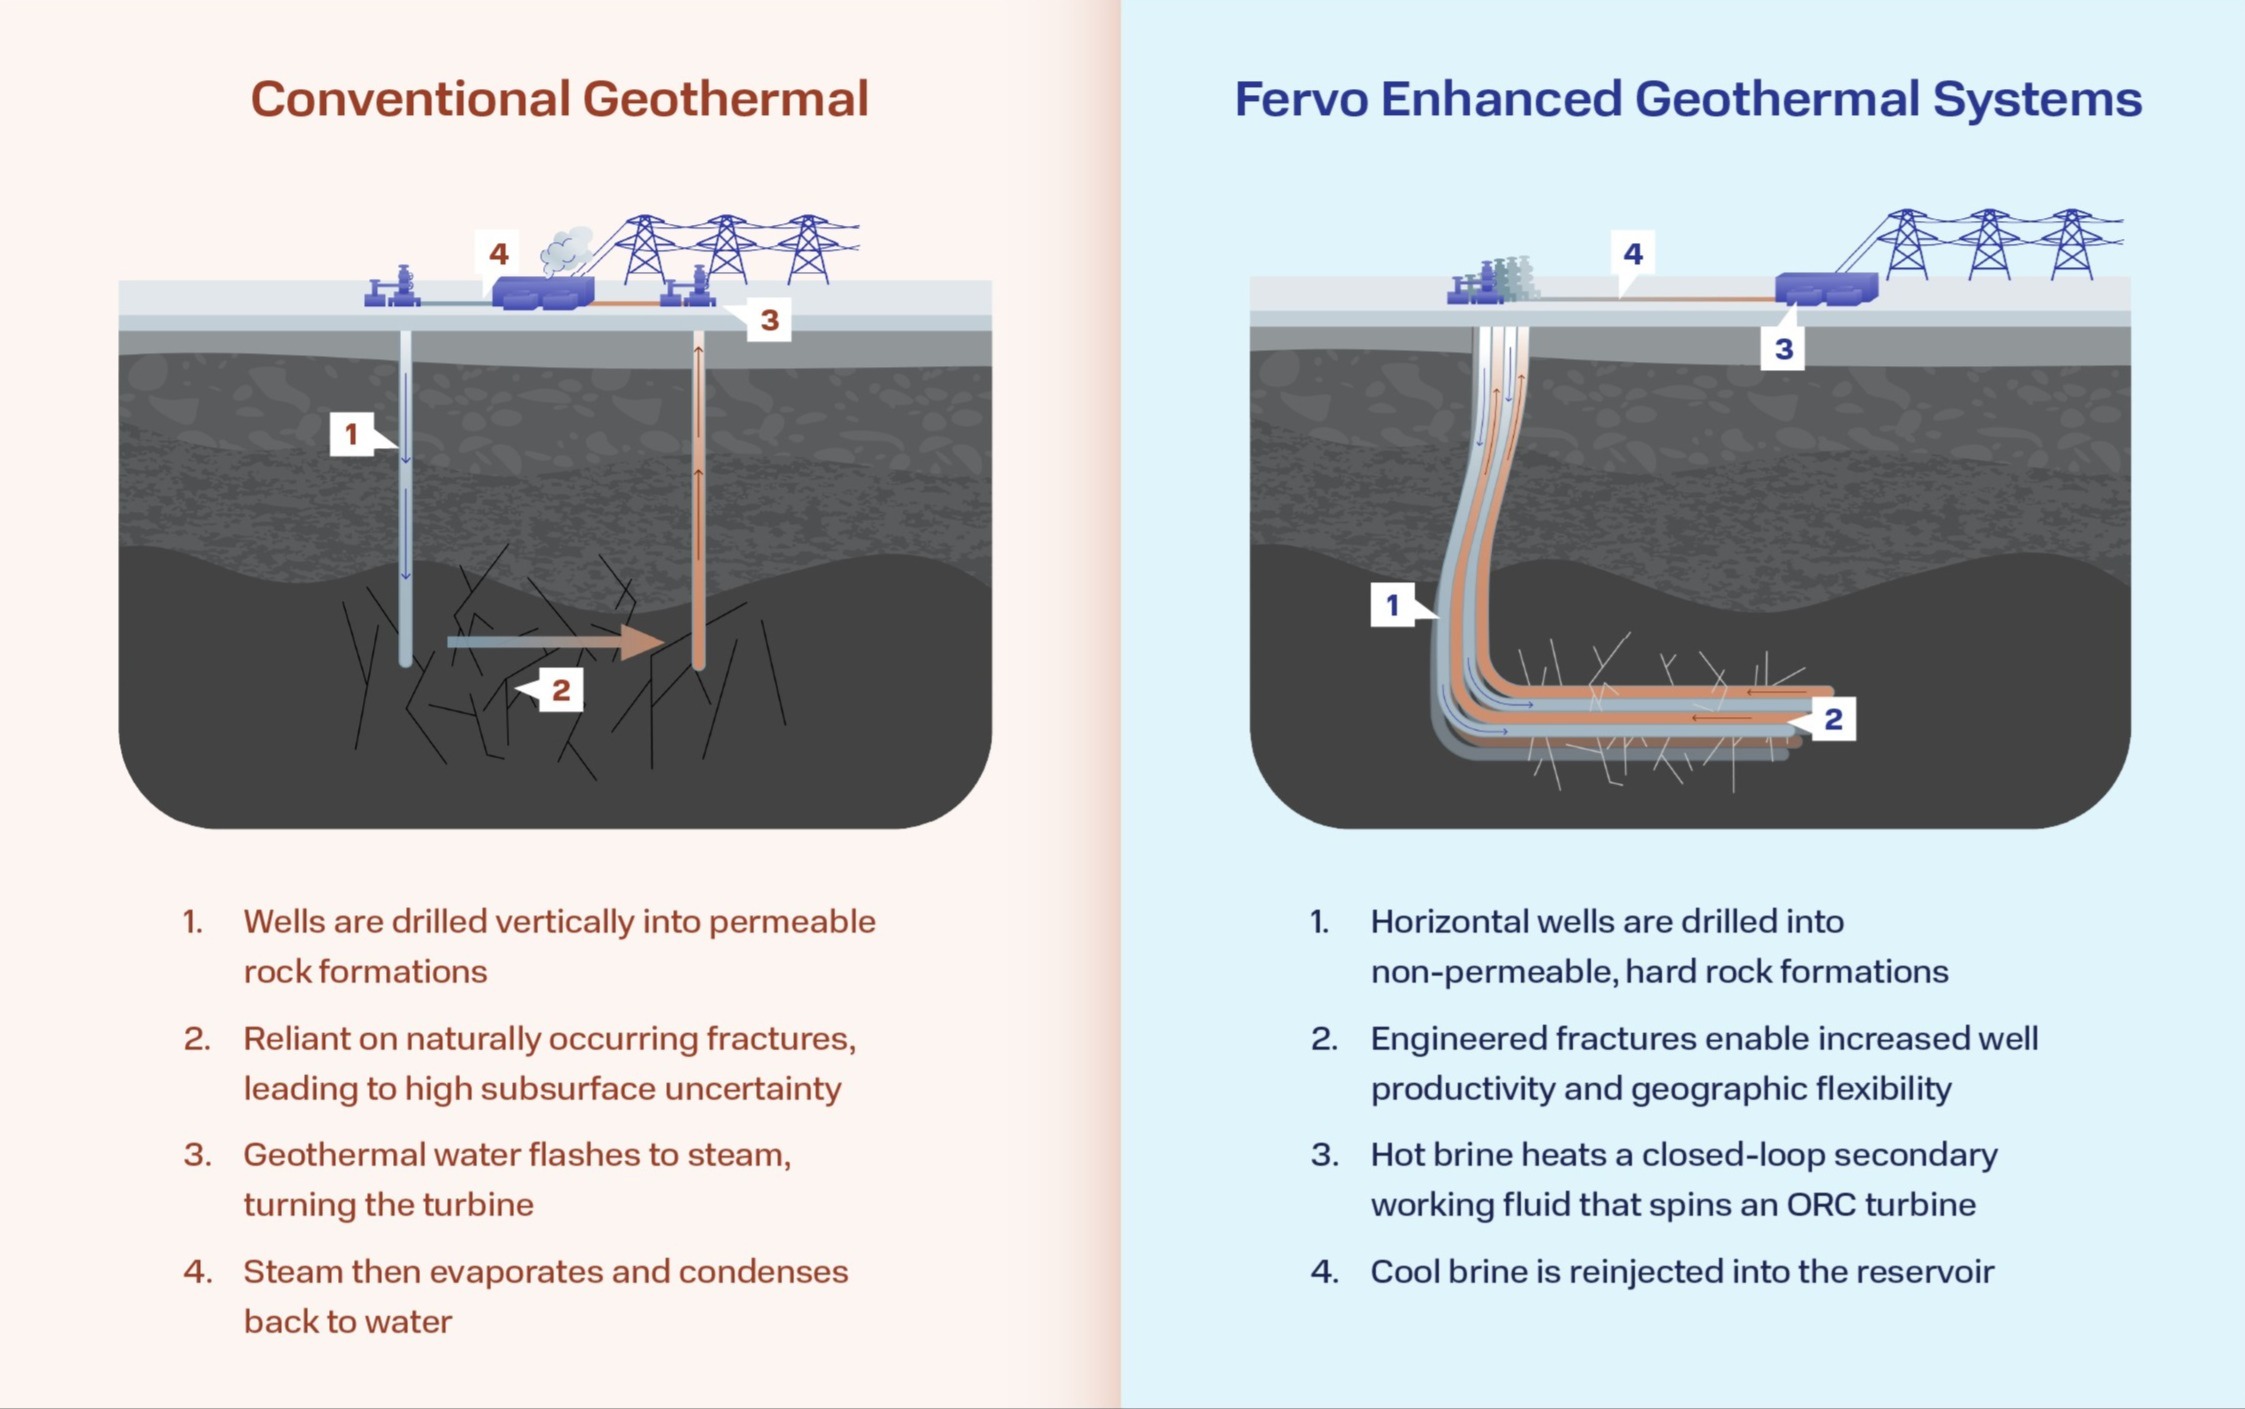
Conventional geothermal developers cede control of their projects to the whims of subsurface geology, relying
on natural fracture networks in hot rock to access heat for power generation. This approach restricts development to
a select few locations with adequate subsurface conditions, introduces binary dry hole risk given the unpredictability
of natural fractures, and imposes a fixed upper bound on reservoir-wide power output. Constrained by the resource
size available in natural fractures, conventional geothermal developers have historically been unable to drill new
wells to make up additional capacity if projects underperform, adding additional tail risk after the project is built.
Rather than accept the variability of drilling vertical wells into a natural fracture network, we use proven
technology from the oil and gas industry to build a tightly controlled system for heat extraction in low-permeability
geothermal formations. We engineer these reservoirs by drilling sets of parallel horizontal injection and production
wells through hot rock, accessing a zone of the geothermal reservoir with a highly predictable volume of heat in
place. We then use multistage hydraulic fracturing to connect the wells, establishing pathways and sufficient surface
area in the rock through which water can flow, heat up, and return to the surface for power generation. We also
install AI-enhanced fiber optic sensing cables to measure reservoir conditions in real-time. This data is then used to
14
continuously monitor flow rates, pressures, and temperatures across the wellfield, allowing us to predict and
optimize future well output. Our proprietary, data‑assimilative models integrate continuous temperature and pressure
profiles to update reservoir state in real time, enabling more accurate production forecasts and proactive decisions to
sustain deliverability and recoverable heat. Our approach allows us to actively manage long-term reservoir
performance; if production falls off in any part of the field, we are able to drill infill wells or simply drill new wells
to mine additional heat and extend overall reservoir lifetime.
Instead of creating separate one-off vertical wells (each with a separate well pad) across a field, we can access
vast quantities of subsurface heat by drilling many horizontal wells from a single pad with a compact footprint,
dramatically reducing land disturbance. This approach replicates the successful wellfield design used in the shale oil
and gas revolution. However, unlike in shale, where operators typically target specific and sometimes narrow
payzones, we can access progressively hotter rock the deeper we drill. Our reservoir is only bounded by temperature,
with the minimum temperature established by power plant efficiency and the maximum temperature established by
the temperature limits of subsurface equipment. At present, we apply a minimum reservoir temperature of
approximately 300°F and a maximum reservoir temperature of approximately 625°F, and we utilize a cutoff vertical
depth of about 13,000 feet to define resources we consider technically and commercially viable. These parameters
may evolve over time with improvements in drilling and subsurface technology or changes in market conditions (for
example, higher PPA pricing can support lower temperatures or deeper drilling). As a result, our payzones already
extend thousands of feet in thickness, and we expect these will continue to grow over time as better drilling
technology is developed.
Our Wellfield Production
Data observed from our projects to date has validated our approach. In 2023, we brought our pilot, Project Red,
online. The project quickly demonstrated record 24/7 carbon-free power production, generating three megawatts of
gross power production to the Nevada grid and proving the commercial viability of our innovative drilling
technology. Additionally, at our Project Red commercial pilot, we have observed consistent, stable temperature
output in line with our modeling and expectations. To date, Project Red has not experienced the kind of premature
thermal decline that has long plagued traditional geothermal projects.
15
We apply advanced data analytics, computational modeling, and data-driven empirical modeling to generate
high-fidelity production forecasts to optimize the economics of our projects. After pioneering the installation of
permanent AI-enhanced fiber optics in geothermal wells, we have collected over 500 terabytes of downhole data that
have been analyzed and used to improve well spacing, completion design, and wellfield optimization. With every
well drilled, casing string installed, and flow test completed, we deepen our knowledge of EGS reservoirs and
extend our first-mover advantage.
Our Scalable Deployment
Our approach is designed specifically with scale in mind. With geothermal heat recovery substantially de-
risked, we can leverage a modular, standardized approach to on-surface power generation to drive cost reductions,
increase deployment speed, and leverage economies of scale and flexibility in our supply chain. We plan to deploy
standardized, 50-megawatt ORC power facilities that we call GeoBlocks. Production wells send hot geothermal
brine to a heat exchanger, where it transfers heat to a working fluid. After transferring heat, the cooled geothermal
brine is reinjected underground to cycle through the geothermal reservoir again. In the heat exchanger, the working
fluid is vaporized, ultimately spinning a turbine to create electricity. The vapor is then cooled back into a liquid
using air-cooled condensers to minimize water usage.
We have already secured binding contracts for 500 megawatts of ORC turbine capacity through partnerships
with Baker Hughes and Turboden (a wholly-owned subsidiary of Mitsubishi) for our projects under construction,
and have further expanded this supply through a 1.7 gigawatt ORC turbine framework agreement with Turboden.
These manufacturers have longstanding ORC business units that stand apart from natural gas turbines, helping
support near-term ORC supply even as gas turbines remain backlogged.
GeoBlocks are engineered for rapid scalability. When aggregated, multiple GeoBlocks make up a GeoCluster,
which we define as a multi-gigawatt geothermal power hub designed to provide substantial generation while
streamlining construction and operations. With approximately 595,900 acres of geothermal leases across the United
States as of December 31, 2025, we are primed to implement several GeoCluster power hubs in the next decade with
the potential to support more than one power market. A majority of our leases have a 10-year initial term, and in
most cases, extension options.
To date, all of our commercial contracts feed electrons to the power grid. But by deploying multi-gigawatt
GeoClusters, we can mitigate transmission risk associated with our projects. First, the size and capacity factor of our
projects are catalyzing partnerships with transmission developers who seek project certainty and high line
utilization. We are also pursuing behind-the-meter partnerships with hyperscalers who seek large generation and
high uptime. We believe that our GeoCluster approach for AI data center development pairs a repeatable, flexible
commercial framework with a modular, scalable power solution aligned with hyperscale customer demand and
supports definitive offtake agreements over time. Ultimately, we can blend behind-the-meter and transmission
solutions, maximizing resilience and redundancy at a single site.
Our Customers
Our customers have the following profile:
•Customers who want reliability. Utilities cannot replace baseload coal and nuclear plants with solely
intermittent resources such as wind and solar power. To ensure a safe, functional and reliable grid capable
of addressing demand peaks, utilities must procure a new generation of baseload options. Likewise,
hyperscalers demand reliability to maximize uptime for their AI models.
•Customers who seek a near-term solution. Power buyers place a premium on near-term deliverability. In
the race for AI dominance, hyperscalers continue to construct additional data center capacity to avoid
falling behind their foreign and domestic competitors. This arms race mentality has pushed leading AI
companies to go to extreme lengths to obtain more power. For example, xAI has taken the extraordinary
step of purchasing a natural gas power plant overseas and shipping it to the U.S. to power a 2-gigawatt data
center. Utilities, too, recognize the time-sensitivity of bringing new supply online. According to Rystad,
16
many states across the western United States could face capacity shortfalls by 2031. To address this risk,
utility commissions are increasingly pushing load-serving entities to procure additional reliable power.
•Customers who demand cost-competitiveness. Even as PPA prices continue to rise, buyers maintain price
ceilings above which baseload power procurement remains unattractive. Especially as popular attention on
electricity prices increases, utilities will have to guard against serious cost inflation to remain viable.
•Customers who seek carbon-free solutions. Whether because of state-level renewable energy mandates or
voluntary emissions reduction commitments, a wide variety of buyers continue to prioritize carbon-free,
clean energy sources. For utilities in certain jurisdictions, political pressure has increased the urgency of
clean power procurement.
The EGS technology we pioneered is very well suited to meet our customers’ power procurement needs:
•We offer reliability. EGS projects provide high-capacity-factor baseload power, with no fuel price
exposure.
•We deliver power now. Our EGS technology is one of the few 24/7 power solutions capable of bringing
incremental generation online before 2030. We expect to begin delivering first power from our 500-
megawatt Cape Station project by late 2026, and to reach approximately 100 megawatts of operating
capacity by early 2027.
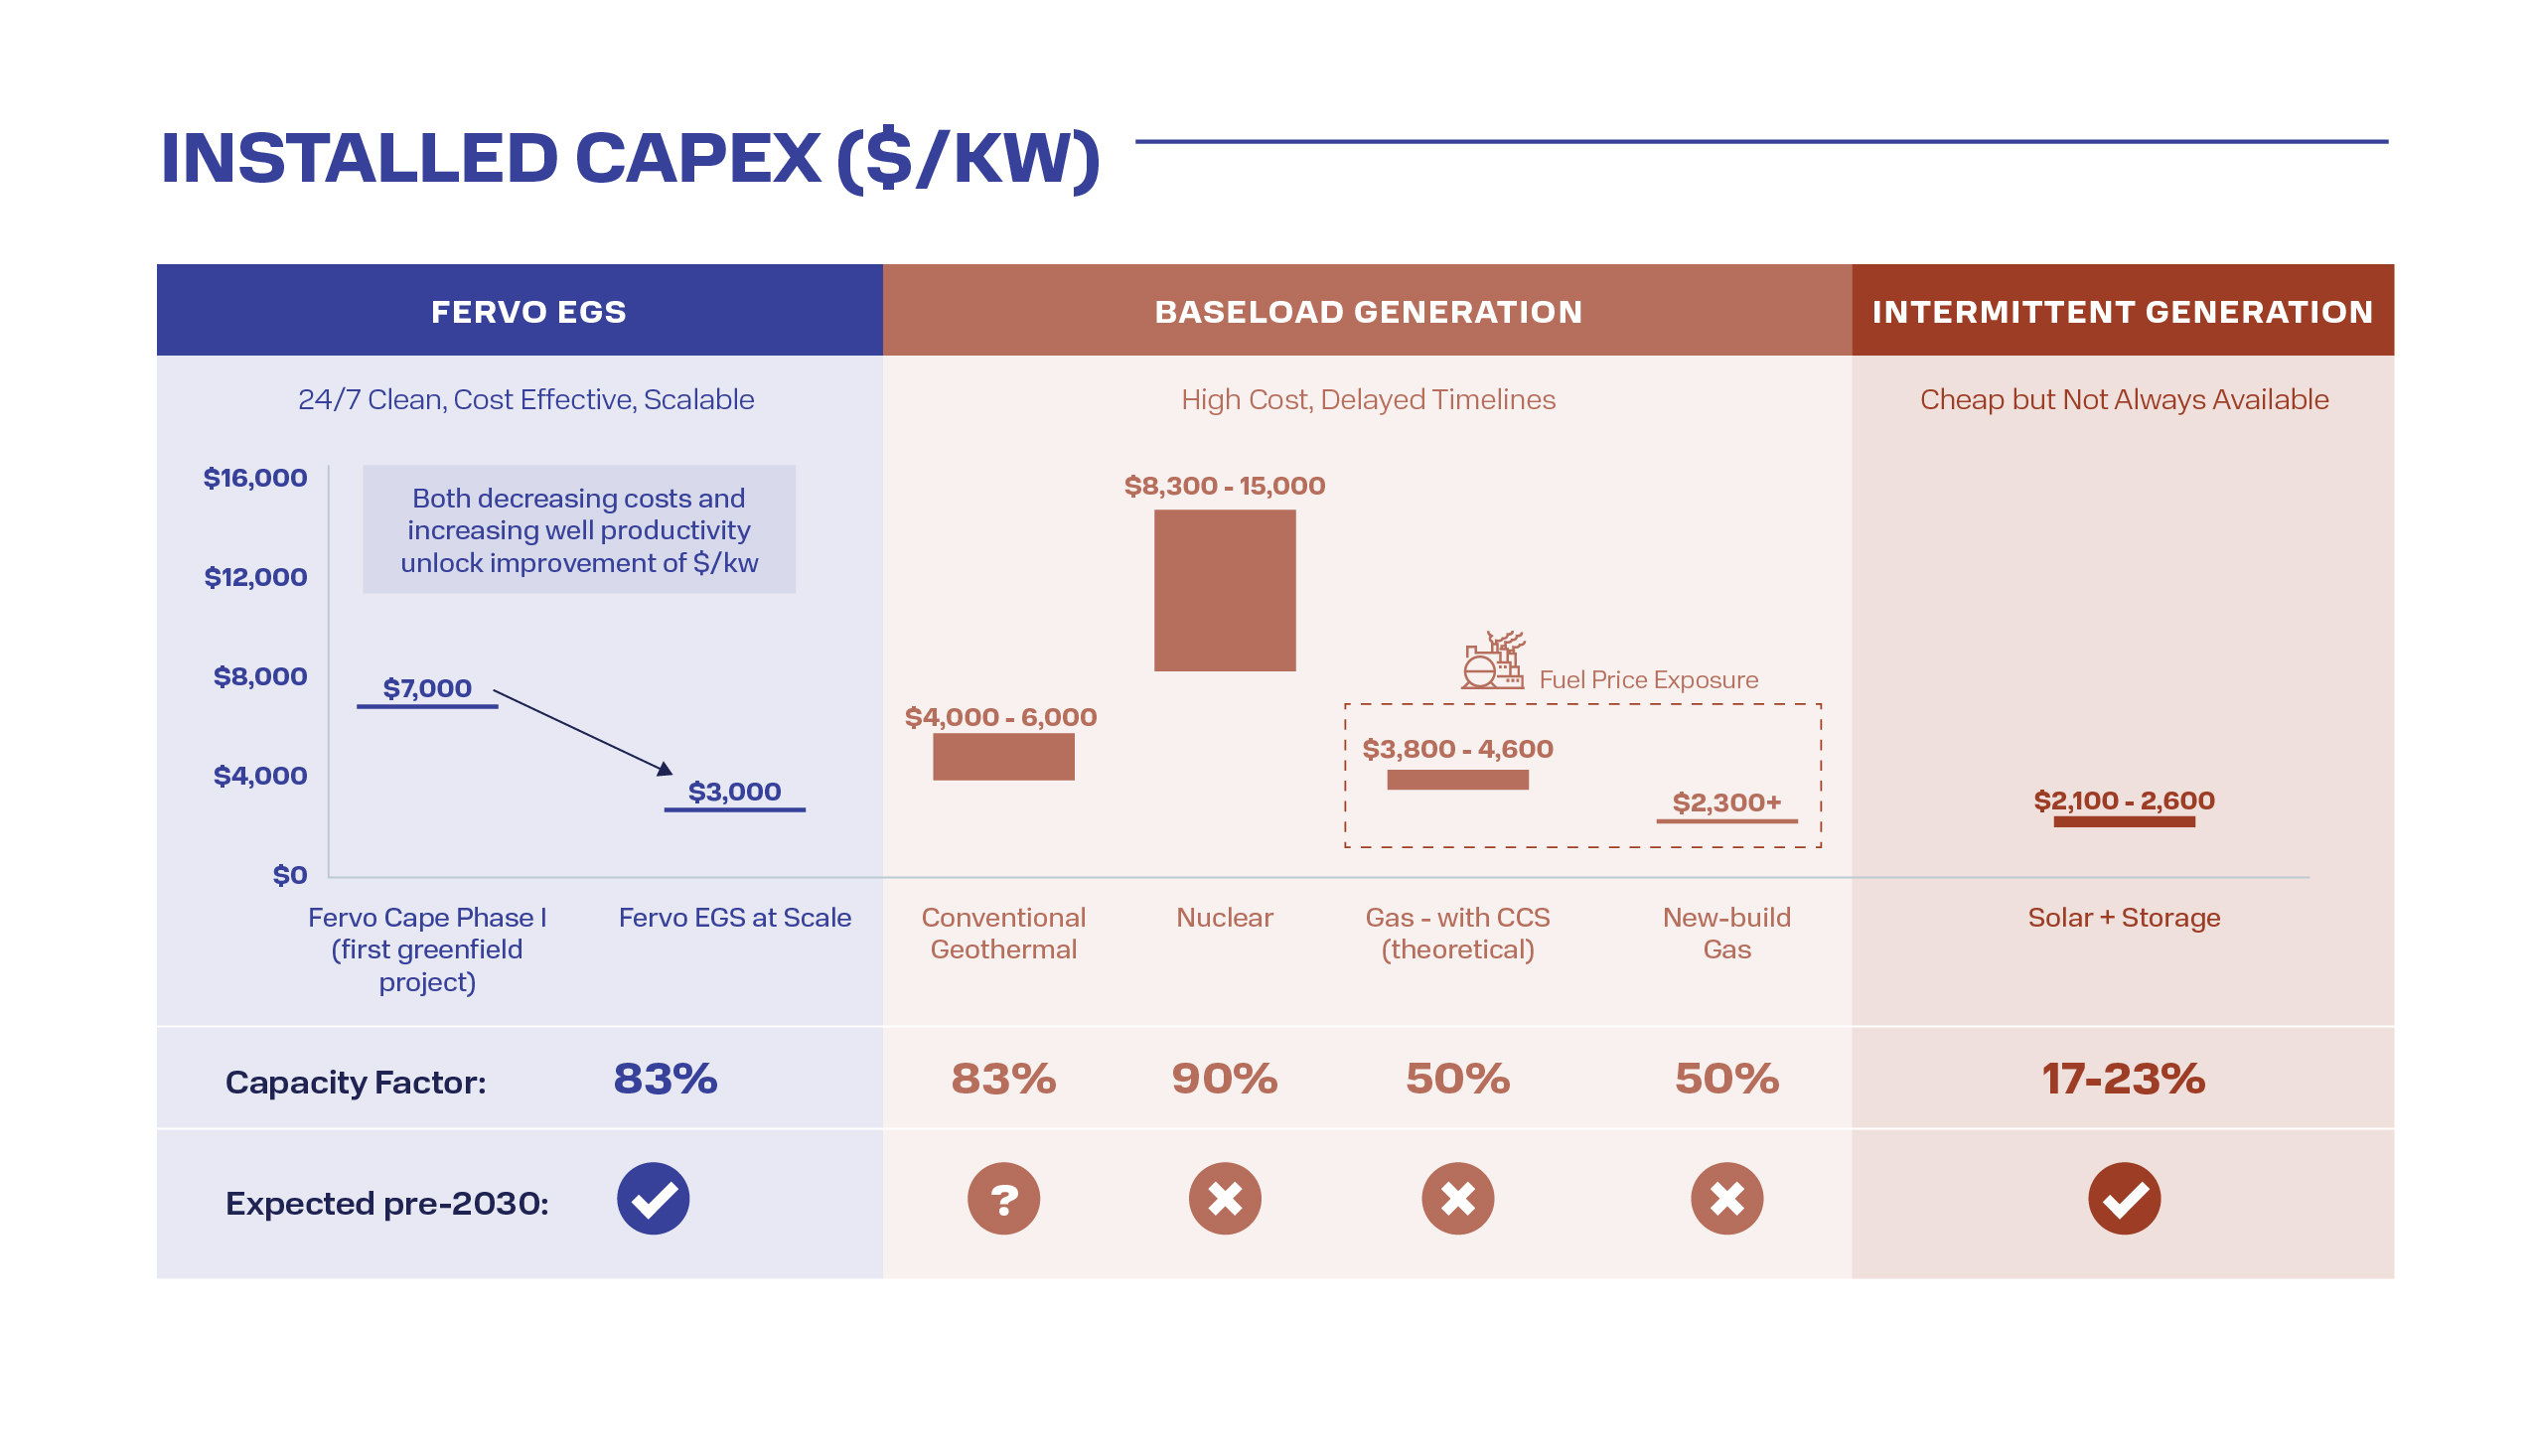
•We offer an economic, non-volatile alternative. At approximately $7,000/kW, our first Cape Station
project already outcompetes both traditional and small modular nuclear power in overnight capital costs.
Over time, our goal is to achieve scale and drive down prices such that we’re able to outcompete gas by
achieving an Nth-of-a-kind project cost of $3,000/kW without fuel price exposure. Unlike conventional
power producers, our “fuel” is geothermal heat. The cost of accessing it is embedded upfront in our
subsurface capital expenditures and water systems, not in an ongoing commodity expense. By eliminating
exposure to commodity price swings, we intend to deliver predictable, contractable pricing that reduces
hedging costs and risk premiums, which we believe provides economic value that our customers will
recognize and be willing to pay to secure. Beyond delivering power, we also sell multiple products,
including energy, capacity, and environmental attributes. This mix supports premium pricing and stronger
margins as markets increasingly value clean, 24/7 capacity and verified environmental attributes. This
fundamental advantage distinguishes us from traditional power companies and underpins the long-term
stability of our cost structure.
•We offer carbon-free, renewable power. According to the Department of Energy, EGS projects using
binary-cycle ORC power plants have a fraction of the emissions footprint as natural gas plants. The carbon-
free nature of our product makes EGS especially attractive in states with time-sensitive, ambitious
renewable portfolio standards and for corporate buyers who seek to maintain their climate goals.
17
These core attributes (reliability, deliverability, cost-competitiveness, and carbon-free) position our EGS
technology ahead of other power options, allowing us to capitalize on high, inelastic power demand.
Sources: Rystad Energy and management estimates.
Our Competitive Strengths
•First-Mover Advantage with Highly Advanced Development Portfolio: We are the global pioneer of EGS
technology. We successfully drilled and stimulated the country’s first commercial EGS wells at our pilot,
Project Red. With an operating pilot and two and a half years of 500 megawatts of greenfield construction
underway, including over 25 wells drilled, we maintain a significant first-mover lead in the EGS space.
These wells were drilled at our Cape Station project in Beaver County near Milford, Utah, and at Project
Red adjacent to the Blue Mountain geothermal field near Winnemucca in Humboldt County, Nevada. As of
December 31, 2025, our projects under construction accounted for approximately 13% of all geothermal
capacity under construction in the United States. By reducing subsurface risk in geothermal heat recovery,
we have increased the velocity with which megawatts can move through our development pipeline.
Additionally, with 595,900 leased acres as of December 31, 2025, we hold what we believe to be one of the
U.S.’s largest portfolios of high-quality geothermal leases. We assembled this position at a weighted
average of approximately $4 per acre during a period of minimal competition between 2019 and 2021, in
sharp contrast to current U.S. Bureau of Land Management lease sales in Utah and Nevada, where
maximum bids reached $344 and $410 per acre, respectively, in 2025. Many of those newly auctioned
parcels did not meet our standards for high-priority development and thus were outside our initial focus
areas, reflecting the quality of our acreage. According to Bloomberg, certain geothermal developers in Utah
and Nevada have paid hundreds of dollars per acre in 2025 for geothermal positions that failed to meet our
development standards. We are thus uniquely positioned as a first mover to capitalize on surging demand
for clean, firm, reliable power.
•Proven Ability to Secure Binding, Long-Term Offtake: We have executed 658 megawatts of binding
PPAs across each of our target customer verticals, including hyperscalers, major utilities (Southern
California Edison), community choice aggregators (Clean Power Alliance and Desert Community Energy)
and supermajor energy companies (Shell). These contracts were executed at attractive prices, representing
approximately $7.2 billion in potential revenue backlog. This commercial momentum is further bolstered
18
by a 3-gigawatt framework agreement with Google. Though not a binding, project-specific PPA, the
agreement provides a structured roadmap for future capacity expansion and establishes a repeatable model
for large-scale corporate offtake.
•Modular Design Enabling Speed to Power and Economies of Scale: We intend to deploy our technology
in 50-megawatt GeoBlocks, standardized ORC power units that we anticipate will extend our learning
curves from wellfield development to geothermal power plant construction. We expect to further support
these learning curves by concentrating our operations in multi-gigawatt GeoClusters. Each cluster can
support hundreds of EGS wells and dozens of adjacent GeoBlocks, creating unprecedented economies of
scale in the geothermal industry. We believe that this approach will make our cost-competitive EGS
solution increasingly attractive to high credit-quality offtakers and will assist us in catering to AI
hyperscalers that require speed-to-power, gigawatt-scale energy access, and 24/7 availability.
•Demonstrated Access to Asset-Level Capital Enables Financial Flexibility: As of December 31, 2025, we
had raised $320.6 million of project level capital, comprised of $175.0 million of project-level equity and
$145.6 million of project-level debt. Subsequently, on March 6, 2026, we closed an approximately $421.4
million project finance credit facility with a syndicate of nine lenders (the “Project Granite Facility”) for the
first phase of our Cape Station development. Our relationships with leading capital providers give us the
flexibility to secure lower-cost, non-dilutive project-level financing, extending the runway of our corporate
funds while accelerating deployment and substantially de-risking our funding strategy through diversified
sources of capital.
•Robust Intellectual Property Portfolio: We have a comprehensive intellectual property portfolio which
includes patents and trade secrets covering many material proprietary aspects of our EGS technology. Our
key patents and trade secrets deter competitors from employing critical but protected processes required to
create and manage the subsurface flow of geothermal brine.
•Resilient Development Approach Leveraging Secure Supply Chain: We have proven capable of
seamlessly scaling our operations through partnerships with well-established oilfield services providers
such as Liberty Energy, Helmerich & Payne and Vallourec. We have also developed durable partnerships
with ORC turbine manufacturers from key U.S. partner nations, such as Turboden (a wholly-owned
subsidiary of Mitsubishi) and Baker Hughes, which remain relatively insulated from tariffs and
procurement backlogs that are currently impacting natural gas turbines, along with primarily U.S.
headquartered balance of plant equipment providers.
•Founder-Led Management Team: Co-founders Tim Latimer and Dr. Jack Norbeck, along with our
executive leadership team, have over 125 years of energy experience across companies in upstream oil and
gas, oilfield services, and power and renewables, including Shell, BP, Chevron, BHP Billiton, NRG, Hess,
SLB, and NOV.
Our Growth Opportunities
Our principal growth strategies include:
•Progress GeoCluster Development: We have one gigawatt included in our Mature projects portfolio, with
500 megawatts categorized as Under Construction at our flagship GeoCluster Cape Station, with
commercial contracts in place and physical work underway. Additionally, we have 550 megawatts that we
categorize as Ready to Build across two different GeoClusters. These projects have already achieved key
development milestones, which have substantially derisked commercialization. We also have over 40
gigawatts in our Pipeline project portfolio, with 2.6 gigawatts categorized as under Advanced Development
and over 38 gigawatts under Early Development across ten GeoClusters. There are significant remaining
opportunities for development in our Prospects portfolio that spans the 595,900 acres of leased acreage
currently maintained in our portfolio. We aim to pursue development on our robust pipeline at a more
accelerated pace beyond 2030. See “Prospectus Summary—Our Project Pipeline” for more information
related to our projects.
19
•Execute Technology Roadmap and Achieve Nth-of-a-Kind Cost Structure: We believe our attractive
asset-level returns will continue to improve, following well-established learning curves observed across the
energy industry. By drilling deeper wells to access higher-temperature reservoirs, extending lateral lengths,
and widening wellbore diameters, we expect to achieve progressively higher power output per well.
Additional cost efficiencies will come from standardizing power generation equipment, securing multi-year
supply agreements, and capturing economies of scale across construction scopes. We believe these efforts
will reduce our costs from the current approximately $7,000/kW, already among the lowest-cost sources of
baseload power, toward our long-term target of $3,000/kW.
•Establish Programmatic Offtake Partnerships: We are pursuing multi-year, multi-gigawatt offtake
partnerships with both utilities and hyperscalers to substantially de-risk commercial development across
multiple GeoClusters. We believe that these offtake partnerships with hyperscalers – such as the 3-gigawatt
GFA – will provide us with a path to potentially capitalize on predictable, long-term demand, pricing
visibility, and opportunities for co-located, behind-the-meter development that will boost our positioning
among AI data centers.
•Expand Geographic Scope of Development: Building on our learning curves and demonstrated progress at
Project Red and Cape Station, we are codifying a repeatable playbook to expand commercial geothermal
development beyond beachhead locations in the western United States and into other power markets where
high wholesale power prices, particularly for baseload generation, present attractive growth opportunities.
Over time, we intend to deploy our EGS technology outside of the United States, prioritizing jurisdictions
with clear decarbonization mandates, supportive regulatory frameworks, and subsurface conditions
favorable to EGS development. We intend to advance this expansion through strategic partnerships and
targeted pilot projects to validate performance, adapt to local market requirements, and establish a
repeatable model for international scaling.
•Pursue Complementary Verticals: We believe we are well positioned to leverage our proven approach to
enter adjacent markets, including energy storage, industrial process heat, and district heating. We are one of
the leaders in innovation for subsurface energy storage through our tested and patented approach,
FervoFlex. Our ability to monetize both power and heat, moreover, distinguishes us from other power
providers. By unlocking new customer segments, we believe we will be able to meet the evolving needs of
industrial, commercial, municipal, and operating company energy buyers.
Recent Developments
Preliminary Financial and Operating Results for the Three Months Ended March 31, 2026 (Unaudited)
Set forth below are selected preliminary consolidated unaudited financial and operating results for the three
months ended March 31, 2026. Our complete consolidated financial statements for the three months ended March
31, 2026 are not yet available. The following information reflects our preliminary estimates with respect to the
results for the three months ended March 31, 2026, which are based on currently available information and are
subject to change. We have provided approximate amounts or ranges, rather than specific amounts, for the
preliminary results described below primarily because our financial closing procedures for the three months ended
March 31, 2026 are not yet complete and, as a result, our final results upon completion of our closing procedures
may vary from the preliminary estimates. These estimates should not be viewed as a substitute for interim financial
statements prepared in accordance with GAAP.
This selected preliminary consolidated financial data has been prepared by, and is the responsibility of, our
management. Our independent registered public accounting firm, Deloitte & Touche LLP, has not audited,
reviewed, compiled or performed any procedures with respect to this preliminary consolidated financial data.
Accordingly, Deloitte & Touche LLP does not express an opinion or any other form of assurance with respect
thereto.
Revenue generated during the three months ended March 31, 2026 and 2025 includes ancillary fees associated
with rights to geothermal production, which were immaterial for both periods and are not expected to be significant
to our long-term revenue generation, as we have not yet commenced large-scale commercial operations.
20
Additionally, for the three months ended March 31, 2026, we estimate net loss to be between $29.0 million and
$35.0 million as compared to net loss of $9.1 million for the three months ended March 31, 2025. The expected
increase in net loss is primarily expected to be due to increased general and administrative expenses driven by higher
employee-related costs from headcount growth to support project development and corporate operations, including
increased stock-based compensation expense related to stock options granted during the three months ended March
31, 2026, increased software and information technology costs, and costs associated with our transition to a public
company. In addition, the increase in net loss is expected to reflect non-cash valuation remeasurement losses in the
fair value of warrant liabilities during the three months ended March 31, 2026.
As of March 31, 2026, our cash and cash equivalents were approximately $280.8 million, compared to $461.8
million as of December 31, 2025. As of March 31, 2026, our long-term debt was approximately $189.8 million,
comprised of approximately $145.6 million outstanding under the XRC Facility and approximately $44.2 million
outstanding under the Credit Facility, compared to total principal due for long-term debt of $175.6 million as of
December 31, 2025. Subsequent to March 31, 2026, on April 14, 2026, we repaid all outstanding balances under the
XRC Facility using proceeds from the Project Granite Facility, an approximately $421.4 million project finance
credit facility with a syndicate of nine lenders for the first phase of our Cape Station development that we closed on
March 6, 2026. As of April 29, 2026, we had an aggregate of $64.0 million of borrowings outstanding under the
Credit Facility and $172.3 million of borrowings outstanding under the Project Granite Facility.
Preliminary Capital Expenditure and Construction Update
For the three months ended March 31, 2026, we estimate capital expenditures to be between $180.0 million and
$200.0 million, as compared to capital expenditures of $93.9 million for the three months ended March 31, 2025.
Capital expenditures during the period were primarily directed toward continued construction of our Cape Station
project in Utah, where we have approximately 500 megawatts of capacity under construction.
Preliminary Contractual and Commercial Update
As of March 31, 2026, we had 658 megawatts of binding power purchase agreements with remaining terms of
approximately 15 years, unchanged from December 31, 2025. In addition, during the three months ended March 31,
2026, we entered into a 3-gigawatt framework agreement with Google to advance and structure potential power
offtake opportunities for current and planned data centers in both grid-connected and alternative energy solutions.
For more information, please read “Business—Google Geothermal Framework Agreement” and “Risk Factors—The
GFA is a non-binding agreement, and does not obligate Google to purchase power from us.”
Cautionary Note Relating to Our Preliminary Financial and Operating Results
The selected preliminary consolidated financial data presented above for the three months ended March 31,
2026 is preliminary, is not a comprehensive statement of our financial results and is subject to completion of our
financial closing procedures. There are material limitations with making preliminary estimates of our financial and
operating results prior to the completion of our financial closing procedures and our auditors’ review procedures for
such period. It is possible that we, or our independent registered public accounting firm, may identify items that
require us to make adjustments to the preliminary estimates of financial and operating results contained herein.
Our financial statements for the period ended March 31, 2026 are not expected to be available until after this
offering is completed. Our actual results for the period ended March 31, 2026 are not expected to differ materially
from the preliminary estimates we have provided. However, these preliminary estimates are subject to completion of
our financial closing procedures, final adjustments, and other developments arising between now and the time that
our financial results for such period are finalized, which could result in changes to the preliminary estimates
presented herein.
Summary Risk Factors
There are a number of risks that you should understand before making an investment decision regarding this
offering. These risks are discussed more fully in the section titled “Risk Factors” following this prospectus
summary. If any of these risks actually occur, our business, financial condition, or results of operations could be
21
materially and adversely affected. In such case, the trading price of our Class A common stock would likely decline,
and you may lose all or part of your investment. These risks include, but are not limited to:
Risks Related to Our Business
•The nascent nature of our technology and the uncertainties related to its commercial viability and our
limited operating history;
•Challenges and risks associated with nearshoring supply chain operations;
•Supply chain constraints affecting project completion, costs, and timelines;
•Operational risks disrupting energy production, increasing costs, and affecting reputation;
•Limited availability of transformers and grid infrastructure, impeding project connectivity and revenue
generation;
•Dependence on third-party transmission systems, including potential curtailments or recalls that could
prevent delivery under our PPAs;
•Risks related to securing adequate interconnection and transmission capacity to support our project pipeline
and PPA delivery obligations;
•The need to obtain site-specific well permits and state and local authorizations (beyond federal approvals
and associated NEPA reviews);
•Risks related to our contractual obligations under our PPAs;
Risks Related to Our Industry
•Anticipated load growth may not materialize as expected, or at all;
•The potential for geothermal well underperformance or power plant underperformance, impacting energy
output and financial performance;
•Fluctuations in market demand for geothermal energy affecting growth and financial performance;
•Intense competition from other renewable energy sources impacting growth and profitability;
•Rapid technological change in the energy sector reducing geothermal competitiveness;
•Geological uncertainties affecting project feasibility, efficiency, and success;
•Environmental concerns and opposition leading to increased costs, delays, and reputational damage;
•Volatility in energy prices impacting revenues, profitability, and market competitiveness;
Risks Related to Our Financing
•The critical need to secure financing to support growth and project development;
•Potential effects of debt obligations on raising capital and cash reserves;
•Uncertainty regarding the availability and cost of non-recourse project finance, higher interest rates and
dependence on federal and state incentives;
Risks Related to Our Legal and Regulatory Concerns
•Our reliance on U.S. government land leases and the associated regulatory and operational risks;
22
•Tariffs and trade restrictions on steel and other materials, increasing costs and delaying projects;
•Lengthy and uncertain permitting processes delaying or preventing project development;
•Changes in laws, regulations or policies affecting operations, cost structure, and market opportunities;
•Legal challenges and other opposition to our projects;
•Compliance with FERC and NERC regimes, where non-compliance could result in penalties, operational
restrictions, or increased costs;
Risks Related to Information Technology, Cybersecurity, Data Privacy and Intellectual Property
•Intellectual property risks impacting our competitive position, innovation, and legal costs;
•Cybersecurity and operational technology risks, including cyber-attacks or other disruptions;
Risks Related to Financial and Accounting Matters
•Weaknesses in internal controls over financial reporting impacting our business and the value of our
common stock;
•Material limitations with making preliminary estimates of our financial and operating results for the period
ended March 31, 2026, prior to the completion of our and our auditors’ financial review procedures for
such period;
Risks Related to Our Employees and Workforce
•Our dependence on our senior management team and other highly technically skilled personnel and risks
related to their departure;
Risks Related to Owning Our Common Stock
•Concentrated control of the company by Co-Founders in a multi-class structure having an adverse impact
on the price of our common stock;
•The lack of an active, liquid, public market for our common stock and the risks inherent with a new and
uncertain offering of common stock.
Before you invest in our Class A common stock, you should carefully consider all of the information in this
prospectus, including matters set forth under the heading “Risk Factors.”
Implications of Being an Emerging Growth Company and Smaller Reporting Company
We qualify as an “emerging growth company” as defined in Section 2(a) of the Securities Act of 1933, as
amended (the “Securities Act”), as modified by the Jumpstart Our Business Startups Act of 2012 (the “JOBS Act”).
As an emerging growth company, we may take advantage of specified reduced disclosure and other requirements
that are otherwise applicable, in general, to public companies that are not emerging growth companies. These
provisions include:
•the presentation of only two years of audited financial statements and only two years of related
Management’s Discussion and Analysis of Financial Condition and Results of Operations in this
prospectus;
•reduced disclosure about our executive compensation arrangement;
•no requirement to conduct non-binding stockholder advisory votes on executive compensation or golden
parachute arrangements;
23
•exemption from compliance with the requirement of the Public Company Accounting Oversight Board
regarding communication of critical audit matters in the auditor’s report in the financial statements; and
•exemption from the auditor attestation requirement in the auditing assessment over internal control over
financial reporting.
We may take advantage of these provisions until the last day of our fiscal year following the fifth anniversary of
the date of the first sale of our common stock in this offering or such earlier time that we are no longer an emerging
growth company. We would cease to be an emerging growth company upon the earliest of: (i) the last day of the
first fiscal year in which our annual gross revenues are $1.235 billion or more; (ii) the date on which we have,
during the previous three-year period, issued more than $1.0 billion in non-convertible debt securities; or (iii) the
date on which we are deemed to be a “large accelerated filer,” which will occur as of the end of any fiscal year in
which we (x) have an aggregate market value of our common stock held by non-affiliates of $700 million or more as
of the last business day of our most recently completed second fiscal quarter, (y) have been required to file annual
and quarterly reports under the Securities and Exchange Act of 1934, as amended (the “Exchange Act”), for a period
of at least 12 months and (z) have filed at least one annual report pursuant to the Exchange Act.
We are also a “smaller reporting company,” meaning that the market value of our shares held by non-affiliates
plus the proposed aggregate amount of gross proceeds to us as a result of this offering is less than $700 million and
our annual revenue was less than $100 million during the most recently completed fiscal year. We may continue to
be a smaller reporting company after this offering if either (i) the market value of our shares held by non-affiliates is
less than $250 million or (ii) our annual revenue was less than $100 million during the most recently completed
fiscal year and the market value of our shares held by non-affiliates is less than $700 million. If we are a smaller
reporting company at the time we cease to be an emerging growth company, we may continue to rely on exemptions
from certain disclosure requirements that are available to smaller reporting companies. Specifically, as a smaller
reporting company, we may choose to present only the two most recent fiscal years of audited financial statements
in our Annual Report on Form 10-K and, similar to emerging growth companies, smaller reporting companies have
reduced disclosure obligations regarding executive compensation.
We may choose to take advantage of some or all of these reduced burdens. We have elected to adopt the
reduced requirements with respect to the presentation of our financial statements and “Management’s Discussion
and Analysis of Financial Condition and Results of Operations” disclosure. Further, pursuant to Section 107 of the
JOBS Act, as an emerging growth company, we have elected to take advantage of the extended transition period for
complying with new or revised accounting standards until those standards would otherwise apply to private
companies. It is possible that some investors will find our common stock less attractive as a result of these elections,
which may result in a less active trading market for our common stock and higher volatility in our stock price.
For additional information, see the section titled “Risk Factors—Risks Related to this Offering and Ownership
of Our Class A common stock—We are an “emerging growth company” and we cannot be certain if the reduced
disclosure requirements applicable to “emerging growth companies” will make our Class A common stock less
attractive to investors.”
Our Corporate Information
Fervo Energy Company, the registrant and the issuer of the Class A common stock in this offering, was
incorporated as a Delaware corporation on May 26, 2017. Our corporate headquarters are located at 811 Main Street,
Suite 1700, Houston, TX 77002. Our telephone number is (832) 554-3253. Our principal website address is
www.fervoenergy.com. The information on, or that can be accessed through, our website is deemed not to be
incorporated in this prospectus or to be part of this prospectus. You should not consider information contained on
our website to be part of this prospectus in deciding whether to purchase shares of our Class A common stock.
24
We are a holding company and have no direct operations. All of our business operations are conducted through
our subsidiaries, including Fervo HoldCo LLC. Our principal asset is the equity interest in Fervo HoldCo LLC,
which, together with its subsidiaries, owns substantially all of our operating assets. As a result, we are dependent on
the ability of our subsidiaries to generate revenue and to make loans, pay dividends and make other payments to
generate the funds necessary to meet our financial obligations and to pay dividends to stockholders, if any. The
below chart illustrates our current corporate organizational structure immediately after consummation of this
offering.
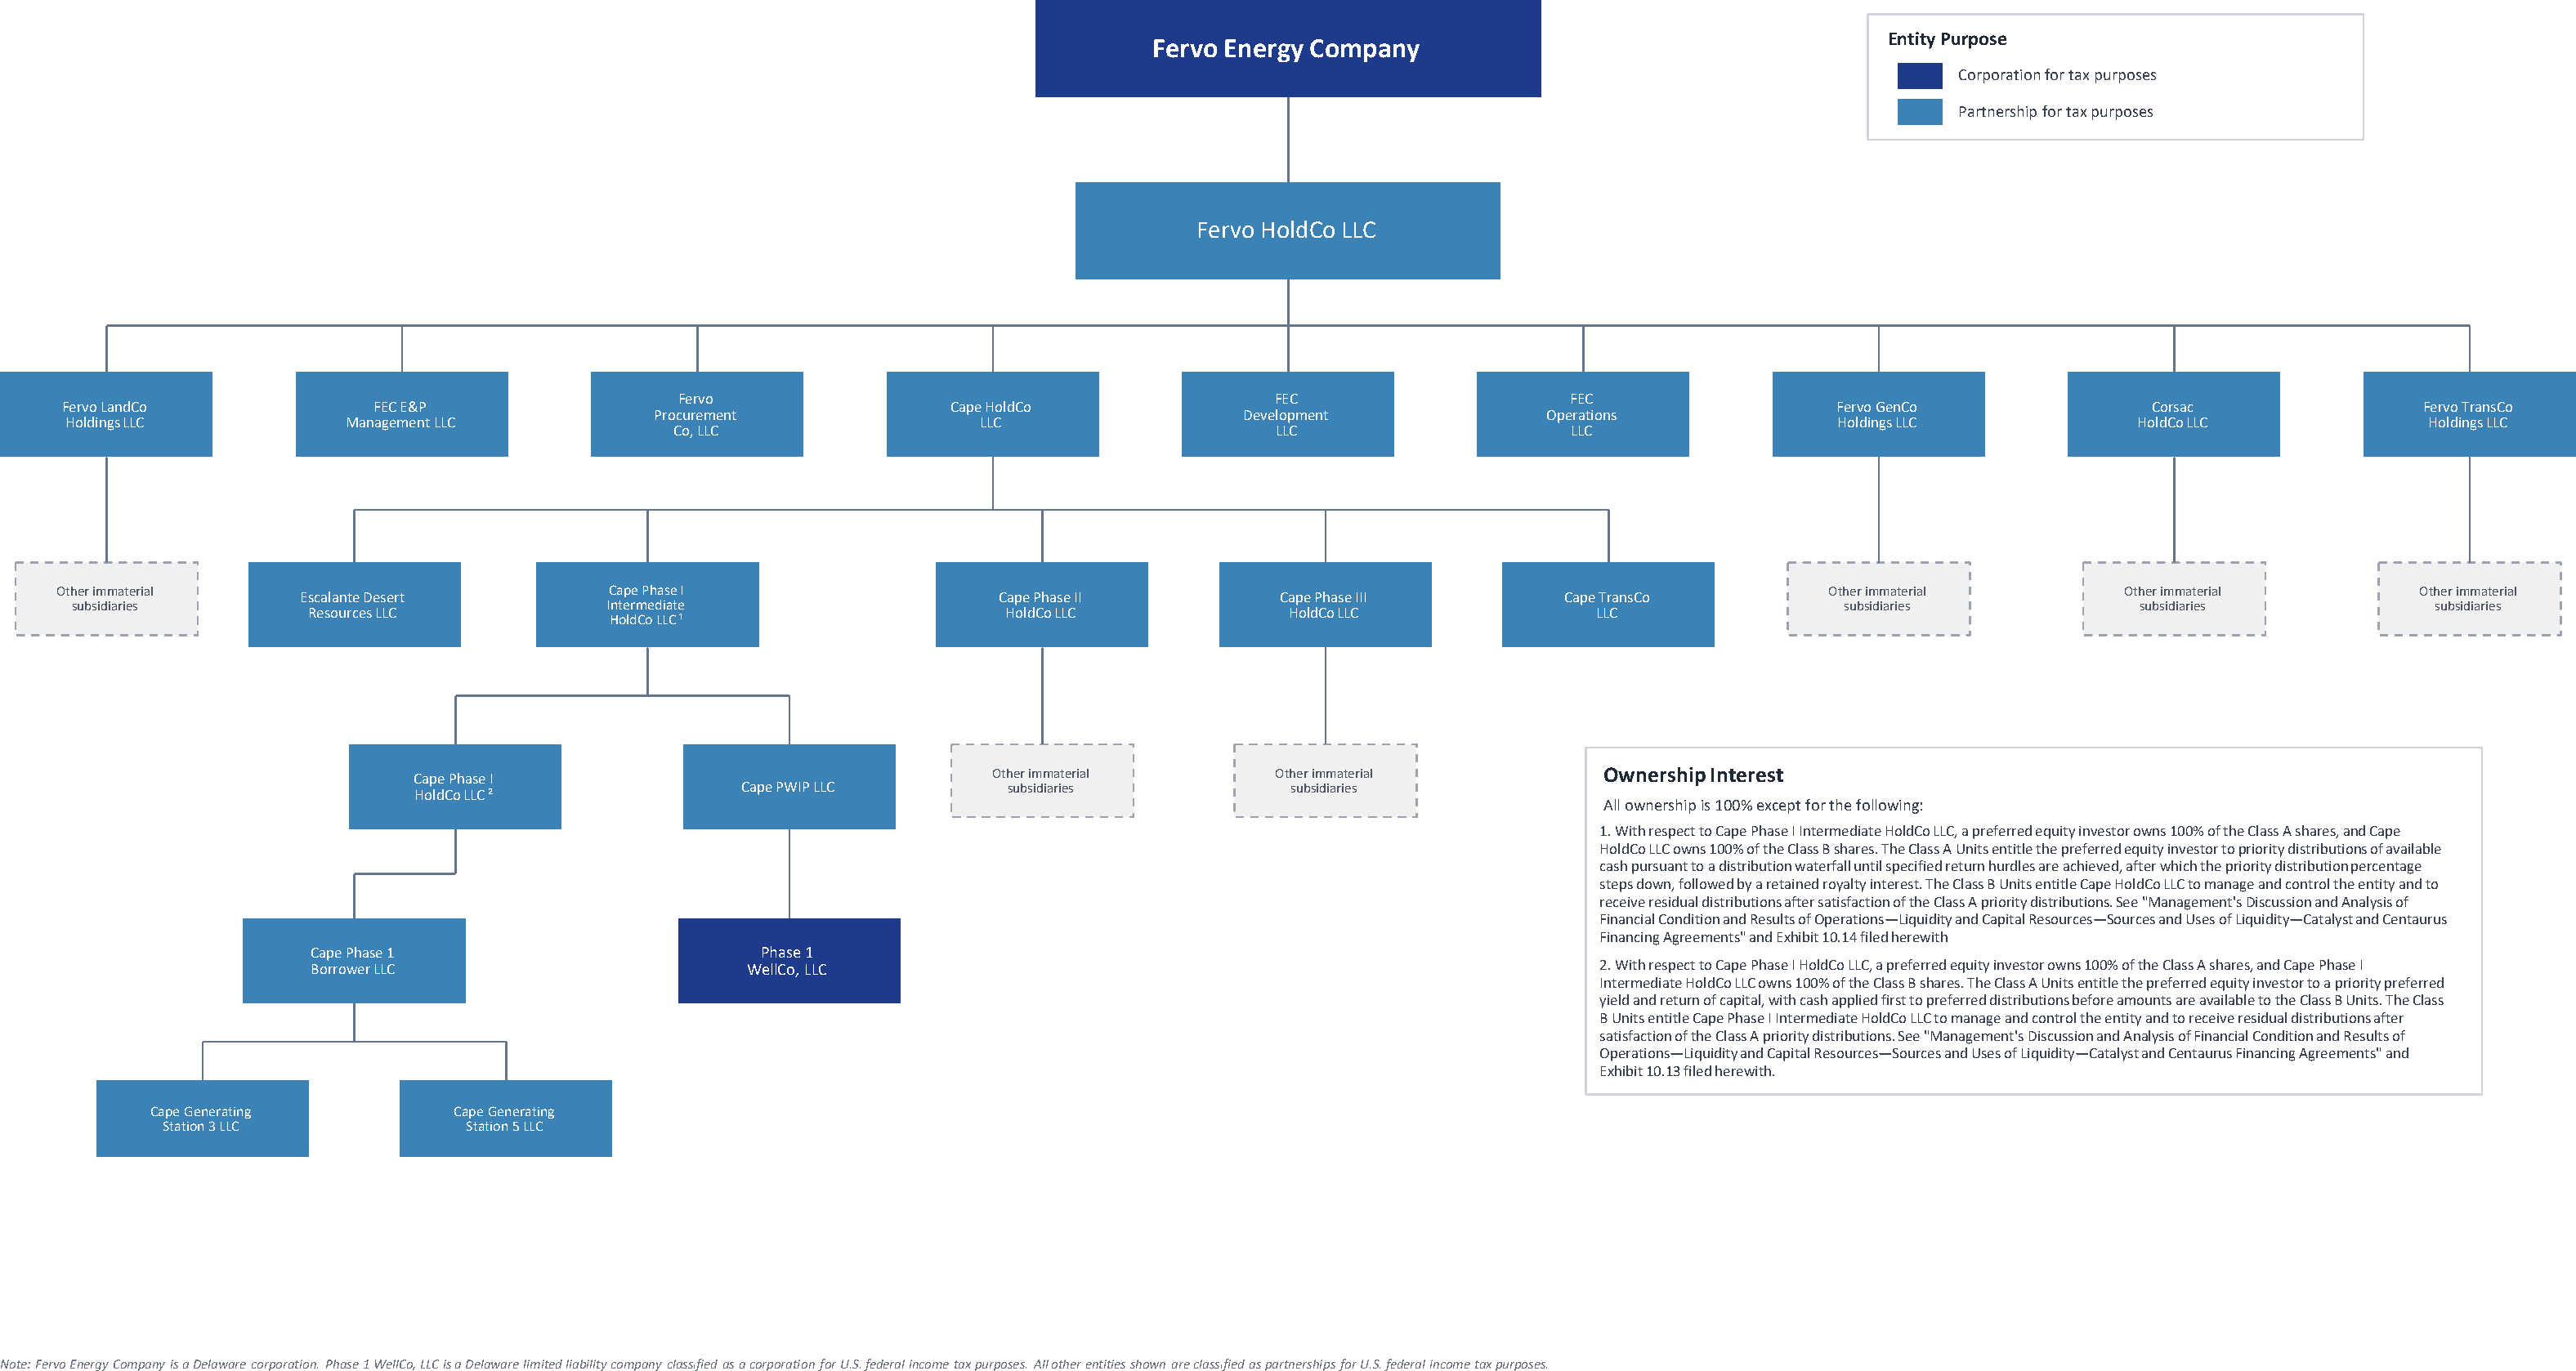
26
THE OFFERING
Class A common stock offered by us ................ | 70,000,000 shares (or 80,500,000 shares if the underwriters exercise their option to purchase additional shares of Class A common stock from us in full). | |
Underwriters’ option to purchase additional shares of Class A common stock ................... | The underwriters have an option to purchase up to 10,500,000 additional shares of Class A common stock from us at the initial public offering price, less the underwriting discounts and commissions. The underwriters can exercise this option at any time within 30 days from the date of this prospectus. | |
Class A common stock to be outstanding after this offering .................................................... | 275,776,919 shares (or 286,276,919 shares if the underwriters exercise their option to purchase additional shares of Class A common stock in full). | |
Class B common stock to be outstanding after this offering .................................................... | 7,785,414 shares. | |
Total Class A and Class B common stock to be outstanding immediately after this offering .......................................................... | 283,562,333 shares (or 294,062,333 shares if the underwriters exercise their option to purchase additional shares of Class A common stock in full). | |
Voting power of Class A common stock after giving effect to this offering .......................... | 46.97% (or 47.90% if the underwriters exercise their option to purchase additional shares of Class A common stock in full). | |
Voting power of Class B common stock after giving effect to this offering .......................... | 53.03% (or 52.10% if the underwriters exercise their option to purchase additional shares of Class A common stock in full). | |
27
Use of proceeds ................................................. | We estimate that we will receive net proceeds from this offering of approximately $1,668,696,700 (or approximately $1,920,381,700 if the underwriters exercise in full their option to purchase additional shares of Class A common stock), based upon an assumed initial public offering price of $25.50 per share (which is the midpoint of the price range set forth on the cover page of this prospectus) and after deducting estimated underwriting discounts and commissions and estimated offering expenses payable by us. The principal purposes of this offering are to increase our capitalization and financial flexibility, create a public market for our Class A common stock, and enable access to the public equity markets for us and our Class A common stockholders. We intend to use the net proceeds from this offering for general corporate purposes, including project-level capital expenditures, continued development of our GeoClusters and portfolio of land holdings, working capital and operating expenses. Pending identification of specific uses, our priority is capital expenditures, continued development of our GeoClusters and portfolio of land holdings, then working capital and operating expenses, and a significant portion is not currently allocated; accordingly we cannot estimate amounts for each use. We will have broad discretion in the way that we use the net proceeds of this offering. If proceeds are less than expected, we will prioritize working capital and operating expenses. See “Use of Proceeds.” | |
28
Voting rights ...................................................... | Upon completion of this offering, we will have two classes of common stock outstanding: Class A common stock and Class B common stock. The rights of the holders of our Class A common stock and Class B common stock are identical, except with respect to voting, conversion and transfer rights. Each share of our Class A common stock is entitled to one vote per share. Each share of our Class B common stock is entitled to 40 votes per share. Holders of shares of our Class A common stock and Class B common stock will generally vote together as a single class, unless otherwise required by law or our Amended Charter that becomes effective immediately prior to the completion of this offering. Each share of our Class B common stock is convertible into one share of our Class A common stock at any time at the election of the holder and will convert automatically upon any transfer, except for permitted transfers, described in our Amended Charter, including transfers to immediate family members (including upon Mr. Latimer’s or Dr. Norbeck’s death), trusts (including grantor retained annuity trusts) for which the stockholder or their immediate family member serves as trustee, and partnerships, corporations, and other entities exclusively owned by Mr. Latimer or Dr. Norbeck or either of their immediate families, and upon the earliest to occur of (i) the first trading day following the seventh anniversary of this offering, (ii) the date on which the number of shares of Class A and Class B common stock beneficially owned by Mr. Latimer’s and Dr. Norbeck’s permitted transferees (including shares underlying outstanding options) represents less than 25% of the shares of Class A and Class B common stock beneficially owned by Mr. Latimer and Dr. Norbeck, in the aggregate, on the closing date of this offering, (iii) the death or disability of a Co-Founder, and (iv) the termination of a Co- Founder for cause. | |
Immediately following the completion of this offering, and assuming no exercise of the underwriters’ option to purchase additional shares to cover over-allotments, if any, and assuming Mr. Latimer and Dr. Norbeck do not purchase any shares of Class A common stock pursuant to the reserved share program, Mr. Latimer and Dr. Norbeck will beneficially own, in the aggregate, approximately 53.03% of the voting power of our outstanding capital stock. As a result, Mr. Latimer and Dr. Norbeck will have significant influence over the outcome of matters submitted to our stockholders for approval, including the election of our directors and the approval of any change of control transaction. These risks are more fully described in the section titled “Risk Factors.” Additional information can be found in the sections titled “Principal Stockholders” and “Description of Capital Stock.” | ||
29
Indication of Interest ......................................... | Atlas Point Energy Infrastructure Fund, LLC, Norges Bank Investment Management, a division of Norges Bank, Wellington Management, and one or more funds and/or accounts managed by Capital Research Global Investors (collectively, the “Cornerstone Investors”) have, severally and not jointly, indicated an interest in purchasing up to an aggregate of $350 million in shares of our Class A common stock in this offering at the initial public offering price and on the same terms and conditions as the other purchasers in this offering. The shares of Class A common stock to be purchased by the Cornerstone Investors will not be subject to a lock-up agreement with the underwriters. Because this indication of interest is not a binding agreement or commitment to purchase, the Cornerstone Investors may determine to purchase more, fewer, or no shares in this offering, or the underwriters may determine to sell more, fewer, or no shares to the Cornerstone Investors. The underwriters will receive the same underwriting discount on any shares of our Class A common stock purchased by the Cornerstone Investors as they will from the other shares sold to the public in this offering. | |
Dividend policy ................................................. | We have no current plans to pay dividends on our common stock following this offering. Any decision to declare and pay dividends in the future will be made at the sole discretion of our board of directors and will depend on, among other things, our results of operations, cash requirements, financial condition, contractual restrictions and other factors that our board of directors may deem relevant. Because we are a holding company and have no direct operations, we will only be able to pay dividends from funds we receive from our subsidiaries. Certain of our subsidiaries are party to project-level financing arrangements that contractually restrict or prioritize cash distributions before any amounts can be upstreamed to us. In addition, our ability to pay dividends is limited by the Credit Agreement, which contains negative covenants that generally prohibit us and our subsidiaries from making “Restricted Payments,” including dividends and other distributions, subject to only limited exceptions for certain subsidiary distributions that meet specified conditions, and may be limited by the agreements governing any indebtedness we or our subsidiaries may incur in the future. See “Dividend Policy.” | |
Reserved share program .................................... | At our request, an affiliate of BofA Securities, Inc., a participating underwriter, has reserved for sale, at the initial public offering price, up to 5% of the shares of Class A common stock to be issued by us and offered by the prospectus for sale to some of our directors, officers and employees and related persons. If these persons purchase reserved shares it will reduce the number of shares available for sale to the general public. Any reserved shares that are not so purchased will be offered by the underwriters to the general public on the same basis as the other shares offered by this prospectus. See “Underwriting—Reserved Share Program.” | |
30
Risk factors ........................................................ | ||
Proposed trading symbol ................................... | We intend to apply to list our Class A common stock on the NASDAQ under the symbol “FRVO.” |
Unless otherwise stated, the total number of shares of Class A common stock and Class B common stock that
will be outstanding immediately after this offering is based on 275,776,919 shares of our Class A common stock
and 7,785,414 shares of our Class B common stock outstanding as of April 29, 2026, and reflects:
•the reclassification of all outstanding shares of our common stock into an equal number of shares of our
Class A common stock, which will be effected upon the filing and effectiveness of our Amended Charter,
which will occur immediately prior to the completion of this offering (the “Reclassification”);
•the automatic conversion of all outstanding shares of our Series A Preferred Stock, Series B Preferred
Stock, Series C Preferred Stock, Series D Preferred Stock and Series E Preferred Stock into an aggregate of
201,428,559 shares of Class A common stock, which will be immediately prior to the completion of this
offering (the “Preferred Stock Conversion”);
•the exchange by our Co-Founders, Tim Latimer and Jack Norbeck, PhD., of an aggregate of 7,785,414
shares of Class A common stock for an equivalent number of shares of our Class B common stock (the
“Founder Share Exchange”), which will take place immediately prior to the completion of this offering
pursuant to the terms of an exchange agreement between us and each of Mr. Latimer and Dr. Norbeck (the
“Founder Share Exchange Agreement”);
•the exercise in full of the warrants held by Centaurus Capital LP to purchase up to 3,550,329 shares
immediately prior to the completion of this offering, with the resulting preferred shares converting into
shares of Class A common stock in connection with the Preferred Stock Conversion;
•no exercise of the outstanding stock options or warrants subsequent to April 29, 2026;
•the Stock Split.
•no exercise by the underwriters of their option to purchase up to 10,500,000 additional shares of Class A
common stock from us; and
•an initial public offering price of $25.50 per share of Class A common stock, which is the midpoint of the
price range set forth on the cover page of this prospectus.
Following the completion of this offering, and pursuant to an equity award exchange right agreement (the
“Equity Award Exchange Agreement”) to be entered into between us, Mr. Latimer and Dr. Norbeck, each of our Co-
Founders will have a right to require us to exchange any shares of Class A common stock received upon the exercise
of stock options granted under our 2019 Plan and outstanding prior to the date of effectiveness of the registration
statement of which this prospectus forms a part, for an equivalent number of shares of Class B common stock. This
includes an aggregate of 20,269,508 shares underlying outstanding options held by Mr. Latimer and Dr. Norbeck.
The Equity Award Exchange Agreement does not cover any equity awards granted to Mr. Latimer and Dr. Norbeck
in connection with or following the completion of this offering.
In connection with the completion of this offering, we will cease granting awards under the 2019 Plan. Our
2026 Plan and ESPP also provide for automatic annual increases in the number of shares reserved thereunder, which
are not reflected in the numbers above. See the section titled “Executive and Director Compensation—Equity
Incentive Award Plans” for additional information.
31
Unless otherwise stated, the total number of shares of Class A common stock and Class B common stock that
will be outstanding immediately after this offering, and after giving effect to the Preferred Stock Conversion, the
Founder Share Exchange, the Reclassification and the Stock Split, excludes:
•45,047,677 shares (or 32,407,298 shares, after giving effect to the Stock Split) of Class A common stock
issuable upon exercise of stock options outstanding as of April 29, 2026 under our 2019 Plan, with a
weighted average exercise price of $1.75 per share (or $2.43 per share, after giving effect to the Stock
Split); and
•40,778,984 shares of Class A common stock and Class B common stock reserved for future issuance under
our equity compensation plans, consisting of:
◦35,107,737 shares of Class A common stock and Class B common stock reserved for future issuance
under the 2026 Plan, which will become effective in connection with this offering, as well as any
automatic increases in the number of shares of Class A common stock and Class B common stock
reserved for future issuance under the 2026 Plan; and
◦5,671,247 shares of Class A common stock reserved for future issuance under the ESPP, which will
become effective in connection with this offering, as well as any automatic increases in the number of
shares of Class A common stock reserved for future issuance under the ESPP.
32
SUMMARY CONSOLIDATED FINANCIAL AND OTHER DATA
The following tables present the summary consolidated financial and other data for Fervo Energy and its
subsidiaries. We have derived the summary Consolidated Statements of Operations data for the years ended
December 31, 2025 and 2024 and the summary Consolidated Balance Sheet data as of December 31, 2025 from our
audited consolidated financial statements and the related notes thereto included elsewhere in this prospectus. You
should read this data together with our consolidated financial statements and related notes thereto included
elsewhere in this prospectus and the section titled “Management’s Discussion and Analysis of Financial Condition
and Results of Operations.” Our historical results for any prior period are not necessarily indicative of the results
that may be expected in the future.
(In thousands, except share and per share data) | Year ended December 31, | ||
2025 | 2024 | ||
Consolidated Statements of Operations | |||
Revenues ................................................................................................................... | $138 | $199 | |
Costs and expenses: | |||
Operation and maintenance ................................................................................. | 388 | 380 | |
Research and development income, net ................................................................ | (133) | (97) | |
General and administrative expenses ................................................................... | 38,718 | 34,735 | |
Operating lease expenses ..................................................................................... | 9,681 | 6,895 | |
Depreciation and amortization .............................................................................. | 290 | 124 | |
Operating loss ................................................................................................. | (48,806) | (41,838) | |
Other income (expense): | |||
Interest income ..................................................................................................... | 4,192 | 1,787 | |
Interest expense .................................................................................................... | (8,406) | (766) | |
Other non-operating expense ................................................................................ | (4,767) | (237) | |
Loss before income taxes ........................................................................................ | (57,787) | (41,054) | |
Income tax expense ............................................................................................... | (1) | (56) | |
Net loss ..................................................................................................................... | $(57,788) | $(41,110) | |
Net loss .................................................................................................................... | $(57,788) | $(41,110) | |
Less: Remeasurement of redeemable noncontrolling interest ............................... | (12,727) | — | |
Net loss attributable to common shares, basic and diluted ................................... | $(70,515) | $(41,110) | |
Weighted average shares, basic and diluted ............................................................ | 12,462 | 12,438 | |
Net loss per share attributable to common stockholders, basic and diluted ........ | $(5.66) | $(3.31) | |
Weighted-average shares used in computing adjusted net income per share, basic and diluted (1) .......................................................................................................... | 212,948 | 212,931 | |
Adjusted net loss per share, basic and diluted(1) ................................................... | $(0.33) | $(0.19) | |
Consolidated Statements of Cash Flows | |||
Net cash used in operating activities ........................................................................ | $(31,757) | $(54,748) | |
Net cash used in investing activities ......................................................................... | $(465,659) | $(178,693) | |
Net cash provided by financing activities ................................................................. | $765,824 | $403,754 | |
_______________
(1)The adjusted net income (loss) per share, basic and diluted, gives effect to the Stock Split, the Preferred Stock Conversion, as if the
Preferred Stock Conversion had occurred on January 1, 2024, resulting in 201,428,559 additional shares of Class A common stock, as well
as the exercise in full of the warrants held by Centaurus, as if the warrant exercise had occurred on January 1, 2024, resulting in 2,554,106
additional shares of Class A common stock.
33
As of December 31, 2025 | |||||
(In thousands, except share and per share data) | Actual | As Adjusted (1) | As Further Adjusted (2)(3) | ||
Consolidated Balance Sheets | |||||
ASSETS | |||||
Current assets: | |||||
Cash and cash equivalents ........................................................ | $461,836 | $481,209 | $2,149,906 | ||
Grant receivables ...................................................................... | 10,580 | 10,580 | 10,580 | ||
Prepaid expenses and other ...................................................... | 9,714 | 9,714 | 9,714 | ||
Total current assets .............................................................. | 482,130 | 501,503 | 2,170,200 | ||
Deposits .................................................................................... | 15,234 | 15,234 | 15,234 | ||
Construction-in-process ............................................................ | 789,571 | 789,571 | 789,571 | ||
Operating leases right of use assets .......................................... | 58,713 | 58,713 | 58,713 | ||
Restricted cash .......................................................................... | 6,000 | 6,000 | 6,000 | ||
Other long-term assets ............................................................... | 13,520 | 13,520 | 13,520 | ||
Total assets ........................................................................... | $1,365,168 | $1,384,541 | $3,053,238 | ||
LIABILITIES AND EQUITY | |||||
Current liabilities: | |||||
Accounts payable ......................................................................... | $10,789 | $10,789 | $10,789 | ||
Accrued capital expenditures ........................................................ | 119,303 | 119,303 | 119,303 | ||
Operating lease liabilities ............................................................ | 4,822 | 4,822 | 4,822 | ||
Other current liabilities ............................................................... | 16,997 | 16,997 | 16,997 | ||
Total current liabilities ........................................................... | 151,911 | 151,911 | 151,911 | ||
Long-term debt, net of issuance costs (4) .................................... | 172,837 | 182,452 | 182,452 | ||
Operating lease liabilities ......................................................... | 72,639 | 72,639 | 72,639 | ||
Other long-term liabilities ........................................................ | 11,407 | 1,193 | 1,193 | ||
Total liabilities ..................................................................... | 408,794 | 408,195 | 408,195 | ||
Commitments and Contingencies (Note 21) ............................. | |||||
Redeemable convertible preferred stock | |||||
Redeemable convertible preferred stock, par value $0.0001 per share; 283,545,547 authorized; 279,995,218 issued and outstanding on an actual basis, no shares issued and outstanding on an as adjusted basis, no shares issued and outstanding on an as further adjusted basis ........................... | 1,022,942 | — | — | ||
Redeemable noncontrolling interest | |||||
Cape Phase I HoldCo - Redeemable noncontrolling interest | 102,586 | 102,586 | 102,586 | ||
Cape Phase I Intermediate HoldCo - Redeemable noncontrolling interest ........................................................... | 77,344 | 77,344 | 77,344 | ||
Stockholders’ (deficit) equity: | |||||
Common stock, par value $0.0001 per share; 358,278,774 authorized; 13,145,979 issued and outstanding as of December 31, 2025 ................................................................ | 1 | — | — | ||
Class A common stock, par value $0.0001 per share; 1,000,000,000 shares authorized, no shares issued and outstanding on an actual basis, 205,776,919 shares issued and outstanding on an as adjusted basis, 275,776,919 shares issued and outstanding on an as further adjusted basis .......... | — | 21 | 28 | ||
34
As of December 31, 2025 | |||||
(In thousands, except share and per share data) | Actual | As Adjusted (1) | As Further Adjusted (2)(3) | ||
Class B common stock, par value $0.0001 per share: 40,000,000 shares authorized, no shares issued and outstanding on an actual basis, 7,785,414 shares issued and outstanding on an as adjusted basis, 7,785,414 shares issued and outstanding on an as further adjusted basis .......... | — | 1 | 1 | ||
Preferred stock, par value $0.0001 per share: no shares authorized on an actual basis and 10,000,000 shares authorized on an adjusted basis and no shares outstanding on an actual or as further adjusted basis ................................ | — | — | — | ||
Additional paid-in capital ......................................................... | — | 1,086,090 | 2,758,354 | ||
Treasury stock, at cost; 375,448 shares on an actual basis, and no shares on an as adjusted basis or an as further adjusted basis ....................................................................................... | (1,960) | — | — | ||
Accumulated deficit .................................................................. | (244,539) | (289,696) | (293,270) | ||
Total stockholders’ (deficit) equity ........................................ | (246,498) | 796,416 | 2,465,113 | ||
Total liabilities, redeemable convertible preferred stock, redeemable noncontrolling interests and stockholders’ (deficit) equity ................................................ | $1,365,168 | $1,384,541 | $3,053,238 | ||
__________________
(1)The as adjusted consolidated balance sheet data as of December 31, 2025 presents our consolidated balance sheet data to give effect to
(i) the Stock Split, (ii) the Preferred Stock Conversion, (iii) the Reclassification, (iv) the Founder Share Exchange, (v) the filing and
effectiveness of our Amended Charter, (vi) the exercise in full of the warrants held by Centaurus and (vii) borrowings under the
Project Granite Facility and the repayment of the XRC Facility, in each case as if such event had occurred on December 31, 2025.
(2)The as further adjusted consolidated balance sheet data reflects the items described in footnote (1) above and gives effect to our receipt
of estimated net proceeds from the sale of shares of Class A common stock that we are offering by this prospectus at an assumed
initial public offering price of $25.50 per share, which is the midpoint of the price range on the cover page of this prospectus, after
deducting the estimated underwriting discounts and commissions and estimated offering expenses payable by us. A $1.00 increase
(decrease) in the assumed initial public offering price of $25.50 per share would increase (decrease) each of current assets, total assets
and total stockholders’ equity by $65.8 million, assuming that the number of shares offered by us, as set forth on the cover page of this
prospectus, remains the same, and after deducting the estimated underwriting discounts and commissions and estimated offering
expenses payable by us.
(3)The as further adjusted data discussed above is illustrative only and will be adjusted based on the actual initial public offering price
and other terms of our initial public offering determined at pricing.
(4)As of April 14, 2026, the XRC Facility was paid off with the proceeds from the Project Granite Facility. Our Project Granite Facility
has a total capacity of $421.4 million. As of April 29, 2026, we also had an aggregate of $64.0 million of borrowings outstanding
under the Credit Facility. Our Credit Facility has a total capacity of $180.0 million which consists of the term loan facility and letters
of credit facility. See "Management's Discussion and Analysis of Financial Condition and Results of Operations—Liquidity and
Capital Resources—Mercuria Credit Agreement and Letter of Credit Agreement" for a further description of our Credit Facility.
35
MARKET AND INDUSTRY DATA
This prospectus contains estimates, projections and information concerning our industry, our business and the
market size and growth rates of the markets in which we participate. Some data and statistical and other information
are based on independent reports from third parties, as well as industry and general publications and research,
surveys and studies conducted by third parties which we have not independently verified. Some data and statistical
and other information are based on internal estimates and calculations that are derived from publicly available
information, research we conducted, internal surveys, our management’s knowledge of our industry and their
assumptions based on such information and knowledge, which we believe to be reasonable.
In each case, this information and data involves a number of assumptions and limitations, and you are cautioned
not to give undue weight to such information, estimates or projections. Industry publications and other reports we
have obtained from independent parties may state that the data contained in these publications or other reports have
been obtained in good faith or from sources considered to be reliable, but they do not guarantee the accuracy or
completeness of such data. In addition, projections, assumptions and estimates of the future performance of the
industry in which we operate and our future performance are necessarily subject to a high degree of uncertainty and
risk due to a variety of factors, including those described in “Risk Factors” and “Cautionary Note Regarding
Forward-Looking Statements.” These and other factors could cause our future performance to differ materially from
the assumptions and estimates made by third parties and us.
36
ESTIMATES OF CAPACITY POTENTIAL
We present in this prospectus certain estimates of capacity potential (represented as megawatts or gigawatts).
These estimates are based on the underlying geothermal resource potential of our sites, as represented by a measure
of thermal energy we refer to as heat initially in place (“HIIP”), the estimated electrical power capacity into which
such HIIP may be converted, and the thermal recovery factor of this thermal energy. HIIP is the total thermal energy
estimated to be contained in place within the rock and pore fluid in a defined subsurface volume as of a given date,
before accounting for any recovery of heat to the wellhead or conversion to electricity. To produce estimates of
capacity potential, a thermal recovery factor is applied to the HIIP estimates.
For Cape Station, an independent engineering consulting firm, DeGolyer and MacNaughton (“D&M”), prepared
HIIP estimates using geologic, thermal, and geomechanical models and probabilistic methods, as described further
in its report dated June 30, 2024 thereon included as an exhibit to the registration statement of which this prospectus
forms a part. To produce our estimate of capacity potential, we further adjust the HIIP estimates by applying a
thermal recovery factor. We assume a thermal recovery factor of 30.5%, which is estimated using a variety of
methods, including computational reservoir simulation, decline curve analysis, case studies from reservoir analogs,
and literature review. The applied thermal recovery factor reflects the portion of HIIP we believe can be practically
extracted to the wellhead and converted to electricity over the assumed project life. In determining this factor, we
consider reservoir temperature and thickness, fracture surface area and connectivity achieved through stimulation,
expected sustainable flow rates and pressure management, thermal drawdown over time, operating constraints
(including induced seismicity, water balance, and reinjection), and surface conversion efficiency (including ORC
performance and parasitic loads). We believe the resulting recovery factor is reasonable because it is grounded in
engineering judgment informed by our empirical data (including results from Project Red), field-calibrated geologic,
thermal, and geomechanical models at Cape Station, and sensitivity analyses across well spacing, flow, and
temperature assumptions. This approach is consistent with practices used in analogous resource assessments in other
industries and incorporates conservative assumptions intended to reflect long-term sustainable operations rather than
peak or short-duration output.
For the nine GeoClusters reviewed subsequent to Cape Station, which include Corsac, Blanford, Marble, Kit,
Star, Fennec, Cross, Swift and Aspen, D&M has utilized their own thermal recovery factors which are factored into
their estimates of capacity potential.
The estimates referred to above are subject to important limitations and uncertainties. All or any part of such
estimates may change as further heat production history and additional information become available. Application of
any risk factor or discount rate to HIIP should not be considered as a means of comparing such estimates to
measures of proved reserves, and you should not assume that all or any portion of the HIIP estimates will be
recovered or converted to electricity on an economic basis or at all. The quantities of heat that might actually be
recovered, and the quantities of associated produced electricity should such geothermal resources be developed, may
differ significantly from the HIIP estimates produced by D&M. For additional information regarding risks inherent
in our estimates of our geothermal resource, see “Risk Factors—Risks Related to Our Business—Our estimates of
geothermal resources and associated power capacity potential are inherently uncertain, do not consider
technological, commercial or economic viability, and should not be viewed as a measure of reserves prepared under
SEC guidelines or as a measure of estimated future production or generation capacity.”
37
CAUTIONARY NOTE REGARDING FORWARD-LOOKING STATEMENTS
This prospectus contains forward-looking statements about us and our industry that involve substantial risks and
uncertainties. All statements other than statements of historical facts contained in this prospectus, including
statements regarding our future results of operations or financial condition, business strategy, and plans and
objectives of management for future operations may be forward-looking statements. In some cases, you can identify
forward-looking statements by terms such as “may,” “will,” “should,” “expects,” “plans,” “anticipates,” “could,”
“intends,” “targets,” “projects,” “contemplates,” “believes,” “estimates,” “predicts,” “potential” or “continue” or the
negative of these terms or other similar expressions. Forward-looking statements contained in this prospectus
include, but are not limited to statements about:
•risks related to expanding our geothermal operations and accessing new markets;
•challenges in maintaining compliance with extensive environmental regulations and permitting
requirements;
•uncertainties in forecasting future operational results and growth due to economic conditions and market
demand;
•compliance with environmental regulations and climate change initiatives impacting operational costs;
•inherent risks in the geothermal industry, including potential operational disruptions and associated
liabilities;
•the influence of consumer preferences, government policies, and competition on the demand for geothermal
energy;
•risks associated with fluctuations in energy prices and material costs;
•dependence on a complex supply chain and successful maintenance of our geothermal infrastructure;
•financial performance influenced by fluctuations in interest rates, capital availability, and other market
conditions;
•capacity actually constructed or for which we enter PPAs under non-binding agreements, like the GFA;
•exposure to legal proceedings and claims arising from our business operations;
•protecting our brand reputation and facing potential negative public perception;
•negative public perception and political opposition impacting our ability to secure regulatory approvals and
market acceptance;
•the successful and timely execution of our growth strategy, with risks of delays or failures;
•reliance on key personnel and the potential impact of labor costs and workforce challenges;
•heavy reliance on technology systems and potential cybersecurity threats;
•global economic and political conditions affecting our operations, supply chain, and customer demand;
•the risk that our estimates of capacity potential and HIIP are inaccurate or that we are unable to produce
quantities of electrical energy commensurate with such estimates; and
•other risks and uncertainties described in this prospectus, including those set forth under “Risk Factors.”
We caution you that the foregoing list may not contain all of the forward-looking statements made in this
prospectus. The forward-looking statements in this prospectus are only predictions. We have based these forward-
looking statements largely on our current expectations and projections about future events and financial trends that
38
we believe may affect our business, financial condition and results of operations. Forward-looking statements
involve known and unknown risks, uncertainties and other important factors that may cause our actual results,
performance or achievements to be materially different from any future results, performance or achievements
expressed or implied by the forward-looking statements. We believe that these factors include, but are not limited to
the factors set forth under “Risk Factors.” Because forward-looking statements are inherently subject to risks and
uncertainties, some of which cannot be predicted or quantified, you should not rely on these forward-looking
statements as predictions of future events. Moreover, we operate in a very competitive and rapidly changing
environment. New risks and uncertainties emerge from time to time, and it is not possible for us to predict all risks
and uncertainties that could have an impact on the forward-looking statements contained in this prospectus. The
events and circumstances reflected in our forward-looking statements may not be achieved or occur and actual
results could differ materially from those projected in the forward-looking statements.
In addition, statements that “we believe” and similar statements reflect our beliefs and opinions on the relevant
subject. These statements are based upon information available to us as of the date of this prospectus, and while we
believe such information forms a reasonable basis for such statements, such information may be limited or
incomplete, and our statements should not be read to indicate that we have conducted an exhaustive inquiry into, or
review of, all potentially available relevant information. These statements are inherently uncertain and investors are
cautioned not to unduly rely upon these statements.
The forward-looking statements made in this prospectus relate only to events as of the date on which the
statements are made. We undertake no obligation to update any forward-looking statements made in this prospectus
to reflect events or circumstances after the date of this prospectus or to reflect new information or the occurrence of
unanticipated events, except as required by law. We may not actually achieve the plans, intentions or expectations
disclosed in our forward-looking statements, and you should not place undue reliance on our forward-looking
statements. Our forward-looking statements do not reflect the potential impact of any future acquisitions, mergers,
dispositions, joint ventures or investments we may make.
You should read this prospectus and the documents that we reference in this prospectus and have filed as
exhibits to the registration statement of which this prospectus forms a part with the understanding that our actual
future results, levels of activity, performance and achievements may be materially different from what we expect.
We qualify all of our forward-looking statements by these cautionary statements.
39
RISK FACTORS
Investing in our Class A common stock involves a high degree of risk. You should carefully consider and read
the following risk factors, together with all of the other information contained in this prospectus, including the
section titled “Management’s Discussion and Analysis of Financial Condition and Results of Operations” and our
consolidated financial statements and related notes thereto, before deciding to invest in our Class A common stock.
The risks described below are not the only ones we face. Our business, financial condition, and/or results of
operations could be materially and adversely affected by any of these risks or uncertainties, as well as by risks or
uncertainties not currently known to us, or that we do not currently believe are material. In such case, the trading
price of our Class A common stock could decline, and you may lose some or all of your investment.
Risks Related to Our Business
We will require significant additional capital to construct and complete our projects, and we may not be able to
secure such financing on time with acceptable terms, or at all, which could cause delays in our construction, lead
to inadequate liquidity and increase overall costs.
The capital expenditures we expect to incur as we complete the development of our future projects will be
significant, including wellfield drilling and completions for EGS reservoirs and procurement of binary, air-cooled
ORC power plants. Our standardized modular approach contemplates deployment across GeoClusters via 50-
megawatt GeoBlocks, and our estimate of capital expenditures to construct a single GeoBlock was approximately
$7,000/kW as of December 31, 2025, inclusive of wellfield, surface facilities and plant equipment. We currently
estimate capital expenditures of approximately $1.2 billion in 2026, of which approximately $125 million relates to
our Cape Station Phase I. In addition, we estimate capital expenditures of $940 million related to our Cape Station
Phase II, a majority of which remains unfunded. Although we currently hold certain federal approvals that have
already undergone National Environmental Policy Act (NEPA) review covering approximately 2 gigawatts of
capacity potential, a portion of these capital expenditures (including exploration, geophysical surveys, test and
delineation wells, stimulation, and other reservoir development activities) must be incurred before we obtain, or can
finalize, certain material permits, land use authorizations, and approvals that are outside the scope of NEPA review,
including site‑specific well permits (e.g., drilling, injection and production well permits), water rights and related
authorizations, and state and local permits and approvals (such as land use, building, grading, cultural and
environmental, and air and noise permits). As of April 17, 2026, 78 out of 80 permits of the governmental permits
and approvals necessary to commence commercial operations at Cape Station Phase I have been received, and the
remaining two necessary permits are in process. Moreover, 81 out of 179 permits of the governmental permits and
approvals necessary to commence commercial operations at Cape Station Phase II have been received, and the
remaining 98 are in process. Of those in-process approvals and permits, all are individual, administrative geothermal
well permits or administrative county permits, and we do not currently expect any material delays, conditions or
denials with respect to any of these pending permits. If any such permits or approvals are delayed, impose
burdensome conditions, or are not granted, the investments we make ahead of permitting may be stranded, impaired,
or require redesign, leading to write‑offs, additional costs, and schedule slippage.
We expect to fund these capital needs through a combination of sources, including, but not limited to, project-
level non-recourse debt, equity capital at the corporate or project level, government grants and incentives, customer
prepayments or prebuys under offtake arrangements, and capital markets transactions, including corporate debt and
equity-linked securities, as well as potential tax equity, tax credit sales or similar monetization of available tax
attributes. The availability, timing and terms of any such financing are uncertain and may be affected by market
conditions, regulatory developments, performance under existing offtake contracts, and the perceived bankability of
our EGS technology and project structures. Additional capital may not be available in the amounts required, or on
favorable terms. In addition, if any adverse findings are discovered at any stage during the course of our
development of our projects that would render part of, or all of, them to be unsuitable or we discover flaws that may
decrease the value of our project sites as collateral for purposes of any financing, then we may not be able to obtain
the financing necessary to construct our projects on favorable terms, or at all. Moreover, because certain debt and
tax equity providers condition funding on receipt of key permits and approvals, including federal permits and
approvals and applicable state and local permits and approvals, we may be required to finance pre‑permit subsurface
40
work with corporate equity or other more expensive capital, increasing our liquidity risk and overall cost of capital
even where federal approvals that underwent NEPA review are in place.
Furthermore, any adverse changes in power demand that affect the competitiveness of our projects or any
failure on our part to obtain or comply with necessary permits or approvals may also hinder our ability to obtain
necessary additional capital or financing. Although we believe current market dynamics—such as rising grid
demand from data centers and utilities, capacity shortfalls, and procurement preferences for clean, firm power—
support our EGS strategy, such dynamics could change. Delays in the construction of our projects beyond their
estimated development periods could increase the cost of completion beyond the amounts that we estimate, which
could require us to obtain additional sources of financing to fund our operations until our projects are fully
completed (which could cause further delays). Moreover, many factors (including factors beyond our control) could
result in a disparity between liquidity sources and cash needs, including factors such as construction delays, cost
overruns, underperformance of drilling, completions or ORC turbines, supply chain disruptions or breaches of
agreements. If, after incurring substantial expenditures, we are unable to obtain required permits or must materially
redesign projects to satisfy permitting conditions, we could face further delays, cost overruns, impairments of
capitalized costs, and the need to raise additional funds on unfavorable terms. This risk persists notwithstanding our
federal approvals that underwent NEPA review for approximately 2 gigawatts of capacity potential, because those
approvals do not replace or guarantee issuance of required well permits or state and local authorizations.
Our ability to obtain financing that may be needed to provide additional funding will depend, in part, on factors
beyond our control and there can be no assurances that funding will be available to us on commercial terms or at all.
For example, capital providers or their applicable regulators may elect to cease funding geothermal projects or
certain related businesses. Accordingly, we may not be able to obtain financing on terms that are acceptable to us, or
at all. Even if we are able to obtain financing, we may have to accept terms that are disadvantageous to us or that
may have an adverse impact on our business plan and the viability of the relevant project. The failure to obtain any
necessary additional funding could cause any or all of our projects to be delayed or not be completed, including our
modular deployments within GeoClusters such as Cape Station. Any delays in construction could prevent us from
commencing operations when we anticipate and could prevent us from realizing anticipated cash flows, all of which
could have a material adverse effect on our business, contracts, financial condition, operating results, cash flow,
financing requirements, liquidity, prospects and the price of our Class A common stock. The need to deploy material
capital before securing key permits or approvals exacerbates these risks and could magnify adverse effects on our
liquidity and project timelines if permitting outcomes are unfavorable. In particular, if we are delayed in obtaining
federal permits and approvals or state and local approvals necessary for drilling, completions, surface facilities and
plant construction, we may be unable to commence or continue planned work even where federal NEPA reviews
have been completed, which could materially increase costs and delay schedules.
Our EGS technology is still in early stages of deployment and operations, and we may be unable to improve upon
such EGS technology to meet our business goals.
There is limited commercial operating experience for EGS of the type, configuration, and scale we have
pioneered, particularly compared to that of the existing traditional geothermal industry. To date, we have completed
Project Red and have 500 megawatts at Cape Station under construction. Project Red was a limited-scope, proof-of-
concept initiative designed to demonstrate certain technical capabilities rather than a commercial-scale development.
By contrast, Cape Station represents our first meaningful attempt to deploy our modules at commercial scale. Cape
Station is not yet complete and, based on our current schedule, is not expected to have the first approximately 100
megawatts fully constructed, commissioned, and operational until early 2027. As a result, we have not yet
demonstrated an ability to deliver consistent, reliable, and economic performance at scale, and our business,
financial condition, and results of operations could be adversely affected if we experience delays, cost overruns,
resource underperformance, operational failures, or other challenges in constructing, commissioning, and operating
Cape Station Phase I or any subsequent commercial-scale project.
While our wellfields, drilling operations, and power plants have been and will be actively managed through
design reviews, prototyping, testing, involvement of external partners with subject matter expertise, and application
of approaches utilized in the operation of Project Red and in the construction of Cape Station, we could still fail to
identify latent design, manufacturing, construction, and operations issues early enough to avoid negative effects on
41
production, fabrication, construction, or ultimate performance of power plant and related technologies. In addition,
our wellfields, drilling operations, and power plants in their early stages may underperform due to operational
uncertainties as well as engineering or operational limitations beyond our control, any of which could materially and
adversely affect our business.
Moreover, the cost and time associated with the construction and maintenance of our wellfields, drilling
operations, and power plants may be greater than we expect because of a lack of a labor force with relevant
commercial experience and a shallow and otherwise immature supply chain for these types of geothermal systems.
Where these issues may arise at later stages of deployment, deployment could be subject to greater costs or be
significantly delayed, which could permit our counterparties to terminate their PPAs and otherwise materially and
adversely affect our business.
Prospective offtakers, including utilities and commercial and industrial customers, may also find it more
difficult, costly, and time-consuming to evaluate EGS projects and to make contracting decisions given the limited
commercial operating history of our systems. This could lead to longer sales cycles and additional requirements such
as extended diligence, demonstration periods, more stringent performance guarantees, higher collateral or credit
support, and tighter allocation of resource and availability risk. These factors could increase bid and contracting
costs, constrain pricing or other commercial terms relative to incumbent technologies, and delay revenue recognition
or milestones under PPAs and related electricity sales arrangements.
Similarly, the availability, timing, and terms of project and corporate financing may be adversely affected until
we establish a longer operating track record and material cash flows from commercial-scale plants. Lenders, tax
equity investors, and other financing sources may require higher return thresholds, lower advance rates, additional
reserves, and more comprehensive completion support or guarantees. We may therefore face a higher cost of capital
and more limited access to non-recourse financing for initial projects, which could necessitate greater reliance on
corporate capital, equity financing, or government-supported programs. Any inability to obtain financing on
acceptable terms, or delays in securing such financing, could postpone project starts or completions and negatively
impact our business, financial condition, and results of operations.
In addition, our business plan anticipates that our drilling operations will drill to greater depth and temperatures,
and makes assumptions with respect to learnings, efficiencies and regulatory approvals as a result of this concurrent
development approach. If such assumptions regarding concurrent development at greater depths and temperatures
are not accurate, we may be unable to successfully introduce, market, and sell these configurations of our power
plants in a timely and cost-effective manner, and properly position and/or price our products, our business, results of
operations, or financial position could be materially impacted.
The lack of experience for the EGS systems we employ creates risks that cost and timeline estimates may be
inaccurate and the lack of domestic commercial experience in terms of labor and supply chain and other factors may
result in greater than expected construction cost, deployment timelines, maintenance requirements, differing power
output and greater operating expense. Even as we standardize GeoBlock designs and capture learning curves,
subsurface geology and engineered reservoir performance can vary, and early-stage EGS operational data, while
growing, remains limited relative to historically available geothermal operating data.
We rely on power transmission facilities that we do not own or control.
We depend on transmission facilities owned and operated by others to deliver the power we sell from our power
plants to our customers. If transmission is disrupted, or if the transmission capacity infrastructure is inadequate, or if
there is a failure that requires long shutdown for repair, or if curtailment is required due to load system inefficiency,
our ability to sell and deliver power to our customers may be adversely impacted and we may either incur additional
costs or forego revenues. For example, if a transmission provider curtails our facility or recalls our transmission
rights, we could experience prolonged or repeated outages, face liquidated damages or termination under our PPAs,
face damages under tax credit sales agreements, and face potential defaults under financing arrangements. In
addition, lack of access to new transmission capacity may affect our ability to develop new projects. Existing
congestion of transmission capacity, as well as expansion of transmission systems and competition from other
developers seeking access to expanded systems, could also affect our performance. Although our modular
42
GeoCluster approach may offer interconnection optionality at multi-gigawatt sites, new transmission remains
uncertain, and behind-the-meter opportunities with data centers may not be available or sufficient to offset
transmission constraints.
The successful development of our project pipeline depends on our ability to obtain sufficient interconnection
and transmission capacity to support delivery obligations under our PPAs. For example, for Cape Station Phase II,
we currently have approximately 290 megawatts of interconnection and transmission rights. This capacity is
sufficient to meet the obligations under our original PPAs with Southern California Edison (SCE) and Clean Power
Alliance (CPA), but is insufficient to support the full 384 megawatts of combined contracted capacity with the
subsequent expansions of the SCE and CPA PPAs. If we are unable to secure additional interconnection and
transmission capacity or alternative delivery arrangements on a timely basis or at all, our original PPAs would
remain in effect; however, we may be unable to deliver the additional megawatts of contracted capacity, which could
result in reduced revenues, payment of liquidated damages, contract modifications or terminations, or other adverse
effects on our business and financial condition.
We have only a limited track record and historical financial information, and there is no assurance that our
business will be successful over the long term.
Prior to February 2017, we conducted no business operations and we recorded no revenue or expenses. During
the years ended December 31, 2025 and 2024, we reported net losses of $57.8 million and $41.1 million,
respectively.
Our activities to date have included organizational efforts related to the development and construction of our
projects and related assets, including but not limited to:
•Raising capital;
•Securing options to lease and leasing our project sites within large, contiguous EGS development hubs that
we refer to as GeoClusters;
•Negotiating and planning with various contractors for the development and production of such sites;
•Negotiating PPAs with offtakers, including investment-grade utilities and hyperscalers seeking clean, firm
24/7 power;
•Negotiating and entering into construction contracts with construction contractors;
•Negotiating and entering into procurement contracts with equipment suppliers for standardized, modular
ORC units and drilling services;
•Procuring transmission and interconnection rights; and
•Engaging in development and construction activities at Project Red and Cape Station, and retaining
contractors for such work, including geotechnical, drilling, completions and surface, power plant and
electrical equipment construction.
We have plans for rapid continued growth, with 500 megawatts under construction and a significant number of
additional megawatts in the pipeline for planned construction. Our future growth will be impacted by, among other
things: adverse macroeconomic conditions, including the rate of growth of U.S. electricity demand; changing
interest rates; our ability to develop our wellfields and power plants, market acceptance of our technology, including
our EGS systems, our ability to meet demand for funding; sales of power pursuant to our PPAs; increasing
competition; credit market volatility; increasing regulatory costs and challenges; prices of construction of projects;
and our failure to capitalize on growth opportunities.
Further, as we execute these growth plans, we expect our operating expenses to significantly increase as we
make significant investments, expand our operations and infrastructure, develop and introduce new technologies and
hire additional personnel. These efforts may be more costly than we expect and may not result in revenue growth or
43
increased efficiency. When we become a public company, we will incur additional significant legal, accounting, and
other expenses that we did not incur as a private company. We believe that we will continue to incur net losses for
the next several years and we may not achieve or maintain profitability in the future, either on the timetable we
expect or at all. Because the markets in which we operate are evolving, it is difficult for us to predict our future
results of operations or the limits of our market opportunity.
Our limited operating history may limit your ability and the ability of counterparties and potential financing
sources, among others, to evaluate our prospects because our limited financial data, our unproven ability to maintain
or increase our profitability and our limited experience in addressing issues that may affect our ability to manage the
construction, operation or maintenance of enhanced geothermal facilities and related assets. We face all of the risks
commonly encountered by other growing businesses, including competition and the need for additional capital and
personnel. As a result, any assessment you, our counterparties or potential financing sources make about our current
business and any predictions you, our counterparties or potential financing sources make about our future success or
viability may not be accurate. There is no assurance that our business will be successful over the long term.
Our financial performance depends on the successful operation of our geothermal power plants, which is subject
to various operational risks.
Our financial performance depends on the successful operation of our geothermal power plants. In connection
with such operations, we anticipate we will derive substantially all of our total revenues for the year ended
December 31, 2026 from the sale of electricity. Following commissioning of our power plants, we plan to manage,
operate, and maintain such power plants in-house through our subsidiaries. We are in the process of building out our
team to manage and operate the power plants, and as a result we will be exposed to various operational risks as we
expand that team and bring power plants online. The cost of operation and maintenance and the operating
performance of our geothermal power plants may be adversely affected by a variety of factors, including:
•our limited track record with managing and operating our own power plants;
•our power plants performing below expected levels of efficiency or capacity or required changes to
specifications for continued operations;
•regular and unexpected maintenance and replacement expenditures;
•breakdowns or failures of equipment or shortages or delays in the delivery of power;
•risks related to operational errors or failures of operators and service providers used in our operations;
•our potential inability to recruit and retain key personnel to successfully manage and operate the power
plants;
•a lack of adequate and qualified personnel to crew and operate the power plants;
•potential labor shortages, work stoppages, or labor disputes;
•the presence of hazardous substances on our geothermal power plant sites and releases of hazardous
substances into the environment;
•transmission expenses and complications;
•continued availability of water supply or costs associated with procurement;
•catastrophic events such as fires, explosions, earthquakes, volcanic activity, landslides, floods, severe
weather storms, or other weather events (including weather conditions associated with climate change) or
similar occurrences affecting our power plants or any of the power purchases or other third parties
providing services to our power plants;
•availability of supporting infrastructure, such as roads and other civil infrastructure;
44
•the aging of power plants and ORC turbines (which may reduce their availability and increase the cost of
their maintenance);
•the inability to secure or sustain sufficient geothermal heat flow from production wells due to engineered
reservoir underperformance, thermal drawdown, scaling or injection/production imbalances;
•decreases in heat-in-place, reservoir temperature, or sustainable flow rates over time, including as a result
of thermal drawdown, changes in fracture conductivity or short‑circuiting, permeability loss, scaling, or
lower-than-expected recovery factors;
•the inability to augment, remediate, or replace existing wells to maintain production, whether due to
prohibitive costs or otherwise (including limits on refracturing, sidetracking, installing liners or artificial
lift, increasing injection pressures, drilling make‑up wells, supply chain availability, regulatory or
permitting constraints, or water constraints);
•cyber-attacks that may interrupt the operation of our power plants; and
•potential changes to laws or rules which may affect our ability to meet existing contract energy delivery
requirements.
Any of these events could significantly increase the expense of operating our power plants or could reduce the
overall effectiveness of the generating capacity of our power plants, which in turn would reduce our net income and
could materially and adversely affect our business, financial condition, future results and cash flows.
We have a history of losses, we anticipate increasing operating expenses in the future, and we may not be able to
achieve and, if achieved, maintain profitability.
We have experienced losses in each year since our founding. During the years ended December 31, 2025 and
2024, we reported net losses of $57.8 million and $41.1 million, respectively. We believe that we will continue to
incur net losses for the next several years and we may not achieve or maintain profitability in the future, either on
the timetable we expect or at all. Because the markets in which we operate are evolving, it is difficult for us to
predict our future results of operations or the limits of our market opportunity.
We expect our capital and operating expenditures to significantly increase as we make significant investments,
expand our operations and infrastructure, develop and introduce new technologies and hire additional personnel.
These efforts may be more costly than we expect and may not result in revenue growth or increased efficiency.
When we become a public company, we will incur additional significant legal, accounting, and other expenses that
we did not incur as a private company.
Our ability to be profitable and generate positive operating cash flows is primarily dependent on our ability to
generate revenues, and in turn net profits and operating cash flows, after COD occurs for a given project, through the
sale of electricity pursuant to our PPAs that are effective after their respective COD, as well as our ability to
monetize our tax credits and our other assets, including any intellectual property, data, or advisory arrangements that
may be pursued in the ordinary course.
Our ability to generate sales of electricity following COD at each of our projects depends on our ability to
successfully commence and maintain production under our PPAs. We expect to begin delivering first power from
our 500-megawatt Cape Station project by late 2026, and to reach approximately 100 megawatts of operating
capacity by early 2027. However, there is no guarantee that we will achieve such CODs within those timeframes or
at all. We may fail to receive the required approvals and permits from governmental and regulatory agencies for our
projects. As a result, there can be no assurance as to when we will commence deliveries under our PPAs, and
therefore when, if at all, we will commence generating revenues and operating cash flows from our PPAs. If we do
not commence operations under our PPA on Cape Station Phase I (Unit 1) by October 1, 2026, Cape Station Phase I
(Units 2-3) by January 1, 2027, and Cape Station Phase II by June 1, 2028, we will incur liquidated damages under
the provisions of the applicable PPA. If we do not commence operations within six months of the applicable PPA
45
COD deadline, our counterparty has the right to terminate the contract. Accordingly, there is significant uncertainty
about our ability to maintain profitability and operating cash flows.
Further, if our wells are not as productive as expected, we may have to drill additional wells, driving up capital
expenditures and potentially making our projects unprofitable. Because our EGS deployment relies on horizontal
drilling and multistage stimulation to create engineered reservoirs, deviations from expected reservoir performance
could also impact production profiles and power output from otherwise standardized GeoBlocks.
If our revenue does not increase sufficient to offset the expected increases in our operating expenses, we will
not be profitable in future periods. Any of the foregoing could have a material adverse effect on us. We cannot
assure you that we will ever achieve or sustain profitability and may continue to incur significant losses going
forward, which could cause the value of our Class A common stock to decline. Moreover, even if we achieve
targeted cost reductions over time through EGS learning curves and standardized ORC deployments, we may not be
able to outcompete other suppliers of electricity.
Our business relies on projects with extended timelines and failure to realize these projects may adversely impact
our business.
Our business and revenues rely on projects with extended and estimated timelines. However, our reliance on
events in the distant future subjects us to significant risk of changes in the economic environment, regulatory
environment, competitive landscape and technological advances. In particular, we may encounter unanticipated
delays in the scheduled commencement date or completion of Cape Station or other projects, including due to our
inability to secure funding, inability to obtain or delays in obtaining permits, licenses and other regulatory approvals
(including due to legal challenges or other opposition relating to environmental permits), manufacturing delays and
launch delays, as well as delays due to weather and supply chain disruptions.
If the development and launch of Cape Station (or its components) is not as successful as anticipated or if we
fail to realize all or some of the benefits within the anticipated timeframe, including phased GeoBlock deployment,
we may accrue additional costs, fail to gain expected cost savings, fail to recognize additional revenue, become
unable to meet our financial objectives, provide a basis for contract termination or renegotiation or otherwise
negatively impact customer and employee experience and fail to grow or grow as quickly or compete as effectively
as we currently anticipate. In addition, given the large amount of time, we may be unable to adequately prepare for
additional risks of which we may not currently be aware and the risks of which we are aware may be heightened.
Failure to meet these timelines or delays in operation of Cape Station and other projects may adversely affect us.
We rely on a limited number of suppliers for certain materials and supplied components, some of which are
highly specialized. We and our third-party vendors may not be able to obtain sufficient materials or supplied
components to meet our manufacturing and operating needs or obtain such materials on favorable terms
including price. Additionally, certain components may only be available from international suppliers.
Our operations depend on a reliable supply chain for critical components, such as geothermal turbines, heat
exchangers, and control systems, which are primarily sourced from third-party suppliers like Turboden, Baker
Hughes and other specialized manufacturers. Although we have placed orders for critical components of Phase II of
Cape Station, there is no guarantee that such components will arrive in the timeline expected or at all. If we are
unable to secure replacements for such critical components, or if the timing of Phase II of Cape Station is impacted
by the delay of such critical components such that we are unable to deliver power within the timeframe
contemplated by the applicable PPA, our business may be materially and adversely impacted. For more information,
please read “Risk Factors—Our customers or we may terminate our PPAs if certain conditions are not met or for
other reasons.” Disruptions in manufacturing, transportation, or global trade—whether due to natural disasters,
geopolitical tensions, global trade wars, tariffs, labor strikes, or pandemics—could delay the delivery of these
components, impacting our ability to complete projects, including Phase II of Cape Station, as planned and meet
contractual obligations.
Transformers and related grid equipment are critical for interconnecting our GeoBlocks. Persistent supply chain
constraints, extended lead times, or increased demand from other sectors could delay our ability to bring new
GeoBlocks online, increasing costs and reducing revenue. The procurement process for grid infrastructure also
46
involves utility coordination and multi‑party approvals, adding complexity and potential bottlenecks. Although our
GeoCluster model can enable interconnection optionality, including phased interconnections or behind‑the‑meter
options, such options may not be available or sufficient to offset broader grid equipment shortages.
Prolonged supply chain issues could lead to increased costs, missed deadlines, and loss of revenue, as well as
damage to our reputation with customers, partners, and regulators. In addition, supply chain disruptions may force us
to seek alternative suppliers or redesign project specifications, potentially incurring additional expenses and
technical risks. Having to switch suppliers could also cause material delays in construction and operations, for
example, regarding wellhead supply. Moreover, we are dependent on future supplier capability to meet production
demands attendant to our forecasts. While we maintain strong relationships with suppliers and seek to diversify our
sourcing strategies, the complexity and global nature of our supply chain present ongoing risks that could adversely
affect our business operations and financial performance. Even where we secure multi-year ORC procurement
arrangements or drilling services, broader market constraints could limit near-term deliverability.
Additionally, the imposition of sanctions, tariffs, or material changes in import and export requirements on a
nation-by-nation basis, on materials or supplied components for our power plants could have a material adverse
effect on our operations. Prolonged disruptions in the supply of any of our key materials or components, difficulty
qualifying new sources of supply, implementing use of replacement materials or new sources of supply or any
volatility in prices could have a material adverse effect on our ability to operate in a cost-efficient, timely manner.
Such prolonged disruptions could also cause us to experience cancellations or delays of scheduled launches,
customer cancellations or reductions in our prices and margins, any of which could harm our business, financial
condition, results of operations and cash flows. Our reliance on a domestic supply chain for drilling services and
ORC equipment remains subject to capacity, even as we seek to partner with established service providers and
turbine manufacturers.
Concentration of customers, specific projects and regions may expose us to heightened financial exposure.
Our business model currently relies on customers purchasing all or a significant portion of a facility’s output
under long-term PPAs. The financial performance of these facilities depends on the ability of each customer to
perform its obligations under those PPAs. A facility’s financial results could be materially and adversely affected if
any of our customers fail to fulfill their contractual obligations and we are unable to obtain the same prices or terms
we currently receive with new customers. We cannot assure that such performance failures by our customers will not
occur, or that if they do occur, such failures will not adversely affect the cash flows or profitability of our business.
Moreover, there can be no assurance that we will be able to enter into replacement agreements on favorable terms or
at all.
As of December 31, 2025, substantially all of our GeoBlocks under construction were located in Utah. We also
intend to expand our operations into Nevada in the long-term. In addition, we expect much of our near-term future
growth to occur in these same markets and throughout the western United States, further concentrating our
operational infrastructure. Accordingly, our business and results of operations are particularly susceptible to adverse
economic, regulatory, permitting, political, weather and other conditions in such markets and in other markets that
may become similarly concentrated. Any of these conditions, even if only in one such market, could have a material
adverse effect on our business, financial condition and results of operations.
We are exposed to the credit and financial condition of our offtakers. We have two long-term PPAs relating to
Cape Station Phase I, and two long-term PPAs relating to Cape Station Phase II. Because our contracts are long-
term, we may be adversely affected if the credit quality of any of these customers were to decline or if their
respective financial conditions were to deteriorate or if they are otherwise unable to perform their obligations under
our long-term contracts. While we have executed binding offtake agreements with credit-worthy counterparties in
certain cases, long-term exposure to a concentrated offtaker base remains a risk.
We are a holding company and our cash depends substantially on the performance of our subsidiaries and the
power plants they operate, most of which are subject to restrictions and taxation on dividends and distributions.
As a holding company, our financial health and liquidity are closely tied to the performance of our subsidiaries
and the geothermal power plants they operate. These subsidiaries are the primary source of our cash flow, and any
47
adverse developments in their operations can directly impact our ability to generate revenue and maintain financial
stability. The geothermal power plants are subject to various operational risks, including resource variability,
technological challenges, and maintenance requirements, which can affect their efficiency and output. Additionally,
fluctuations in energy prices and demand can influence the profitability of these plants, further impacting the cash
flow available to the holding company.
Moreover, our subsidiaries operate in diverse regulatory environments, each with its own set of restrictions and
taxation policies on dividends and distributions. These regulations can limit the amount of cash that can be
transferred to the holding company, affecting our ability to meet financial obligations and invest in growth
opportunities. Changes in tax laws or regulatory frameworks could increase the tax burden on our subsidiaries,
reducing the funds available for distribution. As a result, our financial results and ability to execute strategic
initiatives are inherently linked to the operational success and regulatory compliance of our subsidiaries and the
geothermal power plants they manage.
In addition, certain of our subsidiaries are party to project-level financing arrangements that contractually
restrict or prioritize cash distributions before any amounts can be upstreamed to us. For example, the Cape Station
Phase I project equity financings with Catalyst and Centaurus contain required payout provisions that must be
satisfied prior to any distributions to our parent company. The Catalyst financing is structured as project-level
preferred equity with a priority dividend and return-of-capital profile, with cash applied first to preferred
distributions before amounts are available to common equity. The Centaurus financing, which we have negotiated
for Cape Station Phase I as junior project preferred equity, includes a distribution waterfall that prioritizes cash to
Centaurus until agreed return hurdles are achieved, after which distributions step down; certain terms could further
reduce cash available to common equity. The Project Granite Facility also includes a cash management structure
pursuant to which project revenues from Cape Station Phase I are applied in a specified priority of payments, and
distributions are subject to the satisfaction of specified conditions. These and similar project-level distribution
waterfalls, reserve requirements, and covenant-based limitations may delay, reduce, or entirely preclude cash
distributions to us for extended periods, even when the underlying project is operating as expected. Any such
restrictions could materially limit our liquidity at the holding company level and our ability to meet corporate
obligations, fund corporate overhead, or pursue strategic initiatives.
Management and operation of our wellfield and power plants will involve significant risks.
Following commissioning of our power plants, we plan to manage, operate, and maintain such power plants
through our subsidiaries. We are in the process of building out our team to manage and operate the power plants, and
as a result we will be exposed to various new operational risks as we expand that team and bring power plants
online. For example, we will be exposed to the following risks with respect to the operation of power plants:
•our limited track record with managing and operating our own power plants;
•our power plants performing below expected levels of efficiency or capacity or required changes to
specifications for continued operations;
•breakdowns or failures of equipment or shortages or delays in the delivery of power;
•releases of hazardous substances into the environment;
•risks related to operators and service providers used in our operations;
•operational errors by us or any contracted provider;
•continued availability of water supply or costs associated with procurement;
•catastrophic events or accidents such as fires, explosions, earthquakes, volcanic activity, landslides, floods,
severe weather storms, or other weather events (including weather conditions associated with climate
change) or other similar events or catastrophes;
48
•aging of power plants and ORC turbines (which may reduce their availability and increase the cost of their
maintenance);
•a lack of adequate and qualified personnel to crew and operate the power plants;
•potential labor shortages, work stoppages, or labor disputes;
•our potential inability to recruit and retain key personnel to successfully manage and operate the power
plants;
•weather-related or natural disaster interruptions of operations;
•failure to supply due to scheduled or unscheduled maintenance; or
•potential changes to laws or rules which may affect our ability to meet existing contract energy delivery
requirements.
The GFA is a non-binding agreement, and does not obligate Google to purchase power from us.
We recently entered into the GFA, a framework agreement with Google Energy LLC under which we have
committed to propose geothermal development projects representing at least one gigawatt of geothermal capacity to
Google within two years and up to three gigawatts over the term of the agreement. The GFA establishes a binding
framework under which we may propose geothermal development projects to Google, but it does not obligate
Google to accept any project, execute any power purchase agreement or provide us with any project financing.
Google has the sole and unilateral right to accept or reject any proposed project for any reason or no reason, and may
terminate the GFA in accordance with its terms. While the GFA provides for termination fees payable by Google if
it withdraws from a project at certain development stages, these fees may not fully compensate us for the
development costs we have incurred, and investors should not assume they reflect the full economic value of the
projects to which they relate. In addition, either party may terminate the GFA entirely if no definitive offtake
agreement has been executed by March 19, 2028, approximately two years from its effective date, which means the
GFA could lapse in its entirety without resulting in any binding commitment from Google to purchase power from
us. There can be no assurance that any project proposed under the GFA will progress to a binding offtake agreement
or that the GFA will result in any contracted capacity or revenue.
Even in the event that projects do proceed under the GFA, the pricing and other terms of the GFA may limit our
ability to fully recover costs or achieve our targeted returns. The GFA establishes pricing on a cost-plus targeted
return basis, subject to caps, floors, and escalating discounts on expansion projects, any of which could compress
our margins or require us to absorb cost overruns on affected projects. The GFA also grants Google audit rights over
our project costs and pricing methodology, which could give rise to disputes that delay or disrupt the execution of
definitive agreements. These pricing constraints could have a material adverse effect on our business, financial
condition, and results of operations.
The GFA also imposes exclusivity obligations and restrictions on both parties during the project development
process and grants Google certain rights of first refusal over portions of our project pipeline, including over
expansion capacity within contracted areas and certain near- and medium-term uncontracted capacity. The GFA
further restricts our ability to accept investment from, or enter into financing arrangements with, a broad category of
entities defined as competitors under the GFA. Together, these provisions give Google significant priority over our
near-term development pipeline and may limit our flexibility to pursue alternative commercial, strategic, or
financing arrangements that would otherwise be available to us.
Possible fluctuations in the cost of construction, raw materials, commodities and drilling may materially and
adversely affect our business, financial condition, future results, and cash flow.
Our operations are dependent on the supply of various raw materials, including primarily steel and aluminum
and industrial equipment components that we use. We generally obtain these materials and equipment at
market‑based prices through a mix of competitive bids and fixed‑price contracts, and certain purchases are impacted
by tariffs and logistics costs. We maintain multiple qualified suppliers across critical categories and are not broadly
49
dependent on any single supplier; however, certain specialized scopes such as the ORC turbines and associated
equipment for specific projects are currently sourced primarily from Turboden and Baker Hughes. We do not
maintain broad, ongoing framework supply agreements, but we do enter into project‑specific equipment and services
contracts with multi‑year delivery schedules. Global events such as geopolitical conflicts (including conventional
wars, trade wars and embargoes) have resulted in the extended shutdown of businesses in certain regions, causing
delays in supply and increases in the cost of raw materials and components and higher transportation expenses. Our
development activity is also impacted by supply delays and cost increases for raw materials and equipment, as well
as by tariffs and taxes. Further cost increases of such raw materials, commodities and equipment, logistics, or
increases in tariffs and taxes could adversely affect our profit margins and project schedules.
Our mix of turnkey and cost plus construction contracts may increase our exposure to cost overruns, delays, and
misalignment with our PPAs and financing.
We have engaged multiple engineering, procurement and construction (“EPC”) counterparties for Cape Station
Phase I under different commercial structures. Our EPC contracts include those for balance of plant (meaning the
on-site civil, mechanical, electrical, controls, and other systems that support and integrate the facility other than the
core process equipment and wells), transmission and distribution (meaning the interconnection and related electrical
facilities outside the plant), and wellpad facilities (meaning the surface facilities that support the wells). We utilize a
combination of (i) turnkey, fixed prices contracts under which the contractors are obligated to deliver defined scopes
for a set price, subject to change orders and customary exclusion and (ii) cost plus contracts, which are inherently
exposed to greater price variability.
Even for the turnkey scopes, prices can change through approved change orders, allowances, and exclusions,
and schedule risk remains if contractors underperform or if there are interface issues among EPCs. For the cost plus
contracts, our exposure to actual costs may increase if estimates prove low or if scope, productivity, or market
conditions change, even where budgets or targets are established. In each case, our contractual remedies may be
limited by liability caps, exclusions of consequential damages, and other limitations, and may not align with our
obligations under our PPAs, including COD requirements and availability or performance standards, or with
covenants and milestones under our project financing. If EPC delays or underperformance occur, we could incur
higher construction costs, miss COD or other contractual milestones in our PPAs, owe liquidated damages,
experience reduced pricing or capacity, or face termination rights that could adversely affect our revenues, liquidity,
and results of operations.
Our supply base may not be able to scale to the production levels necessary to meet sales projections.
We do not have manufacturing assets and will rely on third party manufacturers and construction firms to build
power plants, wellfields and associated equipment. Our growth strategy assumes that manufacturers of geothermal
turbines, drilling equipment, and other critical components will expand capacity in line with our development
pipeline. The existing supplier base for these highly specialized products is limited, and there is no assurance that it
can scale production, workforce, or logistics to match sector‑wide demand. If suppliers are unable or unwilling to
increase output on the timelines and terms we require, we could face extended lead times, higher equipment and
construction costs, and delays in reaching commercial operation, which could adversely affect our revenues, project
returns, and ability to meet contractual milestones. Moreover, we are dependent on future supplier capability to meet
production demands attendant to our forecasts. If our supply chain cannot meet the schedule demands of the market,
our projected sales revenues could be materially impacted.
Our business development activities may not be successful and our projects under construction or facilities may
encounter delays, which may impact our future growth.
We are in the process of developing and constructing a number of new power plants. Our success in developing
a project is contingent upon, among other things, negotiation of satisfactory engineering, construction, and
procurement agreements and obtaining PPAs and transmission services agreements, receipt of required
governmental permits (including environmental permits), obtaining adequate financing, and the timely
implementation and satisfactory completion of field development, testing and power plant construction and
commissioning. We may be unsuccessful in accomplishing any of these matters or doing so on a timely basis such in
50
cases where we have to handle legal proceedings with respect to environmental permits. Although we may attempt
to minimize the financial risks attributable to the development of a project by securing a favorable PPA and
applicable transmission services agreements, obtaining all required governmental permits and approvals and
arranging, in certain cases, adequate financing prior to the commencement of construction, the development of a
power project may require us to incur significant expenses for preliminary engineering, permitting and legal and
other expenses before we can determine whether a project is feasible, economically attractive or capable of being
financed.
Currently, we have EGS projects and prospects under exploration, development or construction in the United
States, and we intend to pursue the development of other new plants. Our completion of these facilities’
development and/or enhancement is subject to substantial risks, including:
•Inability to secure a PPA;
•Inability to secure or delays in securing transmission and/or interconnection services agreements and
related equipment and/or capacity;
•Inability to secure the required financing;
•Cost increases and delays due to unanticipated shortages of adequate resources to execute the project, such
as equipment, material, and labor;
•Work stoppages resulting from force majeure events, including riots, strikes, or weather conditions;
•Inability to obtain permits, licenses, and other regulatory approvals;
•Inability to satisfactorily complete field development and testing;
•Failure to secure sufficient land positions for the wellfield, power plant, and rights of way;
•Failure by key contractors and vendors to timely and properly perform, including where we use equipment
manufactured by others;
•Substantial delays associated with switching to different suppliers or technologies and related integration
risks;
•Adverse environmental and geological conditions, including discoveries of contamination, protected plant
or animal species or habitat, archaeological or cultural resources, or inclement weather conditions;
•Adverse local business law;
•Legal challenges and other opposition to our projects;
•Limited access to a stable and secure water supply;
•Our attention to other projects and activities, including those in the energy storage sectors; and
•Changes in laws, regulations or policies that mandate, incentivize, or otherwise favor renewable energy
sources.
If we fail to effectively manage our growth, our business, financial condition, and results of operations could be
adversely affected.
We have grown rapidly since our inception and expect to continue to experience rapid growth in the future. This
growth has placed, and may continue to place, significant demands on our management and our operational and
financial infrastructure. We have made, and intend to continue to make, substantial investments in our technology,
operations, engineering, customer service, risk, sales, and marketing infrastructure. Our ability to manage our
growth effectively and to integrate new technologies, personnel, and strategic acquisitions and priorities into our
51
existing business will require us to continue to expand our operational and financial infrastructure and retain, attract,
train, motivate, and manage key employees. Continued growth could strain our ability to develop and improve our
operational, financial, and management controls, enhance our reporting systems and procedures, recruit, train, and
retain highly skilled and other necessary personnel, and maintain customer and brand satisfaction.
Additionally, if we do not effectively manage the growth of our business and operations, the quality of our
platform and the efficiency of our operations could suffer, which could adversely affect our growth, business,
financial condition, and results of operations. As we scale GeoClusters and add multiple GeoBlocks over time, the
complexity of simultaneous, repeatable deployments may exacerbate these risks.
Changes in governmental agency budgets, policies and priorities, as well as staffing shortages at national
laboratories and other governmental agencies, may lengthen our estimated timelines for regulatory approval and
construction.
Certain of our wellfields and power plants are dependent upon collaborations with national laboratories and/or
various regulatory approvals. In particular, many of our projects are located on, cross, or otherwise rely on access to
lands administered by the BLM, and our development and operations depend on obtaining and maintaining BLM
rights-of-way, leases, drilling and construction permits, and related approvals. Government agency budgets and
staffing are driven by the priorities of leadership at federal agencies as well as policymakers. Changes in
governmental agency budgets, personnel, and any resulting staffing shortages may delay our geothermal power
plants and resource management facilities and delay or prevent the issuance of required regulatory approvals (e.g.,
permits or licenses) for our geothermal operations. Additionally, lapses in federal appropriations and related
government shutdowns can suspend or significantly slow agency activities, including BLM processing of
applications, consultations, and environmental reviews, which can halt field work, delay access to federal lands, and
extend project schedules. These delays can impact our ability to commence or expand operations, affecting our
revenue generation and growth prospects.
The reliance on government collaboration and regulatory approval introduces a layer of uncertainty, as shifts in
political priorities or budget allocations can alter the focus and efficiency of relevant agencies. If funding for
environmental assessments or energy-related research is reduced, it may slow the progress of our projects and hinder
technological advancements. Additionally, staffing shortages within regulatory bodies can lead to longer processing
times for permits and licenses, creating bottlenecks that affect project timelines and operational planning. Our
dependence on BLM-administered lands and approvals amplifies these risks because delays or disruptions at BLM
—whether due to budget constraints, staffing shortages, or shutdowns can directly impede site access, surveying,
drilling, construction and tie-in activities.
Moreover, changes in government leadership or policy direction can result in new regulations or modifications
to existing ones, requiring us to adapt our operations to remain compliant. This can involve additional costs and
resources, further impacting our financial performance. Periods of continuing resolutions and government
shutdowns may also defer rulemaking, pause interagency consultations (including those required under NEPA and
related federal statutes), and postpone issuance of records of decision or permits needed for project advancement. As
a result, maintaining strong relationships with government entities and staying informed about policy developments
is crucial for navigating these challenges and ensuring the successful execution of our geothermal projects. Although
certain federal and state policy developments may support geothermal development, such support may not be
available or sufficient.
In addition, the recent change in the U.S. presidential administration increases regulatory ambiguity and the rate
of change. In January 2025, President Donald Trump signed several Executive Orders specific to the energy industry
which may signal a shift in the federal government’s approach to energy-related initiatives, policies, and regulations,
and contain directives that, among other things, (i) encourage further domestic energy exploration and production,
including on federal lands and waters, (ii) instruct federal agency and department officials to expedite the
completion and authorization of various energy-related projects, (iii) promote the streamlining of various permitting
processes at the federal level, and (iv) rescind and revise regulations that burden future energy development,
identification, and production. Notably, the Trump administration specifically highlighted “geothermal heat” as one
source of energy for increased domestic attention and production. However, we cannot currently make any
52
assurance regarding the influence of the policies or political stances of the Trump administration or current U.S.
Congress on our business. Relatedly, in recent years, specifically in the U.S., “anti-ESG” sentiment has gained
momentum, with several states and Congress having proposed or enacted “anti-ESG” policies, legislation, or
initiatives or issued related legal opinions. We cannot predict what, if any, impact such “anti-ESG” policies will
have on our industry or our business specifically.
We could also face an increase in competition as a result of the energy transition, as new entrants of disruptive
technologies and/or competitors, including in the solar, wind, nuclear and storage sectors, could adversely impact
our ability to renew existing PPAs or sign new contracts. On the other hand, anti-ESG related policies, legislation,
initiatives, litigation, legal opinions, and scrutiny could result in additional compliance obligations, us becoming the
subject of investigations and enforcement actions, or sustaining reputational harm.
If the energy production by or availability of our power plants is less than expected, they may not be able to
satisfy minimum production or availability requirement obligations under our PPAs.
Energy production or a power plant’s availability could be less than expected due to various factors, including,
but not limited to, resource degradation and/or our inability to artificially stimulate thermal reservoirs to offset any
such degradation, natural disasters, equipment underperformance, operational issues, changes in law or regulations
or actions taken by third parties. Our PPAs contain provisions that require us to produce a minimum amount of
energy or be available to generate electricity at a given minimum percentage of time over periods specified in the
PPAs. A failure to produce sufficient energy or to be sufficiently available for generation to meet our commitments
under the PPAs could result in the payment of damages or the termination of PPAs and could have a material
adverse effect on our business, financial condition, results of operations and ability to grow its business and make
cash distributions to its shareholders. Our EGS approach is designed to provide baseload power independent of
weather; however, engineered reservoir performance variability or extended outages of standardized ORC units
could reduce output or availability.
These contracts were executed at attractive prices, representing approximately $7.2 billion in potential revenue
backlog. Backlog is calculated using expected energy output, as defined in each PPA, over the entire term of each
PPA and reflects contracted pricing (including any escalators or indexation) and full counterparty performance,
taking credit for all 658 megawatts of executed PPAs as of December 31, 2025. We are actively engaging energy
buyers for additional capacity, which is not included in backlog. Backlog is an operating metric and may change
based on project timing, production variability or curtailment, and potential contract amendments or termination.
Our customers or we may terminate our PPAs if certain conditions are not met or for other reasons.
Each of our PPAs contains or will contain various termination rights allowing our current and future offtakers to
terminate, or be relieved from their contractual obligations under, their PPAs under certain circumstances, including,
without limitation:
•with respect to certain PPAs, the failure of conditions precedent to be satisfied or waived by a specified
date, or delays in the beginning of construction of the applicable project or occurrence of COD beyond a
specified time period;
•if we fail to deliver certain megawatts at certain reliability levels;
•upon the occurrence of certain extended events of force majeure;
•if we have been held liable in excess of certain liability caps and we did not agree to increase such liability
caps as specified under the relevant PPA;
•if we fail to satisfy our contractual obligations under the applicable PPA;
•if we fail to maintain adequate interconnection or transmission rights required to meet delivery
requirements under the relevant PPA;
53
•if we fail to satisfy our contractual obligations after an event of default and after any applicable cure
periods; and
•the occurrence of certain change of control events.
Our failure to meet these milestones and other criteria, including minimum quantities, may result in price
concessions and may result in the termination of our PPAs, in which case we would lose any future cash flow from
the relevant project and may be required to pay fees and penalties to our counterparty. Specifically, with respect to
project completion risk, if we do not commence operations under our PPA on Cape Station Phase I (Unit 1) by
October 1, 2026, Cape Station Phase I (Units 2-3) by January 1, 2027, and Cape Station Phase II by June 1, 2028,
we will incur liquidated damages under the provisions of the applicable PPA. If we do not commence operations
within six months of the applicable PPA COD deadline, our counterparty has the right to terminate the contract. If
our PPAs are terminated, it could materially and adversely affect the development of our geothermal power plants,
our results of operations, and cash flow unless we are able to replace the PPA on similar terms. Additionally, we
cannot assure you that we will be able to perform our obligations under such agreements or that we will have
sufficient funds to pay any fees or penalties thereunder.
Our PPAs contain terms that could limit revenues and expose us to transmission, pricing, and regulatory
approval risks. If these risks materialize, our ability to meet projections and service project‑level debt could be
materially and adversely affected.
Under our PPAs, including those with Southern California Edison, we are required to deliver product from our
interconnection point to designated delivery points on the applicable transmission system and to secure firm,
end‑to‑end transmission along that path. We bear the risk that third‑party interconnection or transmission
arrangements are curtailed, modified, not renewed, or terminated, that network upgrades, import capability, or
market design changes impair deliverability, or that congestion curtailments occur, which may not qualify as Force
Majeure under our contracts. If deliverability is impaired or lost, we could incur default exposure, liquidated
damages, or replacement costs, be required to secure alternative transmission at our expense, or face termination
rights by our offtakers. Because certain of our PPAs are large, long‑term offtake commitments that are central to our
projected cash flows and project‑level financing covenants, any impairment to end‑to‑end deliverability,
interconnection capacity, or transmission rights could materially and adversely affect our business and financing.
Our exposure under these PPAs also relates to development milestones, initial delivery requirements, and
performance testing. Many PPAs require adherence to critical path milestones, allow only limited extensions of
expected initial delivery dates (often with daily delay liquidated damages), and impose deadlines by which
commercial operation must be achieved. As conditions to initial delivery, we typically must demonstrate a minimum
percentage of expected contract capacity and satisfy certifications, interconnection, and market participation criteria
established by the applicable market operator and regulatory authorities. Failure to timely achieve commercial
operation or to demonstrate the required capacity can trigger delay liquidated damages, capacity adjustments, events
of default, or termination rights. Additionally, if capacity factors or availability fall below specified thresholds, or if
we are unable to schedule to the delivery point for extended periods, we may face default exposure or be required to
implement recovery plans on compressed timelines at our expense.
Many of our PPAs employ a fixed product price construct and contain asymmetric production and pricing
mechanics. Deliveries above expected annual net energy production may be subject to caps and pricing adjustments,
with positive market revenues for over‑production sometimes retained by the offtaker. Conversely, if we deliver less
than a specified percentage of expected annual net energy production (net of qualifying lost output), we owe
liquidated damages based on contractual formulas. Together, these terms limit upside in strong‑production periods
while preserving exposure to adverse pricing, congestion, and basis movements between our scheduling points and
delivery points, and they may require us to absorb performance shortfalls through market purchases or liquidated
damages.
Many of our PPAs require external approvals and extensive ongoing compliance. Certain agreements are
subject to regulatory approvals as conditions precedent, with either party sometimes entitled to terminate if approval
is not timely obtained on acceptable terms. We must maintain required certifications, participate in the applicable
54
market, comply with reliability standards, post and maintain development and performance security, and comply
with capacity accreditation or resource adequacy‑type obligations, including must‑offer or supply plan submissions.
The agreements contemplate potential changes to accreditation methodologies and broader market design changes.
While the contracts may provide for amendments or limited cost caps in certain change‑in‑law scenarios, we bear
the risk that compliance actions, reduced capacity accreditation, or market design adjustments diminish revenues or
increase costs. Some PPAs also restrict our ability to remarket output following certain terminations for a defined
period and may grant an offtaker a right of first offer on replacement transactions, which could constrain mitigation
strategies and cash flows after termination. Finally, fixed product prices in certain PPAs reflect assumed federal,
state, or local tax incentives; prices may not adjust for our eligibility or ineligibility for such incentives, which could
limit our ability to offset cost or rule changes through contract pricing. If termination or default rights are exercised,
if curtailment is sustained, if we fail to obtain or maintain firm end‑to‑end transmission, interconnection capacity,
and required approvals, or if we miss development or performance thresholds, our revenues could be materially
reduced, our costs could increase, and we could fail to satisfy project‑level financing covenants.
As our contracts expire, we may not be able to renew them or replace them with agreements on similar terms.
Certain contracts in our portfolio will be subject to re-contracting in the future. For example, the average
remaining term of our existing PPAs was approximately 15 years as of December 31, 2025. If prices in our market
change at the time of such re-contracting, it may impact our ability to re-negotiate or replace these contracts on
terms that are acceptable to us, or at all. In addition, a concentrated pool of potential buyers for our products and
services may restrict our ability to negotiate favorable terms under new contracts or existing contracts that are
subject to re-contracting.
We cannot provide any assurance that we will be able to re-negotiate or replace these contracts once they
expire, and even if we are able to do so, we cannot provide any assurance that we will be able to obtain the same
prices or terms we currently receive. Our inability to re-negotiate or replace these contracts, or to secure prices at
least equal to the current prices we receive, could have a material adverse effect on us.
Certain of our PPAs require us to satisfy fixed minimum performance and availability standards tied to
renewable portfolio standard compliance, and failure to meet those fixed requirements may result in liquidated
damages, loss of REC value, capacity de-rates or termination.
Under certain of our PPAs with investor‑owned and publicly‑owned utilities in RPS states, we are obligated to
meet defined minimum performance and availability thresholds over specified measurement periods for the
associated energy and renewable energy credits. These contractual thresholds are fixed requirements that do not
automatically adjust for subsequent changes in broader RPS programs and are separate from any evolving market
rules. If our plants underperform relative to those fixed minimums, whether due to outages, resource variability,
curtailments, or other factors, we may be required to make payments or credits for shortfalls, we could experience
permanent reductions to contracted capacity, and counterparties could in certain cases exercise termination rights. In
addition, if REC delivery falls below contracted amounts, we may be exposed to liquidated damages or replacement
obligations. Any such outcomes could materially and adversely affect our revenues, margins and cash flows.
We do not own the land on which the projects are located, and our use and enjoyment of the property may be
adversely affected to the extent that there are any lienholders or land rights holders that have rights that are
superior to our rights or the Bureau of Land Management suspends its federal right-of-way grants.
We do not own the land on which the projects in our portfolio are located and they generally are, and its future
projects may be, located on land occupied under long-term easements, leases and rights-of-way. As of December 31,
2025, approximately 66% of our acreage was located on land owned by the United States federal government, 6%
was located on state lands, and 28% was located on privately-owned land. As of December 31, 2025, our easements,
leases and rights-of-way had a weighted average remaining term of approximately 7 years with scheduled
expirations of approximately 6% in years 2026 to 2028, 55% in years 2029 to 2031, and 39% thereafter, in each case
excluding any unexercised renewal options. A majority of our leases are issued by the BLM and include renewal
options exercisable at our discretion. The standard BLM lease provides an initial ten-year term followed by two five-
year renewal options. We currently anticipate exercising renewal options for our leases, including those with near-
55
term scheduled expirations in 2026 to 2028, and we do not expect any material lease expirations in the near term.
Additionally, these BLM leases contain acreage that is subject to extension provided certain conditions are met,
including a minimum amount of expenditures per acre and the provision of certain geologic information to the BLM,
which enables us to extend the lease term for as long as we continue to meet such conditions.
The ownership interests in the land subject to these easements, leases and rights-of-way may be subject to
mortgages securing loans or other liens and other easements, lease rights and rights-of-way of third parties that were
created prior to our projects’ easements, leases and rights-of-way. As a result, some of our projects’ rights under
such easements, leases or rights-of-way may be subject to the rights of these third parties. While the Company
performs title searches, records its interests in the real property records of the projects’ localities and enters into non-
disturbance agreements to protect itself against these risks, such measures may be inadequate to protect against all
risk that our rights to use the land on which its projects are or will be located and its projects’ rights to such
easements, leases and rights-of-way could be lost or curtailed. Additionally, our operations located on properties
owned by others are subject to termination for violation of the terms and conditions of the various easements, leases
or rights-of-way under which such operations are conducted.
Further, our activities conducted under federal rights-of-way grants are subject to “immediate temporary
suspension” of unspecified duration, at any time, at the discretion of the Bureau of Land Management (“BLM”). A
suspension of activities within a federal right-of-way may be issued by the BLM to protect public health or safety or
the environment. An order to suspend activities may be issued by the BLM prior to an administrative proceeding.
Such an order may be issued verbally or in writing and may require immediate compliance. Any violation of such an
order could result in the loss or curtailment of our rights to use any federal land on which its projects are or will be
located.
Our exposure to these risks is heightened because a portion of our contracted revenue backlog is tied to utility
counterparties whose PPAs depend on the continued operation of projects located on such lands. As of December
31, 2025, we had PPAs with several utilities, representing approximately $5.7 billion of our approximately $7.2
billion contracted backlog revenue. Any loss or curtailment of our rights to use project lands as a result of any
lienholders or land rights holders with superior rights, or any BLM suspension of federal rights-of-way grants, could
therefore result in delays, penalties, or defaults under such PPAs and materially reduce our expected backlog
realization.
Any such loss or curtailment of our rights to use the land on which its projects are or will be located as a result
of any lienholders or leaseholders that have rights that are superior to our rights or the BLM’s suspension of its
federal rights-of-way grants could have a material adverse effect on our business, financial condition, results of
operations and ability to grow its business and make cash distributions to its unitholders. In certain instances, rights-
of-way may be subordinate to the rights of government agencies, which could result in costs or interruptions to our
service. Restrictions on our ability to use rights-of-way could have a material adverse effect on our business,
financial condition, results of operations and ability to grow our business and make cash distributions to unitholders.
Our ability to secure additional geothermal lease rights at reasonable cost is uncertain and could constrain our
growth and increase our development costs.
As of December 31, 2025, we held approximately 595,900 acres of geothermal leasehold interests across seven
jurisdictions, including California, Colorado, Idaho, Nevada, New Mexico, Utah and Washington, consisting of
approximately 65.6% federal leases and approximately 34.4% state or private leases, and a majority of our leases
have a 10-year initial term, and in most cases, extension options. Our growth strategy depends on our ability to add
to this lease position on acceptable terms. Geothermal lease auctions and negotiated lease processes are becoming
more competitive as interest in geothermal development increases among incumbent energy companies, independent
developers, and financial investors. We may be out-competed by better-capitalized counterparties—including large
integrated energy companies and “super majors” that can bid more aggressively, accept more burdensome terms, or
move more quickly in lease processes. Greater competition for attractive acreage could result in higher bonus bids,
rentals, royalties, work commitments, or other burdensome lease terms, as well as longer lead times to secure rights.
As a result, we may be unable to secure prospective acreage in our target areas, or may be forced to accept higher-
cost or less favorable terms than those assumed in our business plan. Moreover, we assembled our current position at
56
a weighted average of approximately $4 per acre during a period of minimal competition between 2019 and 2021, in
sharp contrast to current U.S. Bureau of Land Management lease sales in Utah and Nevada, where maximum bids
reached $344 and $410 per acre, respectively, in 2025. There is no assurance that we will be able to obtain
additional lease rights in the locations, quantities, timing, or at the cost we anticipate, or at all. If we are unable to
expand or maintain our lease position at competitive prices, our project pipeline, drilling schedule, and long-term
growth plans could be delayed, downsized, or otherwise adversely affected, and our capital intensity and unit costs
could increase materially.
Access to geothermal lease opportunities also varies by jurisdiction. Federal, state, and local frameworks for
geothermal leasing are not uniform, and not all U.S. states actively administer geothermal lease programs or conduct
regular lease sales. In some jurisdictions, enabling statutes, implementing regulations, environmental review
timelines, or administrative capacity remain nascent or subject to change, and the timing, frequency, and terms of
lease offerings are uncertain. In addition, evolving policy priorities, land-use constraints, and competing resource
uses can limit the availability of prospective acreage or impose restrictions that diminish the value of leaseholds.
Any reduction in the availability of lease opportunities, or any tightening of lease terms or approval requirements,
could reduce our ability to assemble contiguous positions, increase our costs and timelines, and impair our ability to
develop projects at the scale and pace contemplated by our business plan.
Our exploration, development, and operation of geothermal energy resources are subject to geological risks and
uncertainties, which may result in decreased performance or increased costs for our power plants.
Our primary business involves the exploration, development, and operation of geothermal energy resources
within large, contiguous hubs we refer to as GeoClusters, where we deploy modular 50-megawatt GeoBlocks using
binary, air‑cooled ORC technology. These activities are subject to uncertainties that, in certain respects, are similar
to those typically associated with oil and gas exploration, development, and exploitation, including uncertainty and
heterogeneity in reservoir properties such as pressure, temperature, permeability, porosity, lithology, stress, fluid
saturation, fluid chemistry, and reservoir quality in general. Any of these uncertainties may increase our capital
expenditures and our operating costs or reduce the efficiency of our power plants over time. We may not find
resources capable of supporting a commercially viable power plant at exploration sites where we have conducted
tests, acquired land rights, and drilled test wells, which would adversely affect our development of geothermal
power plants.
Further, while Project Red has produced consistent, stable temperature output and has not exhibited the type of
thermal decline observed at many conventional geothermal projects, geothermal resources are complex geological
structures and their geographic extent and sustainable output can only be estimated. Our geothermal energy power
plants may suffer an unexpected decline in the capacity of their respective geothermal wells and are exposed to a
risk of geothermal resources not being sufficient for sustained generation of the electrical power capacity desired
over time. If well performance degradation occurs due to any of (or a combination of) premature thermal decline,
production rate decline, changes in injectivity or variations in productivity, and we are unable to efficiently stimulate
the thermal resource to offset such declines, we may be forced to write down the value of affected assets, incur
impairment charges, or invest significant additional capital to restore or maintain output, including redesigning
engineered reservoirs or drilling additional laterals to meet standardized GeoBlock requirements. This could lead to
reduced revenues, increased operating costs, and diminished returns on investment, adversely affecting our business,
financial condition, and results of operations. Furthermore, the perception of geothermal resource instability could
impact our ability to secure project finance and binding offtake with investment‑grade counterparties, as
stakeholders may view our projects as riskier than those of competitors with more stable resources.
Another aspect of geothermal operations is the management and stabilization of subsurface impacts, including
ground subsidence or inflation, related to reservoir creation and injection. Inflation and subsidence, if not controlled,
can adversely affect agricultural operations and infrastructure at or near the land surface, prompt new permit
conditions or setback requirements, result in curtailments that impair our ability to perform under affected PPAs, and
increase potential exposure to third‑party claims. We employ high‑fidelity monitoring—including permanent fiber
optics and advanced computational modeling to optimize well placement, stimulation programs, and thermal
drawdown management across standardized GeoBlocks. Despite these measures, the inherent uncertainty of
engineered reservoir performance remains a material risk to sustained output at targeted nameplate capacities.
57
Our estimates of capacity potential and underlying estimates of HIIP are inherently uncertain, do not consider
technological, commercial or economic viability, and should not be viewed as a measure of estimated future
production or generation capacity.
We present in this prospectus certain estimates of the capacity potential (represented as megawatts or gigawatts)
of our GeoClusters. These estimates are based on the underlying geothermal resource potential at our GeoClusters,
as represented by a measure of thermal energy we refer to as HIIP, the estimated electrical power capacity into
which such HIIP may be converted, and the thermal recovery factor of this thermal energy. HIIP is the total thermal
energy estimated to be contained in place within the rock and pore fluid in a defined subsurface volume as of a given
date, before accounting for any recovery of heat to the wellhead or conversion to electricity. To produce our
estimates of capacity potential, a thermal recovery factor is applied to the HIIP estimates.
For Cape Station, D&M, an independent engineering consulting firm, independently prepared HIIP estimates
using geologic, thermal, and geomechanical models and probabilistic methods, as described further in its report
dated June 30, 2024 thereon included as an exhibit to the registration statement of which this prospectus forms a
part. To produce our estimate of capacity potential, we further adjust the HIIP estimates by applying a thermal
recovery factor. For the nine GeoClusters reviewed by D&M subsequent to Cape Station, which includes: Blanford,
Corsac, Marble, Kit, Star, Fennec, Cross, Swift and Aspen, D&M utilizes their own thermal recovery factors, which
are factored into their estimates of capacity potential.
However, these estimates are inherently uncertain and subject to significant limitations, including the following:
•The HIIP estimates produced by D&M for Cape Station does not incorporate recovery factors. Thermal
energy in place does not indicate how much heat can be transferred to fluid through heat exchange or
produced at the wellhead, and therefore does not indicate how much of such heat at the wellhead can
ultimately be converted into electricity. Recovery depends on reservoir connectivity, stimulation
effectiveness, pressure and temperature drawdown, flow performance, induced seismicity constraints, and
well and surface facility design, among other factors, each of which is subject to risks. To produce our
estimates for capacity potential at Cape Station, we rely on our own estimates for thermal recovery factors
in order to further adjust D&M’s HIIP and Electric Power Capacity estimates. While D&M has
incorporated their own estimates of thermal recovery factor for other GeoClusters reviewed, given the
limited deployment to date, thermal recovery factors for EGS are inherently uncertain and can range
substantially.
•The HIIP estimates produced by D&M does not reflect economic feasibility. These estimates measure
thermal energy contained within a rock, rather than thermal energy that can be economically produced
therefrom, and accordingly do not include drilling and completion costs, electricity prices, parasitic loads,
transmission losses, offtake terms and demand, permitting timelines, interconnection constraints, supply
chain availability, or financing requirements. Quantities that are technically recoverable absent such
limitations, and therefore are included in our resource estimates, may not in practice be economic to
develop.
•The HIIP estimates produced by D&M should not be treated as equivalent or analogous to those quantities
that are associated with “Reserves” (as defined pursuant to the rules and regulations of the SEC) due to the
additional risks involved. The quantities of heat that might actually be recovered, and the quantities of
associated produced electricity should such geothermal resources be developed, may differ significantly
from the HIIP estimates produced by D&M.
•D&M’s illustrative conversions to potential electric power capacity associated with HIIP are not forecasts.
The illustrative estimates of potential electric power capacity into which our HIIP can be converted rely on
assumptions regarding Organic Rankine Cycle turbine efficiency, parasitic loads, and a peak output
correction factor derived from guaranteed manufacturer specifications, an assumed 30-year project life, and
an assumed capacity factor. These illustrative conversions are not forecasts of future production and do not
incorporate estimates of project economics.
58
•Model assumptions and data limitations may prove inaccurate. The models underlying our resource
estimates depend on temperature profiles, geological data, and geomechanical interpretations, and were
prepared using data provided by us that were not independently verified by D&M. At increased depths, the
uncertainty in such models continues to increase, and future drilling, testing, or monitoring could reveal
materially different subsurface conditions than those included in our models.
Accordingly, investors should not place undue reliance on any estimates of our geothermal resource or assume
that any portion of HIIP will be produced or converted to electricity on an economic basis or within any particular
timeframe. If the quantities or economics ultimately differ from those implied by our resource estimates, our
business, financial condition, results of operations, and prospects could be materially and adversely affected.
Illustrative estimates of earnings before interest, taxes, depreciation and amortization and illustrative estimates of
capital required per megawatt for EGS projects included herein are not forecasts, targets or guidance, and actual
results could vary materially.
The illustrative industry level estimates of earnings before interest, taxes, depreciation and amortization and
illustrative capital required per megawatt for EGS projects included herein are not forecasts, targets or guidance.
These estimates are based on internal estimates, and are simplified, scenario-based outputs based on data available
as of December 31, 2025. For example, of a given PPA, operations and maintenance costs may not be reflective of
our operations or the operations of other comparable operators of geothermal projects, and the ability to monetize
geothermal tax credits assumes the continued existence of such tax credits and an efficient market for such sales.
Further, actual earnings before interest, taxes, depreciation and amortization per megawatt for EGS projects will
differ depending on project and market specific factors, such as resource quality, development and operating costs,
actual capacity factor, power prices and offtake terms, and may cause results to vary materially from such estimates.
Actual capital expenditures per megawatt for EGS projects will differ depending on project‑ and market‑specific
factors, such as subsurface conditions and resource quality including target depth and temperature, drilling and
completion requirements, reservoir stimulation scope, well count, surface plant design and equipment costs,
interconnection and transmission upgrades, supply chain and labor pricing, permitting and site infrastructure needs,
and contingency and owner’s costs, and may cause results to vary materially from such estimates.
Additionally, the illustrative estimates presented herein are not specific to us or our technology but are general,
industry level estimates of EGS project economics. While we believe such estimates of EGS project economics to be
reasonable and are generally consistent with our understanding of EGS technology, there can be no assurance that
the performance or economics of our EGS projects will meet such estimates, and our actual results could differ
materially. Therefore, you are encouraged not to place undue weight on such illustrative estimates, and the inclusion
of such information should not be regarded as a forecast, target, guidance or a representation by us that the results
reflected in such estimates will be achieved.
Our strategy involves drilling using existing oil and gas technologies, such as multistage hydraulic stimulation
and horizontal drilling techniques, in new geothermal applications aided by fiber optic data acquisition, which
involve risks and uncertainties in their deployment.
Our operations involve utilizing established oil and gas technologies in novel geothermal applications as well as
new technologies developed by us. While we have achieved commercial pilot milestones, we are still in the
construction phase for additional projects and therefore are subject to risks associated with using multistage
hydraulic stimulation and horizontal drilling techniques in new applications. The success of these techniques can
only be evaluated over time and at scale as more wells are drilled and production profiles are established over a
sufficiently long time period. If our production results are less than anticipated or we are unable to execute our well
projects because of capital constraints, regulatory limitations and/or declines in electricity prices or demand, the
return on our investment in these areas may not be as attractive as we anticipate.
Inflation and rising costs could adversely affect our business and may impact us differently than other clean-
energy providers.
Inflation has recently reached its highest levels in decades and has contributed to higher interest rates and
capital costs, increased shipping and logistics expenses, elevated costs for raw materials, supply shortages, and
59
rising labor costs. These conditions have affected, and may continue to affect, the broader technology and energy
transition industry, including other renewable power sources such as solar and wind. However, the relative impact of
inflation is not uniform across the industry. For EGS, the magnitude and timing of inflationary effects can depend on
factors such as material intensity and technology design, the structure and terms of supply and services agreements,
project management and execution, and the availability of specialized vendors and equipment.
Our development and operations require specialized drilling services, well construction materials, and ORC
equipment. Availability and pricing for these inputs may be constrained by broader power sector demand and
capacity limits in oilfield and industrial supply chains, which can exacerbate price volatility and delivery schedules
for rigs, tubulars, cement, drilling fluids, heat‑exchange equipment, and related components. These dynamics could
reduce the competitiveness of our EGS technology and impair our ability to construct and operate wellfields, power
plants, and other facilities on anticipated timelines and budgets. In addition, higher interest rates and capital costs
associated with inflation could increase our financing expenses on current and future projects. Any of these factors,
individually or in combination, could have a material adverse effect on our business, financial condition, and results
of operations.
Our business involves significant risks and uncertainties that may not be covered by insurance.
A significant portion of our business relates to designing, developing and manufacturing advanced geothermal
technology products and services. New technologies may be untested or unproven and the failure of our products
and services could result in extensive damage. Accordingly, we may incur liabilities that are unique to our products
and services.
The amount of insurance coverage that we maintain may not be adequate to cover all claims or liabilities.
Existing coverage may be canceled while we remain exposed to the risk and it is not possible to obtain insurance to
protect against all operational risks, natural hazards and liabilities. If a significant accident or event occurs that is not
fully insured, if we fail to recover all anticipated insurance proceeds for significant accidents or events for which we
are insured, or if we fail to replace or repair products or services damaged by such accidents or events, our
operations and financial condition could be harmed.
We have historically insured against liability to third parties from EGS activities as required by law to the extent
that insurance was available on acceptable premiums and terms. However, the insurance coverage for third-party
damages may not be sufficient to cover the liability. Moreover, we do not purchase control‑of‑well insurance and
our insurance program does not cover many subsurface risks inherent in our operations. As a result, first‑party losses
arising from subsurface events, such as loss of well, blowouts, uncontrolled flows, kicks, formation or reservoir
damage, subsurface property damage, and related well control and remediation costs may be uninsured or
underinsured. Any such uninsured or underinsured losses could require us to fund significant costs directly, which
could adversely affect our business, results of operations, and financial condition.
The price and availability of insurance fluctuate significantly. Insurance market conditions or factors outside our
control, such as failure of our infrastructure technology, could cause premiums to be significantly higher than
current estimates and could reduce amounts of available coverage. The cost of our insurance has been increasing and
may continue to increase. Higher premiums on insurance policies will reduce our operating income by the amount of
such increased premiums. If the terms of insurance policies become less favorable than those currently available,
there may be limits on the amount of coverage that we can obtain, or we may not be able to obtain insurance at all.
Moreover, even where coverage is available, exclusions and sublimits (particularly with respect to subsurface risks)
may materially limit recoveries.
In addition, although we carry business interruption insurance policies, any business interruption losses could
exceed the coverage available or be excluded from our insurance policies. For example, interruptions caused by
subsurface incidents and well control events may not be covered. Any disruption of our ability to operate our
business could result in a material decrease in our revenues or significant additional costs to replace, repair, control
or insure our assets, which could have a material adverse impact on our financial condition and results of operations.
60
Our operations could be adversely impacted by climate change and severe weather.
We are susceptible to losses and interruptions caused by extreme weather conditions such as droughts,
earthquakes, hurricanes, tsunamis, floods, blizzards, wildfires, and water or other natural resource shortages,
occurrences of which may increase in frequency and severity as a result of climate change. Given our geographic
concentration, an extreme weather event in the region in which we operate could cause significant disruptions to our
operations. Climate change may also produce general changes in weather or other environmental conditions,
including temperature or precipitation levels, and thus may impact consumer demand for electricity. Daily and
seasonal fluctuations in temperature generally have a more significant impact on the generating capacity of EGS
power plants than conventional power plants. Power plants may experience reduced generation in warm periods due
to the lower heat differential between geothermal fluid and the ambient surroundings. While we generally account
for the projected impact seasonal fluctuations in temperature may have based on historic experience, the impact of
climate change on traditional weather patterns has become more pronounced. This has reduced the certainty of our
modelling efforts. To the extent weather conditions continue to be impacted by climate change, the generation
capacity of certain facilities may be adversely impacted in a manner that we could not predict which may in turn
adversely impact our results of operations. In addition, the potential physical effects of climate change, such as
increased frequency and severity of storms, floods, and other climatic events, could disrupt our operations and cause
us to incur significant costs to prepare for or respond to these effects. If we experience physical damage to our
equipment and infrastructure due to climate-related natural disasters, it could lead to the suspension of our
operations, additional costs to restore service and repair facilities, and delays in power generation resulting in lost
revenue and potential exposure to legal claims. Such events could also impact our ability to obtain insurance
coverage and we may experience rising costs of insurance coverage resulting from any damages to our assets, which
could have an impact on our profitability.
Climate change could also affect the availability of secure and economical supply of water, which is essential
for our ability to secure new water well permits and continue drilling, especially in western states where we have
seen severe drought and increased prices for industrial water.
Threats of terrorism, including cyberterrorism, or military campaigns may adversely impact our business.
Our operations and facilities, in particular, our generation facilities, information technology systems and other
infrastructure facilities, systems and physical assets that we acquire, construct or develop, as well as those of third
parties on which we rely, may be targets of terrorist acts and threats, as well as events occurring in response to or in
connection with them, that could cause environmental repercussions, result in full or partial disruption of our
operations. A terrorism incident, including cyberterrorism, may also result in temporary or permanent closure of any
of our projects, which could increase our costs and decrease our cash flows. These operations and facilities are also
subject to natural disasters, public health crises, fire, power loss and telecommunication failures.
Any of our assets or those of third-party vendors could be directly or indirectly affected by such events or
activities. Any such terrorist acts, environmental repercussions or disruptions or natural disasters could result in a
significant decrease in revenues or significant reconstruction or remediation costs, which could have a material
adverse effect on the business, financial condition, results of operations and cash flows.
The existence of a prolonged force majeure event or a forced outage affecting the wellfield, a power plant, or the
transmission systems could reduce our net income and materially and adversely affect our business, financial
condition, future results, and cash flow.
The operation of our geothermal power plants is subject to a variety of risks, including events such as fires,
explosions, earthquakes, floods, severe storms, or other similar events. If a power plant experiences an occurrence
resulting in a force majeure event, although our subsidiary that owns that power plant would be excused from its
obligations under the relevant PPA, the relevant power purchaser may not be required to make any capacity and/or
energy payments with respect to the affected power plant for as long as the force majeure event continues and,
pursuant to certain of our PPAs, will have the right to prematurely terminate the PPA assuming the relevant force
majeure event continues for an extended period of time.
61
Additionally, to the extent that a forced outage has occurred, and if as a result the power plant fails to attain
certain performance requirements under certain of our PPAs, the power purchaser may have the right to permanently
reduce the contract capacity (and correspondingly, the amount of capacity payments due pursuant to such
agreements in the future), seek refunds of certain past capacity payments, and/or prematurely terminate the PPA. As
a consequence, we may not receive the full value of anticipated net revenues from the affected power plant other
than, in the case of a PPA that has been prematurely terminated, the proceeds from any business interruption
insurance that applies to the force majeure event or forced outage after the relevant waiting period and may incur
significant liabilities in respect of past amounts required to be refunded.
Any future widespread public health crises, similar to COVID-19, could negatively affect various aspects of our
business, make it more difficult for us to meet our obligations to our customers, and result in reduced demand for
our products and services.
In an effort to halt the outbreak of COVID-19, a number of countries, including the United States, previously
placed significant restrictions on travel, many businesses announced extended closures, and many businesses and
governmental agencies allowed employees to work remotely, which in some cases may reduce the effectiveness of
those employees. If there is a resurgence in COVID-19 cases or a similar health crisis, travel restrictions and
business closures may, in the future, adversely affect our operations locally and worldwide, including our ability to
obtain regulatory approvals and to manufacture, market, sell or distribute our products, which could materially and
adversely affect our business.
Nearshoring supply chain operations may not yield anticipated benefits and could introduce new risks.
To enhance supply chain resilience and reduce exposure to global disruptions, we are exploring nearshoring
options to bring certain operations and suppliers closer to the U.S. While nearshoring has the potential to improve
logistics, reduce lead times, and increase supply chain transparency, it also involves significant investment,
operational complexity, and potential increases in labor and regulatory costs. Establishing new supply chain
networks and facilities requires careful planning, coordination with local authorities, and adaptation to regional
market conditions, all of which can introduce unforeseen challenges and expenses.
There is no assurance that nearshoring will result in the efficiencies or cost savings we anticipate, and the
transition process itself may disrupt existing operations or delay project timelines. Additionally, regional economic
conditions, labor market dynamics, and regulatory environments could impact the feasibility and success of these
initiatives, potentially leading to higher costs or reduced flexibility. If our nearshoring efforts fail to deliver the
expected benefits, we may face increased operational risks, diminished competitiveness, and challenges in meeting
customer and stakeholder expectations.
Operational risks could disrupt our energy production and increase costs.
Operating geothermal plants involves various risks, including equipment failures, unexpected downtime, and
safety incidents. Disruptions in plant operations can lead to reduced energy output, increased maintenance costs, and
reputational damage. Equipment failures may result from wear and tear, manufacturing defects, or inadequate
maintenance, while safety incidents could arise from human error, natural disasters, or unforeseen technical issues.
We have never operated a power plant, including a geothermal facility, which heightens these risks by increasing the
potential for operational missteps, extended ramp-up periods, and a greater reliance on third-party expertise or newly
developed internal capabilities.
We implement rigorous maintenance programs, safety protocols, and risk management strategies to minimize
operational risks and ensure the reliability of our energy production. However, unforeseen issues can still arise,
impacting our operational efficiency and financial results. Our lack of prior operating experience may also limit the
effectiveness of these programs during initial operations and could delay our ability to identify and remediate issues.
Effective contingency planning and rapid response capabilities are essential to mitigating the impact of operational
disruptions and maintaining stakeholder confidence in our ability to deliver reliable energy solutions.
62
Sustainability concerns, community expectations, and opposition could result in increased costs, risks and project
delays.
Geothermal projects can have adverse environmental impacts, including land use changes, impacts to surface
water or groundwater resources, temporary emissions of greenhouse gases (“GHG”) or other air pollutants from
diesel generators, among others. These impacts may attract public opposition, regulatory scrutiny, or legal
challenges, potentially delaying or preventing project development. Environmental advocacy groups, local
communities, and other stakeholders may raise concerns about the potential effects of our operations on natural
resources or other environmental receptors, which could lead to increased compliance costs and project
modifications.
Failure to adequately address environmental concerns could result in reputational damage, legal liabilities, or
the imposition of additional regulatory requirements. While we seek to minimize the potential adverse
environmental impacts of our operations, the potential for environmental challenges remains a material risk to our
business, as negative publicity or regulatory actions could impact our ability to secure permits, attract investment,
and maintain positive relationships with stakeholders. Even with practices such as reinjection of geothermal brine
and use of air-cooled ORC systems to reduce water usage, our projects remain subject to evolving environmental
standards and community expectations.
In recent years, attention has been given to corporate activities related to sustainability matters. In particular,
members of the investment community have begun to screen companies for sustainability performance, including
practices related to GHG emissions and climate change, and through the use of “ESG ratings” (referring to
environmental, social, and governance matters), before investing in certain companies. In addition, members of the
investment community and other parties have initiated “greenwashing” litigation alleging certain companies’ claims
about the environmental benefits of their operations, products or practices are false or misleading. As a result, we
could experience additional costs or financial penalties, litigation risks, delayed projects, and/or reduced demand for
our products and services, which could have a material adverse effect on our earnings, cash flows, and financial
condition. If we do not adapt to or comply with expectations and standards on sustainability matters, or if we are
perceived to have not responded appropriately to the growing concern for sustainability issues (especially from our
stakeholders), regardless of whether there is a legal requirement to do so, we may suffer from reputational damage,
and our business and financial condition could be materially and adversely affected.
Risks Related to Our Industry
Expectations regarding load growth may not materialize, and our business prospects could be harmed if
geothermal energy is not widely adopted or sufficient demand for geothermal systems does not develop or takes
longer to develop than we anticipate.
Our growth and success are dependent on continued expansion of electricity demand driven by the rapid
increase in artificial intelligence data center development, which has contributed to record increases in electrification
and power consumption and substantial new market opportunities for energy suppliers. As hyperscale data centers
seek gigawatt-level connections to power their AI workloads, utilities and generators have seen unprecedented
requests for electricity supply, sometimes equating to the needs of entire cities. The Pew Research Center reports
U.S. data centers accounted for over 4% of national electricity use in 2024, with forecasts projecting demand
doubling or tripling by the end of the decade as AI models grow in size and complexity. The heightened demand for
reliable, large-scale generation has allowed us to pursue long-term contracts and investments in generation and
transmission infrastructure to support the evolving needs of technology customers.
However, there is no assurance that these forecasts of load growth will be accurate or that the anticipated load
growth will occur as projected. Factors such as evolving technology, improvements in energy efficiency, changes in
economic conditions, shifts in government policy or regulation, and project delays or cancellations by significant
expected offtakers (including data center facilities) could reduce or slow demand for electricity relative to current
expectations. If the anticipated load growth fails to materialize, it could have a material adverse effect on our
business, financial condition, and results of operations. Reduced need for behind-the-meter power, delayed or
cancelled data center builds or increased baseload power on the grid could lead to fewer PPAs with creditworthy
63
offtakers, lower revenue and diminished growth prospects, materially harming our financial condition and operating
results.
Further, the geothermal energy market in the United States is at a relatively early stage, and the EGS market is
nascent. Although we believe our EGS approach—organized into multi‑gigawatt GeoClusters and standardized 50-
megawatt GeoBlocks—meets buyer priorities of reliability, near‑term deliverability, and cost‑competitiveness,
demand may not develop as anticipated.
Many factors may affect demand for geothermal energy systems, including the availability of federal incentives
and state policies (such as the NEPA) categorical exclusions for certain geothermal confirmations and renewable
portfolio standard procurement, interconnection and transmission access, natural gas and other commodity prices,
relative project costs (including high‑spec drilling services and ORC equipment), the success of other renewable
technologies, and the availability of customer financing.
Our ability to maintain contracted output depends on sustaining adequate geothermal heat supply from our wells;
if we cannot, our plants may underperform and our contractual obligations may be at risk.
Unlike conventional generators that procure external fuel, our “fuel” is the heat extracted from reservoirs where
permeability has been enhanced through stimulation. If reservoir performance does not meet expectations or
declines faster than anticipated, whether due to subsurface heterogeneity, thermal drawdown, hydraulic connectivity,
mineral scaling, or operational imbalances; available heat may be insufficient to support targeted output or
availability. In such cases, we may be required to incur additional capital to drill new wells or laterals, remediate
wells, or modify plant operations, and we could be unable to meet fixed minimum performance or availability
standards under certain PPAs. Any resulting shortfalls, damages, capacity de‑rates, or termination rights could
materially and adversely affect our business, financial condition, results of operations and cash flows. As of
December 31, 2025, we had contractual commitments of $528.8 million, all of which relate to our Cape Station
Phase I and Cape Station Phase II facilities.
Successful commercialization of new, or further enhancements to existing, alternative carbon‑free energy
generation technologies may prove to be more cost‑effective or appealing to the global energy markets and
therefore may adversely affect the market demand for our energy.
The expected market for our power plants may be superseded or rendered obsolete by new technology or the
novel application of existing technology, including expanded nuclear (both conventional and small modular reactors
“SMRs”), increasingly paired solar/wind plus long‑duration storage, hydroelectric generation or gas generation with
carbon capture. Our estimates for total addressable market and unit economics reflect current market conditions
characterized by rising grid demand from hyperscale data centers and utilities, capacity shortfalls, and procurement
preferences for clean, firm power.
However, our assumptions and the data underlying our estimates may not be correct and the conditions
supporting our assumptions or estimates may change at any time, reducing the predictive accuracy of these
underlying factors. As a result, our performance as indicated by the illustrative unit economics provided in this
prospectus, our estimates of the addressable market for our product and services, as well as the expected growth rate
for such market, may prove to be incorrect. Any material change to our assumptions or expectations with respect to
the foregoing may have a material adverse effect on our business prospects, financial condition, results of operations
and cash flows and could harm our reputation.
In addition, changes in macroeconomic conditions, rising interest rates, or shifts in buyer preferences (including
hyperscalers’ evolving siting and energy strategies, or preference for behind‑the‑meter solutions) could delay offtake
decisions and reduce demand for our power.
Energy prices are inherently volatile, and fluctuations can significantly impact the electricity prices we are able to
secure in future PPAs.
Energy prices are subject to a multitude of factors that contribute to their inherent volatility. Geopolitical events,
supply‑demand imbalances, policy shifts, and technology cost curves can influence energy markets. During periods
64
of elevated wholesale prices, we may secure attractive PPA pricing and terms; however, when prices decline or
competition intensifies, negotiating advantageous PPAs can become more challenging. This volatility complicates
financial forecasting and capital planning for standardized GeoBlocks across our GeoClusters and could reduce
revenue visibility. In addition, if energy buyers prioritize lowest‑cost intermittent options or defer procurement due
to market uncertainty, our ability to execute programmatic offtake could be impacted.
During periods of high energy prices, we may benefit from favorable PPA terms, allowing us to secure higher
electricity prices and enhance profitability. However, when energy prices decline, negotiating advantageous PPAs
becomes challenging, potentially leading to reduced revenue and financial strain. The unpredictability of energy
prices complicates financial forecasting and strategic planning, as companies must account for potential price
fluctuations in our projections. Additionally, the competitive landscape for PPAs may intensify during periods of
price volatility, as energy buyers seek to lock in favorable terms amidst uncertain market conditions.
The impact of energy price volatility extends beyond immediate financial considerations and can influence
investment decisions. This uncertainty can hinder growth and innovation within our business, affecting our ability to
compete with other renewable energy sources. Furthermore, fluctuating energy prices can affect stakeholder
confidence, including investors, lenders, and partners, who may perceive increased risk in the company’s operations
and financial outlook. As a result, effectively managing energy price volatility and its implications for PPAs is
crucial for maintaining financial health and achieving long-term strategic objectives.
Claims that some geothermal power plants cause increased risk of induced seismicity could impact our operating
procedures and increase our operating costs, or delay or increase the cost of further development.
Our wellfields and operations may be subject to frequent low‑level seismic disturbances, natural or induced.
Serious seismic disturbances are possible, including earthquakes, volcanic eruptions and lava flows, and could result
in damage to equipment or degraded subsurface resources to such an extent that we could not perform under the
PPA for the affected power plant, which in turn could reduce our net income and adversely affect our financial
condition and cash flow. Researchers and regulators have identified a potential link between hydraulic‑stimulation
activities and seismic events, which may lead to heightened scrutiny and potential litigation in certain jurisdictions.
Another aspect of geothermal operations is the management and stabilization of subsurface impacts, including
ground subsidence or inflation, related to reservoir creation and injection. Inflation and subsidence, if not controlled,
can adversely affect agricultural operations and infrastructure at or near the land surface, prompt new permit
conditions or setbacks, result in curtailments that impair our ability to perform under affected PPAs, and increase
potential exposure to third-party claims.
If regulators impose additional restrictions, monitoring, or permitting conditions specific to EGS stimulation
and injection as part of our reservoir creation process, our ability to develop or operate projects could be delayed,
constrained, or made more costly. Public opposition to perceived or real seismic risks could also raise permitting
hurdles and community engagement costs. If we suffer a serious seismic disturbance, our insurance may be
inadequate to cover all losses, and future coverage may be more expensive or unavailable. Further, the potential for
seismic events and subsurface impacts, such as ground subsidence or inflation, associated with our operations may
expose us to litigation, including claims for property damage, personal injury, or nuisance. Even if such claims lack
merit, defending them could be costly and time-consuming. Heightened scrutiny, regulatory changes, or litigation
arising from seismic concerns could materially and adversely affect our operations, reputation, and financial
performance.
If we suffer a serious seismic disturbance due to induced seismicity, our business interruption and property
damage insurance may not be adequate to cover all losses sustained as a result thereof and insurance coverage may
not continue to be available in the future in amounts adequate to insure against such seismic disturbances.
Additionally, any such event could have a material impact on EGS’s reputation and pose a risk to future
developments.
65
Changes in the availability and cost of oil, natural gas, and other forms of energy are subject to volatile market
conditions that could adversely affect our business prospects, financial condition, results of operations, and cash
flows.
Decreases in energy prices or increases in the cost of geothermal energy relative to alternative generation
resources may reduce the attractiveness of our offering. We believe some purchasers currently view our product as
comparatively attractive to new natural gas generation in part due to extended delivery times and other constraints
affecting the manufacture and installation of gas‑fired turbines and balance‑of‑plant equipment. If those
manufacturing constraints ease sooner than anticipated, or if natural gas fuel prices decline or remain depressed,
utilities and data center customers may elect to procure natural gas resources instead of geothermal in the near term.
To the extent such uncertainties cause customers to become more cost‑sensitive or adjust procurement plans away
from geothermal, our business prospects and financial results could be adversely affected.
Recent industry analyses indicate that average lead times for new‑build combined‑cycle gas turbines have
extended to approximately five years or longer. Should these lead times contract toward historical norms, our
relative near‑term competitiveness could be negatively impacted.
More broadly, the market for firm generation is evolving rapidly. If (i) natural gas generator manufacturing
backlogs abate; (ii) new generating capacity powered by fossil fuels enters service faster than expected; (iii)
transmission and interconnection bottlenecks ease for competing resources; (iv) costs for solar, storage, or other
alternatives decline; (v) technological advances, including improvements to batteries, render other energy sources
like solar, nuclear, wind or other alternative energy sources more attractive; or (vi) state or corporate
decarbonization targets are reduced or delayed due to affordability concerns, our customers may favor other
generation sources over geothermal. Any of these developments could reduce demand for our projects, impair our
ability to secure or maintain PPAs on acceptable terms, or otherwise adversely affect our business, financial
condition, and results of operations.
Intense competition from other renewable energy sources could limit our growth and profitability.
The renewable market remains highly competitive, with solar, wind, hydro, and nuclear (including SMRs) in
particular, given its capacity for baseload generation, competing for utility and hyperscaler procurement. Advances
in these technologies, declining costs, or superior access to capital and supply chain could reduce demand for EGS.
To remain competitive, we must continue to improve unit economics through EGS learning curves, deeper and
longer laterals that access higher‑temperature rock, and standardized 50-megawatt ORC deployments with reliable
turbine suppliers. Failure to demonstrate a compelling cost and deliverability profile relative to competing baseload
or hybrid solutions could erode our market position and margins.
Rapid technological change in the energy sector could reduce the competitiveness of geothermal energy.
The sector is characterized by continual innovation in generation, storage, and load management. Advances in
solar, wind, nuclear and long‑duration storage—combined with evolving grid planning paradigms—could reduce the
relative attractiveness of baseload resources. While our design anchors around modular GeoBlocks and standardized
ORC equipment from established manufacturers, we may not be able to maintain a cost or deliverability advantage if
other technologies achieve faster‑than‑expected cost declines, novel financing constructs, or improved grid
integration pathways.
To maintain our competitive edge, we must invest in research and development, adapt to changing market
conditions, and demonstrate the unique value proposition of geothermal energy, such as baseload reliability and low
carbon emissions. However, there is no guarantee that we will be able to keep pace with technological advancements
or differentiate our products and services. Failure to do so could erode our market position, reduce profitability, and
hinder our ability to achieve sustainable growth in an increasingly competitive landscape.
66
Governmental policy shifts favoring alternative baseload technologies or changing procurement mandates could
alter our competitive position.
Policy developments that accelerate nuclear (including SMRs), backstop gas with carbon capture, or otherwise
prioritize non‑geothermal baseload power might reduce the relative attractiveness of EGS to utilities and
hyperscalers, or redirect incentive regimes. Such shifts could impede our ability to scale programmatic offtake for
our operations, adversely impacting our development timelines and long‑term growth trajectory. For example,
changes to procurement mandates, interconnection prioritization, or credit allocation could channel transmission
capacity and public support toward alternative resources. Resulting policy signals may raise our cost of capital,
require re‑pricing or restructuring of pending offtake, and delay sequencing of key operations.
Climate change could impact geothermal resources and our operations.
Changes in climate patterns could affect groundwater levels, temperature, precipitation, permitting related to
water sourcing, and the efficiency of ORC systems due to ambient temperature impacts. Extreme weather events,
which are becoming more frequent and severe as a result of climate change, could damage infrastructure, interrupt
operations, or increase maintenance costs. Climate policies may introduce additional regulatory requirements or
operational constraints. While our air‑cooled ORC design and brine reinjection minimize water usage relative to
water‑cooled systems, climate variability and regulatory changes may still increase compliance and operational
costs, and affect development timelines within our GeoClusters.
Risks Related to Our Financing
We may be unable to obtain the financing we need to pursue our growth strategy and any future financing we
receive may be less favorable to us than our current financing arrangements, either of which may adversely
affect our ability to expand our operations.
Some of our geothermal power plants have been financed using leveraged financing structures, consisting of
non-recourse or limited recourse debt obligations. Each of our projects under development or construction and those
projects and businesses we may seek to acquire or construct will require substantial capital investment, including to
construct and place in service our standardized 50-megawatt ORC GeoBlocks within large GeoClusters such as
Cape Station. Our continued access to capital on acceptable or favorable terms to us is necessary for the success of
our growth strategy, particularly in enhancing our portfolio through M&A activities and executing binding PPAs
with investment-grade utilities and hyperscalers. Our attempts to obtain future financings may not be successful or
on favorable terms.
In recent years, we have also increased our corporate recourse debt at the holding company level due to our
ability to obtain improved economic terms. This additional indebtedness may make it more difficult for us to
refinance or borrow additional funds in the future, limiting our ability to pursue our growth strategy.
Market conditions and other factors may not permit future project and acquisition financings on terms similar to
those we have previously received. Our ability to arrange for financing on a substantially non-recourse or limited
recourse basis, and the costs of such financing, are dependent on numerous factors, including general economic
conditions, conditions in the global capital and credit markets, investor confidence, the continued success of current
power plants, the credit quality of the power plants being financed, the political situation in the country where the
power plant is located, and the continued existence of tax and securities laws which are conducive to raising capital;
while certain federal and state policy tailwinds may support geothermal (e.g., tax credits and streamlined
permitting), such support may not be available or sufficient. Additionally, a high-interest-rate environment can make
borrowing more expensive or limit the availability of financing options, including asset-level capital that we
otherwise expect to access. If we are not able to obtain financing for our power plants on a substantially non-
recourse or limited recourse basis, we may have to finance them using recourse capital such as direct equity
investments or the incurrence of additional debt by us.
Also, in the absence of favorable financing options, we may decide not to build new plants or acquire facilities
from third parties. Any of these alternatives could have a material adverse effect on our growth prospects.
67
We may also need additional financing to implement our strategic plan. For example, our cash flow from
operations and existing liquidity facilities may not be adequate to finance any acquisitions we may want to pursue or
new technologies we may want to develop or acquire. Financing for acquisitions or technology development
activities may not be available on the non-recourse or limited recourse basis we have historically used for our
business, or on other terms we find acceptable. Even where we secure programmatic offtake or multi-year
procurement for ORC equipment and drilling services, we may still be required to provide more corporate support
than anticipated or accept restrictive covenants and security packages.
Our debt obligations may adversely affect our ability to raise additional capital and will be a burden on our future
cash resources, particularly if we elect to settle these obligations in cash upon conversion or upon maturity or
required repurchase.
As of December 31, 2025, we had $145.6 million in aggregate principal amount outstanding under our XRC
Facility and Credit Facility. Subsequently, on March 6, 2026, we closed the approximately $421.4 million Project
Granite Facility, further increasing our debt obligations, and on April 14, 2026, we used the proceeds from the new
Project Granite Facility to repay the XRC Facility. The Project Granite Facility is secured by the project-level assets
and equity interests of the borrower subsidiaries, contains customary covenants and includes customary events of
default, the occurrence of which could result in acceleration of the obligations thereunder or foreclosure on the
pledged collateral. Our ability to meet our payment obligations under our existing financing arrangements depends
on our future cash flow performance. This is subject to general economic, financial, competitive, legislative and
regulatory factors, as well as other factors that may be beyond our control. There can be no assurance that our
business will generate positive cash flow from operations, or that additional capital will be available to us, in an
amount sufficient to enable us to meet our debt payment obligations and to fund other liquidity needs. If we are
unable to generate sufficient cash flow to service our debt obligations, we may need to refinance or restructure our
debt, sell assets, reduce or delay capital investments, or seek to raise additional capital. Our ability to refinance our
indebtedness will depend on the capital markets and our financial condition at such time. We may not be able to
engage in any of these activities or engage in these activities on desirable terms, which could result in a default on
our debt obligations. As a result, we may be more vulnerable to economic downturns, less able to withstand
competitive pressures and less flexible in responding to changing business and economic conditions. In addition,
delays in GeoBlock deployment, interconnection, or permitting within a GeoCluster could affect project-level cash
flows and covenant compliance.
Our power plants have generally been financed through a combination of our corporate funds and limited or
non-recourse project finance debt and lease financing. If our project subsidiaries default on their obligations
under such limited or non-recourse debt or lease financing, we may be required to make certain payments to the
relevant debt holders, and if the collateral supporting such leveraged financing structures is foreclosed upon, we
may lose certain of our power plants.
Our power plants have generally been financed using a combination of our corporate funds and limited or non-
recourse project finance debt or lease financing. Limited recourse project finance debt refers to our additional
agreement, as part of the financing of a power plant, to provide limited financial support for the power plant
subsidiary in the form of limited guarantees, indemnities, capital contributions and agreements to pay certain debt
service deficiencies. Non-recourse project finance debt or lease financing refers to financing arrangements that are
repaid solely from the power plant’s revenues and are secured by the power plant’s physical assets, major contracts,
cash accounts and, in many cases, our ownership interest in the project subsidiary. If our project subsidiaries default
on their obligations under the relevant debt documents, creditors of a limited recourse project financing will have
direct recourse to us, to the extent of our limited recourse obligations, which may require us to use distributions
received by us from other power plants, as well as other sources of cash available to us, in order to satisfy such
obligations. In addition, if our project subsidiaries default on their obligations under the relevant debt documents (or
a default under such debt documents arises as a result of a cross-default to the debt documents of some of our other
power plants) and the creditors foreclose on the relevant collateral, we may lose our ownership interest in the
relevant project subsidiary or our project subsidiary owning the power plant would only retain an interest in the
physical assets, if any, remaining after all debts and obligations were paid in full. While our standardized, modular
GeoBlock approach is intended to support replicable diligence and financing, there is no assurance that lenders will
ascribe the same value to such standardization across projects or through market cycles.
68
In addition to the foregoing, we currently have outstanding indebtedness, and our ability to comply with the
terms of such indebtedness, refinance or repay it at maturity, and raise additional capital when needed depends on a
variety of factors, many of which are outside our control. We are party to both the Project Granite Facility and the
Credit Facility, which include a term loan and a letter of credit facility used to support development and PPA-related
security. The Credit Facility is secured by substantially all assets of our wholly owned subsidiary Fervo HoldCo
LLC, the borrower, and equity interests in certain subsidiaries and contains customary covenants and events of
default that, among other things, restrict additional indebtedness and liens, asset sales, investments, and
distributions. A breach of these covenants or other defaults could result in acceleration and foreclosure on the
pledged collateral, and may also constrain our ability to deploy cash to projects or to fund corporate operations. The
Project Granite Facility also includes customary affirmative and negative covenants, including payment and
covenant events of default. These covenants restrict additional indebtedness and liens, asset sales, investments, and
distributions. Separately, if an event of default occurs, the lender may cease making any further loan advances and/
or declare all outstanding obligations immediately due and payable. We also maintain letters of credit and surety
bonds to support our project obligations; if drawn or called, we are obligated to reimburse the issuing bank or surety
promptly, which could adversely affect our liquidity.
At the project level, we have entered into the Project Granite Facility, a construction to term financing
arrangement for our Cape Station Phase I project that is secured by first-priority liens on project assets and equity
and benefits from a limited parent guaranty for certain tax matters. This facility bears a floating interest rate and is
intended to convert into a term loan upon completion of the project. While the Project Granite Facility is generally
non-recourse to the Company, its successful repayment or refinancing is dependent on project performance, and our
successful execution of the project. If we are unable to satisfy conditions to draw remaining availability or to
refinance at acceptable terms or at all or repay this facility when due, we could be required to contribute additional
equity, limit distributions from the project, or agree to more restrictive terms in a refinancing. Defaults under our
project-level facilities could permit lenders to foreclose on project collateral and/or trigger cross-defaults under other
agreements.
We have entered into agreements related to preferred and junior preferred equity investments by Catalyst and
Centaurus in Cape Station Phase I and are also pursuing further preferred equity and related financing arrangements
at the project level for other future projects, including Cape Station Phase II. We expect Cape Station Phase II to
require approximately $2.2 billion in capital expenditures through 2028, and that we will seek to raise a significant
portion of that amount in the form of project-level debt financing. The availability of project-level financing for
certain of our projects, including Cape Station Phase II, is dependent on our ability to demonstrate firm
deliverability under existing offtake arrangements. To the extent that we are unable to secure sufficient
interconnection capacity, transmission service, or alternative delivery structures (including behind-the-meter
arrangements), lenders and other capital providers may determine that such projects are not financeable on a non-
recourse or limited recourse basis. In particular, if transmission constraints are not resolved or circumvented and we
are unable to demonstrate full deliverability under our PPAs, we may be unable to obtain project finance debt for
such projects In such circumstances, we will be required to delay, downsize or restructure such projects, or to fund a
greater portion of capital expenditures with corporate equity or other higher-cost capital, which will materially
increase our cost of capital and reduce returns. Furthermore, the timing of any alternative delivery or offtake
arrangements, including behind-the-meter structures, may not align with financing or development milestones,
which could delay or impair our ability to obtain project financing. Collectively, our existing corporate and project-
level indebtedness, letters of credit and surety arrangements, and any preferred or junior preferred project financing,
increase our fixed obligations and limit our financial and operational flexibility.
Risks Related to Our Legal and Regulatory Concerns
Our business currently gains advantages from the availability of tax credits and other benefits, tax exemptions
and exclusions, and other financial incentives on the federal, state, and/or local levels. We may be adversely
affected by changes in, and application of these laws or other incentives to us, and the expiration, elimination or
reduction of these benefits could adversely impact our business.
Our business benefits from government policies that promote and support clean energy and enhance the
economic viability of development of clean energy power generation equipment, wellfield assets, and certain other
69
aspects of clean energy production and development. In the United States, various legislation and regulations
designed to support the growth of clean energy have been implemented or proposed, such as tax incentives,
renewable portfolio standards or feed-in-tariffs that support or are designed to support the sale of energy from utility
scale clean energy facilities, including geothermal energy. We rely on these incentives to lower our cost of capital
and to attract investors, all of which enable us to lower the price we charge customers for our EGS service offerings.
As a result of budgetary constraints, political factors or otherwise, governments from time to time may review such
laws and policies and take actions that may not be conducive to clean energy production and development. These
incentives could change at any time, may also expire on a particular date, in some cases end when the allocated
funding is exhausted, or may be reduced, terminated or repealed without notice. The financial value of certain
incentives may also decrease over time. Any reductions or the elimination of governmental incentives or policies
that support clean energy, such as the imposition of additional taxes or other assessments on particular sources of
clean energy, could result in the lack of a satisfactory market for the development and/or financing of our projects,
the need to abandon the development of such projects, a loss of our investments in such projects or reduced project
returns from such projects.
On July 4, 2025, the “One Big Beautiful Bill Act” (“OBBB”) was signed into law. The OBBB substantially
modified the clean-energy credit regime established under the Inflation Reduction Act of 2022 (the “IRA”) by
accelerating the phase-out—or, in some cases, terminating altogether—the investment tax credits (“ITCs”) and
production tax credits (“PTCs”) available to certain renewable energy projects that begin construction after July 4,
2026 or are not placed in service by December 31, 2027. The OBBB also restricts credits for entities linked to
countries deemed adverse to U.S. national security, complicating foreign participation and supply-chain strategies,
heightening uncertainty over eligibility and compliance.
In the United States, the IRA implemented new and enhanced many existing incentives for the development and
production of renewable energy. In particular, the IRA extended the availability of ITCs and PTCs to certain
renewable energy projects. We believe that we may benefit from ITCs and PTCs (including the energy community
and domestic content bonuses available under the ITC and PTC, in certain circumstances) with respect to qualifying
renewable energy projects.
The application of law and guidance regarding ITC and PTC eligibility to the facts of particular renewable
energy projects is subject to a number of uncertainties. The U.S. Internal Revenue Service (“IRS”), Department of
Treasury and Congress may modify existing guidance, regulations or laws with respect to the application of the IRA,
specifically to address amendments made to the ITCs and PTCs under the OBBB. It is possible that future changes
may have a retroactive effect. We may face uncertainties as a result of efforts to pass legislation to repeal,
substantially modify or invalidate some or all of the provisions of the IRA. Additionally, our operations and strategic
plans may have to change if certain provisions of the IRA were to be repealed, modified or invalidated. Furthermore,
there can be no assurance that the IRS will agree with our approach to determining eligibility for ITCs and PTCs in
the event of an audit. Any of the foregoing items could reduce the amount of ITCs or PTCs available to us.
Our business model also benefits from tax exemptions offered at the state and local levels. For example, Utah
has sales and use tax abatements for renewable projects. State and local tax exemptions can have sunset dates,
triggers for loss of the exemption, and can be changed by state legislatures and other regulators, and if clean energy
systems were not exempt from such taxes, the property taxes payable by customers would be higher, which could
offset any potential savings our EGS service offerings could offer.
In general, we benefit from certain state and local tax exemptions that apply in some jurisdictions to the sale and
purchase of equipment, sale of power, or both. These state and local tax exemptions can expire, can be changed by
state legislatures, or their application to us can be challenged by regulators, tax administrators, or court rulings. Any
changes to, or efforts to overturn, federal and state laws, regulations or policies that are supportive of clean energy
generation or that remove costs or other limitations on other types of energy generation that compete with EGS
energy production could materially and adversely affect our business.
70
We rely on government contracts and grants for a portion of our revenue and to partially fund our research and
development activities, and such contracts and grants are subject to a number of uncertainties, challenges, and
risks.
We currently rely on government grants for a portion of our revenue and to partially fund our research and
development activities. For example, we have received a grant from U.S. Department of Energy Geothermal
Technologies Office (the “EGS Demos Grant”), which co-funds commercial‑scale EGS field demonstrations to
validate the technology and derisk deployment toward grid‑scale geothermal power. Changes in government
priorities or government funding reductions or delays could result in discontinuation of funding under, or
termination of, our government grants. Further, the change in U.S. presidential administration could increase this
risk. There can be no assurance that we will continue to receive funding under our government grants in the amounts
that we expect or at all.
In addition to government grants, we benefit from certain government subsidies and economic incentives,
including tax credits, rebates, and other incentives, that support the development and adoption of clean energy
technology. We cannot guarantee that government grants, subsidies, and incentives will be available to us at the
same or comparable levels in the future. Any reduction, elimination, or discriminatory application of these grants,
subsidies, or incentives in the future may require us to seek additional financing, which may not be obtainable on
commercially attractive terms or at all; adversely impact public sector demand for clean energy; and diminish the
competitiveness of the clean energy industry generally or EGS in particular. Any change in our ability to secure
these grants, subsidies, and incentives could have a material adverse effect on our business, prospects, results of
operations, and financial condition.
Reliance on government funding may add uncertainty to our research, development and commercialization
efforts with respect to those projects that are tied to such funding and may impose requirements that limit our
ability to take specified actions, increase the costs of commercialization and production of projects developed
under those programs and subject us to potential financial penalties, which could materially and adversely affect
our business, financial condition, and results of operations.
Certain of our development projects have been funded in part through federal and state grants like the EGS
Demos Grant. In addition to the funding we have received to date, we have applied and intend to continue to apply
for federal and state grants to receive additional funding in the future.
Contracts and grants funded by the U.S. government, state governments and their related agencies include
provisions that reflect the government’s substantial rights and remedies, many of which are not typically found in
commercial contracts, including powers of the government to:
•require repayment of all or a portion of the grant proceeds, in specified cases with interest, in the event we
violate specified covenants pertaining to various matters that include a failure to achieve;
•specify milestones or terms relating to use of grant proceeds, or to comply with specified laws;
•terminate agreements, in whole or in part, for any reason or no reason;
•reduce or modify the government’s obligations under such agreements without the consent of the other
party;
•claim rights, including intellectual property rights, in products and data developed under such agreements;
•audit contract related costs and fees, including allocated indirect costs;
•impose qualifications for the engagement of manufacturers, suppliers, and other contractors as well as other
criteria for reimbursements;
•suspend or debar the grantee from doing future business with the government;
•control and potentially prohibit the export of products;
71
•pursue criminal or civil remedies under the federal False Claims Act, False Statements Act, and similar
remedy provisions specific to government agreements; and
•limit the government’s financial liability to amounts appropriated by the U.S. Congress on a fiscal year
basis, thereby leaving some uncertainty about the future availability of funding for a program even after we
have been funded for an initial period.
In addition to those powers set forth above, the government funding we may receive could also impose
requirements to make payments based upon sales of our products, if any, in the future.
In addition, government grants normally contain additional requirements that may increase our costs of doing
business, reduce our profits, and expose us to liability for failure to comply with these terms and conditions. These
requirements include, for example:
•specialized accounting systems unique to government grants;
•mandatory financial audits and potential liability for price adjustments or recoupment of government funds
after such funds have been spent;
•public disclosures of some contract and grant information, which may enable competitors to gain insights
into our research program; and
•mandatory socioeconomic compliance requirements, including labor standards, nondiscrimination
programs, and environmental compliance requirements.
We have previously been audited in connection with federal grants received and we have been found to have
material weaknesses. If we fail in the future to maintain compliance with any such requirements that may apply to
us, we may be subject to potential liability and to termination of our contracts.
Litigation, legal proceedings, regulatory investigations or other administrative proceedings could expose us to
significant liabilities and reputational damage that could have a material adverse effect on us.
We are involved, in the ordinary course of business, in lawsuits and administrative matters spanning
employment, commercial, and environmental issues, and we may face additional regulatory inquiries as we scale
GeoClusters and deploy modular 50-megawatt GeoBlocks. We are also involved, in the ordinary course of business,
in regulatory investigations and other administrative proceedings, and we are exposed to the risk that we become the
subject of additional regulatory investigations or administrative proceedings. Evaluations of these matters require
judgment and may prove inaccurate; adverse outcomes or settlements could be material. As we expand our EGS
footprint, including at Cape Station, any litigation or investigation could delay development timelines, complicate
permitting, constrain programmatic offtake with investment‑grade buyers, or increase costs, adversely affecting our
business, results of operations, and cash flows.
We evaluate litigation claims and legal proceedings to assess the likelihood of unfavorable outcomes and to
estimate, if possible, the amount of potential losses. Based on these evaluations and estimates, when required by
applicable accounting rules, we establish reserves and disclose the relevant litigation claims or legal proceedings, as
appropriate. These evaluations and estimates are based on the information available to management at the time and
involve a significant amount of judgment. Actual outcomes or losses may differ materially from current evaluations
and estimates. The settlement or resolution of such claims or proceedings may have a material adverse effect on us.
We use appropriate means to contest litigation threatened or filed against us, but the litigation environment poses a
significant business risk.
Tariffs on key equipment or materials used in geothermal development could increase project costs, delay
timelines, and impact our financial performance.
While our current supplier mix and procurement strategy are intended to limit direct exposure to tariffs, we
remain subject to tariff‑related cost and schedule impacts, and changes in trade policy could, in certain scenarios,
materially affect our results. Our projects depend on timely, cost‑effective procurement of specialized inputs,
72
including drilling equipment and tubulars, heat exchangers, transformers, and binary, air‑cooled ORC components.
While our supply chain is intentionally concentrated in U.S.-based providers and manufacturers in key U.S. partner
nations, and our drilling services and rigs are sourced predominantly from established domestic oilfield services
providers, changes in trade policy, including the imposition of new tariffs, modification of existing tariffs, retaliatory
measures, or import restrictions could raise costs, reduce supplier availability, or elongate lead times. Even where
domestic alternatives exist, technical specifications, quality requirements, or long manufacturing cycles may limit
substitution for standardized GeoBlocks.
Residual tariff exposure exists for select long‑lead components and subcomponents, including certain ORC
modules and auxiliaries, air‑cooled condensers, transformers and other grid‑related electrical equipment, specialty
alloys, heat exchangers, and electrical gear that may include imported content. If tariffs or similar trade barriers
materially increase the cost or reduce the availability of these inputs, we could face budget overruns, re‑sequencing
of GeoBlock deliveries within a GeoCluster, renegotiation of supply contracts, and schedule delays that impair
deliverability under PPAs and reduce revenue visibility. Broader or higher tariffs affecting allied‑country suppliers
or critical subcomponents, or the removal of exemptions, could elevate our exposure above current levels.
We mitigate tariff risk through diversified sourcing from allied jurisdictions, multi‑year procurement
frameworks for ORC and balance‑of‑plant equipment, and a modular development approach that provides
scheduling flexibility. Notwithstanding these measures, adverse changes in trade policy or market conditions could
still negatively affect our operating results, cash flows, and overall financial performance.
Our financial performance could be adversely affected by changes in the legal and regulatory environment
affecting our operations.
Our wellfields and power plants are subject to extensive federal, state, and local regulation. Changes in
applicable laws, regulations, or their interpretation—covering areas such as interconnection, environmental
compliance, or tax—could increase compliance costs, require additional capital expenditures, or curtail benefits on
which our standardized deployments rely. We or our power purchasers may be unable to obtain required approvals,
amendments, or renewals on a timely basis. Adverse legal or regulatory changes could reduce revenues at one or
more facilities and negatively affect our business, financial condition, results of operations, and cash flows.
Lengthy and uncertain permitting processes could delay or prevent project development.
Developing geothermal projects requires approvals from federal, state, and local authorities, often with
extensive environmental review and public consultation. Even with recent policy tailwinds—such as continued
federal tax credits for geothermal and certain streamlining measures—permitting timelines remain uncertain and
subject to change. For instance, in Nevada, there is no streamlined permitting regime for obtaining a single
Underground Injection Control (“UIC”) permit for an entire geothermal project. Currently, we require UIC permits
from the Nevada Division of Environmental Protection (“NDEP”) for each well used for underground injection,
which has created an administrative burden. We have submitted applications for, but have not yet been able to
obtain, a UIC permit in Nevada; however, NDEP has granted us a series of temporary 30-day permits for each well
to allow underground injection and re-issued such temporary permits every 30 days. The inability to obtain UIC
permits or temporary 30-day permits to allow for underground injection, and other delays and administrative
burdens could increase costs, affect scheduling for GeoBlock delivery, and disrupt standardized deployment plans at
GeoClusters.
Regulatory changes, heightened environmental scrutiny, or local opposition could further complicate
permitting, potentially resulting in costly modifications or litigation and, in some cases, project cancellations. In
some cases, permitting delays may force us to abandon projects altogether, resulting in sunk costs and lost
opportunities. Our ability to execute our business strategy and achieve our growth objectives depends on our
capacity to navigate these complex regulatory environments and secure timely approvals for our projects.
We could be negatively impacted by uncertain potential regulatory and other responses to climate change.
While our EGS technology provides firm power within a reinjected, closed‑loop brine system and uses
air‑cooled ORC to minimize water use, evolving GHG and climate policies may impose new monitoring, reporting,
73
or operational requirements. Federal and state regimes continue to change, and uncertainty regarding scope, timing,
or implementation could complicate development timelines, increase costs, or shift competitive dynamics with
alternative clean, firm resources such as nuclear (including SMRs) or gas with carbon capture. Such changes could
affect our ability to renew existing PPAs, secure offtake for future GeoBlocks, or maintain margins across
GeoClusters.
The U.S. Environmental Protection Agency (the “EPA”) has adopted rules that, among other things, establish
construction and operating permit reviews for GHG emissions from certain large stationary sources, require the
monitoring and reporting of GHG emissions from certain sources, and implement standards directing the reduction
of methane from certain facilities in the oil and gas sector. Additionally, various states have adopted or are
considering adopting legislation and regulation focused on GHG cap-and-trade programs, carbon taxes, reporting
and tracking programs and emissions limits. Uncertainty associated with these regulations, our inability to meet the
demands of these regulations or our failure to predict accurately the impact of our response to these regulations
could adversely affect our business and prospects.
The reduction, elimination or inability to monetize government incentives could adversely affect our business,
financial condition, future results, and cash flows.
Our development program contemplates the availability of federal and state incentives, including tax credits
applicable to geothermal and supportive policies such as NEPA categorical exclusions for certain geothermal
confirmation activities. If existing incentives are reduced, phased out, or made more restrictive—including through
legislative changes like OBBB accelerating phase‑outs or imposing nationality‑linked eligibility constraints—project
economics for current and future GeoBlocks could deteriorate. Constraints on transferability or pricing of ITCs/
PTCs, changes to renewable portfolio standards, or shifts in treatment of domestic content and energy community
adders could reduce returns, delay construction schedules, or limit access to project‑level capital.
Similarly, any such changes that affect the geothermal energy industry in a manner that is different from other
sources of renewable energy, such as wind or solar, may put us at a competitive disadvantage compared to
businesses engaged in the development, construction and operation of renewable power projects using such other
resources. In addition, although we may have the legal ability to monetize ITCs and PTCs, our ability to do so is
subject to market prices and demand, which may be lower than we anticipate. Any of the foregoing outcomes could
have a material adverse effect on our business, financial condition, future results, and cash flows.
California energy import rule changes could compromise our ability to meet existing contract energy delivery.
A significant majority of our expected revenues are derived from deliveries to California counterparties under
long‑term, binding PPAs, including with an investor‑owned utility and multiple community choice aggregators.
While these agreements generally contemplate compliance with California RPS requirements and CAISO market
protocols, modifications to California import rules (such as changes to transmission scheduling and Available
Import Capability), market participation and tagging requirements, greenhouse‑gas accounting for imports, or RPS/
Portfolio Content Category 1 eligibility could restrict deliverable volumes, increase compliance costs, or impair the
marketability of associated RECs. Certain agreements include change‑in‑law and import‑capacity provisions that
allocate some risks (for example, where a buyer’s failure to secure import capability does not constitute a seller
default), but such provisions may not fully offset the commercial impacts of adverse rule changes. If we are unable
to deliver contracted energy due to such regulatory developments, we could incur contractual penalties, experience
curtailments or forced rescheduling, need to renegotiate terms, face strained counterparty relationships, or encounter
challenges securing future offtake, each of which could adversely affect our revenues and growth plans.
We are subject to extensive regulation by FERC and state utility regulators, and changes in those regimes—or
our failure to comply—could adversely affect our operations, offtake arrangements and revenues.
Our power marketing and transmission-related activities are, or will be, subject to the jurisdiction of the Federal
Energy Regulatory Commission (“FERC”), including with respect to market-based rate authority, affiliate
restrictions, reporting, and compliance obligations. We also may be subject to state utility commission oversight in
connection with interconnection, retail/wholesale market participation, certificate or licensing requirements, and
other state-level rules that affect scheduling, deliverability and cost recovery. These federal and state regulatory
74
frameworks are complex and evolve over time. Any revocation, limitation or delay in obtaining or maintaining
applicable authorities or approvals, or any non-compliance—whether by us or relevant counterparties—could
restrict our ability to sell energy or capacity, affect the terms on which we transact, require changes to our
contractual arrangements, or result in penalties and increased compliance costs. In addition, changes to FERC rules,
regional market designs, transmission tariffs, or state commission policies could affect the value, deliverability, or
scheduling of our projects, the marketability of RECs associated with our output, or our ability to meet obligations
under our PPAs. Any of the foregoing could have a material adverse effect on our business, financial condition,
results of operations and cash flows.
We are subject to extensive regulation by NERC standards, and non-compliance or changes in these standards
could materially and adversely affect our business and operations.
The North American Electric Reliability Corporation (“NERC”), under the direction of the FERC, has
implemented mandatory NERC Operations and Planning and Critical Infrastructure Protection standards to ensure
the reliability of the North American Bulk Electric System, which encompasses electric transmission and generation
systems to prevent major system blackouts. NERC Critical Infrastructure Protection standards establish
cybersecurity and physical security protections for critical systems and facilities. We have been, and will continue to
be, periodically audited by NERC for compliance with both Operations and Planning and Critical Infrastructure
Protection standards and are subject to penalties for non-compliance with applicable NERC standards. Failure to
comply with these standards could result in penalties or increased costs to bring such facilities into compliance,
which could materially adversely impact our business, results of operations, and cash flows. Additionally, adverse
audit findings and/or penalties for non-compliance could pose reputational risks to us that could adversely affect our
business.
U.S. federal and state income tax law changes could adversely affect us.
Our financial performance may be affected by tax law changes that alter credit monetization, depreciation
regimes, loss utilization, or cross‑border tax rules that intersect with our supply chain. Uncertainty around future
statutory changes or guidance can complicate capital formation for standardized GeoBlocks, reduce after‑tax returns,
and affect the timing and structure of our project financings.
The cost of compliance with environmental laws and our ability to obtain and maintain environmental permits
and governmental approvals required for operations may result in liabilities, costs, and delays that could
materially and adversely affect our business.
Our operations are subject to extensive environmental laws, ordinances and regulations, which may cause us to
incur significant costs and liabilities. These laws, ordinances and regulations are subject to change and such change
could result in increased compliance costs, the need for additional capital expenditures, or otherwise adversely affect
us. Our power plants are required to comply with numerous federal, state, and local laws and regulatory
environmental standards and must obtain, maintain, and periodically renew numerous permits and approvals, some
with conditions tied to emissions, discharges, or operational restrictions. Heightened scrutiny, third‑party challenges,
or evolving standards could necessitate costly modifications or cause delays that disrupt GeoBlock sequencing
within a GeoCluster. We may not be able to maintain, obtain or renew all environmental permits and governmental
approvals required for the continued operation or further development and construction of the power plants,
including rights-of-way and other federal approvals for our projects on federal lands. We have not yet obtained
certain permits and government approvals required for the completion and successful operation of power plants
under development, construction or enhancement. Our failure to maintain, obtain or renew required permits or
governmental approvals, including the permits and approvals necessary for operating power plants under
development, construction or enhancement, could cause our operations to be limited or suspended resulting in fines
under the PPA. We may also be subject to litigation seeking to rescind or delay our receipt of environmental permits
and governmental approvals.
Failure to secure or maintain permits—or to comply with permit conditions—could prevent or delay project
development, or trigger enforcement, fines, or orders limiting operations, any of which could impact PPA
performance and cash flows. In addition, some of the environmental permits and governmental approvals that have
75
been issued to the power plants are granted for limited periods and contain certain conditions and restrictions,
including restrictions or limits on emissions and discharges of pollutants and contaminants. If we fail to obtain
necessary permit renewals, or satisfy permit conditions, comply with permit restrictions, or comply with any
statutory or regulatory environmental standards, we could become subject to regulatory enforcement action, our
permits could be revoked and the operation of the power plants could be adversely affected. We could also be
subject to fines, penalties or additional costs or other sanctions, including the imposition of investigatory or remedial
obligations or the issuance of orders limiting or prohibiting our operations.
Our operations are also subject to numerous federal and state regulatory standards related to the generation,
handling, transportation, use, storage, treatment and disposal of hazardous substances. Our operations involve the
storage and use of hazardous substances, including but not limited to, drilling fluid additives, fuels, lubricants, and
chemicals used in well construction, reservoir management, and plant operations. If any of the hazardous substances
we use in the course of operations are found to have been released into the environment in violation of, or
noncompliance with, applicable environmental laws, we could become liable for the investigation and remediation
of those hazardous substances, regardless of their source and time of release. For example, equipment failure or
extreme weather could result in spills or unauthorized discharges of hazardous substances to soil, surface water, or
groundwater. Failure to comply with environmental laws, including those governing hazardous substances, could
subject us to civil or criminal liability, the imposition of liens or fines, interruption of drilling or power production,
delay in project schedules, costly design or operational modifications, or cessation of operations. Furthermore, under
certain applicable environmental laws, we could be held liable for the cleanup of releases of hazardous substances at
any other locations where we have arranged for the disposal of those substances, even if we did not cause the release
at that location or if the release complied with applicable laws at the time it occurred. Liability pursuant to these
laws is often strict, joint and several. The cost of remedial action in connection with any spills or releases of
hazardous substances could be significant and may expose us to material liability.
Environmental or archeological issues (such as endangered species) may be discovered or identified in the
construction our projects, which result in delays or inability to proceed.
The Endangered Species Act (“ESA”) and Migratory Bird Treaty Act (“MBTA”) govern the land on our leases.
In addition, further restrictions may be imposed in the future, which could have an adverse impact on our ability to
expand some of our existing operations or limit our ability to develop new infrastructure on our leased land. The
ESA and comparable state laws restrict activities that may result in negative impacts to endangered or threatened
species or their habitats. Similar protections are offered to migratory birds under the MBTA and comparable state
laws. To the degree that species listed or protected under the ESA, MBTA or similar state laws are identified in the
areas where we operate, our ability to conduct or expand operations and construct facilities could be limited, and we
and could be forced to incur additional material costs that may have a material effect on our business. Additionally,
discovered cultural resources, particularly tribal cultural resources, could have an impact on our ability to develop on
our leased land.
Site decommissioning, well plugging, and financial assurance obligations could increase costs, constrain
liquidity, and expose us to liability
Our operations, including our operations on federal lands and on private lands that we do not own, may be
subject to end-of-life obligations to plug and decommission wells, dismantle facilities, and/or restore sites, and while
we accrue asset retirement obligations, actual costs may materially exceed estimates due to inflation, scope changes,
site conditions, or evolving technical and regulatory standards. In addition, government agencies and other lessors
may tighten restriction criteria or increase bonding requirements associated with decommissioning activities.
Our reliance on U.S. government land leases exposes us to regulatory and operational risks.
A substantial portion of our geothermal projects are located on land leased from the U.S. government,
particularly in Utah and Nevada. These leases are subject to federal regulations, administrative changes, and
evolving political priorities, which may impact our ability to maintain, renew, or expand our leasehold interests. The
terms and conditions of government leases can be modified at any time, and there is a risk that future lease renewals
may be subject to more stringent requirements, higher costs, or even denial. Additionally, the government may
76
impose new environmental, safety, or land use restrictions that could limit our operational flexibility or require
costly compliance measures.
Any adverse changes in lease terms, delays in renewals, or increased regulatory scrutiny could disrupt our
operations, require us to relocate projects, or result in the loss of valuable assets. The process of securing and
maintaining government leases is complex and time-consuming, often involving multiple agencies and extensive
public consultation. Heightened environmental scrutiny or shifts in land use policy could further complicate this
process, potentially leading to project delays, increased costs, or the need to abandon certain sites altogether. Our
growth prospects and financial performance are closely tied to our ability to navigate these regulatory challenges and
maintain favorable lease arrangements.
Changes to environmental regulations governing well drilling, hydraulic fracturing, water sourcing and disposal,
and subsurface injection could restrict operations or increase costs.
Federal and state agencies could revise permitting standards (including under NEPA/CEQA, the Clean Water
Act, and Safe Drinking Water Act underground injection control programs), impose additional baseline or ongoing
monitoring, limit produced‑water reinjection volumes or chemistry, tighten water‑rights or groundwater allocations,
or require alternative disposal pathways. Such changes could delay or prevent drilling, require redesign of
engineered reservoirs or operations, increase operating and compliance costs, or constrain output. Although our
design reinjects geothermal brine and uses air‑cooled ORC to minimize water use, evolving standards for well
construction and integrity, stimulation fluids, surface discharges, and waste handling could materially affect
schedules, capital needs, and PPA performance. For example, our inability to obtain a UIC in Nevada for reinjection
wells could delay or prevent operations, force costlier disposal options, or require material project redesign.
In particular, reservoir stimulation techniques, including certain hydraulic fracturing practices, are used in parts
of the geothermal industry to enhance permeability and improve the productivity of geothermal reservoirs. These
activities can involve the injection of water and other additives under pressure into targeted subsurface formations to
increase fracture connectivity and facilitate heat extraction. We may use such stimulation techniques in connection
with our EGS operations. Regulation of geothermal well construction, reservoir stimulation, and related activities
typically occurs at the state level. However, federal agencies, including the EPA, have asserted or may assert
authority under federal environmental laws, including the Safe Drinking Water Act, over certain underground
injection activities. For example, the EPA has issued guidance and regulations governing underground injection
control programs and has promulgated rules that restrict or prohibit the discharge of certain wastewaters to publicly
owned treatment works, which can affect how fluids associated with drilling and stimulation are managed and
disposed.
Congress has, from time to time, considered and may in the future consider, legislation that would expand
federal oversight of underground injection and stimulation practices, including requirements for permitting and
disclosure of chemicals used in stimulation fluids. We cannot predict the timing, scope or outcome of any such
legislative efforts. At the state level, several jurisdictions have adopted or are considering more stringent permitting,
disclosure, induced-seismicity monitoring, and well construction requirements, applicable to reservoir stimulation
activities. Local governments may also seek to regulate the time, place, and manner of drilling and related field
activities within their jurisdictions, and some jurisdictions have pursued or may pursue restrictions or bans on certain
stimulation practices. If new or more stringent federal, state, or local requirements relating to geothermal
stimulation, underground injection, water management, seismic monitoring, or well construction are adopted in
areas where we operate, we could incur significant additional costs to achieve compliance, experience delays or
curtailment in EGS, development and production activities, or face constraints on wastewater handling and disposal
options.
Risks Related to Information Technology, Cybersecurity, Data Privacy and Intellectual Property
Our intellectual property rights may not be adequate to protect our business.
Our existing intellectual property rights may not be adequate to protect our business. We occasionally file patent
applications which cover our systems (mainly geothermal wells and power plants for electricity production).
However, the patent application process is expensive, time-consuming, uncertain and complex and we may not be
77
able to prepare, file, prosecute, maintain and enforce all necessary or desirable patents or patent applications at a
reasonable cost or in a timely manner. Patents may not be issued on the basis of our patent applications, and issued
patents may be invalidated. Additionally, the scope of patent protection can be reinterpreted after issuance. Even if
our patent applications do issue as patents, they may not issue in a form that is sufficiently broad to protect our
technology, prevent competitors or other third parties from competing with us or otherwise provide us with a
competitive advantage. In addition, any patents issued to us or for which we have license rights may be challenged,
narrowed, invalidated or circumvented. Third parties may initiate opposition, interference, re-examination, post-
grant review, inter partes review, nullification or derivation actions, or similar proceedings challenging the
inventorship, validity, enforceability or the scope of our patents. An adverse determination in any such proceeding
or litigation could reduce the scope of, or invalidate our patent rights, allow third parties to commercialize our
technology and compete directly with us, without payment to us, or result in our inability to commercialize our
technology without infringing third-party patent rights. Such proceedings also may result in substantial cost and
require significant time from our management, even if the eventual outcome is favorable to us. Our competitors or
other third parties may also be able to circumvent our patents by developing similar or alternative technologies in a
non-infringing manner. Consequently, we cannot guarantee that our technology will be protectable or remain
protected by valid and enforceable patents.
In order to safeguard our unpatented proprietary know-how, trade secrets and technology, we rely on a
combination of trade secret protection and non-disclosure provisions in agreements with employees and third parties
having access to confidential or proprietary information. These measures may not adequately protect us from
disclosure, use, reverse engineering, infringement, misappropriation or other violation of our proprietary information
and other intellectual property rights by third parties. Furthermore, non-disclosure provisions can be difficult to
enforce and, even if successfully enforced, may not be entirely effective.
Even if we adequately protect our intellectual property rights, litigation may be necessary to enforce these
rights, which could result in substantial costs to us and a substantial diversion of management attention.
Furthermore, attempts to enforce our intellectual property rights against third parties could also provoke these third
parties to assert their own intellectual property or other rights against us, or result in a holding that invalidates or
narrows the scope of our rights, in whole or in part.
Our success and ability to compete also depends in part on our ability to operate without infringing,
misappropriating or otherwise violating the intellectual or proprietary rights of third parties. While we have
attempted to ensure that our technology and the operation of our business does not infringe other parties’ patents and
other intellectual property or proprietary rights, our competitors or other third parties may assert that certain aspects
of our business or technology infringe upon, misappropriate or otherwise violate their intellectual property or
proprietary rights. In addition, former employers of our current, former or future employees may assert claims that
such employees have improperly disclosed to us the confidential or proprietary information of these former
employers. Infringement, misappropriation or other intellectual property violation claims, regardless of merit or
ultimate outcome, can be expensive, hard to predict and time-consuming and can divert management’s attention
from our core business. An assertion of an intellectual property infringement, misappropriation or other violation
claim against us may result in adverse judgments, settlements on unfavorable terms or cause us to pay significant
money damages, lose significant revenues, be prohibited from using the relevant technology or other intellectual
property, or incur significant license, royalty or technology development expenses. Future litigation may also
involve non-practicing entities or other intellectual property owners who have no relevant product offerings or
revenue and against whom our own intellectual property may therefore provide little or no deterrence or protection.
Third parties may allege that we are infringing, misappropriating, or otherwise violating their intellectual
property rights, which could involve substantial costs and adversely impact our business.
Our success in part depends on our ability to develop, manufacture, market and sell our technologies without
infringing, misappropriating or otherwise violating the intellectual property rights of third parties. Furthermore, we
cannot guarantee that the operation of our business does not and will not infringe or violate the rights of third
parties. For example, because some patent applications are maintained in secrecy for a period of time, there is a risk
that we could develop a product or technology without knowledge of a pending patent application, which product or
technology would infringe a third-party patent once that patent is issued.
78
We have in the past, and may in the future, be subject to claims by third parties alleging that we have infringed,
misappropriated or otherwise violated their intellectual property rights. Any such claims, even those without merit,
can be expensive and time-consuming to defend and may divert management’s attention and resources, and an
adverse result in any proceeding could put our ability to produce, market and sell our technologies in jeopardy. The
outcome of any litigation is inherently uncertain, and there can be no assurances that favorable final outcomes will
be obtained in all cases. We may be required to spend significant resources to defend against such claims, pay
significant money damages, cease using certain processes, technologies, trademarks or other intellectual property,
cease making, offering and selling certain technologies, obtain a license (which may not be available on
commercially reasonable terms or at all) or redesign all or a portion of our technologies or change our branding
(which could be costly, time-consuming, or impossible). While no such claims have been material to date, there is
no guarantee that future claims would not have a material effect on our business.
The defense costs and settlements for intellectual property infringement lawsuits may not be covered by
insurance. Intellectual property infringement lawsuits can take years to resolve. If we are not successful in our
defenses or are not successful in obtaining dismissals of any such lawsuit, legal fees or settlement costs could have
an adverse effect on our operations and financial position. Even if resolved in our favor, the volume of intellectual-
property-related claims and the mere specter of threatened litigation or other legal proceedings may cause us to incur
significant expenses and could distract our personnel from day-to-day responsibilities. The direct and indirect costs
of addressing these actual and threatened disputes may have an adverse effect on our operations, reputation, and
financial performance.
In addition, some of our agreements with third parties require us to indemnify them for certain intellectual
property claims against them, which could require us to incur considerable costs in defending such claims, and may
require us to pay significant damages in the event of an adverse ruling. Such third-party partners may also
discontinue their relationships with us as a result of injunctions or otherwise, which could result in loss of revenue
and adversely impact our business operations.
A cyber-incident, cyber security breach, severe natural event or physical attack on our operational networks and
information technology systems could have a material adverse effect on our financial condition, results of
operations, liquidity and cash flows.
We rely on information technology systems that allow us to create, store, retain, transmit and otherwise process
proprietary and sensitive or confidential information, including our business and financial information, and personal
information regarding our employees and third parties. We also rely on our operational technology systems to
operate our power plants and provide our services. In addition, we often rely on third-party vendors to host,
maintain, modify and update our systems.
Our and our third-party vendors’ technology systems can be damaged by malicious events such as cyber and
physical attacks, computer viruses, ransomware, malicious and destructive code, phishing attacks, denial of service
or information, as well as security breaches, natural disasters, fire, power loss, telecommunications failures,
employee misconduct, human error, and third parties such as traditional computer hackers, persons involved with
organized crime or foreign state or foreign state-supported actors. Furthermore, our disaster recovery planning may
not be sufficient for all situations. Any failure, disruptions to or decrease in the functionality of our or our third-party
vendors’ operational and information technology networks could impact our ability to maintain effective internal
controls over financial reporting, cause harm to the environment, the public or our employees, and significantly
disrupt and damage our assets, reputation and operations or those of third parties.
We and our third-party vendors may in the future be subject to breaches and attempts to gain unauthorized
access to our information technology systems or sensitive or confidential data, or to disrupt our operations. To date,
none of these breaches or attempts has, individually or in the aggregate, resulted in a security incident with a
material effect on our operations or our financial condition, results of operations, liquidity, or cash flows. Despite
implementation of security and control measures, we and our third-party vendors have not always been able to, and
there can be no assurance that we or our third-party vendors will be able to in the future, anticipate or prevent
unauthorized access to our or our third-party vendors’ operational technology networks, information technology
systems or data, or the disruption of our or our third-party vendors’ operations. The techniques used to obtain
79
unauthorized access to our and our third-party vendors’ operational technology networks, information technology
systems or data are constantly evolving and have become increasingly complex and sophisticated. Furthermore, such
techniques change frequently and are often not detected until after they have been launched against a target.
Therefore, we may be unable to anticipate these techniques and may not become aware in a timely manner of such a
security breach, which could exacerbate any damage we experience. Such events could cause interruptions in the
operation of our business, damage our operational technology networks and information technology systems, subject
us to significant expenses, remediation costs, litigation, disputes, claims by third parties and regulatory actions or
investigations that could result in damages, material fines and penalties, and harm to our reputation, any of which
could have a material adverse effect on our financial condition, results of operations, liquidity, and cash flows. We
may maintain cyber liability insurance that covers certain damages caused by cyber incidents. However, there is no
guarantee that adequate insurance will continue to be available at rates that we believe are reasonable or that the
costs of responding to and recovering from a cyber incident will be covered by insurance or recoverable in rates.
In addition, we are subject to various legislation, regulations, directives and guidelines from federal, state, local
and foreign agencies, such as FERC, that are intended to strengthen cybersecurity measures required for information
and operational technology and critical energy infrastructure and that apply to the collection, use, retention,
protection, disclosure, transfer and other processing of personal information. In California, for example, the
California Consumer Privacy Act (the “CCPA”) imposes obligations on businesses to be transparent with their data
privacy practices and vests consumers with rights to access and delete the personal information held by businesses.
These requirements are even more robust under the California Privacy Rights Act (the “CPRA”) which amends the
CCPA to, among other things, extend consumer rights and business obligations to employees. These cybersecurity,
data protection and privacy law regimes continue to evolve and may result in ever-increasing public scrutiny and
escalating levels of capital expenditures, regulatory enforcement, sanctions and fines and increased costs for
compliance. We have instituted security measures and safeguards to protect our operational systems and information
technology assets, including certain safeguards required by FERC. Despite our implementation of security measures
and safeguards, any failure to comply with FERC or any of these legal requirements could result in enforcement
action against us, including fines, imprisonment of company officials and public censure, any of which could harm
our reputation and have a material adverse effect on our financial condition, results of operations, liquidity, and cash
flows.
Our use of artificial intelligence and machine learning technologies could adversely affect our products and
services, harm our reputation, or cause us to incur liability resulting from harm to individuals or violation of
laws and regulations or contracts to which we are a party.
We use artificial intelligence, machine learning and automated decision-making technologies in several core
parts of our business, including for subsurface sensing and monitoring, production forecasting, and wellfield design
and optimization. For example, we deploy AI-enhanced fiber optic sensing in our wells to measure reservoir
conditions in real time and to monitor flow rates, pressures and temperatures; we apply proprietary AI-based
modeling, including errors in data underlying such AI models, advanced data analytics and computational science to
analyze more than 500 terabytes of downhole and operational data collected to date; and we use these tools to
predict future well output, inform well spacing and completion design, and optimize wellfield configuration and
reservoir management over time. We are dedicating resources and efforts to continuously improve our use of such
technologies. As with many technological innovations, there are significant risks and challenges involved in
developing, maintaining and deploying these technologies and there can be no assurance that the usage of such
technologies will always enhance our solutions or be beneficial to our business, including our efficiency or
profitability.
In particular, if the models underlying the artificial intelligence, machine learning and automated decision-
making technologies that we develop or use are: (i) incorrectly designed or implemented; (ii) trained or reliant on
incomplete, inadequate, inaccurate, biased or otherwise poor quality data, or on data to which we do not have
sufficient rights or in relation to which we and/or the providers of such data have not implemented sufficient legal
compliance measures (including with respect to the processing and protection of such data); (iii) used without
sufficient oversight or governance to ensure their responsible and ethical use; and/or (iv) adversely impacted by
unforeseen defects, technical challenges, cybersecurity threats or material performance issues, the performance of
our products, services and business, as well as our reputation and the reputations of our customers and business
80
partners, could suffer or we could incur liability resulting from harm to individuals, civil claims or the violation of
laws or contracts to which we are a party. For example, errors in our AI-enhanced fiber optic sensing, our
proprietary AI-based modeling, including errors in data underlying such AI models, or our production forecasting
could lead to inaccurate predictions of well output, suboptimal well spacing or completion designs, or misinformed
reservoir management decisions, which could in turn reduce generation, increase costs, delay projects, or cause
safety, environmental or contractual compliance issues.
Risks Related to Our Employees and Workforce
We are highly dependent on our senior management team and other highly skilled personnel, and if we are not
successful in attracting or retaining highly qualified personnel, we may not be able to successfully implement our
business strategy.
Our success depends, in significant part, on the continued services of our senior management team and on our
ability to attract, motivate, develop, and retain a sufficient number of other highly skilled personnel, including
engineering, science, manufacturing and quality assurance, regulatory affairs, finance, marketing and sales
personnel.
Our senior management team has extensive experience in the energy and manufacturing industries, and we
believe that their depth of experience is instrumental to our continued success. The loss of any one or more members
of our senior management team or other highly skilled personnel, for any reason, including resignation or retirement,
could impair our ability to execute our business strategy and have a material adverse effect on our business and
financial condition if we are unable to successfully attract and retain qualified and highly skilled replacement
personnel.
Our business plan requires us to attract and retain qualified personnel including personnel with highly technical
expertise. Our failure to successfully recruit and retain experienced and qualified personnel could have a
material adverse effect on our business.
Our future success depends in part on our ability to contract with, hire, integrate, and retain highly competent
geothermal and drilling focused engineers and scientists, and other qualified personnel.
Competition for the limited number of these skilled professionals is intense. If we are unable to adequately
anticipate our needs for certain key competencies and implement human resource solutions to recruit or improve
these competencies, our business, results of operations and financial condition could suffer. If we are unable to
recruit and retain highly skilled personnel, especially personnel with sufficient technical expertise to develop our
wellfields, horizontal drilling operations and power plants, we may experience delays, increased costs, and
reputational harm. A shortage in the labor pool of skilled workers in the U.S., or other general inflationary pressures
or changes in applicable laws and regulations, could make it more difficult for us to attract and retain qualified
personnel and could require an increase in the wage and benefits packages that we offer, thereby increasing our
operating costs. For example, the IRA imposed certain prevailing wage and apprenticeship requirements, and the
OBBB retained such requirements, related to tax credit availability which may impact our labor costs going forward.
Any increase in our operating costs could materially and adversely affect our business, financial condition, operating
results, liquidity and prospects.
Some of the work performed by our employees may be subject to the IRA’s prevailing wage and apprenticeship
requirements. Internalizing our workforce may result in increased costs due to increases in prevailing wages or
hiring additional workers as apprentices. We may also face increased recordkeeping and administrative costs
associated with demonstrating compliance with prevailing wage and apprenticeship requirements. The U.S. Treasury
has issued only limited guidance on the interpretation and implementation of the IRA and OBBB and additional
guidance may be forthcoming. If and when such guidance is issued, it may impose additional requirements and/or
limitations. The impact of these requirements, the availability or nature of any future guidance, and the potential for
any other legislation changes, is not fully known and the tax law is subject to change and to regulatory guidance
which may increase the cost of compliance. There is also a risk of non-compliance with the prevailing wage and
apprenticeship requirements which would result in us having to make cure payments in the form of penalties and
81
interest in order to maintain our tax credits under the IRA and OBBB or the loss of the tax credit if making cure
payments is not possible.
Labor-related matters, including labor disputes, may adversely affect our operations.
None of our employees are currently represented by a union. If our employees decide to form or affiliate with a
union, we cannot predict the effects such future organizational activities would have on our business and operations.
If we were to become subject to work stoppages or other labor disputes, we could experience disruption in our
operations, including delays in manufacturing and operations, and increases in our labor costs could harm our
business, results of operations, and financial condition.
In addition, we could face a variety of employee or employee-related claims against us, including but not
limited to discrimination, privacy, wage and hour, labor and employment, Employee Retirement Income Security
Act, occupational safety and health, and disability claims. Any claims could also result in litigation or regulatory
proceedings being brought against us by various government agencies that regulate our business, including but not
limited to the U.S. Equal Employment Opportunity Commission and U.S. Department of Labor (including the
Occupational Safety and Health Administration). Often these cases raise complex factual and legal issues and create
risks and uncertainties. If we were to become subject to such labor disputes or other employee-related disputes, it
could have a negative effect on our business, financial condition and results of operations.
Risks Related to Financial and Accounting Matters
We have identified material weaknesses in our internal controls over financial reporting, and the failure to
achieve and maintain effective internal controls over financial reporting could harm our business and negatively
impact the value of our common stock.
In connection with the audit of our consolidated financial statements as of and for the year ended December 31,
2025, we identified material weaknesses in our internal control over financial reporting that we are currently
working to remediate, which relate to: (a) insufficient segregation of duties in the financial statement reporting and
general information technology processes; (b) a lack of sufficient levels of staff with public company and technical
accounting experience to maintain proper control activities and perform risk assessment and monitoring activities;
and (c) insufficient general information technology controls, including access security and change management
controls. A “material weakness” is a deficiency, or a combination of deficiencies, in internal control over financial
reporting, such that there is a reasonable possibility that a material misstatement of the company’s annual or interim
financial statements will not be prevented or detected on a timely basis. We have concluded that these material
weaknesses in our internal control over financial reporting occurred because we do not have the necessary business
processes, personnel and related internal controls to operate in a manner to satisfy the accounting and financial
reporting timeline requirements of a public company.
We are focused on designing and implementing effective internal controls measures to improve our evaluation
of disclosure controls and procedures, including internal control over financial reporting, and remediating the
material weaknesses. We also plan to recruit additional qualified financial reporting and accounting personnel
following the completion of this offering to enhance our financial reporting capabilities.
However, we cannot assure you that the measures we are taking to remediate the material weaknesses will
prevent or avoid potential future material weaknesses. Further, additional weaknesses in our disclosure controls and
internal controls over financial reporting may be discovered in the future. Any failure to develop or maintain
effective controls or any difficulties encountered in their implementation or improvement could limit our ability to
prevent or detect a misstatement of our accounts or disclosures that could result in a material misstatement of our
annual or interim financial statements. In such a case, we may be unable to maintain compliance with securities law
requirements regarding timely filing of periodic reports in addition to the listing requirements of the NASDAQ,
investors may lose confidence in our financial reporting and our stock price may decline as a result.
82
There are material limitations with making preliminary estimates of our financial and operating results for the
period ended March 31, 2026, prior to the completion of our and our auditors’ financial review procedures for
such period.
Our independent registered public accounting firm has not conducted an audit or review of, and does not
express an opinion or any other form of assurance with respect to, the preliminary unaudited results. It is possible
that we, or our independent registered public accounting firm, may identify items that require us to make
adjustments to the preliminary estimates of financial and operating results contained herein.
The preliminary estimates of revenues, net loss, capital expenditures, cash and cash equivalents and long-term
debt contained in “Prospectus Summary—Recent Developments —Preliminary Financial and Operating Results for
the Three Months Ended March 31, 2026 (Unaudited)” are not a comprehensive statement of our financial results for
the period ended March 31, 2026. Our financial statements for the period ended March 31, 2026, will not be
available until after this offering is completed and, consequently, will not be available to you prior to investing in
this offering. Our actual results for the period ended March 31, 2026, are not expected to differ materially from the
preliminary estimates we have provided as a result of the completion of our financial closing procedures, final
adjustments, and other developments arising between now and the time that our financial results for such periods are
finalized.
The selected preliminary consolidated financial data contained herein has been prepared by, and is the
responsibility of, our management. Deloitte & Touche LLP has not audited, reviewed, compiled or performed any
procedures with respect to this preliminary consolidated financial data. Accordingly, Deloitte & Touche LLP does
not express an opinion or any other form of assurance with respect thereto.
Further, our preliminary estimated results are not necessarily indicative of the results to be expected for the
remainder of the fiscal year ending December 31, 2026 or any future period as a result of various factors, including,
but not limited to, those discussed in the sections titled “Risk Factors,” “Management’s Discussion and Analysis of
Financial Condition and Results of Operations” and “Cautionary Note Regarding Forward-Looking Statements.”
Accordingly, you should not place undue reliance upon these preliminary estimates.
Risks Related to Owning Our Common Stock
We are controlled by our Co-Founders, whose interests in our business may conflict with ours or yours.
Our Class B common stock is beneficially owned by our Co-Founders, Tim Latimer and Jack Norbeck, PhD.,
who also serve as our Chief Executive Officer and Chief Technical Officer, respectively, whose interests may differ
from or conflict with the interests of our other stockholders. Each share of our Class A common stock is entitled to
one vote per share. Each share of our Class B common stock is entitled to 40 votes per share. Because of the forty-
to-one voting ratio between our Class B and Class A common stock, the holders of our Class B common stock
collectively continue to control a significant percentage of the combined voting power of our common stock and
therefore are able to control all matters submitted to our stockholders for approval. Following this offering, our Co-
Founders will hold all of the issued and outstanding shares of our Class B common stock and, accordingly, will
beneficially own approximately 2.75% of our outstanding capital stock and control approximately 53.03% of the
voting power of our outstanding capital stock (assuming no exercise of the underwriters’ option to purchase
additional shares to cover over-allotments, if any, and assuming Mr. Latimer and Dr. Norbeck do not purchase any
shares of Class A common stock pursuant to the reserved share program). Assuming all outstanding stock options
held by the Co-Founders that are vested or will vest within 60 days of April 30, 2026 vest and are exercised, the Co-
Founders would control approximately 62.1% of the combined voting power of our outstanding capital stock. As a
result, our Co-Founders will have the ability to exercise control over our affairs, including control over the outcome
of all matters submitted to our stockholders for approval, including the election of directors and significant corporate
transactions. The directors so elected will have the authority, subject to the terms of our indebtedness and applicable
rules and regulations, to issue additional stock, implement stock repurchase programs, declare dividends and make
other decisions. Our Co-Founders may have interests that differ from yours and may vote in a way with which you
disagree and which may be adverse to your interests. For example, our Co-Founders may have a different tax
position or other differing incentives from other stockholders that could influence their decisions regarding whether
83
and when to cause us to dispose of assets, incur new or refinance existing indebtedness or take other actions.
Additionally, our Co-Founders may cause us to make strategic decisions or pursue acquisitions that could involve
risks to you or may not be aligned with your interests.
This concentrated control will limit or preclude your ability to influence corporate matters for the foreseeable
future, including the election of directors, amendments of our organizational documents, and any merger,
consolidation, sale of all or substantially all of our assets, or other major corporate transaction requiring stockholder
approval. Further, this concentrated control may have the effect of delaying, preventing, or deterring a change in
control of our Company, could deprive our stockholders of an opportunity to receive a premium for their capital
stock as part of a sale of our Company and might ultimately affect the market price of our Class A common stock.
Moreover, while stockholders would generally be entitled to dissenters’ rights of appraisal under applicable
Delaware law, there are certain exceptions. As a result, our Co-Founders will be able to effectively control us.
Future transfers of Class B common stock will generally result in those shares converting into shares of Class A
common stock, subject to limited exceptions set forth in our Amended Charter, including transfers to immediate
family members (including upon the death of one of our Co-Founders), trusts (including grantor retained annuity
trusts) for which the stockholder or their immediate family member serves as trustee, and partnerships, corporations,
and other entities exclusively owned by one of our Co-Founders or their immediate families. In addition, each share
of Class B common stock will convert automatically into one share of Class A common stock upon the earliest to
occur of (i) the first trading day following the seventh anniversary of this offering, (ii) the date on which the number
of shares of Class A and Class B common stock beneficially owned by Mr. Latimer’s and Dr. Norbeck’s permitted
transferees (including shares underlying outstanding options) represents less than 25% of the shares of Class A and
Class B common stock beneficially owned by Mr. Latimer and Dr. Norbeck, in the aggregate, on the closing date of
this offering, (iii) the death or disability of a Co-Founder, and (iv) the termination of a Co-Founder for cause.
We cannot predict the effect our multi-class structure may have on the market price of our Class A common
stock.
We cannot predict whether our multi-class structure will result in a lower or more volatile market price of our
Class A common stock, adverse publicity or other adverse consequences. For example, certain stock index providers
have excluded or limited the eligibility of public companies with multiple classes of shares of common stock from
being added to certain stock indices. The multi-class structure of our common stock would therefore make us
ineligible for inclusion in indices with such restrictions and, as a result, mutual funds, exchange-traded funds, and
other investment vehicles that attempt to passively track these indices may not invest in our Class A common stock.
In addition, several stockholder advisory firms and large institutional investors have been critical of the use of
multi-class structures. Such stockholder advisory firms may publish negative commentary about our corporate
governance practices or capital structure, which may dissuade large institutional investors from purchasing shares of
our Class A common stock. These actions could make our Class A common stock less attractive to other investors.
As a result, the market price of our Class A common stock could be adversely affected.
Prior to this offering, there has been no established public market for our Class A common stock, and we cannot
guarantee that an active and liquid trading market will develop or be maintained post-offering.
There has been no public market for our Class A common stock prior to this offering. The initial public offering
price for our Class A common stock was determined through negotiations between us and the underwriters and may
vary from the market price of our Class A common stock following the completion of this offering. An active or
liquid market in our Class A common stock may not develop upon completion of this offering or, if it does develop,
it may not be sustainable. In the absence of an active trading market for our Class A common stock, you may not be
able to resell any shares you hold at or above the initial public offering price or at all.
An inactive market may also impair our ability to raise capital to continue to fund operations by selling shares
and may impair our ability to acquire other companies or technologies by using our shares as consideration. We
cannot predict the prices at which our Class A common stock will trade.
84
There may not be an active, liquid trading market for shares of our Class A common stock, which may cause
shares of our Class A common stock to trade at a discount from the initial offering price and make it difficult to
sell the shares of Class A common stock you purchase.
Prior to this offering, there has not been a public trading market for shares of our Class A common stock. We
cannot predict the extent to which investor interest in us will lead to the development of a trading market or how
active and liquid that market may become. If an active and liquid trading market does not develop or continue, you
may have difficulty selling your shares of our Class A common stock at an attractive price or at all. The initial public
offering price per share of Class A common stock will be determined by agreement between us and the
representatives of the underwriters, and may not be indicative of the price at which shares of our Class A common
stock will trade in the public market after this offering. The market price of our Class A common stock may decline
below the initial offering price and you may not be able to sell your shares of our Class A common stock at or above
the price you paid in this offering, or at all. An inactive trading market may also impair our ability to raise capital to
continue to fund operations by selling shares and may impair our ability to acquire other companies or assets by
using our shares as consideration.
The grant of registration rights to certain of our shareholders, and the future exercise of such rights may
adversely affect the market price of our Class A common stock.
Pursuant to the Registration Rights Agreement entered into in connection with this offering, certain of our
stockholders and their permitted transferees can demand that we register the resale of their registrable shares of
Class A common stock. We will bear the cost of registering these securities. The registration and availability of such
a significant number of securities for trading in the public market may have an adverse effect on the market price of
our Class A common stock.
If and when one or more registration statements covering these resales become effective, a substantial number
of additional shares of our Class A common stock could become freely tradable in the public market. The perception
that such sales may occur, the actual occurrence of such sales (including pursuant to any lock-up releases, permitted
transfers or resales by affiliates), or the availability of these securities for sale could materially and adversely affect
the market price and trading volume of our Class A common stock. These effects could be exacerbated if significant
holders elect to promptly sell their shares following the effectiveness of a registration statement, upon expiration of
any contractual restrictions, or upon the occurrence of other liquidity events.
In addition, sales of a substantial number of shares of our Class A common stock in the public market, or the
perception that these sales could occur, may make it more difficult for us to raise additional capital through future
equity offerings at prices we consider attractive, dilute the ownership interests of our existing stockholders, and
increase the volatility of our stock price. We cannot predict the timing, amount, or effect of any sales of our
securities that may be made by the selling securityholders, and there can be no assurance that a trading market that
supports prevailing or higher prices will be sustained.
Moreover, if we issue additional shares of Class A common stock or other equity-linked securities in the future,
whether in connection with acquisitions, strategic transactions, employee compensation, or otherwise, our existing
stockholders will experience additional dilution, and any such issuances could further increase the number of shares
available for resale. Short sales or hedging transactions by investors that receive shares in such transactions, or by
the selling securityholders following the effectiveness of a registration statement, could also depress the market price
of our Class A common stock. Because the market price of our Class A common stock may be volatile, stockholders
who purchase shares could lose a significant portion of their investments if our stock price declines, and we cannot
predict or estimate the effect that future sales or availability for sale of our securities will have on the market price of
our Class A common stock.
Our stock price may fluctuate significantly following this offering, and you may not be able to resell shares of our
Class A common stock at or above the price you paid or at all, and you could lose all or part of your investment as
a result.
Even if a trading market develops, the market price of our Class A common stock may be highly volatile and
could be subject to wide fluctuations. You may not be able to resell your shares at or above the initial public offering
85
price due to a number of factors such as those listed in “—Risks related to Our Business and Industry” and the
following:
•results of operations that vary from the expectations of securities analysts and investors;
•results of operations that vary from those of our competitors;
•changes in expectations as to our future financial performance, including financial estimates and investment
recommendations by securities analysts and investors;
•changes in economic conditions for companies in our industry;
•changes in market valuations of, or earnings and other announcements by, companies in our industry;
•declines in the market prices of stocks generally, particularly those of companies in our industry;
•additions or departures of key management personnel;
•strategic actions by us or our competitors;
•announcements by us, our competitors, our suppliers or our distributors of significant contracts, price
reductions, new products or technologies, acquisitions, dispositions, joint marketing relationships, joint
ventures, other strategic relationships or capital commitments or announcements relating to government
awards, or changes in government spending or policy;
•changes in preferences of our customers and our market share;
•changes in general economic or market conditions or trends in our industry or the economy as a whole;
•changes in business or regulatory conditions;
•future sales of our Class A common stock or other securities;
•investor perceptions of or the investment opportunity associated with our Class A common stock relative to
other investment alternatives;
•the public’s response to press releases or other public announcements by us or third parties, including our
filings with the SEC;
•changes or proposed changes in laws or regulations or differing interpretations or enforcement thereof
affecting our business;
•announcements relating to litigation or governmental investigations;
•guidance, if any, that we provide to the public, any changes in this guidance or our failure to meet this
guidance;
•the development and sustainability of an active trading market for our stock;
•changes in accounting principles; and
•other events or factors, including those resulting from informational technology system failures and
disruptions, natural disasters, pandemics, war, acts of terrorism or responses to these events.
Furthermore, the stock market in general, and companies in our industry in particular, have experienced extreme
volatility that, in some cases, were unrelated or disproportionate to the operating performance of these companies.
These broad market and industry fluctuations may adversely affect the market price of our Class A common stock,
regardless of our actual operating performance. In addition, price volatility may be greater if the public float and
trading volume of our Class A common stock is low.
86
In the past, following periods of market volatility or the reporting of unfavorable news, stockholders have
instituted securities class action litigation. If we were to become involved in securities litigation, it could have a
substantial cost and divert resources and the attention of management from our business regardless of the outcome
of such litigation.
Our quarterly operating results may fluctuate in the future and be less than prior periods, and our projections or
the expectations of securities analysts or investors may worsen, which could materially adversely affect our stock
price.
Our operating results may fluctuate from quarter to quarter in the future. Therefore, results of any one fiscal
quarter are not a reliable indication of results to be expected for any other fiscal quarter or for any year. If we fail to
increase our results over prior periods, to achieve our projected results or to meet the expectations of securities
analysts or investors, our stock price may decline, and the decrease in the stock price may be disproportionate to the
shortfall in our financial performance. Results may be affected by various factors, including those described in these
risk factors.
We do not expect to pay cash dividends in the foreseeable future. Any return on your investment may be limited to
increases in the market price of our Class A common stock.
We do not anticipate paying any regular cash dividends on our Class A common stock following this offering.
Any decision to declare and pay dividends in the future will be made at the discretion of our board of directors and
will depend on, among other things, general and economic conditions, our results of operations and financial
condition, our available cash and current and anticipated cash needs, capital requirements, contractual, legal, tax and
regulatory restrictions, and such other factors that our board of directors may deem relevant.
In addition, our ability to pay dividends is, and may be, limited by covenants of our current and any future
outstanding indebtedness we or our subsidiaries incur. In particular, existing and anticipated project‑level financing
arrangements generally restrict the ability of our project subsidiaries to make distributions upstream, including by
prohibiting or conditioning distributions until project completion is achieved, required reserves are funded, no
default exists and specified financial tests are met, and our holding company credit arrangements further condition
the receipt of distributions from project subsidiaries. Our joint venture and subsidiary governing documents may
also restrict the amount and timing of cash available for upstream distribution. Therefore, any return on investment
in our Class A common stock is substantially dependent upon the appreciation of the price of our Class A common
stock on the open market, which may not occur.
We are an emerging growth company within the meaning of the Securities Act and a smaller reporting company
within the meaning of the Exchange Act, and if we take advantage of certain exemptions from disclosure
requirements available to “emerging growth companies” or “smaller reporting companies,” this could make our
securities less attractive to investors and may make it more difficult to compare our performance with other
public companies.
We are an emerging growth company within the meaning of the Securities Act, as modified by the JOBS Act,
and we may take advantage of certain exemptions from various reporting requirements that are applicable to other
public companies that are not emerging growth companies including, but not limited to, not being required to
comply with the auditor attestation requirements of Section 404 of the Sarbanes-Oxley Act, reduced disclosure
obligations regarding executive compensation in our periodic reports and proxy statements, and exemptions from
say-on-pay, say-on-frequency and say-on-golden parachute voting requirements. As a result, our stockholders may
not have access to certain information they may deem important. We will remain an emerging growth company until
the earliest of (i) the last day of the fiscal year: (a) following , 2031, the fifth anniversary of the Company
IPO; (b) in which we have total annual gross revenue of at least $1,235,000,000; or (c) in which we are deemed to
be a large accelerated filer, which means the market value of the shares of our Common Stock that are held by non-
affiliates exceeds $700,000,000 as of the last business day of our prior second fiscal quarter, and (ii) the date on
which we have issued more than $1,000,000,000 in non-convertible debt securities during the prior three-year
period.
87
Further, Section 102(b)(1) of the JOBS Act exempts emerging growth companies from being required to
comply with new or revised financial accounting standards until private companies (that is, those that have not had a
Securities Act registration statement declared effective or do not have a class of securities registered under the
Exchange Act) are required to comply with the new or revised financial accounting standards. The JOBS Act
provides that a company can elect to opt out of the extended transition period and comply with the requirements that
apply to non-emerging growth companies but any such election to opt out is irrevocable. We intend to take
advantage of the benefits of this extended transition period.
Even after we no longer qualify as an emerging growth company, we may still qualify as a “smaller reporting
company,” which would allow us to continue to take advantage of many of the same exemptions from disclosure
requirements, including reduced disclosure obligations regarding executive compensation in our periodic reports and
proxy statements. Moreover, smaller reporting companies may choose to present only the two most recent fiscal
years of audited financial statements in their Annual Reports on Form 10-K. For so long as we are a smaller
reporting company and not classified as an “accelerated filer” or “large accelerated filer” pursuant to SEC rules, we
will be exempt from the auditor attestation requirements of Section 404(b) of the Sarbanes-Oxley Act.
We cannot predict whether investors will find our securities less attractive because we rely on these exemptions.
If some investors find our securities less attractive as a result of our reliance on these exemptions, the trading prices
of our securities may be lower than they otherwise would be, there may be a less active trading market for our
securities and the trading prices of our securities may be more volatile.
Investors in this offering will suffer immediate and substantial dilution.
The initial public offering price per share of Class A common stock will be substantially higher than our
adjusted net tangible book value (deficit) per share immediately after this offering. As a result, you will pay a price
per share of Class A common stock that substantially exceeds the per share book value of our tangible assets after
subtracting our liabilities. In addition, you will pay more for your shares of Class A common stock than the amounts
paid by our existing stockholders. Assuming an initial public offering price of $25.50 per share of Class A common
stock, which is the mid-point of the estimated price range set forth on the cover page of this prospectus, you will
incur immediate and substantial dilution in an amount of $16.38 per share of Class A common stock. If the
underwriters exercise their option to purchase additional shares, you will experience additional dilution. See
“Dilution.”
You may be diluted by the future issuance of additional Class A common stock and Class B common stock in
connection with our incentive plans, acquisitions or otherwise.
After this offering we will have approximately 283,562,333 shares (or 294,062,333 shares if the underwriters
exercise in full their option to purchase additional shares) of common stock authorized but unissued. Our Amended
Charter, which is expected to become effective immediately prior to the consummation of this offering, will
authorize us to issue these shares of Class A common stock and options relating to Class A common stock for the
consideration and on the terms and conditions established by our board of directors in its sole discretion, whether in
connection with acquisitions or otherwise. We have reserved shares for issuance under the 2026 Plan. See
“Executive and Director Compensation—Equity Compensation Plans.” Any Class A common stock and Class B
common stock that we issue, including under the 2026 Plan or other incentive plans that we have adopted or we may
adopt in the future, would dilute the percentage ownership held by the investors who purchase Class A common
stock in this offering. In the future, we may also issue our securities in connection with investments or acquisitions.
The number of shares of our Class A common stock issued in connection with an investment or acquisition could
constitute a material portion of our then-outstanding common stock. Any issuance of additional securities in
connection with investments or acquisitions may result in additional dilution to you.
Future sales, or the perception of future sales, by us or our existing stockholders in the public market following
this offering could cause the market price for our Class A common stock to decline.
After this offering, the sale of shares of our Class A common stock in the public market, or the perception that
such sales could occur, could harm the prevailing market price of shares of our Class A common stock. These sales,
88
or the possibility that these sales may occur, also might make it more difficult for us to sell equity securities in the
future at a time and at a price that we deem appropriate.
Upon consummation of this offering and after giving effect to the Stock Split, Reclassification, the Founder
Share Exchange and the Preferred Stock Conversion, we will have a total of 275,776,919 shares of Class A common
stock outstanding. All shares of our Class A common stock sold in this offering will be freely tradable without
restriction or further registration under the Securities Act, except for any shares of Class A common stock held by
our affiliates, as that term is defined under Rule 144 of the Securities Act (“Rule 144”), including our directors,
executive officers and other affiliates, which may be sold only in compliance with the limitations described in
“Shares Eligible for Future Sale.”
The 72,035,354 shares of Class A common stock held by our directors, executive officers, certain affiliates and
employees immediately following the consummation of this offering will represent approximately 26% of our total
outstanding shares of Class A common stock following this offering, based on the number of shares outstanding as
of April 29, 2026. Such shares will be “restricted securities” within the meaning of Rule 144 and subject to certain
restrictions on resale following the consummation of this offering. Restricted securities may be sold in the public
market only if they are registered under the Securities Act or are sold pursuant to an exemption from registration
such as Rule 144, as described in “Shares Eligible for Future Sale.”
In connection with this offering, we and all directors and executive officers and the holders of approximately
97% of our outstanding stock and stock options have agreed that, without the prior written consent of J.P. Morgan
Securities LLC and BofA Securities, Inc. on behalf of the underwriters, we and they will not, and will not publicly
disclose an intention to, dispose of or hedge any shares of our Class A common stock or securities convertible into
or exchangeable for shares of our Class A common stock during the period ending 180 days after the date of this
prospectus, subject to certain exceptions. See “Underwriting” for a description of these lock-up agreements.
Upon the expiration of the contractual lock-up agreements pertaining to this offering, up to an
additional 205,005,185 shares of our Class A common stock will be eligible for sale in the public market, of which
89,126,623 are held by directors, executive officers and other affiliates and will be subject to volume, manner of sale
and other limitations under Rule 144. Following completion of this offering, shares covered by registration rights
would represent approximately 71% of our outstanding Class A common stock (or approximately 69%, if the
underwriters exercise in full their option to purchase additional shares). Registration of any of these outstanding
shares of Class A common stock would result in such shares becoming freely tradable without compliance with Rule
144 upon effectiveness of the registration statement. See “Shares Eligible for Future Sale.”
As restrictions on resale end or if these stockholders exercise their registration rights, the market price of our
shares of Class A common stock could drop significantly if the holders of these shares sell them or are perceived by
the market as intending to sell them. These factors could also make it more difficult for us to raise additional funds
through future offerings of our shares of Class A common stock or other securities.
In addition, the shares of our Class A common stock and Class B common stock reserved for future issuance
under the 2026 Plan will become eligible for sale in the public market once those shares are issued, subject to
provisions relating to various vesting agreements, lock-up agreements and Rule 144, as applicable. A total of
35,107,737 shares of Class A common stock and Class B common stock have been reserved for future issuance
under the 2026 Plan.
In the future, we may also issue our securities in connection with investments or acquisitions. The number of
shares of our Class A common stock issued in connection with an investment or acquisition could constitute a
material portion of our then-outstanding shares of Class A common stock. Any issuance of additional securities in
connection with investments or acquisitions may result in additional dilution to you.
We have broad discretion to determine how to use the funds we receive from this offering and may use them in
ways that may not enhance our results of operations or the price of our Class A common stock.
We have broad discretion over the use of proceeds we receive from this offering, and we could spend the
proceeds we receive from this offering in ways our stockholders may not agree with or that do not yield a favorable
89
return, or no return at all. We currently expect to use the net proceeds from this offering to for general corporate
purposes, including capital expenditures, continued development of our GeoClusters, expansion of our land holdings
portfolio, working capital, and operating expenses. We currently have no specific plan for the proceeds, or for any
significant portion thereof, and accordingly are not able at this time to allocate or quantify the approximate amounts
we expect to use for any particular purpose identified above. Additionally, we may use a portion of the net proceeds
to acquire or invest in products, services or technologies. The identity of any potential targets is not known at this
time and any such transactions, if pursued, would depend on the availability of suitable opportunities and market
conditions. We do not have binding agreements or commitments for any material investments outside the ordinary
course of our business at this time. The timing and amount of our actual expenditures will depend on numerous
factors, including the progress of our project development activities, the growth of our operations and overall market
conditions. If we do not invest or apply the proceeds we receive from this offering in ways that improve our results
of operations, we may fail to achieve expected financial results or be required to raise additional capital, which could
cause our stock price to decline. In addition, pending their use, the proceeds of this offering may be placed in
investments that do not produce income or that may lose value.
The price of our common stock could decline if securities analysts cease to publish research or if securities
analysts or other third parties publish inaccurate or unfavorable research about us.
The trading market for our Class A common stock will depend in part on the research and reports that securities
or industry analysts publish about us or our business, our market, and our competitors. We do not currently have and
may never obtain research coverage by securities and industry analysts. We do not have any control over these
analysts. If we fail to meet the expectations of these analysts, our stock price could be adversely affected.
If no or few securities analysts commence coverage of us, the trading price for our Class A common stock
would be negatively affected. In the event we obtain securities or industry analyst coverage, if one or more of the
analysts who cover us downgrade our Class A common stock or publish inaccurate or unfavorable research about
our business, our Class A common stock price would likely decline.
If one or more of these analysts cease coverage of us or fail to publish reports on us regularly, demand for our
Class A common stock could decrease, which may cause our Class A common stock price and trading volume to
decline. lose visibility in the market, which in turn could cause our stock price or trading volume to decline.
Provisions in our organizational documents could delay or prevent a change of control.
Certain provisions of our Amended Charter or Amended Bylaws may have the effect of delaying or preventing
a merger, acquisition, tender offer, takeover attempt or other change of control transaction that a stockholder might
consider to be in its best interest, including attempts that might result in a premium over the market price of our
Class A common stock.
These provisions will provide for, among other things:
•the division of our board of directors into three classes, as nearly equal in size as possible, with directors in
each class serving three-year terms and with terms of the directors of only one class expiring in any given
year;
•the ability of our board of directors to issue one or more series of preferred stock with voting or other rights
or preferences that could have the effect of impeding the success of an attempt to acquire us or otherwise
effect a change of control;
•the requirement that, following the date that no shares of Class B common stock are outstanding, any action
to be taken by our stockholders be effected at a duly called annual or special meeting and not by written
consent;
•the ability of our board of directors to establish the number of directors and fill any vacancies and newly
created directorships;
•no cumulative voting;
90
•that directors may only be removed “for cause” and only with the approval of two-thirds of our
stockholders;
•a multi-class common stock structure in which holders of our Class B common stock may have the ability
to control the outcome of matters requiring stockholder approval, even if they own significantly less than a
majority of the outstanding shares of our common stock, including the election of directors and other
significant corporate transactions, such as a merger or other sale of our company or its assets;
•advance notice requirements for nominations of directors by stockholders and for stockholders to include
matters to be considered at stockholder meetings; and
•certain limitations on convening special stockholder meetings.
These provisions could make it more difficult for a third-party to acquire us, even if the third-party’s offer may
be considered beneficial by many of our stockholders. As a result, our stockholders may be limited in their ability to
obtain a premium for their shares. See “Description of Capital Stock.”
Our board has broad discretion to issue additional securities, including common stock. Future issuances of
Common Stock could result in significant dilution to our existing stockholders, affecting the value of their
investment and their voting power.
Sales of a substantial number of shares of the Class A common stock by our existing stockholders in the public
market, or the perception that these sales might occur, could depress the market price of the Class A common stock
and could impair our ability to raise additional capital through the issuance of additional equity securities. We are
unable to predict the effect that such sales may have on the prevailing market price of the Common Stock.
Any issuance of equity we may undertake in the future to raise additional capital could cause the price of the
Class A common stock to decline, or require us to issue shares at a price that is lower than that paid by holders of the
Class A common stock in the past, which would result in those newly issued shares being dilutive. In addition,
future investors could gain rights superior to existing stockholders, such as liquidation and other preferences. If we
obtain funds through a credit facility or through the issuance of debt or preferred securities, these securities will
likely have rights senior to the rights of a common stockholder, which could impair the value of the Class A
Common Stock.
Our Amended Charter will provide that the Court of Chancery of the State of Delaware will be the sole and
exclusive forum for certain stockholder litigation matters and the federal district courts of the United States shall
be the exclusive forum for the resolution of any complaint asserting a cause of action arising under the Securities
Act, which could limit our stockholders’ ability to obtain a favorable judicial forum for disputes with us or our
directors, officers, employees or stockholders.
Our Amended Charter will provide (A) (i) any derivative action or proceeding brought on behalf of the
Company, (ii) any action asserting a claim of breach of a fiduciary duty owed by any current or former director,
officer, other employee or stockholder of the Company to the Company or the Company’s stockholders, (iii) any
action asserting a claim arising pursuant to any provision of the Delaware’s General Corporation Law (the
“DGCL”), Amended Charter or our Amended Bylaws (as either may be amended or restated) or as to which the
DGCL confers jurisdiction on the Court of Chancery of the State of Delaware or (iv) any action asserting a claim
governed by the internal affairs doctrine of the law of the State of Delaware shall, to the fullest extent permitted by
law, be exclusively brought in the Court of Chancery of the State of Delaware or, if such court does not have subject
matter jurisdiction thereof, the federal district court of the State of Delaware; and (B) the federal district courts of the
United States shall be the exclusive forum for the resolution of any complaint asserting a cause of action arising
under the Securities Act. Notwithstanding the foregoing, the exclusive forum provision shall not apply to claims
seeking to enforce any liability or duty created by the Exchange Act. Nothing in our Amended Charter or Amended
Bylaws precludes stockholders that assert claims under the Exchange Act from bringing such claims in federal court
to the extent that the Exchange Act confers exclusive federal jurisdiction over such claims, subject to applicable
laws.
91
The choice of forum provision may limit a stockholder’s ability to bring a claim in a judicial forum that it finds
favorable for disputes with us or our directors, officers or other employees, which may discourage such lawsuits
against us and our directors, officers and other employees and result in increased costs for investors to bring a claim.
Alternatively, if a court were to find the choice of forum provision contained in our Amended Charter to be
inapplicable or unenforceable in an action, we may incur additional costs associated with resolving such action in
other jurisdictions, which could harm our business, results of operations and financial condition. For example,
Section 22 of the Securities Act creates concurrent jurisdiction for federal and state courts over all suits brought to
enforce any duty or liability created by the Securities Act or the rules and regulations thereunder. Accordingly, there
is uncertainty as to whether a court would enforce such a forum selection provision as written in connection with
claims arising under the Securities Act. Any person or entity purchasing or otherwise acquiring or holding any
interest in shares of our capital stock shall be deemed to have notice of and consented to the forum provisions in our
Amended Charter. See “Description of Capital Stock—Exclusive Forum.”
The requirements of being a public company may strain our resources, divert management’s attention, and affect
our ability to attract and retain qualified board members and executive officers.
As a public company, we are subject to extensive regulatory and compliance obligations, including those
imposed by the Sarbanes-Oxley Act, the Dodd-Frank Wall Street Reform and Consumer Protection Act, and the
rules and regulations of the SEC and the stock exchange on which our shares are listed.
Compliance with these requirements involves significant legal, accounting, and administrative expenses, as well
as the need to implement and maintain effective internal controls over financial reporting. The process of
establishing and monitoring these controls can be complex and time-consuming, requiring substantial management
attention and resources. Any failure to maintain effective internal controls could result in material misstatements in
our financial statements, leading to regulatory scrutiny, potential penalties, and a loss of investor confidence.
Additionally, the increased public scrutiny and reporting obligations associated with being a public company
may make it more challenging to attract and retain qualified individuals to serve on our board of directors or as
executive officers. The demands of public company governance, coupled with the potential for personal liability,
may deter potential candidates from joining our leadership team. Furthermore, the costs associated with directors’
and officers’ insurance have risen significantly, adding to our financial burden.
While we are committed to meeting our public company obligations and maintaining transparency with our
stakeholders, the ongoing requirements and associated costs may impact our operational efficiency and strategic
focus. Any inability to effectively manage these challenges could have a material adverse effect on our business,
results of operations, and financial condition.
Participation in this offering by our Cornerstone Investors could reduce the public float for our shares.
The Cornerstone Investors have, severally and not jointly, indicated an interest in purchasing up to an aggregate
of $350 million in shares of our Class A common stock in this offering at the initial public offering price and on the
same terms and conditions as the other purchasers in this offering. The shares of Class A common stock to be
purchased by the Cornerstone Investors will not be subject to a lock-up agreement with the underwriters. Because
this indication of interest is not a binding agreement or commitment to purchase, the Cornerstone Investors may
determine to purchase more, fewer, or no shares in this offering, or the underwriters may determine to sell more,
fewer, or no shares to the Cornerstone Investors. The underwriters will receive the same underwriting discount on
any shares of our common stock purchased by the Cornerstone Investors as they will from the other shares sold to
the public in this offering.
If one or more of the Cornerstone Investors are allocated all or a portion (or more) of the shares of Class A
common stock in which they have indicated an interest in purchasing in this offering, and purchase any such shares,
such purchase could reduce the shares of our Class A common stock available for purchase on the open market if the
Cornerstone Investors hold such shares of common stock long term.
92
USE OF PROCEEDS
We estimate that we will receive net proceeds from this offering of approximately $1,668,696,700 (or
$1,920,381,700 if the underwriters exercise in full their option to purchase additional shares of Class A common
stock), based upon an assumed initial public offering price of $25.50 per share (which is the midpoint of the price
range set forth on the cover page of this prospectus) and after deducting estimated underwriting discounts and
commissions and estimated offering expenses payable by us.
The principal purposes of this offering are to create a public market for our Class A common stock, and enable
access to the public equity markets for us and our Class A common stockholders. We intend to use the net proceeds
from this offering for general corporate purposes, including capital expenditures, continued development of our
GeoClusters, expansion of our land holdings portfolio, working capital, and operating expenses. We have not
established specific allocations for the net proceeds among the uses described above, and intend to allocate them in a
manner that best supports our business objectives and strategic priorities. The actual amounts and timing of
expenditures will depend on a number of factors, including the level of proceeds received, business conditions, and
evolving operational needs. If we receive less than the maximum anticipated proceeds, we currently expect to
prioritize working capital and operating expenses, and may defer or reduce other expenditures accordingly. We do
not currently intend to use a material amount of the proceeds of this offering to discharge specific indebtedness or
acquire assets other than in the ordinary course of business. Additionally, we may use a portion of the net proceeds
to acquire or invest in products, services or technologies; the identity of any potential targets is not known at this
time and any such transactions, if pursued, would depend on the availability of suitable opportunities and market
conditions. To the extent disclosure of possible terms or counterparties would jeopardize a potential transaction, we
may limit such disclosure consistent with applicable requirements. However, we do not have binding agreements or
commitments for any material investments outside the ordinary course of our business at this time. We reserve the
right to change the use of proceeds if certain contingencies arise, including shifts in market conditions, strategic
opportunities, or changes in our operating plans, and in such event we may increase or decrease spending among the
potential uses identified above. The timing and amount of our actual expenditures will depend on numerous factors,
including the progress of our research and development activities, the growth of our operations and overall market
conditions. We will have broad discretion in the way that we use the net proceeds of this offering. For additional
information regarding our liquidity, capital resources and anticipated capital expenditures, see “Management’s
Discussion and Analysis of Financial Condition and Results of Operations—Liquidity and Capital Resources.” See
also “Risk Factors — Risks Relating to Owning Our Common Stock — We have broad discretion to determine how
to use the funds we receive from this offering and may use them in ways that may not enhance our results of
operations or the price of our Class A common stock.” for additional information.
Assuming no exercise of the underwriters’ option to purchase additional shares of Class A common stock, each
$1.00 increase (decrease) in the assumed initial public offering price of $25.50 per share (which is the midpoint of
the price range set forth on the cover page of this prospectus) would increase (decrease) the net proceeds to us from
this offering by approximately $65.8 million, assuming the number of shares offered, as set forth on the cover page
of this prospectus, remains the same, and after deducting estimated underwriting discounts and commissions and
estimated offering expenses payable by us.
Each 1.0 million share increase (decrease) in the number of shares offered in this offering would increase
(decrease) the net proceeds to us from this offering by approximately $24.0 million, assuming that the price per
share for the offering remains at $25.50 (which is the midpoint of the price range set forth on the cover page of this
prospectus), and after deducting the estimated underwriting discounts and commissions and estimated offering
expenses payable by us.
93
DIVIDEND POLICY
We have never declared or paid any cash dividends on our capital stock. We currently intend to retain all
available funds and any future earnings, if any, for the operation and expansion of our business. Accordingly,
following this offering, we do not expect to declare or pay any cash dividends in the foreseeable future. Any future
determination to declare cash dividends will be made at the discretion of our board of directors, subject to applicable
laws, and will depend on a number of factors, including our financial condition, results of operations, capital
requirements, contractual restrictions, general business conditions, and other factors that our board of directors may
deem relevant.
Additionally, we are a holding company that transacts a majority of our business through operating subsidiaries.
Consequently, our ability to pay dividends to stockholders is largely dependent on receipt of dividends and other
distributions from our subsidiaries. Certain of our subsidiaries are party to project-level financing arrangements that
contractually restrict or prioritize cash distributions before any amounts can be upstreamed to us.
In addition, our ability to pay dividends is limited by the Credit Agreement, which contains negative covenants
that generally prohibit us and our subsidiaries from making “Restricted Payments,” including dividends and other
distributions, subject to only limited exceptions for certain subsidiary distributions that meet specified conditions,
and may be limited by the agreements governing any indebtedness we or our subsidiaries may incur in the future.
See “Risk Factors — Risks Relating to Owning Our Common Stock — We do not intend to pay dividends on our
common stock for the foreseeable future.” and “Management’s Discussion and Analysis of Financial Condition and
Results of Operations—Liquidity and Capital Resources” for additional information.
94
CAPITALIZATION
The following table sets forth the cash and cash equivalents and our capitalization as of December 31, 2025 on:
•an actual basis;
•as adjusted to give effect to (i) the Stock Split (ii) the filing and effectiveness of our Amended Charter, (iii)
the Preferred Stock Conversion, (iv) the Founder Share Exchange, (v) the Reclassification, (vi) the exercise
in full of the warrants held by Centaurus and (vii) borrowings under the Project Granite Facility and the
repayment of the XRC Facility, in each case as if such event had occurred on December 31, 2025; and
•as further adjusted to give effect to the adjustments described in the preceding clause and to reflect the
issuance and sale by us of 70,000,000 shares of our Class A common stock in this offering at an assumed
initial public offering price of $25.50 per share (which is the midpoint of the price range set forth on the
cover page of this prospectus), after deducting the estimated underwriting discounts and commissions and
estimated offering expenses payable by us, and the application of the net proceeds therefrom as described
under “Use of Proceeds.”
Our capitalization following the closing of this offering will be adjusted based on the actual initial public
offering price and other terms of this offering determined at pricing. You should read this information in conjunction
with our consolidated financial statements and the related notes included elsewhere in this prospectus and the
“Management’s Discussion and Analysis of Financial Condition and Results of Operations” section and other
financial information contained in this prospectus.
As of December 31, 2025 | |||||
(In thousands, except share and per share data) | Actual | As Adjusted (1) | As Further Adjusted (2)(3) | ||
Cash and cash equivalents ............................................................. | $461,836 | $481,209 | $2,149,906 | ||
Indebtedness: | |||||
XRC Facility, Credit Facility and Project Granite Facility (1)(4) ... | 175,600 | 202,306 | 202,306 | ||
Redeemable convertible preferred stock, par value $0.0001 per share; 283,545,547 authorized; 279,995,218 issued and outstanding on an actual basis, no shares issued and outstanding on an as adjusted basis, no shares issued and outstanding on an as further adjusted basis ................................ | 1,022,942 | — | — | ||
Cape Phase I HoldCo - Redeemable noncontrolling interest ......... | 102,586 | 102,586 | 102,586 | ||
Cape Phase I Intermediate HoldCo - Redeemable noncontrolling interest ......................................................................................... | 77,344 | 77,344 | 77,344 | ||
Stockholders' (deficit) equity: | |||||
Common stock, par value $0.0001 per share; 358,278,774 authorized; 13,145,979 issued and outstanding as of December 31, 2025 ................................................................. | 1 | — | — | ||
Class A common stock, par value $0.0001 per share: 1,000,000,000 shares authorized, no shares issued and outstanding on an actual basis, 205,776,919 shares issued and outstanding on an as adjusted basis, 275,776,919 shares issued and outstanding on an as further adjusted basis ............ | — | 21 | 28 | ||
Class B common stock, par value $0.0001 per share: 40,000,000 shares authorized, no shares issued and outstanding on an actual basis, 7,785,414 shares issued and outstanding on an as adjusted basis, 7,785,414 shares issued and outstanding on an as further adjusted basis ....................... | — | 1 | 1 | ||
95
As of December 31, 2025 | |||||
(In thousands, except share and per share data) | Actual | As Adjusted (1) | As Further Adjusted (2)(3) | ||
Preferred stock, par value $0.0001 par value per share: no shares authorized on an actual basis and 10,000,000 shares authorized on an adjusted basis and no shares outstanding on an actual or as further adjusted ................................................. | — | — | — | ||
Additional paid-in capital ............................................................ | — | 1,086,090 | 2,758,354 | ||
Treasury stock, at cost; 375,448 shares on an actual basis, and no shares on an as adjusted basis or an as further adjusted basis .......................................................................................... | (1,960) | — | — | ||
Accumulated deficit ..................................................................... | (244,539) | (289,696) | (293,270) | ||
Total stockholders' (deficit) equity ........................................... | (246,498) | 796,416 | 2,465,113 | ||
Total capitalization ......................................................................... | $1,131,974 | $1,178,652 | $2,847,349 | ||
_________________
(1)The as adjusted consolidated balance sheet data as of December 31, 2025 presents our consolidated balance sheet data to give effect to (i)
the Stock Split, (ii) the Preferred Stock Conversion, (iii) the Reclassification, (iv) the Founder Share Exchange, (v) the filing and
effectiveness of our Amended Charter, (vi) the exercise in full of the warrants held by Centaurus and (vii) borrowings under the Project
Granite Facility and the repayment of the XRC Facility, in each case as if it had occurred on December 31, 2025. Does not reflect the
deduction of debt issuance costs. Accordingly, amounts shown do not correspond directly to those reflected on our consolidated balance
sheet as of December 31, 2025.
(2)The as further adjusted consolidated balance sheet data reflects the items described in footnote (1) above and gives effect to our receipt of
estimated net proceeds from the sale of shares of Class A common stock that we are offering by this prospectus at an assumed initial public
offering price of $25.50 per share, which is the midpoint of the price range on the cover page of this prospectus, after deducting the
estimated underwriting discounts and commissions and estimated offering expenses payable by us. A $1.00 increase (decrease) in the
assumed initial public offering price of $25.50 per share would increase (decrease) each of current assets, total assets and total stockholders’
equity by $65.8 million, assuming that the number of shares offered by us, as set forth on the cover page of this prospectus, remains the
same, and after deducting the estimated underwriting discounts and commissions and estimated offering expenses payable by us.
(3)The as further adjusted data discussed above is illustrative only and will be adjusted based on the actual initial public offering price and
other terms of our initial public offering determined at pricing.
(4)As of April 14, 2026, the XRC Facility was paid off with the proceeds from the Project Granite Facility. As of April 29, 2026, we had an
aggregate of $64.0 million of borrowings outstanding under the Credit Facility. Our Credit Facility has a total capacity of $180.0 million
which consists of the term loan facility and letters of credit facility. See "Management's Discussion and Analysis of Financial Condition and
Results of Operations—Liquidity and Capital Resources—Mercuria Credit Agreement and Letter of Credit Agreement" for a further
description of our Credit Facility.
Each $1.00 increase (decrease) in the assumed initial public offering price of $25.50 per share of our Class A
common stock (which is the midpoint of the price range set forth on the cover page of this prospectus) would
increase (decrease) each of cash and cash equivalents, additional paid-in capital, total stockholders’ equity and total
capitalization on an as further adjusted basis by approximately $65.8 million, assuming the number of shares
offered, as set forth on the cover page of this prospectus, remains the same, and after deducting the estimated
underwriting discounts and commissions and estimated offering expenses payable by us.
Each 1.0 million share increase (decrease) in the number of shares of Class A common stock offered in this
offering would increase (decrease) each of cash and cash equivalents, additional paid-in capital, total stockholders’
equity and total capitalization on an as further adjusted basis by approximately $24.0 million, assuming that the
price per share for the offering remains at $25.50 (which is the midpoint of the price range set forth on the cover
page of this prospectus), and after deducting the estimated underwriting discounts and commissions and estimated
offering expenses payable by us.
The number of shares of Class A and Class B common stock to be issued and outstanding after this offering is
based on 275,776,919 shares of Class A common stock and 7,785,414 shares of Class B common stock outstanding
as of April 29, 2026, after giving effect to the Reclassification, the Founder Share Exchange and the Preferred Stock
Conversion. The number of shares of our Class A common stock to be outstanding after this offering does not
include:
•45,047,677 shares (or 32,407,298 shares, after giving effect to the Stock Split) of Class A common stock
issuable upon exercise of stock options outstanding as of April 29, 2026 under our 2019 Plan, with a
96
weighted average exercise price of $1.75 per share (or $2.43 per share, after giving effect to the Stock
Split); and
•40,778,984 shares of Class A common stock and Class B common stock reserved for future issuance under
our equity compensation plans, consisting of:
◦35,107,737 shares of Class A common stock and Class B common stock reserved for future issuance
under the 2026 Plan, which will become effective in connection with this offering, as well as any
automatic increases in the number of shares of Class A common stock and Class B common stock
reserved for future issuance under the 2026 Plan; and
◦5,671,247 shares of Class A common stock reserved for future issuance under the ESPP, which will
become effective in connection with this offering, as well as any automatic increases in the number of
shares of Class A common stock reserved for future issuance under the ESPP.
97
DILUTION
If you invest in our Class A common stock in this offering, your ownership interest will be diluted to the extent
of the difference between the initial public offering price per share of our Class A common stock and the as further
adjusted net tangible book value per share of our common stock immediately after this offering. Net tangible book
value dilution per share to new investors represents the difference between the amount per share paid by purchasers
of shares of our Class A common stock in this offering and the as further adjusted net tangible book value per share
of our common stock immediately after this offering.
Net tangible book value (deficit) per share is determined by dividing our total tangible assets less our total
liabilities by the number of shares of our common stock outstanding. Our historical net tangible book value (deficit)
as of December 31, 2025 was $897.7 million, or $4.20 per share. Our adjusted net tangible book value as
of December 31, 2025 was $917.6 million, or $4.30 per share, based on the total number of shares of our common
stock outstanding as of December 31, 2025 after giving effect to the Stock Split, the Preferred Stock Conversion, the
Founder Share Exchange, the Reclassification, the exercise in full of the warrants held by Centaurus, borrowings
under the Project Granite Facility and repayment of the XRC Facility.
After giving effect to the sale by us of 70,000,000 shares of our Class A common stock in this offering at the
assumed initial public offering price of $25.50 per share, which is the midpoint of the estimated offering price range
set forth on the cover page of this prospectus, and after deducting underwriting discounts and commissions and
estimated offering expenses payable by us, our as further adjusted net tangible book value to give effect to this
offering as of December 31, 2025 would have been $2.6 billion, or $9.12 per share. This represents an immediate
increase in adjusted net tangible book value of $4.82 per share to our existing stockholders and an immediate
dilution in as further adjusted net tangible book value of $16.38 per share to investors purchasing shares of our Class
A common stock in this offering at the assumed initial public offering price. The following table illustrates this
dilution:
Assumed initial public offering price per share of Class A common stock ........... | $25.50 | ||
Historical net tangible book value (deficit) per share as of December 31, 2025 ... | $4.20 | ||
Increase per share attributable to the adjustments described above ....................... | 0.10 | ||
As adjusted net tangible book value per share as of December 31, 2025 .............. | 4.30 | ||
Increase in adjusted net tangible book value per share attributable to investors purchasing shares of Class A common stock in this offering ............................ | 4.82 | ||
As further adjusted net tangible book value per share immediately after this offering ............................................................................................................... | $9.12 | ||
Dilution in adjusted net tangible book value per share to investors in this offering ............................................................................................................... | $16.38 |
Each $1.00 increase (decrease) in the assumed initial offering price of $25.50 per share, which is the midpoint
of the price range set forth on the cover page of this prospectus, would increase (decrease) the total consideration
paid by new investors and average price per share paid by all stockholders by $70.0 million and $0.25 per share,
respectively, assuming that the number of shares of Class A common stock offered by us, as set forth on the cover
page of this prospectus, remains the same, and after deducting underwriting discounts and commissions, and
estimate offering expenses payable by us. Each increase (decrease) of 1.0 million shares in the number of shares of
Class A common stock sold in this offering, as set forth on the cover page of this prospectus, would increase
(decrease) the total consideration paid by new investors and average price per share paid by all stockholders by
$25.5 million and $0.05 per share, respectively, assuming that the assumed initial public offering price of $25.50 per
share, which is the midpoint of the price range set forth on the cover page of this prospectus, remains the same.
The following table presents, on an as adjusted basis as of December 31, 2025, after giving effect to (i) the
Preferred Stock Conversion, (ii) the Reclassification, (iii) the Founder Share Exchange, (iv) the sale by us of shares
of our Class A common stock in this offering at the assumed initial public offering price of $25.50 per share, which
is the midpoint of the estimated offering price range set forth on the cover page of this prospectus and (v) the
exercise in full of the warrants held by Centaurus, the difference between the existing stockholders and the investors
98
purchasing shares of our Class A common stock in this offering with respect to the number of shares of our Class A
common stock purchased from us, the total consideration paid or to be paid to us, and the average price per share
paid or to be paid to us, before deducting estimated underwriting discounts and commissions and estimated offering
expenses payable by us:
Shares Purchased | Total Consideration | Average price per Share | |||||||
Number | Percent | Amount | Percent | ||||||
Existing stockholders before this offering ........................................... | 213,562,333 | 75.31% | $1,028,851,360 | 36.56% | $4.82 | ||||
Investors participating in this offering | 70,000,000 | 24.69% | $1,785,000,000 | 63.44% | $25.50 | ||||
Total .................................................. | 283,562,333 | 100.00% | $2,813,851,360 | 100.00% | $9.92 | ||||
The total consideration paid by existing stockholders presented in the table above represents the aggregate cash
consideration historically paid by such stockholders for their shares and differs from the additional paid-in capital, as
adjusted, presented in the capitalization table by approximately $57.2 million, which difference is attributable to
non-cash accounting entries (including the fair value increment recognized upon the Centaurus warrant exercise,
treasury stock reclassifications, and other non-cash equity adjustments) that are reflected in additional paid-in capital
under U.S. GAAP but do not constitute consideration paid by stockholders.
If the underwriters exercise in full their option to purchase 10,500,000 additional shares of our Class A common
stock in this offering, the as further adjusted net tangible book value (deficit) per share after this offering would be
$9.65 per share and the dilution to new investors in this offering would be $15.85 per share. If the underwriters
exercise such option in full, the number of shares held by new investors will increase to approximately 80,500,000
shares of our Class A common stock, or approximately 27.38% of the total number of shares of our common stock
outstanding after this offering.
The total number of shares of Class A common stock and Class B common stock that will be outstanding
immediately after this offering is based on 275,776,919 shares of our Class A common stock and 7,785,414 shares
of our Class B common stock outstanding as of December 31, 2025, and after giving effect to the Preferred Stock
Conversion, the Founder Share Exchange and the Reclassification, and excludes:
•45,047,677 shares (or 32,407,298 shares, after giving effect to the Stock Split) of Class A common stock
issuable upon exercise of stock options outstanding as of April 29, 2026 under our 2019 Plan, with a
weighted average exercise price of $1.75 per share (or $2.43 per share, after giving effect to the Stock
Split); and
•40,778,984 shares of Class A common stock and Class B common stock reserved for future issuance under
our equity compensation plans, consisting of:
◦35,107,737 shares of Class A common stock and Class B common stock reserved for future issuance
under the 2026 Plan, which will become effective in connection with this offering, as well as any
automatic increases in the number of shares of Class A common stock and Class B common stock
reserved for future issuance under the 2026 Plan;
◦5,671,247 shares of Class A common stock reserved for future issuance under the ESPP, which will
become effective in connection with this offering, as well as any automatic increases in the number of
shares of Class A common stock reserved for future issuance under the ESPP.
The dilution information discussed above is illustrative only and may change based on the actual initial public
offering price and other terms of this offering. To the extent any options are granted and exercised in the future,
there may be additional economic dilution to new investors.
In addition, we may choose to raise additional capital due to market conditions or strategic considerations, even
if we believe we have sufficient funds for our current or future operating plans. To the extent that we raise additional
capital through the sale of equity, as Class A common stock, or other securities that are convertible into our Class A
99
common stock, such as convertible debt securities, the issuance of these securities could result in further dilution to
our stockholders.
100
MANAGEMENT’S DISCUSSION AND ANALYSIS OF FINANCIAL CONDITION AND RESULTS OF
OPERATIONS
The following discussion and analysis of Fervo’s financial condition and results of operations should be read
with our audited consolidated financial statements and notes thereto included elsewhere in this prospectus. Certain
of the information contained in this discussion and analysis or set forth elsewhere in this prospectus, including
information with respect to plans and strategy for our business, includes forward-looking statements that involve
risks and uncertainties. As a result of many factors, including those factors set forth in the section “Risk Factors,”
our actual results could differ materially from the results described in or implied by the forward- looking statements
contained in the following discussion and analysis. Refer to the section entitled “Risk Factors” to gain an
understanding of the important factors that could cause actual results to differ materially from our forward-looking
statements. For more information, see the section entitled “Cautionary Note Regarding Forward-Looking
Statements.”
Unless otherwise indicated or the context otherwise requires, references in this section to the “Company,”
“we,” “us,” “Fervo,” or “our” refer to the business of Fervo Energy Company.
Overview
We are a geothermal energy developer that builds, owns, and operates geothermal power facilities. As the
pioneer of EGS, we are commercializing a new category of firm, 24/7 power that is scalable, rapidly deployable, and
geographically flexible. We apply proven technologies, such as horizontal drilling, multistage hydraulic fracturing,
and enhanced subsurface monitoring, to design and control subsurface flow pathways, enabling predictable heat
recovery without reliance on rare natural fracture networks. This standardized, repeatable approach addresses the
scalability and development risks that have historically constrained traditional geothermal and positions EGS to
deliver reliable, cost-competitive power with a clear path to learning curve-driven cost declines.
We are advancing from demonstration to utility-scale commercialization; we expect to begin delivering first
power from our 500-megawatt Cape Station project by late 2026, and to reach approximately 100 megawatts of
operating capacity by early 2027. Our execution track record and standardized development model, combined with
meaningful commercial traction, differentiate us from alternatives still facing technology risk, prolonged timelines,
permitting uncertainty, and supply chain constraints. Across our full portfolio, we have signed 658 megawatts of
binding PPAs with credit-worthy utility and corporate buyers, including Southern California Edison, Google / NV
Energy and Shell. These PPAs represent approximately $7.2 billion in potential revenue backlog, and we are
actively engaging energy buyers for additional capacity. Building on this traction, we have entered into a 3-gigawatt
GFA, creating a repeatable commercial model that we believe can accelerate deployment and position Fervo to meet
growing demand from hyperscale customers. We believe this momentum, combined with our scalable technology
and development playbook, positions us to help close the nation’s capacity gap with dependable, around-the-clock
clean power.
Our Business Model
We generate revenue through the provision of reliable and cost-competitive firm power to our customers. By
leveraging proven oil and gas technology deployed for successful wellfield development in the shale industry, we
are transforming geothermal energy into a scalable, reliable, and cost-competitive power solution to meet the U.S.’s
growing electricity demand.
We intend to generate most of our revenue by entering into PPAs with utilities, hyperscalers and other market
participants, which allow us to sell electricity under long-term contracts at agreed-upon prices, thereby creating a
stable and predictable income stream for our business. Our PPAs customarily have initial contract terms that average
15 years, providing us with significant cash flow visibility over an extended period. Additionally, our PPAs are
generally structured with fixed or indexed pricing, substantially reducing exposure to fluctuations in electricity
market prices over the contract term. We believe the long-term nature of our PPA portfolio enhances the resilience
of our business model and provides significant cash flow visibility for investors and stakeholders.
101
Additionally, we believe we qualify for federal tax credits, including certain investment and production tax
credits available under the Internal Revenue Code, which provide incremental value uplift to our project economics
and financing strategy. We intend to monetize tax credits primarily through partnerships with investors and through
the sale and transfer of tax credits to buyers, which we believe will provide an efficient source of liquidity to fund
our development and construction activities. For example, on April 10, 2026, we entered into an agreement with
Liberty Mutual Insurance Company to sell and transfer tax credits generated at Cape Station Phase I. This
monetization supports capital deployment for our utility-scale geothermal projects such as Cape Station, where tax
credits enhance project economics and investor confidence.
As of December 31, 2025, we have entered into 658 megawatts of PPAs with utilities, hyperscalers, and
community choice aggregators. As we scale our EGS operations, we intend to continue entering into new PPAs to
underpin future growth and reinforce our leadership in sustainable baseload power generation. Beyond our current
contracted backlog, we have also entered into a 3-gigawatt framework agreement with Google to advance and
structure potential power offtake opportunities for current and planned data centers in both grid-connected and
alternative energy solutions. The GFA establishes a framework under which we are required to propose projects
totaling at least one gigawatt of capacity within two years, with Google retaining discretion to accept or decline each
proposal. While the GFA does not constitute contracted offtake, we believe the agreed-upon pricing parameters and
priority geographies position us to potentially accelerate the development of up to one gigawatt of geothermal power
capacity. For more information, see “Business — Google Geothermal Framework Agreement,” and “Risk Factors
—The GFA is a non-binding agreement, and does not obligate Google to purchase power from us.”
Key Factors Affecting Our Business and Results of Operations
The growth and future success of our business depends on many factors. While each of these factors presents
significant opportunities for our business, they also pose important challenges that we must successfully address in
order to sustain our growth, improve our results of operations and achieve and maintain our long-term profitability.
Our ability to commence and expand commercial operations
The success of our business model is highly dependent on our ability to commence and scale commercial
operations at our Cape Station site and future locations in a capital-efficient and timely manner. Our ability to be
profitable and generate positive operating cash flows is primarily dependent on our ability to generate revenues
through the sale of electricity pursuant to our PPAs. Through monetization of our tax credits and our other assets,
including any intellectual property, data, or advisory arrangements that may be pursued in the ordinary course, we
expect to further improve profitability.
Our ability to sell electricity depends on our ability to successfully commence and maintain production under
our PPAs. We are currently targeting a COD of approximately 100 megawatts at our Cape Station GeoCluster by
early 2027. However, there is no guarantee that we will achieve such CODs within those timeframes or at all.
Failure to drill and complete wells to target length and temperature, commission balance-of-plant systems, and
interconnect to the grid, among other things, could result in delays in commencing production or expanding
capacity. For more information, see “Risk Factors—Risks Related to Our Business — If the energy production by or
availability of our power plants is less than expected, they may not be able to satisfy minimum production or
availability requirement obligations under our PPAs.”
Commencement and expansion of our commercial operations are further dependent on securing and maintaining
permits, rights‑of‑way, land access, water rights, transmission interconnection, and approvals from federal, state, and
local authorities, and on our ability to satisfy ongoing operational compliance obligations. Any delay in obtaining or
maintaining such permits or approvals, or the imposition of additional requirements or legal challenges, could
postpone commissioning timelines, reduce capacity factors, or increase costs.
The successful development of our project pipeline depends on our ability to obtain sufficient interconnection
and transmission capacity to support delivery obligations under our PPAs. For example, for Cape Station Phase II,
we currently have approximately 290 megawatts of interconnection and transmission rights. This capacity is
sufficient to meet the obligations under our original PPAs with Southern California Edison (SCE) and Clean Power
Alliance (CPA), but is insufficient to support the full 384 megawatts of combined contracted capacity with the
102
subsequent expansions of the SCE and CPA PPAs. If we are unable to secure additional interconnection and
transmission capacity or alternative delivery arrangements on a timely basis or at all, our original PPAs would
remain in effect; however, we may be unable to deliver the additional megawatts of contracted capacity, which could
result in reduced revenues, payment of liquidated damages, contract modifications or terminations, or other adverse
effects on our business and financial condition.
We expect that, as we achieve COD at Cape Station and progressively ramp up production, our revenue
contribution from our PPAs will increase, and our cost structure will benefit from wellfield optimization,
learning‑curve efficiencies, and disciplined project execution. We also expect to benefit from the operational
resiliency afforded by utilizing multiple ORC turbine units capable of operating independently, enabling scheduled
maintenance or unplanned outages on a single unit to be isolated without requiring a full plant shutdown and
supporting higher availability over time. We further expect that expanding our installed capacity in a staged and
capital‑efficient manner, aligned with contracted offtake and available interconnection or co-location opportunities,
will enhance cash generation through a combination of electricity sales, tax credit monetization, and select
commercialization of our intellectual property and data.
Our ability to capitalize on the increased surge in national power demand
Our revenues depend in large part upon our PPAs with third-party off-takers. We have executed 658 megawatts
of binding PPAs with credit-worthy utility and corporate energy buyers, including Southern California Edison,
Google / NV Energy, and Shell. These contracts collectively represent over $7.2 billion in potential revenue
backlog. We are also in active discussion with offtakers for additional capacity. In addition to those contracts, we
have entered into a 3-gigawatt GFA with Google that we believe establishes a repeatable commercial model to
accelerate deployment and capitalize on rapidly expanding demand from hyperscale customers.
Our growth and ability to renew and enter into additional long-term PPAs is dependent on continued power
demand from utilities, corporate energy buyers and hyperscalers. Recently, demand has been driven by the rapid
increase in AI data center development and accelerating electrification across transportation, buildings, and industry,
which has contributed to record power consumption and substantial new market opportunities for energy suppliers.
At the same time as hyperscale data centers seek gigawatt-level connections to power their AI workloads, utilities
and generators have seen unprecedented requests for electricity supply. The Pew Research Center reports U.S. data
centers accounted for over 4.0% of national electricity use in 2024, with forecasts projecting demand to double or
triple by the end of the decade as AI models grow in size and complexity. In the short-term, we expect that the
heightened demand for reliable, large-scale generation will continue to support our engagement of long-term
contracts to supply power.
However, actual demand is subject to material uncertainty due to factors outside of our control, such as
technology advances, energy efficiency gains, and cyclical changes in potential customer investment patterns.
During periods of elevated wholesale prices, we may secure attractive PPA pricing and terms; however, when prices
decline or competition intensifies, negotiating advantageous PPAs can become more challenging. For projects where
prices are already locked in under long-term PPAs, typically for 15 years, we are more insulated from these changes.
This volatility complicates financial forecasting and capital planning for standardized GeoBlocks across our
GeoClusters and could reduce revenue visibility. In addition, if energy buyers prioritize lowest cost intermittent
options or defer procurement due to market uncertainty, our ability to execute programmatic offtake could be
impacted. In response, our strategy emphasizes flexibility, resilience, and ongoing assessment of portfolio alignment
with anticipated customer needs. Sustained growth will depend on our ability to adapt to evolving electricity usage
patterns and maintain disciplined capital allocation in the face of both opportunity and risk. Additionally, over time,
we expect the cost of our GeoBlocks to decrease as we accelerate our learning and scale our business, which we
believe will make us an attractive source of energy even during periods of decreased demand or heightened
competition. For more information, see “Risk Factors—Risks Related to Our Business— Expectations regarding
load growth may not materialize, and our business prospects could be harmed if geothermal energy is not widely
adopted or sufficient demand for geothermal systems does not develop or takes longer to develop than we
anticipate.”
103
In the short term, we expect that the current surge in electricity demand, particularly from AI-related data center
development, will continue. Assuming timely execution of our development plans, we anticipate our revenue will
increase on an absolute basis in response to such demand growth. Over the long term, we expect aggregate
electricity demand to moderate and ultimately level off from recent growth rates while remaining significantly
higher-than-expected current levels, and we anticipate our revenue will continue to expand as we are able to bring
additional power supply to market.
Our ability to manage our supply chain and operating expenses as a result of inflation and high development
costs
As a capital-intensive business that is commercializing enhanced geothermal systems to deliver clean, firm
power, our success is highly dependent on our ability to manage inflationary pressures and development and
operating costs. As we scale our standardized GeoBlock power plants and associated wellfield development within
our GeoClusters, we have been, and expect to continue to be, exposed to inflationary pressures and cost escalation
across our supply chain, including drilling and completions services, steel casing and wellheads, stimulation
consumables, turbines and heat exchangers for our ORC units, power electronics, construction labor, logistics, and
interconnection-related equipment and services. These factors, alongside higher development, labor, and overhead
costs, can increase operating expenses and extend development timelines.
Our success also depends on timely access to critical equipment and services, including turbines, generators,
heat exchangers, drilling rigs, tubulars, completion equipment, and power electronics. While the procurement of
eight 50-megawatt ORC turbines for Cape Station Phase II locks in a significant portion of our near-term surface
facilities scope, delays or cost escalations in other long lead items or drilling services could impact our schedule and
capital budget. In addition, the imposition of tariffs, trade restrictions, or inflationary pressures on steel, specialty
alloys, power equipment, or other supplied components could have a material adverse effect on our operations and
unit economics.
We continue to work with our commercial and supply chain partners to mitigate inflation and cost escalation
through multiyear procurement, standardized equipment specifications, and sustained operations within multi-
gigawatt GeoClusters to capture economies of scale. Management has evaluated the potential impact of supply chain
and raw materials factors on our business and believes that our modular, standardized plant design and a phased
wellfield development approach can mitigate schedule risk and soften cost impacts over time; however, there can be
no assurance that such measures will fully offset macroeconomic or supply chain pressures.
If the costs of power-generation equipment, drilling and completion services, steel and other raw materials, or
balance-of-plant equipment increase, we may be unable to fully recover those increases from customers under our
existing contracts. Where our commercial arrangements include pricing mechanisms or escalators, higher input costs
may be reflected in delivered power prices, but there is no assurance these provisions will fully offset inflationary or
development cost pressures, which could negatively affect our margins and results of operations.
We expect that as we scale our GeoBlocks and GeoClusters and realize learning curve efficiencies and
economies of scale, we will improve our ability to manage operating expenses. Over the long term, we believe these
efficiencies will support improved profitability and margin expansion of our business.
Our ability to enhance our productivity and improve our cost structure through technological innovation
Our operating performance and cost competitiveness will depend on our ability to increase productivity and
lower costs over time. Achieving these outcomes will require continued technology development, standardization,
and integration for which magnitude and timing of any benefits are uncertain.
We expect that the continued development of additional wells at Cape Station and other sites will yield further
operational learnings and technology enhancements which, over time, will support higher net generation per well
and higher project returns. With our procurement of eight 50-megawatt ORC turbines for a 400-megawatt Cape
Phase II deployment at Cape Station, we have established a standardized power plant design that we expect to use
for years to come. We believe that this standardization will allow us to achieve economies of scale in our power
generation supply chain by fixing the nameplate generating capacity of our surface facilities and sizing our wellfield
104
accordingly, rather than designing bespoke power generation systems sized to fit the initial subsurface productivity
at any single site. By decoupling surface plant design from subsurface variability and executing repeated well
designs, we expect to benefit from parallel-tracked iterative improvement that incrementally improves well
performance while reducing facilities cost and schedule.
Our ability to increase energy output and reduce cost per megawatt-hour depends on consistently advancing and
integrating our technology stack across subsurface, surface, and digital operations. We apply horizontal drilling,
multistage stimulation, and engineered reservoir design to expand heat transfer surface area and drive higher gross
power per well, while standardizing power conversion in 50-megawatt, air‑cooled ORC GeoBlocks to compress
cycle times and accelerate learning curves. As we scale, we leverage high-fidelity downhole fiber‑optic data,
proprietary computational models, and AI-enabled analytics to optimize well placement, drilling and completions
design and execution, and plant operations to increase capacity factor, reduce downtime, and improve thermal sweep
over the life of each reservoir. Realizing these efficiency gains requires continued progress along drilling and
completions learning curves, reliable access to specialized equipment and services, and effective integration of
digital tools with field execution.
Our recent development progression illustrates these learning effects. From Project Red to Cape Station, we
advanced from approximately 3,000-foot lateral length wells targeting 365°F rock to approximately 5,000-foot
lateral length wells targeting 400°F rock. In June 2025, we drilled our deepest well to date, a vertical observation
well that has a total depth of 15,774 feet that is projected to reach a bottomhole temperature of 550 °F after full
thermal equilibration. In March 2026, we also finished drilling the first well of our next major well design,
consisting of a well drilled with an approximately 7,500 foot lateral length targeting 425°F rock. We believe these
subsurface improvements, paired with a standardized power plant design, will support higher individual well output,
improved field productivity, and more predictable cost and schedule execution across modules. We ultimately aim to
increase production per well by accessing higher-temperature resources and extending lateral lengths, but there is no
certainty that this can be achieved. These expectations are subject to the risks inherent in subsurface development,
including geologic heterogeneity, drilling and completion performance, reservoir thermal drawdown, induced
seismicity management, and water sourcing and disposal constraints.
Underperformance in reservoir productivity, delays in wellfield construction, insufficient data quality, or
inaccuracies in our models could lead to higher than expected capital intensity, lower realized output per well, or
elevated operating costs. Moreover, failure to standardize and replicate our GeoBlock design, or to integrate turbine,
balance‑of‑plant, and control systems as planned, may limit our ability to translate improvements from one
deployment to the next. If we do not achieve anticipated technology-driven gains in drilling speed, lateral length,
temperature targeting, thermal energy recovery and ORC performance, we may be unable to deliver expected per-
kilowatt cost reductions or step‑ups in gross megawatt productivity per well.
Our ability to obtain additional capital to fund more GeoCluster and GeoBlock deployments
We operate in a capital-intensive industry and our strategy depends on sustained access to both project and
corporate-level capital to finance drilling, completions, and standardized 50-megawatt ORC power units within our
multi-gigawatt GeoClusters. As we scale construction and development of our projects, we expect periods of
negative operating cash flow, particularly at our Cape Station GeoCluster, where 500 megawatts is under
construction with staged energization. Although we have executed binding PPAs which provide a substantial
contracted revenue backlog, our ability to convert these commercial arrangements into operating projects relies on
timely and cost-effective access to external financing.
Sources of funding for our development include project and corporate-level equity, term debt, construction
financing and bridge loans, tax equity, as well as contracted revenue under long-term PPAs and forward sales of tax
credits. Since our inception, we have successfully accessed multiple sources of capital and have built a robust
financing function capable of securing funding across our capital stack. As of December 31, 2025, we have raised
approximately $1.2 billion in corporate-level capital, while also raising $320.0 million in connection with project-
level debt and equity. Subsequently, on March 6, 2026 we closed an approximately $421.4 million project finance
credit facility with a syndicate of nine lenders for Cape Phase I.
105
If capital is unavailable on acceptable terms or within required timeframes, we may be forced to delay, scale
back, or reprioritize GeoBlocks, defer interconnections, or restructure project scopes. Financing availability and cost
are influenced by conditions in capital markets, interest rate environments, lender appetite, and our operating
performance, including the pace at which we realize drilling and subsurface learning curves, achieve expected power
outputs, and maintain construction schedules and budgets. Even with our standardized design, secured geothermal
mineral rights, and maturing supply chain relationships with blue-chip service providers and equipment
manufacturers, we face risks of cost inflation, schedule slippage, and equipment delivery delays that can increase
required funding or compress returns, which in turn may limit financing availability. While project-level, non-
dilutive capital can delay our need to raise funds at the corporate level, there can be no assurance that such financing
will be available at scale or that it will fully fund our development plans. In addition, certain funding sources are
milestone-based or conditioned on project progress, and cost overruns or schedule delays could affect the
availability and timing of such funding.
As we continue to finance additional projects, we are identifying and executing on the optimal cost of capital,
reducing financing costs and increasing local project profitability. We expect our disciplined financing model to
continue to position us to fund GeoCluster and GeoBlock buildout efficiently across market cycles. However, there
is no assurance we will continue to have access to such lower-cost sources of capital. Any shortfall could require us
to raise additional dilutive equity, incur higher-cost debt, monetize contracted offtake or other assets on unfavorable
terms, or slow execution of our GeoCluster buildout. If we cannot obtain adequate capital when needed, we may be
unable to meet contractual obligations under PPAs, achieve planned cost reductions from modular replication, or
deliver capacity on the timelines our customers expect, which could materially and adversely affect our business,
liquidity, financial condition and operations.
Our ability to secure and monetize government incentives and tax credits
A portion of our project economics and capital deployment strategy relies on the availability and monetization
of federal tax credits, including investment and production tax credits established under current energy legislation.
We intend to monetize these tax credits primarily through tax equity partnerships and through the sale and transfer
of tax credits to buyers, which support reductions in upfront development costs and provide additional liquidity for
our EGS projects. Any changes to tax credit policies, qualification criteria, or legislative sunsets represent a risk to
our business model and financial performance. Additionally, growing regulatory complexity, including enhanced
compliance requirements, could hinder our ability to claim or transfer tax credits effectively. The potential early
expiration or curtailment of tax incentives could delay project timelines and reduce returns, adversely impacting our
growth prospects.
We expect that continued access to investment and production tax credits will enhance our project economics
and accelerate our commercialization timetable, enabling a more rapid scale-up of our geothermal portfolio.
Non-GAAP Financial Measures
We do not currently present Adjusted EBITDA or other non-GAAP financial measures in this prospectus, as our
operations to date have been primarily pre-commercial development activities. However, we intend to begin
presenting Adjusted EBITDA in the future once we commence commercial operations at Cape Station, to provide
investors with additional insights into our operating performance and cash flow generation from power sales.
Adjusted EBITDA will be defined as net income (loss) adjusted to exclude interest expense, income taxes,
depreciation and amortization, share-based compensation, and other non-recurring or non-cash items that
management believes do not reflect the underlying performance of our geothermal projects and our business. We
believe that presenting Adjusted EBITDA will complement the most directly comparable GAAP financial measures
and assist investors in evaluating our financial condition, operational trends, and progress toward scalability post-
commercialization. This disclosure is made in anticipation of our transition to revenue-generating operations
following the closing of this offering.
106
Components of Results of Operations
Revenues
Sources of Revenue
Our revenue generation is primarily driven by the sale of electricity from geothermal resources, facilitated
through long-term PPAs with utilities and other entities. In 2025 and 2024, we successfully secured multiple long-
term PPAs, laying the groundwork for substantial operational activities which we expect to commence beginning in
late 2026. Pricing under these PPAs is generally fixed for the duration of the contract, although some of the
Company’s PPAs may have price escalators based on an index or other rates specified in the applicable PPA. Our
most near-term PPA is an arrangement with Shell for a guaranteed capacity of 31 megawatts, with a delivery term of
15 contract years and a scheduled commercial operation date in late 2026. We also have PPAs with Southern
California Edison, Google / NV Energy, Clean Power Alliance, Desert Community Energy, and Calchoice for a total
of 658 megawatts with similar 15 year contracted terms. As our development projects achieve commercial operation
beginning in late 2026, we expect revenues to increase significantly from the current early-stage levels, providing
stable, long-term cash flows from contracted electricity sales.
Revenue from our geothermal power sales under existing PPAs does not include a transfer of tax attributes
(including tax credits), which we plan to separately monetize through tax equity arrangements or through the sale
and transfer of tax credits to buyers.
Revenue generated during the years ended December 31, 2025 and 2024 includes ancillary fees associated with
rights to geothermal production, which are not expected to be significant to our revenue generation activities in the
future.
Costs and Expenses
Operation and Maintenance
Operation and maintenance expenses consist of site‑based costs incurred to operate, service, and maintain our
installed geothermal test wells, related field infrastructure, and reservoir evaluation activities. These costs include
contracted field labor, geological and geophysical services, reservoir and engineering support, seismic surveys,
equipment rentals, materials and supplies, routine inspections, and repair and maintenance activities, as well as
ongoing technical support necessary to sustain field operations.
Operation and maintenance expenses are incurred on an ongoing basis to support geothermal site evaluation and
development activities and to maintain the performance of our test systems. These costs exclude corporate overhead
and administrative functions, which are recorded in general and administrative expenses. Operation and maintenance
expenses are expensed as incurred in accordance with GAAP. We expect operation and maintenance expenses to
increase significantly as Cape Station reaches COD and field activities transition from testing and evaluation to
sustained operations.
Research and Development Expenses (Income), Net
R&D expenses (income), net consist primarily of costs associated with the development of our proprietary
enhanced geothermal systems technology, including advanced computational models, horizontal drilling techniques,
and distributed fiber optic sensing systems. These expenses encompass engineering design, technical personnel
costs, field testing, data analysis, and the development of our proprietary geothermal well and reservoir engineering
solutions.
R&D expenses (income), net are expensed as incurred in accordance with GAAP and are presented net of grant
proceeds received from the U.S. Department of Energy and other government agencies that support our technology
development initiatives. In certain periods, grant proceeds may exceed gross R&D expenditures, resulting in the
presentation of net R&D income. Our R&D investments are critical to maintaining our technological leadership in
EGS and achieving the cost reductions and performance improvements necessary to scale our operations and deliver
competitive baseload renewable power.
107
Because R&D activities are central to our business model and long‑term technology roadmap, we expect R&D
spending to continue as we advance new initiatives, although the level of expense may fluctuate depending on the
stage and scale of specific development programs.
General and Administrative Expenses
General and administrative expenses include costs related to corporate management and support functions, such
as general management, legal, accounting, finance, human resources, sales, marketing, and other functions not
directly associated with revenue generating activities. These expenses are expensed as incurred.
We expect our general and administrative expenses to increase as we continue to grow our personnel headcount
to support our R&D activities, construction activities and expansion of our operations as we progress toward
commercial operations. We also anticipate increased expenses associated with operating as a public company,
including costs for audit, legal, regulatory and tax compliance with the rules and regulations of the SEC and
NASDAQ listing standards, as well as increased director and officer insurance premiums and investor relations
costs.
Operating Lease Expenses
Operating lease expenses, prior to us generating power, consist of annual lease payments for geothermal
resource rights across our 595,900 acre portfolio in California, Colorado, Idaho, Nevada, New Mexico, Utah and
Washington as of December 31, 2025. These payments, made to the Bureau of Land Management, state agencies,
and private landowners, maintain our exclusive access to subsurface geothermal resources during the exploration,
development, and construction phases of our projects. Operating lease expenses also include costs for office
facilities and equipment rentals necessary to support our operations. We recognize operating lease expenses on a
straight-line basis over the lease term in accordance with Accounting Standards Codification (“ASC”) 842. These
lease payments are critical to securing our extensive land position and development pipeline while we advance
projects toward commercial operation. Once we start to generate power, our lease agreements are structured such
that we will pay a royalty that is a percentage of revenue received from the sale of power and other attributes over
the leased land.
Depreciation and Amortization
Depreciation and amortization primarily reflects the depreciation of property, plant and equipment placed in
service, including leasehold improvements and equipment.
Other Income (Expense)
Interest Income and Expense
Interest income consists of interest earned on our cash and cash equivalents, while interest expense consists of
interest incurred on our Mercuria Credit Agreement and Credit Facility.
Other Non-Operating Expense
Other non-operating expense consists primarily of non‑cash fair value remeasurement gains or losses on warrant
and derivative liabilities, as well as state franchise tax expense.
108
Results of Operations
The following table sets forth our results of operations for the years indicated:
Year Ended December 31, | Change | ||||||
(Dollars in thousands, except percentages) | 2025 | 2024 | $ | % | |||
Revenues ............................................................ | $138 | $199 | $(61) | (31)% | |||
Costs and expenses: | |||||||
Operation and maintenance ............................. | 388 | 380 | 7 | 2% | |||
Research and development income, net ............ | (133) | (97) | (36) | 37% | |||
General and administrative expenses ............... | 38,718 | 34,735 | 3,983 | 11% | |||
Operating lease expenses ................................. | 9,681 | 6,895 | 2,786 | 40% | |||
Depreciation and amortization .......................... | 290 | 124 | 167 | 135% | |||
Operating loss ................................................ | (48,806) | (41,838) | (6,969) | 17% | |||
Other income (expense): | |||||||
Interest income ................................................ | 4,192 | 1,787 | 2,405 | 135% | |||
Interest expense ............................................... | (8,406) | (766) | (7,640) | 997% | |||
Other non-operating expense ............................ | (4,767) | (237) | (4,529) | 1909% | |||
Loss before income taxes ............................... | (57,787) | (41,054) | (16,733) | 41% | |||
Income tax expense .......................................... | (1) | (56) | 55 | (99)% | |||
Net loss ............................................................... | $(57,788) | $(41,110) | $(16,678) | 41% | |||
Revenues
Revenues decreased by less than $0.1 million in 2025 compared to 2024. Revenues in 2025 and 2024 relate to
ancillary fees associated with rights to geothermal production at Project Red. This type of revenue is not expected to
be significant to our long-term revenue generation, as we have not yet commenced large-scale commercial
operations. The change was not material to overall results.
Operation and Maintenance
Operation and maintenance expenses increased by less than by $0.1 million in 2025 compared to 2024. The
increase was primarily attributable to modest increases in contracted labor, engineering support and site evaluation
activities. The change was not material to overall results.
Research and Development Expense (Income), Net
R&D expenses (income), net were relatively consistent between 2025 and 2024. Gross R&D expenses
decreased by $2.7 million, primarily due to the completion of development activities related to Project Red
following its achievement of commercial operations in 2024. This decrease was largely offset by a $2.6 million
reduction in grant proceeds due to lower qualifying expenditures under U.S. Department of Energy programs.
General and Administrative Expenses
General and administrative expenses increased by $4.0 million in 2025 compared to 2024. During the year, we
experienced an increase in general and administrative cost activities, driven by employee-related costs and additional
administrative and operational support functions required to support our growth and advance our
public‑company‑readiness initiatives.
Employee‑related expenses increased by $3.8 million in 2025 compared to 2024, primarily due to an increase in
headcount of 89 employees to expand our technical, operational, and administrative functions to support project
development, execution, and corporate operations. This headcount growth resulted in an increase in
109
compensation‑related costs, including salaries, payroll taxes, health and welfare benefits, performance‑based
bonuses, stock‑based compensation, and retirement plan contributions.
Additional increases in general and administrative expense of $1.8 million were attributable to higher software,
information technology, and data‑related costs, including licensing fees and cloud‑based services, as well as an
increase of $1.3 million for insurance and surety bond expenses associated with our expanding asset base and
operational footprint. These increases were partially offset by a $3.4 million decrease in legal and professional
services expense, primarily due to reduced reliance on external legal advisors following the expansion of our
in‑house legal function. In addition, legal costs were elevated in 2024 due to increased transactional activity,
including a higher volume of commercial agreements and other corporate matters that did not require external legal
services at similar levels in 2025. The remaining movement in general and administrative expenses related to a
variety of individually insignificant movements year-over-year.
Certain general and administrative expense categories experienced variability year-over-year due to the timing
of specific initiatives, professional engagements, and one‑time or non‑recurring costs. While we expect these
expenses to remain elevated as we continue to scale our operations and infrastructure, the rate of growth in general
and administrative expenses is expected to moderate over time as we complete key build‑out initiatives and achieve
greater operating leverage.
Operating Lease Expenses
Operating lease expenses increased by $2.8 million in 2025 compared to 2024. The increase was primarily
attributable to 69 new lease commitments entered into during 2025 to support our continued growth and expanded
operational requirements.
Operating lease expenses consist primarily of geothermal lease payments, office facilities, operational sites, and
equipment rentals. The increase reflects additional leased acreage and infrastructure required to support project
development and operational expansion.
Depreciation and amortization
Depreciation and amortization increased by $0.2 million in 2025 compared to 2024, primarily due to additional
assets placed in service. The change was not material to overall results.
Interest Income and Expense
Interest income increased by $2.4 million in 2025 compared to 2024. The increase was due to higher average
cash balances at the beginning of 2025 following our successful Series D preferred stock financing completed in
2024.
Interest expense increased by $7.6 million in 2025 compared to 2024. The increase was due to an increase in
outstanding debt to fund our growth and operations, including draws of $30.0 million against our Credit Agreement
and $35.5 million against the Credit Facility with Mercuria Energy Trading SA (“Mercuria”).
Other Non-Operating Expense
Other non-operating expense increased by $4.5 million in 2025 compared to 2024. This increase was primarily
driven by non‑cash valuation remeasurement losses of $5.1 million recognized during 2025, including an increase in
the warrant liability fair value of $3.4 million at December 31, 2025 compared to its initial measurement at October
6, 2025, as well as recognition of a bifurcated embedded derivative of $1.7 million recorded at fair value for our
project-level subsidiary Cape Phase 1 Intermediate HoldCo, LLC (“Cape P1 Intermediate HoldCo”) with Centaurus
Capital LP (“Centaurus”).
The remaining change in other non‑operating expense, totaling approximately $0.6 million decrease, was
attributable to the release of a previously recorded sales tax accrual upon expiration of the applicable statute of
limitations during 2025.
110
Liquidity and Capital Resources
Sources and Uses of Liquidity
Sources of Liquidity
We maintain a strong focus on liquidity to support our ongoing geothermal development and operations. As a
development-stage company, our principal sources of liquidity have been derived from equity financing, including
proceeds from redeemable convertible preferred stock issuances, project and corporate-level debt financing
arrangements, project-level equity financings, and grant funding from government agencies. We consider our level
of cash on hand, borrowing capacity, current ratio, and working capital levels to be our most important measures of
short-term liquidity. For long-term liquidity indicators, we believe our ratio of long-term debt to equity and our
historical levels of net cash flows from investing activities to be the most important measures.
As of December 31, 2025, our liquidity position consisted of $461.8 million in unrestricted cash and cash
equivalents (including $442.0 million held in money market funds) and $6.0 million in restricted cash, and in
addition to our cash position, we had access to the following undrawn amounts under our agreements with Mercuria:
$70.0 million under our Credit Agreement, and $44.5 million under our Letter of Credit Facility. As of December
31, 2025, we had fully drawn against our XRC Facility. On April 14, 2026, we repaid all outstanding balances under
the XRC Facility, and the XRC Facility was terminated.
Our liquidity position was strengthened through recent equity financings, including $462.0 million in gross
proceeds from our Series E equity raise in 2025 and $368.3 million in gross proceeds from our Series D preferred
stock financing in 2024. We have deployed this capital to fund the exploration and development of our geothermal
projects, construct power generation facilities, support R&D activities and meet working capital requirements. Our
liquidity position was further strengthened in March 2026, as our subsidiaries entered into the Project Granite
Facility to finance the development of our Cape Station Phase I project. The facility provides for aggregate
commitments of approximately $421.4 million, consisting of (i) a construction loan facility, (ii) a tax credit transfer
bridge loan facility, (iii) multiple letter of credit facilities, and (iv) a term loan facility that will refinance the
construction loans upon satisfaction of specified conversion conditions. As of December 31, 2025, there was no
borrowing under the Project Granite Facility.
We regularly evaluate our liquidity position and capital structure in the context of our strategic development
plan. Our ability to access additional capital through equity offerings, debt financings, or strategic partnerships will
be critical to executing our business plan and achieving our goal of becoming a leading developer and operator of
next-generation geothermal energy projects. Our cash flows from operations, borrowing availability, and overall
liquidity are subject to various risks and uncertainties, including those described in the section titled “Risk Factors”
elsewhere in this prospectus.
See further discussion of our available liquidity as described in “Management Discussion and Analysis of
Financial Condition and Results of Operations — Indebtedness” section below, along with Note 3 – Debt and Off-
Balance Sheet Arrangements, Note 8 – Common Stock, and Note 9 – Redeemable Convertible Preferred Stock in
the notes to consolidated financial statements.
Catalyst and Centaurus Financing Agreements
During the year ended December 31, 2025, we executed Amended and Restated Limited Liability Company
Agreements for our project-level subsidiary Cape Phase I HoldCo, LLC (“Cape P1 HoldCo”) with Granite Energy
InvestCo, LLC (“Catalyst”) and Cape P1 Intermediate HoldCo with Centaurus. Catalyst subscribed to 4,635 Class A
Units in Cape Phase I HoldCo, LLC for a total capital contribution of $100.0 million. Centaurus subscribed to 7,500
Class A Units in Cape P1 Intermediate HoldCo for an initial contribution of $75.0 million. In connection with this
agreement, Centaurus was issued warrants to purchase up to 3,550,329 shares of Series D-3 convertible preferred
stock in our company or the Company’s most senior class of equity securities at the time of exercise, at an exercise
price of $5.28 per warrant or on a cashless basis (the “Centaurus Warrants”). The Centaurus Warrants will expire
immediately prior to the closing of a firm commitment underwritten initial public offering of our Class A common
stock. The Centaurus Warrants have a four-year term measured from October 6, 2025. The Cape Station Phase I
111
project equity financings with Catalyst and Centaurus contain required payout provisions that must be satisfied prior
to any distributions to our parent company. The Catalyst financing is structured as project-level preferred equity
with a priority dividend and return-of-capital profile, with cash applied first to preferred distributions before
amounts are available to common equity. The Centaurus financing, which we have negotiated for Cape Station
Phase I as junior project preferred equity, includes a distribution waterfall that prioritizes cash to Centaurus until
agreed return hurdles are achieved, after which distributions step down; certain terms could further reduce cash
available to common equity. Preferred distributions under both the Catalyst and Centaurus financings commence
only after Cape Station Phase I has achieved COD under the applicable PPAs and is generating distributable cash
flow. As a result, we do not expect any preferred distributions to be required during the twelve-month period
following December 31, 2025.
Over the longer term, beyond the twelve-month period following December 31, 2025, the Catalyst financing
requires cumulative preferred distributions to Catalyst totaling approximately $139.0 million. These distributions are
based on an amortizing repayment profile and are expected to be paid on a quarterly basis through the end of the
repayment period, December 31, 2041. Over the same longer-term period, the Centaurus financing requires
cumulative distributions of approximately $75.0 million before the applicable priority distribution percentage steps
down, followed by a second priority distribution period requiring Centaurus to receive additional cumulative
distributions of approximately $47.0 million. Following completion of this second priority distribution period,
Centaurus will retain a royalty interest in the project equal to $5.0 per MWh. As preferred distributions under the
Centaurus financing are tied to achievement of return hurdles, the required amounts herein are subject to change.
Certain provisions in the Catalyst and Centaurus financing agreements – including, but not limited to, change of
control provisions, refinancing or asset sale provisions, and the exercise of put or call rights – could accelerate,
modify, or otherwise affect these distribution requirements. In addition, these and any future project-level
distribution waterfalls, reserve requirements, and covenant-based limitations associated with current and future
financings may delay, reduce, or entirely preclude cash distributions to us for extended periods, even when the
underlying project is operating as expected. Any such restrictions could reduce cash distributions from Cape Station
Phase I to the holding company level.
See Note 13 – Variable Interest Entity of the notes to the consolidated financial statements for further
discussion.
Capital Requirements
Our capital requirements for 2026 and beyond are expected to remain substantial as we advance multiple
geothermal projects toward commercial operation, including Cape Station. While we have not yet achieved
significant revenue generation, we anticipate our funding needs will include continued capital expenditures for
projects under construction, such as Cape Station, exploration and development costs for new geothermal sites
across our 595,900 acre portfolio, operating expenses as we scale our organization and technical capabilities and
working capital to support expanded operations.
Capital expenditures over the next 12 months are projected to total approximately $1.2 billion, driven by
drilling, well completion, and continued construction activities at Cape Station as well as early development of other
GeoClusters. Of this amount, approximately $125.0 million relates to our Cape Station Phase I facility and $940.0
million relates to our Cape Station Phase II facility.
Based on current conditions, we believe that our capital resources are sufficient to meet our financial obligations
and fund our planned development activities for at least the next 12 months. As a company with significant
developmental activities transitioning toward commercial operations, we continue to rely on external financing to
fund our operations and growth initiatives.
112
Indebtedness
XRC Facility
During the year ended December 31, 2024, Cape Generating Station 3 LLC and Cape Generating
Station 5 LLC, two of our wholly owned subsidiaries, issued two promissory notes under the XRC Facility, and
during the year ended December 31, 2025, we issued an additional promissory note. As of December 31, 2025, the
XRC Facility consisted of three tranches totaling $145.6 million in commitments. Each tranche was set to mature in
2027, with an option for two additional one-year extensions upon lender approval. As of December 31, 2025 $145.6
million was drawn under the XRC Facility.
The XRC Facility contained certain restrictive covenants, including covenants restricting our ability to incur or
assume additional indebtedness, grant or assume liens, engage in fundamental changes such as mergers,
consolidations, liquidations, or the sale of substantially all assets, make restricted payments, modify project
documents in ways materially adverse to the lender, engage in transactions with affiliates, or enter into restrictive
agreements.
The XRC Facility contained customary events of default. If an event of default occurred, the lender was
permitted to cease making any further loan advances and/or declare all outstanding obligations immediately due and
payable.
On April 14, 2026, we repaid all outstanding balances under the XRC Facility, and the XRC Facility was
terminated.
Mercuria Credit Agreement and Credit Facility
During the year ended December 31, 2024, Fervo HoldCo LLC, one of our wholly owned subsidiaries, entered
into a $40.0 million Credit Agreement and $80.0 million Credit Facility with Mercuria. In May 2025, the Credit
Agreement was amended to increase the term loan from $40.0 million to $100.0 million. As of December 31, 2025,
we had drawn $30.0 million against the Credit Agreement and utilized $35.5 million against the Credit Facility. The
Credit Agreement matures in 2027, while the Credit Facility matures on the earlier of November 20, 2027 or upon
acceleration of its obligations due to an event of default.
The Credit Agreement requires compliance with financial covenants including maintaining a net asset value to
total exposure amount ratio of at least 2.5 to 1.0, a total debt to equity capital contributions plus total debt ratio not
exceeding 0.6 to 1.0, and a total exposure amount to total consolidated capital ratio not exceeding 0.4 to 1.0.
Both agreements contain covenants that restrict our ability to incur additional indebtedness on pledged entities,
grant liens, make restricted payments or investments beyond those existing at the effective date, engage in
fundamental changes such as mergers or asset sales, conduct affiliate transactions, enter swap agreements outside the
ordinary course of business, modify organizational documents adversely to lenders, or change our business
nature. Furthermore, under the terms of the Credit Agreement, our wholly owned subsidiary Fervo HoldCo LLC, the
borrower, is restricted from making cash distributions to Fervo Energy Company, our parent company. See Note 8 –
Common Stock of the notes to consolidated financial statements, for further discussion of our restricted net assets.
The Credit Agreement and Credit Facility contain customary events of default. If an event of default occurs, the
lender may declare the commitments to be zero and/or declare all outstanding obligations immediately due and
payable.
As of December 31, 2025, we were in compliance with all restrictive and financial covenants. For further
discussion of our indebtedness, see Note 3 – Debt and Off-Balance Sheet Arrangements of the notes to consolidated
financial statements.
Project Granite Facility
In March 2026, our subsidiaries entered into a senior secured credit agreement to finance the development of
our Cape Station Phase I project. The facility provides for aggregate commitments of approximately $421.4 million,
113
consisting of (i) a construction loan facility, (ii) a tax credit transfer bridge loan facility, (iii) multiple letter of credit
facilities, and (iv) a term loan facility that will refinance the construction loans upon satisfaction of specified
conversion conditions.
Borrowings under the Project Granite Facility will be available during the construction period, subject to certain
conditions precedent. Following completion of the project and achievement of specified operational and
performance criteria, the construction loans are expected to convert into term loans with an amortization profile
sized to projected cash flows from the project. We used a portion of the proceeds of the Project Granite Facility to
repay all amounts outstanding under the XRC Facility, and the remaining proceeds of the Project Granite Facility
will, among other things, fund remaining Cape Station Phase I construction costs and potentially provide for an
equity recapitalization.
The Project Granite Facility contains customary affirmative and negative covenants for a project financing of
this type. These covenants, among other things, require the project entities to comply with construction budget and
schedule requirements, satisfy testing and conversion conditions prior to transitioning to term debt, maintain
required reserves (including debt service and major maintenance reserves), and operate the project in accordance
with the applicable material project documents. The facility also includes a cash management structure pursuant to
which project revenues are applied in a specified priority of payments, and distributions are subject to the
satisfaction of specified conditions.
Additionally certain covenants restrict the ability of project entities to incur indebtedness, create liens, make
investments, enter into mergers or other fundamental changes, dispose of assets outside of permitted dispositions,
enter into non-arm’s-length affiliate transactions, and engage in business activities other than those related to the
development and operation of the project.
The facility includes customary events of default, including payment defaults, covenant breaches, insolvency
events, and failure to meet construction or operational milestones. Upon an event of default, the lenders may
accelerate the obligations and exercise remedies against the collateral.
Net Operating Losses (“NOL”) and Valuation Allowance
We have significant NOLs that may provide future offset to taxable income during the applicable carryover
periods. As of December 31, 2025, we had approximately $85.7 million of net operating loss carryforward for
Federal tax purposes, all of which are indefinitely lived. See Note 18 – Income Taxes of the notes to consolidated
financial statements for further discussion of our NOLs and valuation allowance.
Cash Flow Activities
The following table summarizes our cash flow activities:
Year Ended December 31, | |||
(Dollars in thousands) | 2025 | 2024 | |
Beginning cash, cash equivalents and restricted cash ............................................... | $199,428 | $29,115 | |
Net cash (used in) provided by: | |||
Operating activities ................................................................................................. | (31,757) | (54,748) | |
Investing activities ................................................................................................... | (465,659) | (178,693) | |
Financing activities ................................................................................................. | 765,824 | 403,754 | |
Net increase in cash, cash equivalents and restricted cash ........................................ | 268,408 | 170,313 | |
Ending cash, cash equivalents and restricted cash ..................................................... | $467,836 | $199,428 | |
Net Cash Used in Operating Activities
Net cash used in operating activities decreased by $23.0 million in 2025 compared to 2024, primarily driven by
our operating losses and timing of payments and receipts related to our operating assets and liabilities. Net loss,
excluding non-cash activities, was $43.8 million in 2025 compared to $34.8 million in 2024, which contributed to a
114
$9.0 million increase in cash used in operating activities. Such increase was primarily associated with the elevated
general and administrative expenses, interest expense, and other non-operating expense as described in the
“Management Discussion and Analysis of Financial Condition and Results of Operations — Results of Operations”
section above.
Changes in operating assets and liabilities resulted in a $12.1 million source of cash in 2025 compared to a
$19.9 million use of cash in 2024, representing a $32.0 million year-over-year improvement. Cash from deposits
improved by $16.9 million, largely reflecting higher releases and refunds of performance bond deposits in 2025.
Cash from other operating assets improved by $7.4 million as such cash outflows recorded in 2024 did not recur in
2025. Cash from prepaid expenses and other improved by $5.2 million, reflecting lower up-front vendor payments in
2025, and cash from other current liabilities improved by $7.0 million due to an increase in accrued expenses
resulting from the timing of cash payments for operating costs incurred during the year. Cash from grant receivables
improved by $1.8 million as grant receivables outstanding at December 31, 2024 were collected. These
improvements were partially offset by an unfavorable $6.4 million cash movement related to accounts payable due
to higher cash settlements of previously accrued obligations associated with elevated spend on general and
administrative expenses in 2025.
Overall, the year‑over‑year change in operating cash flows reflects higher cash operating losses from scaling the
business combined with working capital timing effects, consistent with our transition from development to
construction ahead of initial commercial operations.
Net Cash Used in Investing Activities
Cash used in investing activities in 2025 and 2024 related entirely to capital expenditures, which increased by
$287.0 million in 2025 compared to 2024.
This increase reflects accelerated project development activities as we advanced multiple geothermal projects
toward construction and operation. Capital expenditures during 2025 were driven primarily by construction activities
at Cape Station, including the drilling and completion of production and injection wells, development of surface
facilities, and construction of related infrastructure necessary to support future commercial power generation.
Of our total capital expenditures in 2025, the majority of spending was non‑discretionary, necessary to advance
projects already under development rather than discretionary or maintenance‑level spending. They consisted of costs
required to complete in‑process projects, satisfy regulatory and safety requirements, and meet contractual
milestones.
Net Cash Provided by Financing Activities
Net cash provided by financing activities increased by $362.1 million in 2025 compared to 2024.
Net cash provided by financing activities during 2025 was attributable to significant equity and debt financing
transactions completed during the year. Cash inflows included $461.4 million of net proceeds from our Series E
preferred stock financing, $99.5 million of net proceeds from a preferred stock issuance with Catalyst, $74.5 million
of net proceeds from a preferred stock and warrants issuance with Centaurus and $0.5 million of proceeds from the
issuance of common stock. In addition, we received $103.1 million of net proceeds from our XRC Facility and $28.8
million of net proceeds under our Credit Agreement and Credit Facility. These financing inflows were partially
offset $1.9 million of cash used for the repurchase of treasury stock during the year.
Net cash provided by financing activities during 2024 primarily reflected proceeds from equity and debt
financings completed during the year, including $366.6 million of net proceeds from the Series D preferred stock
financing and $36.6 million of net proceeds from the establishment of XRC Facility. In addition, we received $0.5
million of proceeds from the issuance of Simple Agreement for Future Equity (“SAFE”) and $0.1 million of
proceeds from the issuance of common stock.
115
Contractual Obligations and Commitments
Our cash requirements under contractual commitments include purchase commitments, repayments of long-
term debt and related interest, and payments relating to our operating leases. We have several outstanding
contractual commitments with suppliers to obtain materials and services to support our operations. As of December
31, 2025, we had contractual commitments of $528.8 million, a majority of which relates to our Cape Station Phase
I and Cape Station Phase II facilities. Of this amount, $346.5 million is due in 2026 and $182.3 million is due
thereafter. Such obligations represent the minimum amounts contractually required under the applicable agreements
as of December 31, 2025. See Note 3 – Debt and Off-Balance Sheet Arrangements, Note 6 – Leases and Note 21 –
Commitments and Contingencies of the notes to consolidated financial statements, for further information on our
commitments.
We also have distribution requirements under the Catalyst and Centaurus Financing Agreements. See
“Management Discussion and Analysis of Financial Condition and Results of Operations — Sources and Uses of
Liquidity — Catalyst and Centaurus Financing Agreements” for further information.
Off-Balance Sheet Arrangements
In addition to the Credit Facility described above, we maintain surety bond arrangements to support our
contractual obligations under PPAs, land development agreements, and construction contracts. As of December 31,
2025, we had $57.5 million in outstanding surety bonds. We expect our requirements for the Credit Facility and
surety bonds to increase as we continue to develop our geothermal projects and enter into additional commercial
agreements.
Qualitative and Quantitative Disclosures about Market Risk
Market risk represents the risk of loss that may impact our financial position because of adverse changes in
financial market prices and rates. We manage and monitor these exposures to ensure appropriate measures are
implemented in a timely and effective manner.
Interest rate risk
Our exposure to interest rate risk relates to our cash investments and variable rate debt obligations, including the
Credit Agreement, Credit Facility and Project Granite Facility. The Credit Agreement, if drawn, is subject to SOFR
rate fluctuations. Assuming the outstanding balance of our variable-rate debt remained constant, a hypothetical 1.0%
change in interest rates would have resulted in a $1.8 million change in interest expense for the year ended
December 31, 2025.
As of December 31, 2025, approximately $442.0 million of our cash and cash equivalents were held in money
market funds. While these investments are subject to interest rate fluctuations that may impact our interest income,
we believe the short-term nature of these instruments and their high credit quality minimize our exposure to
significant principal risk.
Inflation risk
We are exposed to inflation risk across our capital-intensive geothermal development activities, particularly in
drilling services, specialized equipment, construction materials, and skilled labor costs. Our operating expenses,
including professional services and personnel costs, are also subject to inflationary pressures. While our costs may
increase with inflation, our long-term PPAs may provide limited inflation adjustments, potentially impacting our
margins over time. We seek to mitigate these risks through fixed-price contracts where feasible and by incorporating
inflation assumptions into our project planning, though the specialized nature of geothermal development limits our
ability to fully hedge against inflation.
Credit risk
Credit risk represents the loss that we would incur if a counterparty fails to perform under its contractual
obligations. To reduce this exposure, we maintain credit policies that include evaluating and monitoring
116
counterparties’ financial condition (including credit ratings) and entering into agreements that govern credit
guidelines. Our deposits largely consist of performance bonds held as security for project completion. The credit risk
related to these deposits is concentrated in the financial strength of the surety companies issuing the bonds and the
contractors’ ability to fulfill their contractual obligations. While we have not experienced any credit losses to date
and believe our counterparties are creditworthy, we cannot guarantee that we will not experience losses in the future,
particularly if financial market conditions deteriorate or if government funding priorities change. As we transition to
commercial operations, our credit risk profile will evolve to include exposure to utility customers under our PPAs.
Supply chain risk
Our development and construction activities depend on procuring equipment, services, and materials from a
number of suppliers, and supply chain disruptions could impact our access to critical components, including but not
limited to, drilling rigs, well casing materials, pumps, monitoring equipment, turbines, and electrical components
necessary for our operations. While we seek to maintain relationships with multiple suppliers and plan for
contingencies where possible, prolonged supply chain disruptions or loss of key suppliers could materially impact
our development timelines and project economics.
Change in Tax Law
On July 4, 2025, the President of the United States signed the budget reconciliation bill, OBBB, which amends,
repeals, or phases out a number of energy tax credits initially introduced by the Inflation Reduction Act of 2022 (the
“IRA”). The IRA amended and enhanced multiple tax incentives focusing on climate change mitigation, clean
energy, electric vehicles, and battery and energy storage manufacturing or purchasing. Most notably, the IRA
introduced PTC and ITC. The OBBB modifies the qualifications of both PTCs and ITCs by limiting credit
availability based on start-of-construction date, completion date, and whether the facility is owned by a specified
foreign entity or includes any material assistance from a prohibited foreign entity. Under both the IRA and OBBB,
we believe our projects have met the qualification requirements for tax credits.
We also have the option to fully depreciate a portion of the cost of a new geothermal power plant in the year
placed in service, as permitted under OBBB. When claiming ITCs, our tax basis eligible for depreciation is reduced
by half of the ITC amount. If we claim the PTC instead, there is no reduction in the tax basis for depreciation. We
will continue to assess the provisions under the OBBB and IRA to determine if an election suits our business needs.
The incentives provided by the OBBB and IRA could significantly impact our future consolidated financial
statements as we become operational. Future steps to revise, repeal, or otherwise change existing rules and
regulations, including various tax incentives, leaves us uncertain about the potential impact at this time.
Critical Accounting Estimates and Assumptions
The preparation of financial statements in conformity with GAAP requires us to apply accounting policies and
make estimates and assumptions that affect the results of operations and the amounts of assets and liabilities
reported in the consolidated financial statements. We believe that the accounting policies described below require
significant judgment in their application or incorporate estimates and assumptions that are inherently uncertain and
that may change in subsequent periods. Additional information on the application of these accounting policies can
be found in the notes to consolidated financial statements.
Leases
Our geothermal operations depend on securing and maintaining leases for geothermal resources on federal,
state, and private lands. Under ASC 842, we recognize right-of-use (“ROU”) assets and corresponding lease
liabilities for these leases. Applying ASC 842 requires significant management judgment, particularly in
determining lease terms and discount rates. Our geothermal leases typically have fixed primary terms with
extensions contingent upon achieving commercial production. We assess the lease term by considering both the
initial term as well as renewal and termination options we are reasonably certain to exercise, based on factors
including economic viability, expected production levels, and long-term operational plans. Since no active market
exists for government-owned subsurface rights, making fair value impractical to determine, we use our incremental
borrowing rate (“IBR”) to calculate the present value of lease payments.
117
We regularly assess our ROU assets for impairment whenever events or circumstances indicate the carrying
amount may not be recoverable, considering factors such as changes in future estimated undiscounted cash flows,
lease term adjustments, and discount rate changes. The complexity of determining appropriate discount rates and
lease terms for government-owned subsurface rights underscores the significance of management’s judgment in
applying ASC 842. While we believe our estimates and assumptions are reasonable, actual results may differ
materially. Changes in our assessment of lease terms, fluctuations in market interest rates affecting our IBR, or
impairment charges could materially impact our financial condition and results of operations. For example,
assuming our outstanding lease liability balance remained constant, a hypothetical 1.0% change in our IBR would
have resulted in a $0.8 million non-cash change in our lease liability for the year ended December 31, 2025.
Impairment of Long-lived Assets
We assess the recoverability of our long-lived assets whenever events or changes in circumstances indicate that
the carrying value of an asset may not be recoverable. Impairment indicators include adverse changes in power
market fundamentals or regulatory environment, determination that a geothermal resource will not support
commercial operations, significant cost overruns threatening economic viability, loss of PPAs, unresolvable
technical challenges, or changes affecting renewable energy incentives. Our impairment analyses require significant
judgment, including identification of the grouping of long-lived assets for impairment testing, estimates of future
cash flows arising from these groups of assets and estimates of the remaining useful lives of the long-lived assets
being evaluated.
When an indicator of impairment is identified, we compare the carrying value of the asset group to its estimated
undiscounted future cash flows, including all expenditures necessary to complete development projects. If the
undiscounted cash flows indicate the carrying amount is not recoverable, we measure impairment as the difference
between carrying amount and fair value, with any impairment loss recorded in the statements of operations. Our
impairment assessments require significant judgment, particularly for development-stage projects not yet generating
revenue. Key estimates include future production capacity based on geological assessments, revenue projections
under PPAs and beyond contracted periods, operating costs, project life, and availability of tax incentives. These
estimates are subject to uncertainty and could be materially affected by changes in technology costs, regulatory
requirements, power market dynamics, or geological conditions. For the years ended December 31, 2025 and 2024,
we concluded that no impairment indicators were present and recorded no impairment losses.
Stock-Based Compensation
In accordance with our 2019 Stock Incentive Plan, we are authorized to grant awards in the form of both
incentive and non-qualified stock options, restricted stock, stock appreciation rights and other stock-based awards.
We measure compensation expense for stock options in accordance with ASC 718, Compensation-Stock
Compensation, and account for forfeitures as they occur. The determination of the fair value of stock options and
other equity-based awards requires management to make critical estimates and assumptions, which affect the
reported amounts of stock-based compensation expense in our consolidated financial statements.
The fair value of stock options is determined using valuation models, such as Black-Scholes option-pricing
model, which requires inputs that are subjective and may significantly impact the resulting valuation. These inputs,
including the fair value of the underlying stock price per share, are based on management’s judgment and historical
experience, as well as publicly available information for comparable companies. Changes in these inputs could
materially affect the estimated fair value of our stock options, and consequently, the amount of stock-based
compensation expense recognized in our consolidated financial statements. A hypothetical 10.0% change in our
stock-based compensation expense for the year ended December 31, 2025 would have affected our consolidated net
loss by $0.3 million.
Based on the assumed initial public offering price per share of $25.50, which is the midpoint of the estimated
offering price range set forth on the cover page of this prospectus, the aggregate intrinsic value of our outstanding
stock options as of December 31, 2025 was $620.3 million, with $258.6 million related to vested stock options.
118
New Accounting Pronouncements and Disclosure Requirements
See Note 2 – Significant Accounting Policies of our notes to consolidated financial statements for information
regarding new accounting pronouncements.
Emerging Growth Company Status and Smaller Reporting Company Status
We are an emerging growth company, as defined in the Jumpstart Our Business Startups Act of 2012 (the
“JOBS Act”), and, for so long as we continue to be an emerging growth company, we may take advantage of certain
exemptions from various reporting requirements that would have been applicable were we a public company that
was not an emerging growth company. Such exemptions include, but are not limited to, the exemption to comply
with the auditor attestation requirements of Section 404 of the Sarbanes-Oxley Act, reduced disclosure obligations
regarding executive compensation in our periodic reports and proxy statements, the exemption from holding a non-
binding advisory vote on executive compensation, and the exemption from stockholder approval of any golden
parachute payments not previously approved. In addition, pursuant to Section 107 of the JOBS Act, as an emerging
growth company, we have elected to take advantage of the extended transition period for complying with new or
revised accounting standards until those standards would otherwise apply to private companies, while also
maintaining the ability to early adopt certain accounting pronouncements. We intend to take advantage of other
applicable exemptions for as long as we remain an emerging growth company. If we cease to be an emerging growth
company, we will no longer be able to take advantage of these exemptions or the extended transition period for
complying with new or revised accounting standards.
We are also a “smaller reporting company,” meaning that the market value of our shares held by non-affiliates
plus the proposed aggregate amount of gross proceeds to us as a result of this offering is less than $700 million and
our annual revenue was less than $100 million during the most recently completed fiscal year. We may continue to
be a smaller reporting company after this offering if either (i) the market value of our shares held by non-affiliates is
less than $250 million or (ii) our annual revenue was less than $100 million during the most recently completed
fiscal year and the market value of our shares held by non-affiliates is less than $700 million. If we are a smaller
reporting company at the time we cease to be an emerging growth company, we may continue to rely on exemptions
from certain disclosure requirements that are available to smaller reporting companies. Specifically, as a smaller
reporting company, we may choose to present only the two most recent fiscal years of audited financial statements
in our Annual Report on Form 10-K and, similar to emerging growth companies, smaller reporting companies have
reduced disclosure obligations regarding executive compensation.
119
BUSINESS
This summary highlights selected information that is presented in greater detail elsewhere in this prospectus.
This summary does not contain all of the information you should consider before investing in our Class A common
stock. You should read this entire prospectus carefully, including the sections titled “Risk Factors,” “Special Note
Regarding Forward-Looking Statements,” and “Management’s Discussion and Analysis of Financial Condition and
Results of Operations,” and our consolidated financial statements and related notes included elsewhere in this
prospectus, before making an investment decision. Unless the context otherwise requires, the terms “Fervo,” the
“Company,” “we,” “us,” and “our” in this prospectus refer to Fervo Energy Company and its consolidated
subsidiaries.
Our Mission
To transform geothermal energy into America’s most dependable and affordable source of clean, 24/7 power.
Fervo Energy
The U.S. is in critical need of firm, reliable power. Rapid growth in data centers, the resurgence of domestic
manufacturing, and accelerating electrification are driving electricity demand that outpaces new planned generation.
By 2035, the country is expected to face a 98-gigawatt accredited capacity shortfall, highlighting an urgent need for
new, scalable sources of 24/7 power.
As the pioneer of EGS, we are commercializing a new category of firm power that is scalable, rapidly
deployable, readily available, and geographically flexible. By applying proven technologies like horizontal drilling
and multi-stage hydraulic fracturing, we are transforming geothermal energy from a niche resource into a utility-
scale power solution that is clean, reliable, cost-competitive, and suited to the needs of hyperscalers and utilities
alike.
Geothermal is a highly attractive energy resource – it is clean, firm, and reliable. But traditional geothermal
projects depend on rare geologic conditions like volcanic systems with highly conductive natural fracture networks,
which has constrained development to places like Iceland, Kenya, California, and Hawaii. Additionally, traditional
geothermal projects have carried significant development risk because wells either succeed or fail entirely with
natural fracture networks. This uncertainty has made these projects unpredictable, expensive, and hard to scale.
Our EGS technology addresses the scalability limitations and key development risks of traditional geothermal
energy. By designing and controlling subsurface flow pathways, we can predictably recover heat without relying on
naturally occurring permeability. Additionally, we deploy innovative subsurface monitoring technologies such as
AI-enhanced fiber optic sensing that enable us to monitor and predict geothermal heat transfer at high spatial and
temporal resolution. We believe these capabilities will enable us to standardize project development, optimize power
facility placement and design, and capture economies of scale previously unavailable to the geothermal industry. We
expect this innovative approach to position us to deliver predictable, cost-effective, and scalable geothermal power
that follows learning curve cost declines, thereby providing the dependable energy needed to help close the nation’s
capacity shortfall.
Our EGS technology has been delivering clean electrons to the grid and generating revenue since 2023 at our
commercial pilot called Project Red, differentiating us from certain other energy alternatives still grappling with
technology risk, long development timelines, permitting uncertainty and supply chain constraints. Expanding upon
this success, we are now building Cape Station, a 500-megawatt greenfield project, where we expect to deliver first
power by late 2026. Our proven technical approach and track record of execution has generated meaningful
commercial traction. Across our full portfolio, we have signed 658 megawatts of binding PPAs with investment-
grade utility and corporate energy buyers including Southern California Edison and Shell. Beyond our current
contracted backlog, we have also entered into a 3-gigawatt framework agreement with Google (the “Geothermal
Framework Agreement” or “GFA”) to advance and structure potential power offtake opportunities for current and
planned data centers in both grid-connected and alternative energy solutions. We believe this agreement provides a
repeatable commercial model to accelerate our deployment, capitalize on expanding demand from hyperscale
120
customers, and enable Fervo to play an increasingly critical role in meeting the nation’s growing demand for clean,
reliable power.
Our Project Pipeline
We are a geothermal energy developer that builds, owns, and operates geothermal power facilities. We construct
projects in phases across leased acreage positions that can support multi-gigawatt GeoClusters. Our leasing strategy
is focused on securing high-quality, geothermal resources in prime locations, the vast majority of which have
existing deep wells that confirm significantly elevated temperatures at shallow depths and near-term commercial
viability. We pair detailed geologic analysis with commercial assessments, such as transmission access, market
conditions, and permitting, so that each opportunity meets our development standards.
In June 2023, we broke ground on our first GeoCluster – Cape Station – located in Milford, Utah, which we
expect will become the world’s largest EGS project in terms of total installed capacity. At Cape Station, we have
500 megawatts under construction and expect to deliver first power in late 2026, reaching approximately 100
megawatts of operating capacity by early 2027. These 500 megawatts represent only the first two phases of the Cape
Station GeoCluster. We also have a permit in place to develop an incremental 1.5 gigawatts at the site, and based
upon a combination of internal estimates and findings from an independent engineer assessment, estimate that we
have a total of approximately 4.3 gigawatts of capacity potential at Cape Station.
Cape Station is expected to be the first in a large portfolio of high-capacity factor, carbon-free, baseload power
GeoClusters, supporting the company’s runway for significant, near-term organic growth across our 595,900 acre
land position as of December 31, 2025.
We classify our portfolio into three distinct categories: Mature, Pipeline, and Prospects.
As of December 31, 2025, our Mature, Pipeline, and Prospects portfolio consisted of the following:
Mature
•Operating: 3 megawatts are currently online and generating power from our pilot project, Project Red.
•Under Construction: 500 megawatts are currently in construction at Cape Station, with commercial
contracts in place and physical work underway.
121
•Ready to Build: 550 megawatts across two different GeoClusters were shovel-ready with initial permits
secured to begin construction. These megawatts are backed by calibrated subsurface models, validated
against well data and geophysical surveys, and have a clear wellfield development strategy in place.
Commercially, we have secured or are in advanced negotiation for offtake and have either obtained
interconnection or established a clear, achievable path.
Pipeline
•Advanced Development: 2.6 gigawatts were in advanced development. These projects have a go-to-market
strategy established, with key development milestones progressing and active origination efforts underway.
Typical activities include preliminary permit filings, on-site geological studies work, and submission of
interconnection applications.
•Early Development: Over 38 gigawatts were in early-stage development across ten GeoClusters where we
have commissioned and received independent HIIP studies and are conducting feasibility activities to
validate and confirm the path toward commercial development.
Prospects
•Land Holdings: Our remaining portfolio consists of approximately 256,000 acres of leased acreage as of
December 31, 2025, with differentiated geothermal resource quality currently maintained in our portfolio.
For this category, we have secured leases and identified project areas, but have not commenced initial
development work.
These three categories (Mature, Pipeline and Prospects) represent the expected progression of our megawatts
from those in early development stages to revenue-generating operations.
122
As of December 31, 2025, our generation portfolio was comprised of the following:
__________________
Note: Capacity Potential estimates are based on “Best Estimate” HIIP estimates presented in reports prepared by D&M using assumptions
regarding notional EGS development plans, ORC turbine efficiency, parasitic loads, and other assumed recovery factors, and are subject to
change with additional data.
Our Project Economics
Our business model combines technological innovation with disciplined project development and seeks to
deliver predictable returns and strong cash generation. In addition to advancing the technical boundaries of
geothermal energy, we are implementing a development approach that leverages repeatability, enhanced production
performance, and economies of scale. We believe relentless focus on these three areas will enable us to
systematically improve the economics of geothermal power generation and increase the value of each megawatt
produced across our portfolio.
•Repeatability – Freed from the constraints of conventional geothermal systems, our approach emphasizes
standardization and repetition in order to capture and integrate geological, technical, and experiential
learnings to meaningfully reduce costs. Since 2022, the company has demonstrated a steep drilling learning
curve, reducing drilling times by approximately 75% from 2022 to 2025 and lowering per-foot drilling
costs by approximately 70% over the same period. We employ advanced data analytics and proprietary AI-
based modeling to better predict operational conditions and accelerate design optimization, drawing on
more than 500 terabytes of high-fidelity operational data collected to date. To extend these efficiencies
from the wellfield to the surface facilities, we plan to deploy standardized 50-megawatt ORC power plants
123
that we call GeoBlocks— which aggregated together form GeoClusters— that we expect will yield power
projects that are modular and reliable. By modularizing capacity into standardized 50‑megawatt GeoBlocks
and scaling them in GeoClusters, we believe we can create a repeatable, bolt-on development model that
compounds learning across projects, shortens delivery timelines, and enables predictable, utility‑scale
expansion. The chart below illustrates the impact of learning curves on our business over time,
demonstrating the decrease in cost per foot and days spent drilling to total depth per well across our Project
Red and initial Cape Station subsurface construction.
Source: Fervo Data
For our two Project Red wells, total vertical depths were approximately 7,500 feet and total measured
depths were approximately 11,000 feet, with a horizontal section of approximately 3,000 feet. For our Cape
Station Phase I subsurface construction, we increased the total vertical depths to approximately 9,000 feet
and total measured depths to approximately 14,000 feet, with a horizontal section of approximately 5,000
feet. We plan to drill approximately 8–10 wells per standardized GeoBlock. Planned well depths will vary
and will be refined based on site‑specific geology and geography, including subsurface thermal gradient,
stress conditions, and structural or tectonic setting pertinent to EGS, to intersect target heat‑bearing
formations at the depths required for effective reservoir creation.
•Enhanced Production Performance – We seek to continue to increase output and efficiency through
improvements in well design, reservoir engineering, and surface facility optimization. We have already
deployed progressively longer lateral wells and have targeted progressively higher temperature formations
to enhance heat recovery from each well and improve power conversion efficiency. For example, our
Project Red wells have maximum lateral lengths of approximately 3,000 feet and target formation
temperatures of approximately 350°F, whereas the Cape Station Phase I wells have maximum lateral
lengths of approximately 5,000 feet and target higher formation temperatures of approximately 400°F.
These design choices reflect our progression toward longer laterals and hotter reservoirs in successive
phases, with Cape Station Phase I representing a step-change relative to Project Red. Proprietary
stimulation techniques and real-time monitoring allow us to optimize flow distribution and thermal
recovery. We continuously refine our approaches to drilling, completions, and facility configuration to
deliver incremental performance gains with each successive phase of each project.
124
•Economies of Scale – Our GeoCluster-focused approach supports the development of shared infrastructure
and streamlined supply chains. By replicating uniform GeoBlocks across multiple sites, the company
achieves procurement leverage, lowering capital intensity and increasing the predictability of long-lead
time equipment supply. We expect multi-gigawatt GeoClusters will allow us to capture scale efficiencies
across engineering, construction, manufacturing, workforce, and operations, further enhancing project
returns and improving overall company economics.
Together, we believe these capabilities create a compounding advantage across our portfolio. We expect that
repeatability, enhanced production performance, and economies of scale will contribute to lower capital intensity
and higher margins on a per-megawatt basis and enhance project-level cash generation. As additional GeoBlocks are
deployed across GeoClusters, we expect continued reductions in cost per megawatt and improvements in return on
invested capital, reinforcing the company’s ability to deliver sustained value.
Source: Midpoint for geothermal capacity factor, Rystad Energy.
Our Opportunity
Driven by surging load from AI and data centers and accelerating electrification across transportation,
buildings, and industry, the U.S. power market is approaching a decisive inflection point as electricity demand
outpaces new planned generation. At the same time, Rystad notes that roughly 66 gigawatts of aging accredited
capacity are expected to retire by 2035, which is projected to lead to a nationwide accredited capacity shortfall of
approximately 98 gigawatts by 2035. Underlying this accredited capacity shortfall is the disproportionate retirement
of baseload power sources, namely coal, which comprises 80% of net power retirement through 2035. To close the
projected capacity shortfall, the market will require substantial incremental firm generation.
A firm energy resource, like geothermal, natural gas, nuclear or coal, can reliably deliver electricity at consistent
levels for long durations and typically has a capacity factor above 75%. Because of its reliable nature, firm power is
critical for the inflexible demand profiles of data centers, as well as industrial and commercial consumers. However,
market participants expect the projected shortfall in firm power generation to be increasingly plugged by intermittent
renewables (wind, solar, often paired with batteries to extend availability); Rystad predicts that renewables could
comprise 32% of all U.S. power generation by 2035. Meanwhile, rising peak demand, in conjunction with planned
firm power retirements, is driving down reserve margins across the U.S., making additional firm capacity critical.
This mismatch in supply and demand has manifested itself in progressively higher PPA prices for firm energy
resources. Rystad reports that clean, firm energy sources, like EGS, can command pricing in the range of $100-130
per megawatt-hour. According to third‑party sources and internal estimates, the unit economics for an illustrative
125
EGS project reflect differentiated project cashflows and returns as compared to renewables, gas and nuclear. Based
on an assumed firm‑power pricing of approximately $115 per megawatt hour, a capacity factor of roughly 83%,
operations and maintenance costs of $160 dollars per kilowatt-year with no fuel expense, and a $30 per megawatt
hour of geothermal tax credit, illustrative earnings before interest, taxes, depreciation and amortization per megawatt
for EGS for a one-year period are approximately $650,000 to $700,000 without tax credits and $850,000 to
$950,000 with the inclusion of tax credits. Pursuant to recently enacted amendments to Internal Revenue Code
Sections 45Y and 48E under the “One Big Beautiful Bill Act,” projects that begin construction by the end of 2033
will receive the full tax credit; those beginning in 2034-2035 get a reduced credit of 75% and 50%, respectively; and
projects that begin construction in 2036 or later lose the tax credits entirely. Further, actual earnings before interest,
taxes, depreciation and amortization per megawatt for EGS projects will differ depending on project and market
specific factors, such as resource quality, development and operating costs actual capacity factor, power prices and
offtake terms, and may cause results to vary materially from such estimates. See “Risk Factors — Risks Related to
Our Business — Illustrative estimates of earnings before interest, taxes, depreciation and amortization and
illustrative estimates of capital required per megawatt for EGS projects included herein are not forecasts, targets or
guidance, and actual results could vary materially.”
Key factors that could impact this illustrative EBITDA include realized PPA prices, drilling and stimulation
outcomes, actual operational and maintenance costs, realized capacity factor relative to the assumed 83%, and
availability and monetization of tax credits.
Based on internal estimates for projects currently under construction, our enhanced geothermal power plants are
expected to have total installed costs of approximately $5-7 million per megawatt and have a useful life of at least 30
years. Key factors that could impact these estimated costs include the number of wells required for subsurface
development, turbine and major equipment procurement, production facility design specifications, and grid
interconnection-related expenses.
According to Rystad, if EGS were to meet the emerging accredited capacity gap in the U.S. alone, the annual
addressable market would be approximately $70.0 billion by 2035. Assuming a 30-year asset life, this represents a
$2.1 trillion revenue potential opportunity.
We believe we are well positioned to meet this moment. Our EGS technology is proven and scalable. Our
modular engineering approach supports rapid deployment. Our commercial pipeline is advanced, our wellfield
supply chain and labor force are mature, and our intellectual property is broad, while our acreage holdings contain
approximately 595,900 acres of geothermal leases that provide significant room for expansion. These advantages
position us to become one of the largest providers of scalable, carbon-free baseload power over the next decade.
The following factors highlight the structural demand-supply imbalance in U.S. power markets and underscore
why we believe that scalable, firm, carbon-free solutions like EGS are positioned to capture outsized value in the
decade ahead.
•All-Time High Power Demand – After two decades of relatively stable load growth between 2000 and
2020, energy demand is rising steeply and rapidly driven by the artificial intelligence (“AI”) boom,
renewed onshoring of manufacturing and economy-wide electrification.
•AI Data Center Projects. According to Rystad, AI data centers are projected to require 552 TWh of energy
over the next decade. The top four hyperscalers building these data centers—Amazon, Google, Microsoft
and Meta— have each characterized energy as a critical input to winning the AI race. Together, these four
companies have executed over 133 gigawatts of energy supply agreements as of Q1 2026. Rystad notes that
the explosive growth of AI and data centers is placing unprecedented strain on U.S. power infrastructure,
with some hyperscale projects expected to draw over 2 gigawatts of power – the equivalent of a medium-
sized city – by themselves. Only 15% of data centers will be under 50 megawatts by 2035, including
existing and announced projects.
•Onshoring of Manufacturing. Political and economic factors are driving the increases in industrial
operations returning to the U.S., driving increased power demand in the industrial sector. New
manufacturing facilities in sectors like semiconductors, plastics, and metals are creating substantial new
126
power loads, with some plants contributing several hundred GWh annually. This reshoring trend is
concentrated in regions such as the Southeast, Midwest, and Western states, where nearly 149 new
manufacturing projects have been announced over the last five years. Additionally, in response to shifting
and uncertain tariffs, large companies across heavy industry have pledged to relocate manufacturing
facilities to the U.S. in the future, further accelerating this trend. Rystad predicts that achieving U.S.-based
manufacturing goals could require 170 TWh of new capacity by 2035.
•Economy-Wide Electrification. According to Rystad, economy-wide electrification continues to drive
utility power procurement, requiring a projected incremental capacity of 307 TWh. U.S. electricity demand
is expected to grow about 24% by 2035 from 2025 levels, driven largely by data center growth, industrial
reshoring and increased electrification. This surge in demand requires extensive new investments in power
generation to ensure grid reliability and capacity. These trends contribute to a much steeper energy demand
curve than previously experienced. As demand outpaces supply, power prices are projected to continue to
increase in the near future.
Source: Rystad Energy.
•Deficient Supply Alternatives. The U.S. energy system is facing a severe supply constraint caused by
insufficient new capacity additions and aging infrastructure. Existing power supply alternatives face various
limitations in this time of great need. VREs like solar and wind have expanded rapidly but can only meet
certain hours of demand, even when coupled with battery storage. Firm energy resources like natural gas
face supply chain bottlenecks and volatile fuel pricing. Nuclear power remains a critical firm energy
resource, but new large-scale projects are battling high costs and long development timelines.
•VRE Shortfalls. Though solar and wind energy supply are projected to grow in the face of political
headwinds, neither resource adequately addresses the need for reliable, baseload energy. Even when paired
with battery energy storage systems, these systems do not achieve baseload reliability.
127
The charts below demonstrate the lack of baseload power expected to be added to the U.S. energy system, and
the particular impact on the Western U.S., our current area of operations.
Source: Rystad Energy.
Additionally, Rystad predicts that the phaseout of federal tax credits is expected to weaken wind and solar
project economics, further reducing new supply and affordability. Post-enactment of the OBBB, the market projects
a 28% cut to U.S. solar and a 52% cut to U.S. wind installations through 2030.
•Natural Gas Bottlenecks. Although natural gas is currently the incumbent source of baseload generation in
the U.S., its future buildout faces key constraints, including limited turbine manufacturing capacity and
competing demand for fuel. Today, Rystad reports that the top 3 gas turbine manufacturers are unable to
procure new turbines before 2030, with lead times exceeding 5+ years for new orders. Additionally, the
price volatility of the natural gas commodity markets remains a key risk, hindering long-term fixed-price
supply agreements. The U.S. Energy Information Administration notes that the surge of LNG export
projects reaching final investment decision this year – representing approximately 13 billion cubic feet of
export capacity in 2031 – is expected to further tighten domestic supply and push natural gas prices higher.
•Nuclear Delays and Technological Uncertainties. SMRs are a promising but still largely unproven
technology. They offer potential advantages in safety, modularity, and scalability, yet significant hurdles
remain before SMR-generated power can be cost-competitive in the U.S. market. Achieving affordable and
reliable deployment will require material gains in manufacturing scale, streamlined regulatory processes,
and improved construction efficiency. Conventional nuclear energy development has also stalled: no true
greenfield projects have reached completion in the 21st century, as plants are capital-intensive and typically
require up to a decade before beginning commercial operations. Plant Vogtle in Burke County, Georgia
faced significant delays and capital expenditure overruns, and is the only new U.S. project with
construction started in recent decades with a construction time of 11 years, underscoring the challenges of
nuclear energy development. SMRs could change this trajectory by enabling more standardized builds and
potentially competitive costs, but the technology is still in early commercialization and faces technological
headwinds, with first deployments expected in the early 2030s at the earliest. Safety concerns and supply
chain constraints, including a tightening uranium market, further complicate the outlook for rapid nuclear
expansion.
128
Our Innovative Solution
We have successfully applied proven technological innovations from the American oil and gas industry to
kickstart what we expect to be another great American industry: next-generation geothermal. Across every layer of
our technology stack, we endeavor to target and systematically eliminate key constraints to traditional geothermal
development to make geothermal energy the most dependable and affordable source of power in America.
Conventional geothermal developers cede control of their projects to the whims of subsurface geology, relying
on natural fracture networks in hot rock to access heat for power generation. This approach restricts development to
a select few locations with adequate subsurface conditions, introduces binary dry hole risk given the unpredictability
of natural fractures, and imposes a fixed upper bound on reservoir-wide power output. Constrained by the resource
size available in natural fractures, conventional geothermal developers have historically been unable to drill new
wells to make up additional capacity if projects underperform, adding additional tail risk after the project is built.
Rather than accept the variability of drilling vertical wells into a natural fracture network, we use proven
technology from the oil and gas industry to build a tightly controlled system for heat extraction in low-permeability
geothermal formations. We engineer these reservoirs by drilling sets of parallel horizontal injection and production
wells through hot rock, accessing a zone of the geothermal reservoir with a highly predictable volume of heat in
place. We then use multistage hydraulic fracturing to connect the wells, establishing pathways and sufficient surface
area in the rock through which water can flow, heat up, and return to the surface for power generation. We also
install AI-enhanced fiber optic sensing cables to measure reservoir conditions in real-time. This data is then used to
continuously monitor flow rates, pressures, and temperatures across the wellfield, allowing us to predict and
optimize future well output. Our proprietary, data‑assimilative models integrate continuous temperature and pressure
profiles to update reservoir state in real time, enabling more accurate production forecasts and proactive decisions to
sustain deliverability and recoverable heat. Our approach allows us to actively manage long-term reservoir
performance; if production falls off in any part of the field, we are able to drill infill wells or simply drill new wells
to mine additional heat and extend overall reservoir lifetime.
129
Instead of creating separate one-off vertical wells (each with a separate well pad) across a field, we can access
vast quantities of subsurface heat by drilling many horizontal wells from a single pad with a compact footprint,
dramatically reducing land disturbance. This approach replicates the successful wellfield design used in the shale oil
and gas revolution. However, unlike in shale, where operators typically target specific and sometimes narrow
payzones, we can access progressively hotter rock the deeper we drill. Our reservoir is only bounded by temperature,
with the minimum temperature established by power plant efficiency and the maximum temperature established by
the temperature limits of subsurface equipment. At present, we apply a minimum reservoir temperature of
approximately 300°F and a maximum reservoir temperature of approximately 625°F, and we utilize a cutoff vertical
depth of about 13,000 feet to define resources we consider technically and commercially viable. These parameters
may evolve over time with improvements in drilling and subsurface technology or changes in market conditions (for
example, higher PPA pricing can support lower temperatures or deeper drilling). As a result, our payzones already
extend thousands of feet in thickness, and we expect these will continue to grow over time as better drilling
technology is developed.
Our Wellfield Production
Data observed from our projects to date has validated our approach. In 2023, we brought our pilot, Project Red,
online. The project quickly demonstrated record 24/7 carbon-free power production, generating three megawatts of
gross power production to the Nevada grid and proving the commercial viability of our innovative drilling
technology. Additionally, at our Project Red commercial pilot, we have observed consistent, stable temperature
output in line with our modeling and expectations. To date, Project Red has not experienced the kind of premature
thermal decline that has long plagued traditional geothermal projects.
We apply advanced data analytics, computational modeling, and data-driven empirical modeling to generate
high-fidelity production forecasts to optimize the economics of our projects. After pioneering the installation of
permanent AI-enhanced fiber optics in geothermal wells, we have collected over 500 terabytes of downhole data that
have been analyzed and used to improve well spacing, completion design, and wellfield optimization. With every
well drilled, casing string installed, and flow test completed, we deepen our knowledge of EGS reservoirs and
extend our first-mover advantage.
Our Scalable Deployment
Our approach is designed specifically with scale in mind. With geothermal heat recovery substantially de-
risked, we can leverage a modular, standardized approach to on-surface power generation to drive cost reductions,
increase deployment speed, and leverage economies of scale and flexibility in our supply chain. We plan to deploy
standardized 50-megawatt ORC power facilities that we call GeoBlocks. Production wells send hot geothermal brine
to a heat exchanger, where it transfers heat to a working fluid. After transferring heat, the cooled geothermal brine is
reinjected underground to cycle through the geothermal reservoir again. In the heat exchanger, the working fluid is
vaporized, ultimately spinning a turbine to create electricity. The vapor is then cooled back into a liquid using air-
cooled condensers to minimize water usage.
We have already secured binding contracts for 500 megawatts of ORC turbine capacity through partnerships
with Baker Hughes and Turboden (a wholly-owned subsidiary of Mitsubishi) for our projects under construction,
and have further expanded this supply through a 1.7 gigawatt ORC turbine framework agreement with Turboden.
These manufacturers have longstanding ORC business units that stand apart from natural gas turbines, helping
support near-term ORC supply even as gas turbines remain backlogged.
GeoBlocks are engineered for rapid scalability. When aggregated, multiple GeoBlocks make up a GeoCluster,
which we define as a multi-gigawatt geothermal power hub designed to provide substantial generation while
streamlining construction and operations. With approximately 595,900 acres of geothermal leases across the United
States as of December 31, 2025, we are primed to implement several GeoCluster power hubs in the next decade with
the potential to support more than one power market. A majority of our leases have a 10-year initial term, and in
most cases, extension options.
To date, all of our commercial contracts feed electrons to the power grid. But by deploying multi-gigawatt
GeoClusters, we can mitigate transmission risk associated with our projects. First, the size and capacity factor of our
130
projects are catalyzing partnerships with transmission developers who seek project certainty and high line
utilization. We are also pursuing behind-the-meter partnerships with hyperscalers who seek large generation and
high uptime. We believe that our GeoCluster approach for AI data center development pairs a repeatable, flexible
commercial framework with a modular, scalable power solution aligned with hyperscale customer demand and
supports definitive offtake agreements over time. Ultimately, we can blend behind-the-meter and transmission
solutions, maximizing resilience and redundancy at a single site.
Our Customers
Our customers have the following profile:
•Customers who want reliability. Utilities cannot replace baseload coal and nuclear plants with solely
intermittent resources such as wind and solar power. To ensure a safe, functional and reliable grid capable
of addressing demand peaks, utilities must procure a new generation of baseload options. Likewise,
hyperscalers demand reliability to maximize uptime for their AI models.
•Customers who seek a near-term solution. Power buyers place a premium on near-term deliverability. In
the race for AI dominance, hyperscalers continue to construct additional data center capacity to avoid
falling behind their foreign and domestic competitors. This arms race mentality has pushed leading AI
companies to go to extreme lengths to obtain more power. For example, xAI has taken the extraordinary
step of purchasing a natural gas power plant overseas and shipping it to the U.S. to power a 2-gigawatt data
center. Utilities, too, recognize the time-sensitivity of bringing new supply online. According to Rystad,
many states across the western United States could face capacity shortfalls by 2031. To address this risk,
utility commissions are increasingly pushing load-serving entities to procure additional reliable power.
•Customers who demand cost-competitiveness. Even as PPA prices continue to rise, buyers maintain price
ceilings above which baseload power procurement remains unattractive. Especially as popular attention on
electricity prices increases, utilities will have to guard against serious cost inflation to remain viable.
•Customers who seek carbon-free solutions. Whether because of state-level renewable energy mandates or
voluntary emissions reduction commitments, a wide variety of buyers continue to prioritize carbon-free,
clean energy sources. For utilities in certain jurisdictions, political pressure has increased the urgency of
clean power procurement.
The EGS technology we pioneered is very well suited to meet our customers’ power procurement needs:
•We offer reliability. EGS projects provide high-capacity-factor baseload power, with no fuel price
exposure.
•We deliver power now. Our EGS technology is one of the few 24/7 power solutions capable of bringing
incremental generation online before 2030. We expect to begin delivering first power from our 500-
megawatt Cape Station project by late 2026, and to reach approximately 100 megawatts of operating
capacity by early 2027.
•We offer an economic, non-volatile alternative. At approximately $7,000/kW, our first Cape Station
project already outcompetes both traditional and small modular nuclear power in overnight capital costs.
Over time, our goal is to achieve scale and drive down prices such that we’re able to outcompete gas by
achieving an Nth-of-a-kind project cost of $3,000/kW without fuel price exposure. Unlike conventional
power producers, our “fuel” is geothermal heat. The cost of accessing it is embedded upfront in our
subsurface capital expenditures and water systems, not in an ongoing commodity expense. By eliminating
exposure to commodity price swings, we intend to deliver predictable, contractable pricing that reduces
hedging costs and risk premiums, which we believe provides economic value that our customers will
recognize and be willing to pay to secure. Beyond delivering power, we also sell multiple products,
including energy, capacity and environmental attributes. This mix supports premium pricing and stronger
margins as markets increasingly value clean, 24/7 capacity and verified environmental attributes. This
131
fundamental advantage distinguishes us from traditional power companies and underpins the long-term
stability of our cost structure.
•We offer carbon-free, renewable power. According to the Department of Energy, EGS projects using
binary-cycle ORC power plants have a fraction of the emissions footprint as natural gas plants. The carbon-
free nature of our product makes EGS especially attractive in states with time-sensitive, ambitious
renewable portfolio standards and for corporate buyers who seek to maintain their climate goals.
These core attributes (reliability, deliverability, cost-competitiveness, and carbon-free) position our EGS
technology ahead of other power options, allowing us to capitalize on high, inelastic power demand.
Sources: Rystad Energy and management estimates.
Our Competitive Strengths
•First-Mover Advantage with Highly Advanced Development Portfolio: We are the global pioneer of EGS
technology. We successfully drilled and stimulated the country’s first commercial EGS wells at our pilot,
Project Red. With an operating pilot and two and a half years of 500 megawatts of greenfield construction
underway, including over 25 wells drilled, we maintain a significant first-mover lead in the EGS space.
These wells were drilled at our Cape Station project in Beaver County near Milford, Utah, and at Project
Red adjacent to the Blue Mountain geothermal field near Winnemucca in Humboldt County, Nevada. As of
December 31, 2025, our projects under construction accounted for approximately 13% of all geothermal
capacity under construction in the United States. By reducing subsurface risk in geothermal heat recovery,
we have increased the velocity with which megawatts can move through our development pipeline.
Additionally, with 595,900 leased acres as of December 31, 2025, we hold what we believe to be one of the
U.S.’s largest portfolios of high-quality geothermal leases. We assembled this position at a weighted
average of approximately $4 per acre during a period of minimal competition between 2019 and 2021, in
sharp contrast to current U.S. Bureau of Land Management lease sales in Utah and Nevada, where
maximum bids reached $344 and $410 per acre, respectively, in 2025. Many of those newly auctioned
parcels did not meet our standards for high-priority development and thus were outside our initial focus
areas, reflecting the quality of our acreage. According to Bloomberg, certain geothermal developers in Utah
and Nevada have paid hundreds of dollars per acre in 2025 for geothermal positions that failed to meet our
132
development standards. We are thus uniquely positioned as a first mover to capitalize on surging demand
for clean, firm, reliable power.
•Proven Ability to Secure Binding, Long-Term Offtake: We have executed 658 megawatts of binding PPAs
across each of our target customer verticals, including hyperscalers, major utilities (Southern California
Edison), community choice aggregators (Clean Power Alliance and Desert Community Energy) and
supermajor energy companies (Shell). These contracts were executed at attractive prices, representing
approximately $7.2 billion in potential revenue backlog. This commercial momentum is further bolstered
by a 3-gigawatt framework agreement with Google. Though not a binding, project-specific PPA, the
agreement provides a structured roadmap for future capacity expansion and establishes a repeatable model
for large-scale corporate offtake.
•Modular Design Enabling Speed to Power and Economies of Scale: We intend to deploy our technology
in 50-megawatt GeoBlocks, standardized ORC power units that we anticipate will extend our learning
curves from wellfield development to geothermal power plant construction. We expect to further support
these learning curves by concentrating our operations in multi-gigawatt GeoClusters. Each cluster can
support hundreds of EGS wells and dozens of adjacent GeoBlocks, creating unprecedented economies of
scale in the geothermal industry. We believe that this approach will make our cost-competitive EGS
solution increasingly attractive to high credit-quality offtakers and will assist us in catering to AI
hyperscalers that require speed-to-power, gigawatt-scale energy access, and 24/7 availability.
•Demonstrated Access to Asset-Level Capital Enables Financial Flexibility: As of December 31, 2025, we
had raised $320.6 million of project level capital, comprised of $175.0 million of project-level equity and
$145.6 million of project-level debt. Subsequently, on March 6, 2026, we closed an approximately $421.4
million project finance credit facility with a syndicate of nine lenders (the “Project Granite Facility”) for the
first phase of our Cape Station development. Our relationships with leading capital providers give us the
flexibility to secure lower-cost, non-dilutive project-level financing, extending the runway of our corporate
funds while accelerating deployment and substantially de-risking our funding strategy through diversified
sources of capital.
•Robust Intellectual Property Portfolio: We have a comprehensive intellectual property portfolio which
includes patents and trade secrets covering many material proprietary aspects of our EGS technology. Our
key patents and trade secrets deter competitors from employing critical but protected processes required to
create and manage the subsurface flow of geothermal brine.
•Resilient Development Approach Leveraging Secure Supply Chain: We have proven capable of
seamlessly scaling our operations through partnerships with well-established oilfield services providers
such as Liberty Energy, Helmerich & Payne and Vallourec. We have also developed durable partnerships
with ORC turbine manufacturers from key U.S. partner nations, such as Turboden (a wholly-owned
subsidiary of Mitsubishi) and Baker Hughes, which remain relatively insulated from tariffs and
procurement backlogs that are currently impacting natural gas turbines, along with primarily U.S.
headquartered balance of plant equipment providers.
•Founder-Led Management Team: Co-founders Tim Latimer and Dr. Jack Norbeck, along with our
executive leadership team, have over 125 years of energy experience across companies in upstream oil and
gas, oilfield services, and power and renewables, including Shell, BP, Chevron, BHP Billiton, NRG, Hess,
SLB, and NOV.
Our Growth Opportunities
Our principal growth strategies include:
•Progress GeoCluster Development: We have one gigawatt included in our Mature projects portfolio, with
500 megawatts categorized as Under Construction at our flagship GeoCluster Cape Station, with
commercial contracts in place and physical work underway. Additionally, we have 550 megawatts that we
categorize as Ready to Build across two different GeoClusters. These projects have already achieved key
133
development milestones, which have substantially derisked commercialization. We also have over 40
gigawatts in our Pipeline project portfolio, with 2.6 gigawatts categorized as under Advanced Development
and over 38 gigawatts under Early Development across ten GeoClusters. There are significant remaining
opportunities for development in our Prospects portfolio that spans the 595,900 acres of leased acreage
currently maintained in our portfolio. We aim to pursue development on our robust pipeline at a more
accelerated pace beyond 2030. See “Prospectus Summary—Our Project Pipeline” for more information
related to our projects.
•Execute Technology Roadmap and Achieve Nth-of-a-Kind Cost Structure: We believe our attractive
asset-level returns will continue to improve, following well-established learning curves observed across the
energy industry. By drilling deeper wells to access higher-temperature reservoirs, extending lateral lengths,
and widening wellbore diameters, we expect to achieve progressively higher power output per well.
Additional cost efficiencies will come from standardizing power generation equipment, securing multi-year
supply agreements, and capturing economies of scale across construction scopes. We believe these efforts
will reduce our costs from the current approximately $7,000/kW, already among the lowest-cost sources of
baseload power, toward our long-term target of $3,000/kW.
•Establish Programmatic Offtake Partnerships: We are pursuing multi-year, multi-gigawatt offtake
partnerships with both utilities and hyperscalers to substantially de-risk commercial development across
multiple GeoClusters. We believe that these offtake partnerships with hyperscalers – such as the 3-gigawatt
GFA – will provide us with a path to potentially capitalize on predictable, long-term demand, pricing
visibility, and opportunities for co-located, behind-the-meter development that will boost our positioning
among AI data centers.
•Expand Geographic Scope of Development: Building on our learning curves and demonstrated progress at
Project Red and Cape Station, we are codifying a repeatable playbook to expand commercial geothermal
development beyond beachhead locations in the western United States and into other power markets where
high wholesale power prices, particularly for baseload generation, present attractive growth opportunities.
Over time, we intend to deploy our EGS technology outside of the United States, prioritizing jurisdictions
with clear decarbonization mandates, supportive regulatory frameworks, and subsurface conditions
favorable to EGS development. We intend to advance this expansion through strategic partnerships and
targeted pilot projects to validate performance, adapt to local market requirements, and establish a
repeatable model for international scaling.
•Pursue Complementary Verticals: We believe we are well positioned to leverage our proven approach to
enter adjacent markets, including energy storage, industrial process heat, and district heating. We are one of
the leaders in innovation for subsurface energy storage through our tested and patented approach,
FervoFlex. Our ability to monetize both power and heat, moreover, distinguishes us from other power
providers. By unlocking new customer segments, we believe we will be able to meet the evolving needs of
industrial, commercial, municipal, and operating company energy buyers.
Properties
Our geothermal operations rely on leasehold interests obtained from federal (primarily BLM), state, and private
lessors under the Geothermal Steam Act of 1970 and related regulations. As of December 31, 2025, we controlled
approximately 595,900 acres across several principal project areas in high potential geothermal regions located in
Nevada, California, Utah, Idaho, Colorado, and New Mexico. These leases consist of approximately 66% federal
(BLM) acreage, approximately 6% state acreage, and approximately 27% private acreage. The federal leases carry a
primary term of 10 years, with annual rentals and royalty terms set by regulation and extensions in five-year
increments as provided under applicable regulations. Such federal leases are held by production when commercial
production is established on the leasehold interests. The state leases generally carry terms that range from 10–50
years with production based extensions. The private leases commonly provide 5–10 year primary terms with
extension or renewal options, and continuation while operations or production are maintained.
134
For federal BLM leases, annual rental rates are set by lease type under 43 CFR §3211. Federal leases also
require bonds for operations and reclamation and impose diligent exploration and development milestones and
requirements, including documentation and reporting of production, sales, and byproducts to the Office of Natural
Resources Revenue and BLM. We maintain bonding and compliance consistent with these requirements across the
federal portfolio. Our state leasehold position includes state leases with primary terms and production based
extensions established under state leasing regimes. State terms generally align with production based holdover and
bonding requirements consistent with geothermal development. Lastly, our private geothermal leases supplement
federal and state acreage and include negotiated economic terms tailored to project development. Private lease
royalty rates across our portfolio generally fall within the low single to low double digit percentage range, depending
on resource disposition and market. All lease types require appropriate bonding and compliance with environmental
and cultural resource stipulations.
Lease economics include upfront bonus bids at competitive sales (which vary by tract and market conditions
and have recently ranged from low single-digit to several hundred dollars per acre), annual rentals until production
that follow the applicable regulatory schedule ($1–$5/acre depending on year and type), and royalties of 1.75% of
gross proceeds for the first 10 years rising to 3.5% thereafter on electricity sales from Class II/III leases (or 10% for
arm’s length resource sales under Class I). Private royalties generally fall in the low single-digit percentage to low
double-digit percentage of revenue. Total capitalized leasehold costs (as reported in our financial statements) as
of December 31, 2025 consist primarily of bonus bids, rentals, private lease consideration, and associated
acquisition and title costs and represent a key asset for scaling our next generation geothermal projects.
Competitive Conditions and Environment
The enhanced geothermal power generation industry is experiencing a transformative phase as global demand
for reliable energy solutions increases. Enhanced geothermal systems offer the potential to provide consistent,
carbon-free baseload power by harnessing the Earth’s natural heat. This has attracted a mix of established energy
companies and innovative startups, creating a dynamic competitive environment. We also compete with several
companies with conventional geothermal energy production operations, and when we seek to obtain a new PPA, we
face competition from these companies and other renewable energy sources. When seeking to obtain new PPAs, we
also compete with wind, solar, hydro, and biomass on both headline energy price and total system cost, including
deliverability during peak demand and stressed grid conditions. The ability to offer firm, around-the-clock
renewable power, capacity value, and ancillary services can differentiate EGS offerings even where intermittent
resources bid lower prices.
Advanced Geothermal Developers
A number of companies are pursuing new forms of geothermal power generation. Companies such as AltaRock
Energy, GreenFire Energy, Eavor Technologies, Zanskar Geothermal and Minerals, and Mazama Energy are
advancing geothermal technologies. These developers are exploring various approaches, including closed-loop
systems, advanced drilling techniques, and supercritical geothermal fluids. Many have secured venture capital and
government support, and are actively engaged in pilot projects to demonstrate the viability of their technologies.
Other Renewable Energy Sources
EGS competes across multiple dimensions with wind, solar, biomass, and hydro. The core dynamic is price
versus “system value,” but we also compete with renewable energy producers when we seek to obtain new PPAs or
acquire new leasehold interests. While headline pricing may appear higher on a dollar-per-megawatt-hour basis,
EGS delivers outsized “system value” through firm, dispatchable, and high-capacity-factor generation that reduces
integration costs, avoids the need for separate capacity and firming resources, and enhances grid reliability. By
providing ancillary services, long-duration availability, and locational benefits that mitigate congestion and
curtailment, EGS can lower total delivered cost to the system, making it economically competitive even where its
energy price alone is not the lowest.
135
Fervo Energy’s Differentiation
Fervo Energy stands out with its innovative application of advanced drilling techniques and real-time data
analytics, adapted from the oil and gas industry. By utilizing horizontal drilling and fiber-optic monitoring, Fervo
enhances the efficiency and scalability of geothermal projects, allowing for precise resource management and
reduced environmental impact. This approach enables the development of geothermal resources in a broader range
of geological settings, beyond traditional hydrothermal sites.
Conventional Geothermal and Utilities
Established geothermal companies like Berkshire Hathaway Energy, Calpine (The Geysers), and Ormat
Technologies continue to comprise the substantial majority of the current geothermal market with conventional
hydrothermal projects. These companies benefit from decades of operational experience and established customer
relationships. Their reliance on specific geological conditions limits their ability to expand rapidly into new areas.
However, should they or other better capitalized competitors expand their offerings into EGS technology, they may
be able to outcompete us for the leasing of geothermal properties or signing PPAs with high credit-quality offtakers
or development of EGS projects. According to Rystad, as of December 31, 2025, there was only approximately 4
gigawatts of installed geothermal capacity in the U.S., with limited plans for new projects, with only one project
currently under construction with capacity greater than 25 megawatts.
Research Organizations
National laboratories and research institutions, such as the National Lab of the Rockies and Lawrence Berkeley
National Laboratory, play a crucial role in advancing geothermal science. Their research focuses on resource
characterization, drilling technology, and reservoir management. Fervo Energy maintains collaborative relationships
with these institutions to validate its technologies and improve project outcomes.
Fervo Energy’s Competitive Edge:
•Innovative Drilling and Monitoring: Fervo Energy leverages horizontal drilling and fiber-optic technology
to optimize geothermal resource extraction, enhancing efficiency and reducing costs compared to
traditional methods.
•Scalability and Flexibility: Fervo’s technology supports modular project development, enabling rapid
scaling and adaptation to various geological conditions, making it competitive with other renewable energy
sources.
•Environmental Stewardship: The use of closed-loop systems minimizes water usage and surface impact,
addressing environmental concerns and facilitating regulatory approval.
•Strategic Partnerships: Collaborations with technology providers and research institutions enhance Fervo’s
capabilities and accelerate technology deployment.
•Intellectual Property and First-Mover Advantage: Fervo Energy’s proprietary technologies and early
market entry position it as a leader in the enhanced geothermal sector, creating barriers to entry for
potential competitors.
Fervo Energy’s unique technological approach and strategic partnerships position it favorably in the growing
enhanced geothermal power generation market and the clean energy industry more generally.
Google Geothermal Framework Agreement
On March 19, 2026, we entered into the GFA with Google Energy LLC that establishes a structured process for
the development of geothermal projects across specified regions of the United States. The GFA contemplates up to
three gigawatts of contracted geothermal capacity through December 31, 2033, and establishes a development
process whereby we will submit projects to Google for evaluation. In the event we are unable to submit such
proposals, we may be obligated to pay Google liquidated damages. If either party withdraws from a project at certain
136
stages, the withdrawing party may be required to pay the other party a termination fee, and Google holds certain
rights of first refusal over portions of our project pipeline, including follow-on and withdrawn projects. Google
holds several rights of first refusal over portions of project pipeline under the GFA. The GFA also restricts our
ability to accept investment from entities defined as “Competitors” under the GFA and requires us to implement
certain protective measures for Google’s benefit if an entity identified as a competitor acquires any interest in us or
our project subsidiaries. The GFA does not constitute a power purchase agreement, and Google retains discretion
over whether to proceed with any individual project. For more information, see “Risk Factors—The GFA, and other
non-binding agreements we may enter into in the future, do not obligate any party to purchase any power from us
and may not result in definitive offtake agreements, commercial projects, or revenue.”
Intellectual Property
As of December 31, 2025, we had six granted U.S. patents and over 35 pending patent applications, including
nine U.S. non-provisional applications, seven U.S. provisional patent applications, 11 pending PCT applications and
five pending patent applications with the European Patent Office. The six granted U.S. patents are projected to
expire between 2039 and 2044, before accounting for potentially available patent term adjustments or patent term
extension, as appropriate, and assuming timely payment of appropriate maintenance, renewal, annuity and other
governmental fees. We believe our portfolio of intellectual property presents significant barriers against any other
potential competitor seeking to replicate our fast, low-cost approach to deployment of enhanced geothermal power
generation.
We intend to protect our intellectual property rights via a combination of patent, trademark, and trade secret
laws in the United States and other jurisdictions, as well as with contractual protections, to establish, maintain and
enforce rights in our proprietary technologies. Unpatented research, development, know-how, and engineering skills
make an important contribution to our business. We pursue patent protection only when it is consistent with our
overall strategy for safeguarding intellectual property.
In addition, we seek to protect our intellectual property rights through non-disclosure and invention assignment
agreements with our employees and consultants and through non-disclosure agreements with business partners and
other third parties. Our U.S. patents and patent applications and foreign patent applications generally relate to
Enhanced Geothermal Systems and related drilling, well construction, reservoir stimulation, and subsurface heat
extraction technologies. We own six U.S. patents, which are set forth in the table below.
137
Country | Ownership | Patent Number | Type of Patent | Relevant Technology | ||||
United States | Fervo Energy Company | 11927369 | Utility | A method and system that may be used for storing energy in a geothermal system and recovering both the stored energy as well as thermal energy on demand. | ||||
United States | Fervo Energy Company | 11808121 | Utility | Encourage even distribution of fluid flow across multiple fracture zones intersecting a horizontal well by using the Limited Entry Perforation Pressure Drop effect both during stimulation and long- term circulation. | ||||
United States | Fervo Energy Company | 12281550 | Utility | Encourage even distribution of fluid flow across multiple fracture zones intersecting a horizontal well by using the Limited Entry Perforation Pressure Drop effect both during stimulation and long- term circulation. | ||||
United States | Fervo Energy Company | 12297724 | Utility | Manipulate near-wellbore properties of the wellbore or the formation using chemical or mechanical processes to improve and control fluid flow distribution along a horizontal well. | ||||
United States | Fervo Energy Company | 12378866 | Utility | A method and system that may be used for storing energy in a geothermal system and recovering both the stored energy as well as thermal energy on demand. | ||||
United States | Fervo Energy Company | 12535246 | Utility | A method and system that may be used for storing energy in a geothermal system and recovering both the stored energy as well as thermal energy on demand. |
Government Regulation
Fervo Energy operates within a complex regulatory landscape that governs geothermal energy production in the
United States. This framework includes federal, state, and local regulations that oversee the exploration,
development, and operation of geothermal resources. Compliance with these regulations is essential for the
successful deployment and operation of Fervo Energy’s geothermal projects.
Federal Regulations
At the federal level, geothermal energy production is primarily regulated by the Department of the Interior
(“DOI”) through the Bureau of Land Management (“BLM”) and the U.S. Forest Service (“USFS”) for projects on
public lands.
138
The Geothermal Steam Act of 1970 (“GSA”): GSA provides the legal framework for leasing public lands for
geothermal development. The BLM oversees the leasing process, ensuring that geothermal projects comply with
environmental and land use regulations.
•Leasing and Permitting: The Geothermal Steam Act provides the legal framework for leasing public lands
for geothermal development. It authorizes the DOI, primarily through the BLM, to issue leases for
geothermal resource exploration and development. The act imposes restrictions on where and how
geothermal resources can be developed, requiring compliance with land use plans and environmental
regulations.
•Environmental Protection: The act mandates that leaseholders must adhere to stipulations designed to
protect certain important natural resources, wildlife habitats, and cultural sites. This includes conducting
environmental assessments and implementing mitigation measures as necessary.
•Royalty Payments and Revenue Sharing: Leaseholders are required to pay royalties on the geothermal
resources they extract. The act outlines the distribution of these royalties, with a portion allocated to the
federal government and the remainder shared with state and local governments to support community
development and infrastructure.
National Environmental Policy Act (“NEPA”): Geothermal projects may be subject to federal, state, or local
environmental reviews, including under the federal NEPA, or state analogues. NEPA requires federal agencies to
assess the environmental impacts of their actions, such as a federal agency approving geothermal projects on federal
lands. This process may involve preparing an Environmental Assessment (“EA”) or an Environmental Impact
Statement (“EIS”) to evaluate potential environmental effects and identify mitigation measures. On February 25,
2025, the Council on Environmental Quality (“CEQ”) promulgated an interim final rule that rescinded all CEQ
regulations implementing NEPA, and many federal agencies have updated or begun the process of preparing their
own new or updated NEPA-implementing rules, guidelines and procedures. The impact of changes to NEPA
regulations and procedures remains uncertain and could have an effect on the ability of geothermal projects to obtain
governmental permits. Geothermal energy projects may be subject to similar environmental review requirements at
the state and local level in jurisdictions with NEPA equivalents, such as the California Environmental Quality Act in
California.
•EA and EIS: An EA is conducted to determine whether a project will have significant environmental
effects. If significant impacts are anticipated, a more comprehensive EIS is required. This process can be
time consuming and expensive, especially if it involves preparing an EIS.
•Public Involvement and Transparency: NEPA emphasizes public involvement in the environmental review
process. Agencies frequently provide opportunities for public comment and participation, ensuring
transparency and accountability. This can lead to project delays if significant public opposition or
environmental concerns are raised, and can alter the nature of a proposed project either by limiting the
scope of the project or by identifying impacts that an agency decides must be mitigated. Project opponents
may challenge agency decision-making based on alleged deficiencies in the NEPA process, which may
result in increased costs, permitting and development delays and potentially even permit vacatur.
•Mitigation and Alternatives: Under NEPA, agencies must identify and evaluate reasonable alternatives to
proposed actions, and they must consider potential mitigation measures to minimize adverse environmental
impacts. This can impose additional costs and operational constraints on geothermal projects.
Federal Energy Regulatory Commission (“FERC”): While FERC’s role in geothermal energy is limited
compared to other energy sectors, it may be involved in the regulation of power sales and interconnection
agreements for geothermal projects.
•Interconnection and Transmission: While FERC’s role in geothermal energy is limited compared to other
energy sectors, it oversees the interconnection of geothermal projects to the electric grid. This includes
ensuring that interconnection agreements comply with federal standards and do not adversely affect grid
reliability.
139
•Power Sales and Market Regulations: FERC regulates the sale of electricity generated by geothermal
projects in interstate commerce. This includes ensuring that power sales agreements are just and reasonable
and do not result in undue discrimination or preference.
•Licensing and Compliance: For geothermal projects that involve hydroelectric components or are located
on federal lands with water resources, FERC may require additional licensing and compliance with specific
regulations. This can include adherence to water quality standards and protection of aquatic habitats.
Other environmental regulations. The following list provides an overview of the types of federal, state and
local environmental laws and regulations required to develop and operate geothermal projects in the United States.
Depending on the state or locality where a project is located, such project may be subject to additional
environmental regulations. Failure to comply with any of these environmental laws and regulations, as amended
from time to time, may have a material adverse impact on our capital expenditures, results of operations or financial
position.
•Management, Disposal, and Remediation of Hazardous Substances. Geothermal projects and materials
handled, stored, or disposed of on project properties may be subject to the federal Resource Conservation
and Recovery Act, the Toxic Substances Control Act, the Comprehensive Environmental Response,
Compensation, and Liability Act (“CERCLA”), and analogous state laws. CERCLA imposes liability,
without regard to fault or the legality of the original conduct, on certain classes of persons known as
potentially responsible parties, with respect to the release of “hazardous substances” into the environment.
Potentially responsible parties include the current and past owners or operators of a disposal site or site
where the release occurred and third parties who disposed of or arranged for the disposal of hazardous
substances found at such sites. Under CERCLA, potentially responsible parties may be subject to strict,
joint and several and retroactive liability for the remediation of hazardous substances that have been
released into the environment and for damage to natural resources. Geothermal project developers could be
responsible for the costs of investigation and cleanup, and for any related liabilities, including claims from
neighboring landowners, governmental agencies, citizen organizations and other third parties for damage to
property, persons, or natural resources allegedly caused by the release of hazardous substances into the
environment.
•Clean Water Act. The Clean Water Act (“CWA”) and comparable state laws impose restrictions and strict
controls regarding the discharge of pollutants into or near waters of the United States (“WOTUS”) or state
waters. The discharge of pollutants into regulated waters is prohibited, including water discharges such as
storm water runoff associated with construction activities, except in accordance with the terms of a permit
issued by the EPA or an analogous state agency. The discharge of dredge and fill material into regulated
waters, including wetlands, is also prohibited, unless authorized by a permit issued by the Army Corps of
Engineers (“USACE”). Geothermal project developers may also be required to mitigate any loss of wetland
functions and values. Additionally, geothermal project developers may be required to follow a variety of
best management practices to ensure that water quality is protected and the adverse environmental impacts
of the project to water resources are minimized (e.g., erosion control measures).
•Clean Air Act. Certain operations may be subject to federal, state, or local permitting requirements under
the Clean Air Act, which regulates the emission of air pollutants, including greenhouse gases, and may
require obtaining permits and approvals prior to construction. For example, wells and geothermal power
plants require a preconstruction air permit before earthwork can commence. In addition, in some
jurisdictions, the wells that are to be used for production require, and those used for injection may require,
air emissions permits to operate. Internal combustion engines and other air pollutant emissions sources at
the geothermal projects may also require air emissions permits, including managing fugitive dust emissions
during construction. These permits are typically issued at the state or county level.
•Threatened, Endangered and Protected Species. Federal agencies considering permit applications for
geothermal projects that may affect species listed under the federal Endangered Species Act (“ESA”) are
required to consult with the United States Fish and Wildlife Service (“USFWS”) (for terrestrial and
freshwater species) and the National Marine Fisheries Service (for marine and anadromous species). The
140
ESA also prohibits the “take” of a threatened or endangered species absent authorization. Geothermal
projects are also required to comply with the Migratory Bird Treaty Act and the Bald and Golden Eagle
Protection Act, which provide various protections for migratory birds and bald and golden eagles,
respectively. Most states also have similar laws. Federal and state agencies may require geothermal project
developers to conduct avian and bat risk assessments prior to issuing permits for geothermal projects, and
may also require ongoing monitoring and mitigation activities, best management practices, or compensation
mitigation.
Overall, these regulatory frameworks impose various restrictions and limitations on geothermal power
generation operations to ensure environmental protection, public involvement, and fair market practices.
Compliance with these regulations is essential for the successful development and operation of geothermal projects.
State and Local Regulations
State governments play a significant role in regulating geothermal energy production, with each state having its
own permitting and regulatory requirements. These regulations often cover drilling permits, water rights, and
environmental protection measures. Local governments may also impose additional zoning and land use
requirements.
California
•California Energy Commission (“CEC”): The CEC is responsible for energy policy planning and
development in California. It oversees the permitting process for geothermal projects, ensuring they align
with state energy goals and environmental standards. The CEC also conducts research and provides funding
for renewable energy projects, including geothermal.
•California Department of Conservation, Division of Oil, Gas, and Geothermal Resources (“DOGGR”):
DOGGR regulates the drilling, operation, and closure of geothermal wells. It ensures that geothermal
operations comply with safety and environmental standards to protect public health and natural resources.
•California Public Utilities Commission (“CPUC”): The CPUC regulates the state’s electricity market,
including the integration of geothermal energy. It enforces California’s renewable portfolio standards
(RPS), which require utilities to source a certain percentage of their energy from renewable sources,
including geothermal.
Colorado
•Colorado Division of Water Resources: This division manages water rights and usage, which are critical for
geothermal operations that require water for cooling or reinjection. It ensures that geothermal projects do
not adversely affect water availability for other users.
•Colorado Energy Office: The office promotes the development of renewable energy, including geothermal,
through policy support, incentives, and public-private partnerships. It works to advance Colorado’s clean
energy goals and reduce greenhouse gas emissions.
Idaho
•Idaho Department of Water Resources (“IDWR”): IDWR regulates the exploration and development of
geothermal resources. It issues permits for drilling and water use, ensuring that geothermal projects comply
with state water laws and environmental standards.
•Idaho Public Utilities Commission (“IPUC”): The IPUC oversees the integration of geothermal energy into
Idaho’s electricity grid. It regulates utility rates and services, ensuring that geothermal energy contributes to
the state’s energy mix in a cost-effective and reliable manner.
141
New Mexico
•New Mexico Energy, Minerals and Natural Resources Department (“EMNRD”): EMNRD manages the
development of geothermal resources, providing permits for exploration and production. It ensures that
geothermal projects comply with state environmental regulations and land use policies.
•New Mexico Environment Department (“NMED”): NMED enforces environmental regulations related to
air and water quality for geothermal projects. It ensures that geothermal operations do not negatively
impact the environment or public health.
Nevada
•Nevada Division of Minerals: This division oversees the permitting and regulation of geothermal resources.
It ensures that geothermal projects are developed sustainably and in compliance with environmental
protection standards.
•Nevada Public Utilities Commission (“PUCN”): The PUCN regulates the integration of geothermal energy
into Nevada’s electricity grid. It supports the state’s renewable energy initiatives and ensures that
geothermal energy contributes to Nevada’s energy goals.
•Nevada Division of Environmental Protection (“NDEP”): The NDEP oversees environmental compliance
for geothermal development in Nevada, including permitting for air quality, water resources, and surface
disturbance. It ensures that geothermal projects meet state environmental standards and operate in a manner
that protects Nevada’s natural resources throughout the project lifecycle.
Utah
•Utah Division of Water Rights: This division manages water rights and usage for geothermal projects,
ensuring compliance with state water laws. It regulates the allocation and use of water resources for
geothermal operations.
•Utah Geological Survey (“UGS”): The UGS provides research and data on geothermal resources to support
development and policy-making. It conducts studies and assessments to identify geothermal potential and
inform regulatory decisions.
Washington State
•Washington State Department of Natural Resources (“DNR”): The DNR regulates the exploration and
development of geothermal resources, ensuring compliance with state environmental and land use laws. It
manages state lands and resources, including geothermal energy.
•Washington Utilities and Transportation Commission (“UTC”): The UTC oversees the integration of
geothermal energy into Washington’s electricity grid. It regulates utility rates and services, supporting the
state’s renewable energy policies and goals.
In addition to these state-level regulations, local governments in each state may impose additional zoning, land
use, and environmental regulations that geothermal projects must comply with. These local regulations can vary
widely depending on the specific municipality or county where a project is located. Fervo Energy and other
geothermal developers must navigate this complex regulatory landscape to ensure compliance and facilitate project
development.
Other Environmental Permits
In the United States, geothermal projects may be required to obtain a variety of federal, state and local permits,
approvals or other authorizations. Delays in obtaining or failure to obtain any required permit, approval or other
142
authorizations, and non-compliance with applicable permits and approvals, may have a material adverse impact on
our capital expenditures, results of operations or financial positions.
•Land Use Approvals: Geothermal projects may require certain land use approvals and permits, such as
operation and utilization plan approvals, right of way approvals where the geothermal project is entirely or
partly on BLM or USFS lands, and special use permits or conditional use permits from local planning
authorities. Such permits and approvals may require a review of environmental impacts in conformance
with NEPA as noted above. Federal, state and local land use approvals often impose conditions and
restrictions on the construction, scope and operation of geothermal projects.
•Well Permits. Geothermal projects typically have four types of wells: (i) resource confirmation wells
designed to define and verify the geothermal resource, (ii) production wells to extract brine for the power
plant, (iii) injection wells to inject the brine back into the subsurface resource, and (iv) monitoring wells to
monitor the geothermal resource. For example, on BLM lands in Nevada, California, Oregon, Utah, and
Idaho, the well permits take the form of geothermal drilling permits for well installation. Approvals are also
required to modify wells, including for use as production or injection wells. For all wells drilled in Nevada,
a geothermal drilling permit must also be obtained from the Nevada Division of Minerals. Those wells in
Nevada to be used for injection will also require UIC permits from the Nevada Division of Environmental
Protection, Bureau of Water Pollution Control. Geothermal wells in Utah require permits from the Utah
Division of Water Rights, and injection wells require a permit from the Utah Department of Environmental
Quality.
•Ministerial Permits: Ministerial permits such as building permits, hazardous materials storage and
management permits, and pressure vessel operating permits may be required for geothermal projects.
•Other Permits: Our operations require numerous other federal, state, and local authorizations, as discussed
above. For example, in Nevada we may be required to obtain water rights permits if water cooling is being
used at a power plant. In addition to permits, there are various regulatory plans and programs that are
required, including risk management plans (federal and state programs) and hazardous materials
management plans (e.g., in California). In some cases, our projects may also require permits, issued by the
applicable federal agencies or authorized state agencies, regarding threatened or endangered species,
permits to impact wetlands or other waters and notices of construction of structures which may have an
impact on airspace, as noted above.
We may experience regulatory delays in obtaining various environmental permits and approvals required for
geothermal projects in development and construction. These delays may lead to increases in the time and cost to
complete these projects. Non-compliance with any environmental permit and approval requirements could result in
fines and penalties and could also affect our ability to operate the affected project.
Fervo Energy’s Regulatory Strategy
•Innovative Technology and Compliance: Fervo Energy’s use of advanced drilling techniques and real-time
data analytics aligns with regulatory requirements by enhancing resource management and minimizing
environmental impact. This approach supports compliance with both federal and state regulations.
•Environmental Stewardship: Fervo Energy is committed to environmental stewardship, employing closed-
loop systems that reduce water usage and surface impact. This commitment facilitates regulatory approval
and aligns with NEPA’s environmental protection goals.
•Strategic Partnerships and Engagement: Fervo Energy collaborates with regulatory agencies, research
institutions, and industry partners to ensure compliance and advance geothermal technology. Early
engagement with stakeholders and proactive environmental analysis can help streamline the regulatory
process.
•Site Selection and Planning: Fervo Energy strategically selects sites with strong industrial use and limited
environmental sensitivity to support eligibility for streamlined regulatory reviews. Adaptive planning and
143
contingency buffers are incorporated into project schedules to accommodate varying levels of regulatory
scrutiny.
•Impact on Fervo Energy: The regulatory landscape presents both challenges and opportunities for Fervo
Energy. By leveraging innovative technology, maintaining strong environmental practices, and engaging
with regulatory bodies, Fervo Energy is well-positioned to navigate the regulatory environment and
advance its geothermal projects. The company’s proactive approach to regulatory compliance and
environmental stewardship supports its mission to deliver reliable geothermal energy solutions.
Our People and Human Capital
Fervo’s success is built by its people, whose expertise, dedication, and collaboration drive every milestone we
achieve.
We embed our core values into our human capital strategy. We strive to “build things that last” by placing
health, safety, and environmental stewardship at the center of our operations and decision-making. We seek to
“innovate through collaboration,” encouraging open, cross functional dialogue, and the regular exchange of ideas
with internal and external experts to solve complex problems. We emphasize the importance of “doing what we say
we are going to do,” emphasizing transparency, accountability, and rigorous execution so that teams can plan
effectively and deliver on commitments. And we aim to “stop and smell the roses,” fostering a sustainable work
pace, community-building, and employee well-being so our people can do their best work over the long term.
Together, these values provide a consistent framework for our human capital programs, including recruiting,
development, and engagement while supporting a safe, inclusive, and performance-oriented workplace aligned with
sustainable growth and long-term value creation.
As of December 31, 2025, we employed 199 full-time employees and part-time employees. None of our
employees are represented by a labor union or are party to a collective bargaining agreement, and we have had no
labor-related work stoppages. We believe that we have good relationships with our employees.
We believe that in order to be successful, each of our employees must believe that our mission is worth working
for. As we scale rapidly, we are striving to build a workplace where every voice matters, innovation thrives, and
integrity guides our actions. To achieve this, we invest in culture, talent, inclusion, and our relationships with the
communities where we serve.
Facilities
Our corporate headquarters are located in Houston, Texas and consist of approximately 53,714 square feet. We
also lease additional office space in Colorado and also lease offices in California, Nevada, and Utah. We believe that
our corporate headquarters and other offices are adequate for our immediate needs and that we will be able to obtain
additional or substitute space, as needed, on commercially reasonable terms.
Legal Proceedings
We are currently involved in, and may in the future from time to time become involved in, legal proceedings,
claims and investigations in the ordinary course of our business, including with our team members and providers.
Although the results of these legal proceedings, claims and investigations cannot be predicted with certainty, we do
not believe that the final outcome of any matters that we are currently involved in are reasonably likely to have a
material adverse effect on our business, financial condition or results of operations. Regardless of final outcomes,
however, any such proceedings, claims, and investigations may nonetheless impose a significant burden on
management and employees and be costly to defend, with unfavorable preliminary or interim rulings.
144
MANAGEMENT
The following table sets forth information regarding our executive officers and members of our board of
directors, including their ages as of the date of this prospectus. With respect to our directors, each biography
includes information regarding the experience, qualifications, attributes, or skills that caused our board of directors
to determine that such person should serve as a director of our company.
Name | Age | Position(s) | ||
Executive Officers | ||||
Tim Latimer ................................ | 36 | Chief Executive Officer and Chair of the Board | ||
Jack Norbeck ............................... | 38 | Chief Technology Officer | ||
David Ulrey ................................. | 39 | Chief Financial Officer | ||
Gustavo Torres ............................ | 45 | Senior Vice President, General Counsel & Corporate Secretary | ||
Sarah Jewett ................................ | 36 | Senior Vice President, Strategy | ||
Quinn Woodard Jr. ...................... | 37 | Vice President, Operations | ||
Dawn Owens ............................... | 42 | Senior Vice President, Head of Development & Commercial Markets | ||
Christian Gradl ............................ | 43 | Senior Vice President, GeoBlock Factory | ||
Directors | ||||
Tim Latimer ................................ | 36 | Chief Executive Officer and Chair of the Board | ||
Margaret C. Whitman*(³) ............ | 69 | Lead Independent Director | ||
Robert Keehan(²)(³) ....................... | 60 | Director and Chair of the Audit Committee | ||
Jessica Uhl(¹)(²) ............................. | 58 | Director and Chair of the Nominating and Corporate Governance Committee | ||
Anne Cleary(²)(³) .......................... | 65 | Director and Chair of the Compensation Committee | ||
Robert (Trey) Lowe III(¹) ............ | 50 | Director | ||
Ion Yadigaroglu(¹) ....................... | 56 | Director |
__________________
*Lead independent director.
(1)Member of the Nominating and Corporate Governance Committee.
(2)Member of the Audit Committee.
(3)Member of the Compensation Committee.
Executive Officers & Directors
Tim Latimer has served as our Chief Executive Officer and a member of our board of directors since 2018.
Prior to founding Fervo Energy, Mr. Latimer worked as a Drilling Engineer at BHP Billiton, and as a Consultant
with Biota Technology prior to that. Mr. Latimer was also previously a fellow at Activate and the Clean Energy
Leadership Institute. Mr. Latimer holds a Bachelor of Science degree in Mechanical Engineering from the
University of Tulsa, a Master of Business Administration from Stanford University Graduate School of Business and
Master of Science in the Emmet Interdisciplinary Program in Environment and Resources from Stanford University.
Mr. Latimer was honored as an Innovator Under 35 by MIT Technology Review in 2024 and a Presidential
Leadership Scholar in 2022 and was granted the Geothermal Pioneer Award by Geothermal Rising in 2023. We
believe Mr. Latimer’s visionary leadership, innovative thinking, and deep commitment to sustainable energy
solutions, as well as his extensive knowledge and experience in geothermal energy development and renewable
energy markets, make him particularly qualified to serve as a member of our board of directors.
Jack Norbeck, PhD., has served as our Chief Technology Officer since 2017. He also served as a member of
the board of directors from 2019 until 2026. Prior to founding Fervo Energy, Dr. Norbeck held various expert
research and engineering roles in the energy and infrastructure sectors, including Fellow at Activate, Research
Assistant at the Earth Sciences Division of the Lawrence Berkeley National Laboratory, Mendenhall Postdoctoral
Fellow and Research Petroleum Engineer at the Earthquake Science Center of the U.S. Geological Survey, and
Computational Geophysicist at Idaho National Laboratory. Dr. Norbeck holds a Bachelor of Science degree in Civil
145
Engineering from the University of Colorado at Boulder, a Master of Science in Civil Engineering from the
Colorado School of Mines, and a Doctor of Philosophy in Energy Resources Engineering from Stanford University.
David Ulrey has served as Chief Financial Officer of Fervo Energy since 2021. Prior to joining Fervo Energy,
Mr. Ulrey held finance and leadership positions in the energy and infrastructure sectors, including at NOV where he
held positions as Director of NOV Renewables and Director of Corporate Management and at Simmons &
Company, Energy Specialists of Piper Jaffray where he held a position as an Investment Banking Associate. He
began his career as an Officer in the U.S. Army. Mr. Ulrey holds a Bachelor of Science in Economics from the U.S.
Military Academy at West Point and a Master of Business Administration from the Harvard School of Business.
Gustavo Torres has served as Senior Vice President, General Counsel & Corporate Secretary of Fervo Energy
since 2023. Mr. Torres served as General Counsel at Prime Natural Resources for over ten years where his
responsibilities included overseeing the legal, risk, compliance, and corporate governance functions at Prime Natural
Resources and its portfolio companies, including FlexSteel Pipeline Technologies. He began his career as an
Associate at Akin Gump Straus Hauer & Feld and DLA Piper. Mr. Torres holds a Bachelor of Arts in Economics
from Grinnell College and a Juris Doctor from the University of Texas School of Law.
Sarah Jewett serves as Senior Vice President, Strategy at Fervo Energy. Since 2020, Ms. Jewett has led
Fervo’s Strategy department, managing the integration of policy, communications, strategy, and people operations to
drive Fervo’s growth. Prior to Fervo, she held leadership roles in corporate development at Select Energy Services
and worked as an engineer at Schlumberger. Ms. Jewett earned a Bachelor of Arts in Engineering Sciences and
Studio Art and a Bachelor of Engineering in Mechanical Engineering from Dartmouth College and a Master of
Business Administration from the Harvard School of Business.
Quinn Woodard Jr. serves as Fervo’s Vice President, Operations. Prior to his promotion to lead operations,
Mr. Woodard led the engineering, construction, and delivery of Fervo’s power facilities. Prior to joining Fervo, Mr.
Woodard held engineering and supervisory roles at Chevron for nine years. Mr. Woodard holds a Bachelor of
Sciences in Electrical Engineering from the University of Tulsa and a Master of Business Administration from
Indiana University’s Kelley School of Business.
Dawn Owens has served as Senior Vice President, Head of Development & Commercial Markets at Fervo
Energy since 2020. Ms. Owens previously held roles in management and business development at various energy
companies, including East Bay Community Energy, Experis, NRG Energy, and GenOn Energy. Ms. Owens holds a
Bachelor of Arts in Economics from New Mexico State University and a Master of Business Administration from
the University of San Francisco’s Masagung Business School.
Christian Gradl is Fervo Energy’s Senior Vice President, GeoBlock Factory, where he leads all aspects of the
engineering, construction, and delivery for Fervo’s modular wellfield and power facilities. Mr. Gradl joined Fervo
Energy in 2019 and prior to that was a member of Fervo’s Technical Advisory Board since 2018. Before joining
Fervo, he had an extensive career in well engineering and operations management for Hess Corporation and BP. In
the Bakken Shale Mr. Gradl managed a $400MM annual budget and pioneered many innovative completions
practices. He further led shale appraisal activities in the Utica shale and for several international shale prospects.
Christian holds a Bachelor of Science and a Master of Science in Petroleum Engineering from the University of
Leoben in Austria and an MBA from the University of Texas at Austin.
Margaret C. Whitman has served as a non-executive independent member and the Lead Independent Director
of our board of directors since 2026. Ms. Whitman is an experienced technology and business executive who has
served as chief executive officer of three major companies. She was confirmed by unanimous Senate vote to serve as
the eighteenth United States Ambassador to Kenya from July 2022 to November 2024, leading the tenth largest U.S.
embassy in the world. Prior to that, she was Co-Founder, President and Chief Executive Officer of Quibi Holdings,
LLC, a mobile media company, from 2018 to 2021. Ms. Whitman served as Chief Executive Officer of Hewlett
Packard Enterprise Company from 2015 to 2018 and as President and Chief Executive Officer of Hewlett-Packard
Company from 2011 to 2015, where she led a major business turnaround of an iconic Fortune 10 technology
company with $125 billion in revenue and 325,000 employees. She also served as President and Chief Executive
Officer of eBay Inc. from 1998 to 2008. Ms. Whitman currently serves on the boards of directors of CoreWeave,
146
Inc. and Motive Technologies and has previously served on the boards of The Procter & Gamble Company and
General Motors Company. She also serves on the boards of The Nature Conservancy, Bridgespan, the San Francisco
Downtown Development Corporation, and the Partnership for San Francisco. She holds an A.B. in Economics from
Princeton University and an M.B.A. from Harvard Business School. Ms. Whitman has been named to Forbes’ list of
the World’s 100 Most Powerful Women and Fortune’s list of the 50 Most Powerful Women in Business on multiple
occasions. We believe Ms. Whitman is well-qualified to serve as a member of our board of directors given her
extensive experience scaling and leading major public companies, her deep expertise in technology and operations,
and her broad governance experience across public company boards.
Robert Keehan has served as a non-executive independent member of our board of directors and Chair of the
Audit Committee since 2026. Mr. Keehan is a seasoned energy sector audit and assurance leader with 37 years of
experience at PricewaterhouseCoopers LLP, including 28 years as a partner. He served in a leadership role in PwC’s
Global firm with responsibilities that addressed strategy, growth, risk management, technical matters, business
models, and technology. Throughout his career, Mr. Keehan served as the lead audit partner for multiple Fortune
250 energy, utility, and renewables companies and managed complex transactions exceeding $50 billion, including
acquisitions, carve-outs, joint ventures, IPOs, and spin-offs. He has collaborated with industry bodies and regulators,
including the Securities and Exchange Commission, the Federal Energy Regulatory Commission, and the Financial
Accounting Standards Board. He is a member of the National Association of Corporate Directors, and he completed
Northwestern University’s Kellogg School of Management Corporate Governance course in 2025. He holds a
B.B.A. in Accounting from Texas A&M University. We believe Mr. Keehan is well-qualified to serve as a member
of our board of directors given his extensive audit and assurance leadership in the energy sector, his expertise in
financial reporting, risk management, and ESG, and his deep familiarity with corporate governance matters.
Jessica Uhl has served as a non-executive independent member and Chair of the Nominating and Corporate
Governance Committee of our board of directors since 2026. Ms. Uhl is an experienced global energy executive and
director with 25 years of energy sector experience. She served as Chief Financial Officer and Executive Board
Director of Shell plc from 2017 to 2022, where she was responsible for a 10,000-person finance organization,
oversaw IT and data operations, and partnered with the CEO to design and deliver Shell’s corporate-wide strategy.
She served as President of GE Vernova from 2024 to 2025. Ms. Uhl previously served as a non-executive board
member of General Electric, where she was a member of the Audit Committee, and Goldman Sachs, where she was
a member of the Audit, Risk, and Governance Committees. She currently serves as a Trustee and Audit Committee
Chair of RMI and on the boards of Mission Possible Partnership and OpenMinds and is an advisor to the Columbia
Center on Global Energy Policy. She holds a B.A. in Political Economy from the University of California, Berkeley,
and an M.B.A. from INSEAD. We believe Ms. Uhl is well-qualified to serve as a member of our board of directors
given her extensive executive and board leadership experience at major global energy companies, her deep expertise
in financial management and corporate governance, and her strong background in ESG and climate strategy.
Anne Cleary has served as a non-executive independent member of our board of directors since 2023. Going
forward, she will serve as the Chair of the Compensation Committee. Ms. Cleary is an experienced power sector
executive and director who has held roles such as Chief Risk Officer and Chief Integration Officer. She served as
Audit and Risk Committee Chair for several private power companies with assets exceeding $2 billion and has
overseen Scope 1 and 2 reporting and GRESB reporting as Audit and Risk Committee Chair for a large private
power generator. Ms. Cleary also served on the Compensation and Nomination & Corporate Governance
Committees of Ascendant Group, a public energy services company, from 2018 to 2020. She has served as a for-
profit board director for seven years in various capacities and is a member of NACD and the Private Directors
Association. She holds a Bachelor of Electrical Engineering and a Master of Business Administration from Auburn
University. Ms. Cleary was honored as the Outstanding Auburn Electrical Engineering Alumna in 2010 and the
Distinguished Auburn Engineer in 2013. We believe Ms. Cleary is well-qualified to serve as a member of our board
of directors given her extensive executive and board leadership experience in the power sector and her expertise in
risk management and corporate governance.
Robert (Trey) Lowe III has served as a non-executive member of our board of directors since 2026. He
previously served as a board observer on behalf of Devon Energy Corporation. Mr. Lowe is Executive Vice
President and Chief Technology Officer of Devon Energy Corporation, a leading oil and natural gas exploration and
production company, a position he has held since January 2025. Mr. Lowe joined Devon in 2005 and has held
147
various technical and leadership positions with responsibilities spanning U.S. and international operations. He
previously served as Vice President and Chief Technology Officer from 2022 to February 2025, and as Vice
President of Technology from 2019 to 2022. In his current role, Mr. Lowe is responsible for Devon’s technology,
digital security, project management, and energy ventures functions. Before joining Devon, Mr. Lowe worked for
Schlumberger in technical roles in the U.S. and Norway. He currently serves on the board of Altira Group Fund VI
and VII, and is a past distinguished lecturer for the Society of Petroleum Engineers. Mr. Lowe holds a B.S. in
Chemical Engineering from Oklahoma State University. We believe Mr. Lowe is well-qualified to serve as a
member of our board of directors given his extensive technology leadership experience in the energy sector, his deep
expertise in digital transformation and project management, and his strong background in innovation and energy
ventures.
Ion Yadigaroglu has served as a non-executive member of our board of directors since 2021. Mr. Yadigaroglu
is the Managing Partner of Capricorn Investment Group, a long-term investment firm focused on sustainable and
climate-related opportunities, and a Partner of Capricorn’s Technology Impact Fund. He currently serves on the
boards of several private companies, including Erthos, Twelve, and Seurat, and has served on the boards of the
Environmental Defense Fund since 2023. Through Capricorn and its affiliated entities, Mr. Yadigaroglu has
extensive experience in capital allocation, corporate financing, and strategic planning across the energy and
sustainability sectors. His skills matrix reflects significant experience in international business, capital allocation and
corporate financing, strategic planning, ESG and climate risks, and industry experience. Mr. Yadigaroglu holds a
Ph.D. in Astrophysics from Stanford University. We believe Mr. Yadigaroglu is well-qualified to serve as a member
of our board of directors given his deep investment expertise in the energy and sustainability sectors, his extensive
board experience across climate-focused technology companies, and his strong background in capital allocation and
strategic planning.
Family Relationships
There are no family relationships among any of our directors or executive officers.
Composition of our Board of Directors
Our board of directors currently consists of seven directors. Our Amended Charter and Amended Bylaws will
provide that our board of directors may consist of up to seven directors and that our board of directors will be
divided into three classes, as nearly equal in number as possible, with the directors in each class serving for a three-
year term, and one class being elected each year by our stockholders.
When considering whether directors have the experience, qualifications, attributes or skills, taken as a whole, to
enable our board of directors to satisfy its oversight responsibilities effectively in light of our business and structure,
the board of directors focuses primarily on each person’s background and experience as reflected in the information
discussed in each of the directors’ individual biographies set forth above. We believe that our directors provide an
appropriate mix of experience and skills relevant to the size and nature of our business.
Classified Board of Directors
Our Amended Bylaws will provide that, upon the completion of this offering, our board of directors will be
divided into three classes with staggered three-year terms. Upon expiration of the term of a class of directors,
directors for that class will be elected for three-year terms at the annual meeting of stockholders in the year in which
that term expires. As a result, only one class of directors will be elected at each annual meeting of our stockholders,
with the other classes continuing for the remainder of their respective three-year terms. Each director’s term will
continue until the election and qualification of his or her successor, or his or her earlier death, resignation or removal
for cause. Our directors will be divided among the three classes as follows:
•Class I directors, whose initial term will expire at our first annual meeting of stockholders following this
offering, will consist of Trey Lowe and Anne Cleary;
•Class II directors, whose initial term will expire at our second annual meeting of stockholders following
this offering, will consist of Margaret C. Whitman and Robert Keehan; and
148
•Class III directors, whose initial term will expire at our third annual meeting of stockholders following this
offering, will consist of Tim Latimer, Ion Yadigaroglu and Jessica Uhl.
Our Amended Charter and Amended Bylaws will provide that only our board of directors may fill vacancies on
our board. We expect that any additional directorships resulting from an increase in the number of directors will be
distributed among the three classes so that, as nearly as possible, each class will consist of one-third of the total
number of directors.
The classification of our board of directors may have the effect of delaying or preventing changes in our control
or management. See the section titled “Description of Capital Stock—Anti-Takeover Effects of Provisions of our
Amended Charter and Amended Bylaws—Amended Charter and Amended Bylaw Provisions” for additional
information.
Director Independence
Prior to the consummation of this offering, our board of directors undertook a review of the independence of our
directors and considered whether any director has a material relationship with us that could compromise that
director’s ability to exercise independent judgment in carrying out that director’s responsibilities. Our board of
directors has affirmatively determined that Mr. Keehan, Ms. Cleary, Ms. Uhl, Mr. Yadigaroglu, and Ms. Whitman
are each an “independent director,” as defined under the rules of the NASDAQ. Mr. Lowe is affiliated with Devon
Energy Corporation, a holder of greater than 10% of our common stock. As such, our board of directors have
determined that Mr. Lowe is not independent pursuant to the listing rules of NASDAQ.
Lead Independent Director
Our board of directors will adopt, effective prior to the completion of this offering, corporate governance
guidelines that provide that one of our independent directors will serve as our lead independent director. Our board
of directors has appointed Margaret C. Whitman to serve as our lead independent director. As lead independent
director, Ms. Whitman will preside over periodic meetings of our independent directors, serve as a liaison between
the chair of our board of directors and the independent directors, and perform such additional duties as our board of
directors may otherwise determine and delegate.
Committees of Our Board of Directors
Our board of directors directs the management of our business and affairs, as provided by Delaware law, and
conducts its business through meetings of the board of directors and standing committees. We will have a standing
audit committee, nominating and corporate governance committee and compensation committee. In addition, from
time to time, special committees may be established under the direction of the board of directors when necessary to
address specific issues.
Audit Committee
Our audit committee will be responsible for, among other things:
•appointing, compensating, retaining, and overseeing our independent registered public accounting firm;
•discussing with our independent registered public accounting firm their independence from management;
•reviewing with our independent registered public accounting firm the scope and results of their audit;
•pre-approving all audit and permissible non-audit services to be performed by our independent registered
public accounting firm;
•overseeing the financial reporting process and discussing with management and our independent registered
public accounting firm the interim and annual financial statements that we file with the SEC;
•reviewing and monitoring our accounting principles, accounting policies, financial and accounting controls
and compliance with legal and regulatory requirements;
149
•discussing our policies with respect to risk assessment and risk management, including oversight of
financial, information technology, cybersecurity and data privacy risks;
•reviewing related party transactions;
•establishing procedures for the confidential, anonymous submission and receipt, retention and treatment of
complaints regarding accounting, internal accounting controls or auditing matters; and
•serving as the appropriate body to receive and oversee the investigation of reports of suspected violations of
laws, regulations or the Code of Conduct, to determine appropriate disciplinary action, and to ensure
protections against retaliation for good-faith reporters.
Upon the consummation of this offering, our audit committee will consist of Mr. Keehan, Ms. Cleary and Ms.
Uhl, with Mr. Keehan serving as chair. Rule 10A-3 of the Exchange Act and the NASDAQ rules require that our
audit committee have at least one independent member upon the listing of our Class A common stock, have a
majority of independent members within 90 days of the date of this prospectus and be composed entirely of
independent members within one year of the date of this prospectus. Our board of directors has affirmatively
determined that Mr. Keehan, Ms. Cleary and Ms. Uhl each meet the definition of “independent director” for
purposes of serving on the audit committee under Rule 10A-3 and the NASDAQ rules. Each member of our audit
committee meets the financial literacy requirements of NASDAQ listing standards. In addition, our board of
directors has determined that Mr. Keehan will qualify as an “audit committee financial expert,” as such term is
defined in Item 407(d)(5) of Regulation S-K. Our board of directors will adopt a new written charter for the audit
committee, which will be available on our principal corporate website at www.fervoenergy.com substantially
concurrently with the consummation of this offering. The information on, or that can be accessed through, any of
our websites is deemed not to be incorporated in this prospectus or to be part of this prospectus.
Nominating and Corporate Governance Committee
Our nominating and corporate governance committee will be responsible for, among other things:
•identifying individuals qualified to become members of our board of directors, consistent with criteria
approved by our board of directors, and recommending to the board of directors the nominees for election;
•overseeing the annual self-evaluations of our board of directors and its committees; and
•developing and recommending to our board of directors a set of corporate governance guidelines and
reviewing and reassessing the adequacy of such guidelines.
Upon the consummation of this offering, our nominating and corporate governance committee will consist of
Ms. Uhl, Mr. Lowe and Mr. Yadigaroglu, with Ms. Uhl serving as chair. Mr. Lowe is affiliated with Devon Energy
Corporation, a holder of greater than 10% of our common stock. As such, our board of directors have determined
that Mr. Lowe is not independent pursuant to the listing rules of NASDAQ, and Mr. Lowe is limited to two years of
service as a non-independent director on our nominating and corporate governance committee. Our board of
directors will adopt a new written charter for the nominating and corporate governance committee, which will be
available on our principal corporate website at www.fervoenergy.com substantially concurrently with the
consummation of this offering. The information on, or that can be accessed through, any of our websites is deemed
not to be incorporated in this prospectus or to be part of this prospectus.
Compensation Committee
Our compensation committee will be responsible for, among other things:
•reviewing and setting, or making recommendations to the board regarding the compensation of the Chief
Executive Officer and the other named executive officers;
•reviewing and making recommendations to the board regarding director compensation;
150
•administering the Company’s incentive and equity compensation plans and making grants of cash-based
and equity-based awards thereunder; and
•appointing, compensating, and overseeing any advisers retained by the Committee.
Upon the consummation of this offering, our compensation committee will consist of Ms. Cleary, Ms. Whitman
and Mr. Keehan, with Ms. Cleary serving as chair. Our board has determined that Ms. Cleary, Ms. Whitman and Mr.
Keehan are “non-employee directors” as defined in Section 16b-3 of the Exchange Act. Our board of directors will
adopt a new written charter for the compensation committee, which will be available on our principal corporate
website at www.fervoenergy.com substantially concurrently with the consummation of this offering. The
information on, or that can be accessed through, any of our websites is deemed not to be incorporated in this
prospectus or to be part of this prospectus.
Risk Oversight
Our board of directors is responsible for overseeing our risk management process. Our board of directors
focuses on our general risk management strategy, the most significant risks facing us, and oversees the
implementation of risk mitigation strategies by management. Our board of directors is also apprised of particular
risk management matters in connection with its general oversight and approval of corporate matters and significant
transactions.
Compensation Committee Interlocks and Insider Participation
None of our executive officers serves as a member of the board of directors or compensation committee (or
other committee performing equivalent functions) of any entity that has one or more executive officers serving on
our board of directors or compensation committee.
Board Diversity
Our nominating and corporate governance committee will be responsible for reviewing with the board of
directors, on an annual basis, the appropriate characteristics, skills and experience required for the board of directors
as a whole and its individual members. Although our board of directors does not have a formal written diversity
policy with respect to the evaluation of director candidates, in its evaluation of director candidates, our nominating
and corporate governance committee will consider factors including, without limitation, issues of character,
integrity, judgment, potential conflicts of interest, other commitments, and diversity, and diversity of experience and
area of expertise, as well as other individual qualities and attributes that contribute to the total diversity of
viewpoints and experience represented on the board of directors.
Code of Ethics and Code of Conduct
Prior to the completion of this offering, we will adopt a written code of business conduct and ethics that applies
to our directors, officers and employees, including our principal executive officer, principal financial officer,
principal accounting officer or controller, or persons performing similar functions. A copy of the code will be posted
on our website, www.fervoenergy.com. In addition, we intend to post on our website all disclosures that are required
by law or the NASDAQ listing standards concerning any amendments to, or waivers from, any provision of the
code. The information on, or that can be accessed through, any of our websites is deemed not to be incorporated in
this prospectus or to be part of this prospectus.
151
EXECUTIVE AND DIRECTOR COMPENSATION
This section discusses the material components of the executive and director compensation program for our
executive officers who are named in the “2025 Summary Compensation Table” below and each person who served
as a director in 2025. We are currently considered an emerging growth company within the meaning of the
Securities Act, for purposes of the SEC’s executive compensation disclosure rules. In accordance with such rules,
we are required to provide a Summary Compensation Table and an Outstanding Equity Awards at Fiscal Year End
Table, as well as narrative disclosures regarding the material terms of our executive compensation program for our
last completed fiscal year. Further, our reporting obligations generally extend to each individual who, during the last
completed fiscal year, served in the role of our principal executive officer, and to our two most highly compensated
executive officers outside of our principal executive officer. With respect to the year ended December 31, 2025, our
“named executive officers” or “NEOs” were as follows:
•Timothy Latimer, Chief Executive Officer and Chair of the board;
•Jack Norbeck, Ph.D., Chief Technology Officer; and
•David Ulrey, Chief Financial Officer.
This discussion may contain forward-looking statements that are based on our current plans, considerations,
expectations and determinations regarding future compensation programs. Actual compensation programs that we
adopt may differ materially from the currently planned programs summarized in this discussion.
2025 Summary Compensation Table
The following table sets forth information concerning the compensation of our named executive officers for the
year ended December 31, 2025.
Name and Principal Position | Year | Salary ($)(1) | Option Awards ($)(2) | Non-Equity Incentive Plan Compensation ($) | All Other Compensation ($)(3) | Total ($) | ||||||
Timothy Latimer Chief Executive Officer ................ | 2025 | 349,846 | 9,667,045 | 150,405 | 799,853 | 10,967,149 | ||||||
Jack Norbeck, Ph.D. Chief Technology Officer ............. | 2025 | 312,287 | 1,453,726 | 101,876 | 432,253 | 2,300,142 | ||||||
David Ulrey Chief Financial Officer ................ | 2025 | 337,077 | 2,180,589 | 113,280 | 53,499 | 2,684,445 |
__________________
(1)Amounts reflect base salary earned during 2025, even if paid in 2026.
(2)Amounts reflect the aggregate grant date fair value of stock options granted during the year ended December 31, 2025 computed in
accordance with FASB ASC Topic 718, Compensation — Stock Compensation and do not necessarily correspond to the actual economic
value that may be received by the named executive officers from these awards. We provide information regarding the assumptions used to
calculate the value of all stock options made to named executive officers in Note 10 – Stock Based Compensation to the consolidated
financial statements included in this prospectus.
(3)Amounts reflect (i) $23,500, $21,577 and $23,499 in employer matching contributions made to the Fervo Energy 401(k) plan, for Mr.
Latimer, Dr. Norbeck and Mr. Ulrey, respectively, (ii) $776,353 and $388,176 in compensatory payments to Mr. Latimer and Dr. Norbeck,
respectively, in connection with the Company’s repurchase of shares of common stock held by Mr. Latimer and Dr. Norbeck, representing
the total purchase price of such shares greater than their fair market value on the repurchase date, and (iii) $22,500 and $30,000 in executive
coaching services for Dr. Norbeck and Mr. Ulrey, respectively. For more information regarding these amounts, see “Other Elements of
Compensation and Compensation Policies” below.
Narrative to Summary Compensation Table
2025 Salaries
Each of our named executive officers receives an annual base salary to compensate the executive for services
rendered to us. The base salary payable to each named executive officer is intended to provide a fixed component of
compensation reflecting the executive’s skill set, experience, role and responsibilities.
152
As of January 1, 2025, the annual base salaries for our named executive officers were $320,000 for Mr. Latimer,
$289,000 for Dr. Norbeck and $321,350 for Mr. Ulrey. We increased the named executive officers’ salaries in May
2025 (to $352,000, $317,900 and $337,417, respectively), and in November 2025 (to $440,000, $365,585 and
$388,030, respectively).
The “Salary” column of the 2025 Summary Compensation Table above shows the actual base salary earned by
each named executive officer in 2025.
Non-Equity Incentive Plan Compensation
In addition to base salaries, our named executive officers are eligible to receive annual performance-based cash
bonuses. The performance periods for our annual cash bonus programs generally commence on April 1 and end on
the following March 31. Under our 2024 – 2025 Employee Incentive Bonus Plan, which commenced on April 1,
2024 and ended on March 31, 2025, Mr. Latimer, Dr. Norbeck and Mr. Ulrey were eligible to earn an annual
performance-based cash incentive bonus that was calculated based on the achievement of company and individual
objectives. Company objectives related to the achievement of operational goals regarding Cape Station, scaling our
corporate organization, and improvements to our system and scaling (the “Company OKRs”).
Mr. Latimer, Dr. Norbeck and Mr. Ulrey were eligible to receive a target annual bonus equal to 40%, 30% and
30% of their respective annual base salaries under our 2024 – 2025 Employee Incentive Bonus Plan. Following the
end of the performance period, our board of directors reviewed our performance against each Company OKR and
reviewed each executive’s individual performance and determined that each Company OKR was achieved at or
above 100%, other than our operational goals regarding Cape Station, which were achieved at 97.5% on average.
We also determined that Dr. Norbeck and Mr. Ulrey satisfied their individual objectives were achieved at or above
100% and determined that Mr. Latimer’s individual objectives were satisfied at a level equal to the Company’s
achievement of the Company OKRs. The “Non-Equity Incentive Plan Compensation” column of the 2025 Summary
Compensation Table above shows the actual bonuses earned by each named executive officer, which were paid in
May 2025.
Each of our named executive officers participates in our 2025 – 2026 Employee Incentive Bonus Plan, which
commenced on April 1, 2025 and ended on March 31, 2026. Our board of directors increased the target annual
bonuses under our 2025 – 2026 Employee Incentive Bonus Plan for Mr. Latimer, Dr. Norbeck and Mr. Ulrey to
75%, 55% and 55% of their respective annual base salaries, effective as of November 17, 2025. Any annual bonuses
earned by them under our 2025 – 2026 Employee Incentive Bonus Plan will be pro-rated based on the effective date
of these increases.
Equity Compensation
2019 Stock Incentive Plan
Prior to this offering, we maintained the Fervo Energy Company 2019 Stock Incentive Plan (the “2019 Plan”) in
order to provide our service providers with equity ownership opportunities and performance-based incentives that
are intended to better align their interests with those of our stockholders. Historically, we granted stock options to
purchase shares of our common stock to eligible service providers, including our named executive officers, pursuant
to the 2019 Plan. Options typically vest and become exercisable over a four-year period, subject to the grantee’s
continued service through the applicable vesting date, as follows: (i) 25% of the shares underlying the option on the
first annual anniversary of the vesting commencement date and (ii) 75% of the shares underlying the option in 36
substantially equal installments on each monthly anniversary of the vesting commencement date thereafter. For a
summary of the material terms of the 2019 Plan, please see the section titled “2019 Stock Incentive Plan” below.
No awards will be granted under the 2019 Plan following this offering and the adoption of the 2026 Incentive
Award Plan. In addition, in connection with the completion of this offering, the stock options granted pursuant to the
2019 Plan will be reclassified to cover shares of our Class A common stock pursuant to the Reclassification;
however, shares of Class A common stock received by Mr. Latimer and Dr. Norbeck in connection with the exercise
of their stock options may be exchanged for shares of our Class B common stock, as further described in “Certain
Relationships and Related Party Transactions” below.
153
2025 Stock Options
In December 2025, we granted stock options to our named executive officers under the 2019 Plan, as set forth
below. The stock options generally vest and become exercisable in accordance with the standard vesting schedule of
option grants described above.
The following table sets forth the stock option awards granted to our named executive officers in the 2025 fiscal
year. The awards described below have been adjusted to reflect the Stock Split, which will occur upon the filing of
our Amended Charter after the effectiveness of the registration statement to which this offering relates and prior to
the completion of this offering.
Named Executive Officer | Number of Shares Subject to Options Granted in 2025 | |
Timothy Latimer .................................................................................................................................. | 2,391,947 | |
Jack Norbeck, Ph.D. ............................................................................................................................ | 359,700 | |
David Ulrey ......................................................................................................................................... | 539,550 |
2026 Performance Options
In March 2026, we granted two stock options to Mr. Latimer under the 2019 Plan covering (i) 2,431,497 shares
of our common stock (the “Operational Milestone Option”) and (ii) 7,294,493 shares of our common stock (the
“Market Capitalization Option”), each adjusted to reflect the Stock Split that will occur upon the effectiveness of
this Registration Statement on Form S-1. The material terms and conditions of the Operational Milestone Option and
Market Capitalization Option are summarized below.
Operational Milestone Option
The Operational Milestone Option vests and becomes exercisable upon satisfaction of both a milestone-based
condition and a service-based condition. The milestone-based condition is our achievement of a commercial
operation date of Cape Phase 1 no later than January 1, 2027 (the “Operational Milestone Date”). The service-based
condition is satisfied as to 25% of the underlying shares on the Operational Milestone Date and as to the remaining
shares in 36 substantially equal successive monthly installments over the three-year period thereafter, subject to
continued employment. For clarity, if the Operational Milestone Date does not occur prior to January 1, 2027, then
the Operational Milestone Option will be forfeited and terminated without consideration as of such date.
If the Company incurs a change in control (as defined in the Operational Milestone Option agreement) and the
Operational Milestone Option is assumed, then:
•the milestone-based condition will be deemed satisfied (if not already satisfied) and the Operational
Milestone Date will be the date of such change in control; and
•if the milestone-based condition was satisfied prior to the change in control, then the shares subject to the
Operational Milestone Option will continue to satisfy the service-based condition in accordance with the
terms described above.
If the Operational Milestone Option is not assumed in the change in control, then the Operational Milestone
Option will become fully vested and exercisable as of the date of such change in control.
If Mr. Latimer is terminated by us without cause, by Mr. Latimer for good reason, or due to Mr. Latimer’s death
or disability, then:
•if the milestone-based condition was not satisfied prior to the termination date, then the Operational
Milestone Option will remain outstanding until January 1, 2027 and will be eligible to vest and become
exercisable upon achievement of the milestone-based condition, in which case a pro-rated number of shares
154
will vest and become exercisable (based on the portion of the period prior to vesting during which Mr.
Latimer was employed); and
•if the milestone-based condition was satisfied prior to the termination date, the Operational Milestone
Option will become fully vested and exercisable as of the date of such termination.
Market Capitalization Option
The Market Capitalization Option vests and becomes exercisable upon satisfaction of both a milestone-based
condition and a service-based condition. The milestone-based condition is our achievement of the Market
Capitalization Milestone Condition (as set forth in the table below). The service-based condition is satisfied as to
25% of the underlying shares on the Market Capitalization Milestone Date and as to the remaining shares in 36
substantially equal successive monthly installments over the three-year period thereafter, subject to continued
employment. However, if we do not complete an initial public offering of our shares of common stock by August
15, 2026, then the Market Capitalization Option will be forfeited and terminated without consideration as of such
date.
Market Capitalization Milestone Condition* | Number of Shares | |
Prior to the fifth anniversary of the grant date, a market capitalization equal to or exceeding $20 billion at a time when we are the largest geothermal operator in the world, measured by installed capacity. ............................................................................................................................. | 2,431,497 | |
A market capitalization equal to or exceeding $40 billion at a time when we have installed at least five gigawatts of capacity. ................................................................................................................ | 2,431,497 | |
A market capitalization equal to or exceeding $80 billion at a time when we have installed at least ten gigawatts of capacity. ................................................................................................................. | 2,431,497 |
__________________
*Market capitalization will be determined based on the average closing price of our common stock over any consecutive 90-trading-day
period following the last day of the lock-up period relating to this offering.
If the Company incurs a change in control (as defined in the Market Capitalization Option agreement):
•to the extent a Market Capitalization Milestone Condition has not been achieved, the Market Capitalization
Milestone Condition will be assessed based on our market capitalization in the change in control, as
determined by the CIC Price (as defined in the Market Capitalization Option agreement), and without
regard to the capacity-based performance condition of the Market Capitalization Milestone Condition. If
the Company’s market capitalization falls between $20 billion and $40 billion or between $40 billion and
$80 billion, then a portion of the option subject to the greater of such conditions shall be earned, determined
by using straight-line interpolation between the market capitalization goals;
•to the extent a Market Capitalization Milestone Condition is achieved in accordance with the bullet above,
if the corresponding portion of the Market Capitalization Option is assumed in connection with a change in
control, the option shall be deemed to have achieved the applicable Market Capitalization Milestone
Condition as of the date of such change in control and the shares subject to the Market Capitalization
Option shall satisfy the service-based condition in accordance with the terms described above;
•to the extent a Market Capitalization Milestone Condition was achieved prior to the change in control and
the corresponding portion of the Market Capitalization Option is assumed, the Market Capitalization
Option will continue to satisfy the service-based condition in accordance with the terms described above;
and
•to the extent any portion of the Market Capitalization Option is not assumed in connection with such
change in control, the corresponding portion that has achieved a Market Capitalization Milestone Condition
shall become fully vested and exercisable as of the date of such change in control.
155
If Mr. Latimer is terminated by us without cause, by Mr. Latimer for good reason, or due to Mr. Latimer’s death
or disability:
•if a Market Capitalization Milestone Condition was satisfied prior to the termination date, the portion of the
Market Capitalization Option subject to such condition will become fully vested and exercisable as of the
date of such termination; and
•if a Market Capitalization Milestone Condition was not satisfied prior to the termination date, then the
portion of the Market Capitalization Option subject to such Market Capitalization Milestone Condition will
remain outstanding until the earlier of (i) the two-year anniversary of such termination, and (ii) (A) the fifth
anniversary of the grant date (with respect to the $20 billion Market Capitalization Milestone Condition) or
(B) the expiration date of the Market Capitalization Option. During this period, such portion of the option
will be eligible to vest upon the earlier of the achievement of the applicable milestone condition and a
change in control (in accordance with the terms described above), but the number of shares that vest and
become exercisable (if any) will be prorated based on the portion of the period prior to vesting during
which Mr. Latimer was employed.
Policies and Practices Related to the Timing of Grants of Certain Equity-Based Awards
Prior to the completion of this offering, we have not had any material nonpublic information, and neither we,
our board nor our compensation committee has adopted any policy or otherwise considered any material nonpublic
information when granting stock options. Following the completion of this offering, we will consider the timing of
the disclosure of any material nonpublic information when granting stock options.
2026 Incentive Award Plan
In connection with this offering, we adopted, and our stockholders approved, the 2026 Incentive Award Plan, or
the 2026 Plan, in order to facilitate the grant of equity and cash incentives to directors, employees (including our
named executive officers) and consultants of our Company and our subsidiaries, and to enable our Company and our
subsidiaries to obtain and retain services of these individuals, which is essential to our long-term success. For
additional information about the 2026 Plan, please see the section titled “—2026 Incentive Award Plan” below.
Other Elements of Compensation and Compensation Policies
Retirement Plans
We currently maintain the Fervo Energy 401(k) plan, or the 401(k) plan, which is a tax-qualified retirement
savings plan for our employees who satisfy certain eligibility requirements. Our named executive officers are
eligible to participate in the 401(k) plan on the same terms as other full-time employees. The Internal Revenue Code
allows eligible employees to defer a portion of their compensation, within prescribed limits, on a pre-tax basis
through contributions to the 401(k) plan. Currently, we match contributions made by participants in the 401(k) plan
up to 6% of each participating employee’s eligible compensation, and these safe harbor matching contributions are
fully vested as of the date on which the contribution is made. We believe that providing a vehicle for tax-deferred
retirement savings through our 401(k) plan, and making matching contributions, adds to the overall desirability of
our executive compensation package and further incentivizes our employees, including our named executive
officers, in accordance with our compensation policies.
Health and Welfare Benefits and Perquisites
All of our full-time employees, including our named executive officers, are eligible to participate in our health
and welfare plans, including medical, dental and vision benefits; short-term and long-term disability insurance; life
and AD&D insurance; employee assistance plan; and a travel assistance program.
We believe the perquisites described above are necessary and appropriate to provide a competitive
compensation package to our named executive officers.
156
Certain of our employees, including each of our named executive officers, are also eligible for executive
coaching services paid by the Company at a rate of $2,500 per month. While Mr. Latimer did not receive any
executive coaching services during 2025, Dr. Norbeck and Mr. Ulrey utilized these services. We believe the
executive coaching services help our named executive officers strengthen their leadership skill and more effectively
lead the Company.
Outstanding Equity Awards at Fiscal Year-End
The following table summarizes the number of shares of common stock underlying outstanding stock options
held by each named executive officer as of December 31, 2025. Each stock option listed in the following table was
granted under the 2019 Plan and, following the completion of this offering, will cover shares of our Class A
common stock. In addition, following the completion of this offering, shares of Class A common stock received by
Mr. Latimer and Dr. Norbeck in connection with the exercise of their stock options may be exchanged for shares of
our Class B common stock. The awards described below have been adjusted to reflect the Stock Split, which will
occur upon the filing of our Amended Charter after the effectiveness of the registration statement to which this
offering relates and prior to the completion of this offering.
Name | Grant Date | Vesting Commencement Date | Number of Securities Underlying Unexercised Options (#) Exercisable | Number of Securities Underlying Unexercised Options (#) Unexercisable | Option Exercise Price ($) | Option Expiration Date | ||||||||
Timothy Latimer ............... | July 14, 2023 | (1) | January 1, 2023 | 1,258,950 | 143,880 | 1.31 | July 13, 2033 | |||||||
December 29, 2025 | (2) | December 29, 2025 | — | 2,391,947 | 5.91 | December 28, 2035 | ||||||||
Jack Norbeck, Ph.D. ......... | July 14, 2023 | (1) | January 1, 2023 | 629,475 | 71,940 | 1.31 | July 13, 2033 | |||||||
December 29, 2025 | (2) | December 29, 2025 | — | 359,700 | 5.91 | December 28, 2035 | ||||||||
David Ulrey ...................... | June 28, 2021 | June 16, 2021 | 359,700 | — | 0.40 | June 27, 2031 | ||||||||
November 29, 2022 | (2) | November 29, 2022 | 249,541 | 74,188 | 1.31 | November 28, 2032 | ||||||||
May 13, 2024 | (2) | May 1, 2024 | 142,380 | 217,319 | 1.37 | May 12, 2034 | ||||||||
December 29, 2025 | (3) | December 29, 2025 | — | 539,550 | 5.91 | December 28, 2035 | ||||||||
_________________
(1)Each option vests and becomes exercisable subject to satisfaction of both a milestone-based vesting condition and a service-based vesting
condition. The milestone-based vesting condition was satisfied on October 13, 2025. The service-based vesting condition vests over a 39-
month period, subject to the grantee’s continued service through the applicable vesting date, with the shares underlying the option in 39
substantially equal installments on each monthly anniversary of the vesting commencement date.
(2)Each option vests and becomes exercisable over a four-year period, subject to the executive’s continued service through the applicable
vesting date, as follows: (i) 25% of the shares underlying the option on the first annual anniversary of the vesting commencement date and
(ii) 75% of the shares underlying the option in 36 substantially equal installments on each monthly anniversary of the vesting
commencement date thereafter.
(3)This option vests and becomes exercisable over a four-year period, subject to the executive’s continued service through the applicable
vesting date, as follows: (i) 25% of the shares underlying the option on the first annual anniversary of the vesting commencement date and
(ii) 75% of the shares underlying the option in 36 substantially equal installments on each monthly anniversary of the vesting
commencement date thereafter. In addition, the option will vest in full upon a termination of service by the Company without cause within
12 months following a change in control.
Additional Narrative Disclosure Regarding Executive Compensation Matters
Executive Compensation Arrangements
We have not entered into any written employment agreement with Mr. Latimer.
However, Mr. Latimer is party to an invention, non-disclosure and non-solicitation agreement, which includes
an indefinite company information non-disclosure covenant and an employee non-solicitation covenant that lasts
during employment and for one year thereafter.
Each of Dr. Norbeck and Mr. Ulrey is party to an offer letter with the Company that provides for at-will
employment that continues until terminated at any time by either party. Pursuant to their offer letters, Dr. Norbeck
157
and Mr. Ulrey are eligible to participate in the benefit plans and programs maintained by us for the benefit of our
employees. Their offer letters do not provide for severance payments on termination of employment.
Dr. Norbeck and Mr. Ulrey also entered into the Company’s standard form of invention and non-disclosure
agreement, which includes an indefinite company information non-disclosure covenant.
Executive Severance Plan
In connection with this offering, we adopted the Executive Severance Plan, which provides for the payment of
certain cash severance and other benefits to participants, including each of our named executive officers, in the event
of a qualifying termination of employment with us.
Under the Executive Severance Plan, if the executive’s employment is terminated by us without “cause” or by
the executive for “good reason” outside of a change in control period (described below), then the executive will be
eligible to receive the following payments and benefits:
•a cash payment equal to 100% (or 200% for Mr. Latimer) of the executive’s then-current annual base salary
(disregarding any reduction which gives rise to “good reason”);
•a cash payment equal to one times (or two times for Mr. Latimer) the executive’s annual target bonus for
the annual bonus performance period in which the termination date occurs;
•a cash payment equal to the executive’s earned but unpaid annual bonus for the annual bonus performance
period preceding the annual bonus performance period in which the termination date occurs;
•a cash payment equal to the executive’s pro-rata target annual bonus for the annual bonus performance
period in which the termination date occurs;
•Company-paid COBRA premium payments for the executive and the executive’s eligible dependents for up
to 12 months (or 24 months for Mr. Latimer);
•accelerated vesting and exercisability of the portion of the executive’s time-vesting equity awards that
would have vested over the 12-month period following the termination date (assuming such time-vesting
equity awards vest in equal daily installments); and
•performance-vesting equity awards will remain outstanding and eligible to vest following the termination
date, based on actual performance and pro-rated to reflect the portion of the performance period the
executive was employed.
The change in control period generally starts 90 days prior to the signing or announcement of a transaction that,
if consummated, would be a “change in control” and ends on the two-year anniversary of a change in control. If the
executive’s employment is terminated by us without “cause” or by the executive for good “reason” during the
change in control period, the executive will be eligible to receive the following payments and benefits:
•a cash payment equal to 200% (or 300% for Mr. Latimer) of the executive’s then-current annual base
salary;
•a cash payment equal to two times (or three times for Mr. Latimer) the executive’s annual target bonus for
the annual bonus performance period in which the termination date occurs;
•a cash payment equal to the executive’s earned but unpaid annual bonus for the annual bonus performance
period preceding the annual bonus performance period in which the termination date occurs;
•a cash payment equal to the executive’s pro-rata target annual bonus for the annual bonus performance
period in which the termination date occurs;
•Company-paid COBRA premium payments for the executive and the executive’s eligible dependents for up
to 24 months (or 36 months for Mr. Latimer);
158
•full vesting and, as applicable, exercisability of the executive’s then-unvested time-vesting equity awards;
and
•vesting of the executive’s performance-vesting equity awards, at the greater of target and actual level of
performance (unless otherwise provided in the applicable award agreement).
The cash payments generally will be made in a lump sum within 60 days following the termination date (or, if
later, upon a change in control). An executive’s right to receive the severance payments and benefits described
above is subject to the executive’s execution and, as applicable, non-revocation of a general release of claims in our
favor, and the executive’s continued compliance with any applicable restrictive covenants.
In addition, in the event that any payment or benefit under the Executive Severance Plan, together with any
other amounts paid to the executive, would subject the executive to an excise tax under Section 4999 of the Internal
Revenue Code, then such payments or benefits will be reduced to the extent that such reduction would produce a
better net after-tax result for the executive.
No Tax Gross-Ups
We do not make gross-up payments to cover our named executive officers’ personal income taxes that may
pertain to any of the compensation or perquisites we pay or provide.
Anti-Hedging Policies
We expect to adopt a policy that will prohibit our employees, including all executive officers, and members of
our board of directors from engaging in transactions that are considered to hedge or offset the financial impact of
holding our Class A common stock.
Clawback Policy
In connection with this offering, our board of directors adopted a compensation recovery policy that complies
with the listing standards of NASDAQ, as required by the Dodd-Frank Act.
Equity Incentive Award Plans
The following summarizes the material terms of the 2019 Plan and the 2026 Plan. In addition, the following
summarizes the material terms of the ESPP, which is a tax-qualified employee stock purchase plan in which our
named executive officers will be eligible to participate following the completion of this offering.
2019 Stock Incentive Plan
Prior to the completion of this offering, we maintained the 2019 Plan, which was most recently amended in May
2026. The material terms of the 2019 Plan are summarized below. In addition, in connection with this offering, the
2019 Plan and each stock option granted under the 2019 Plan were reclassified to cover shares of our Class A
common stock; however, shares of Class A common stock received by Mr. Latimer and Dr. Norbeck in connection
with the exercise of their stock options may be exchanged for shares of our Class B common stock.
Termination
In connection with this offering, the 2019 Plan terminated and we will not make any further awards under the
2019 Plan. However, any outstanding awards granted under the 2019 Plan will remain outstanding, subject to the
terms of the 2019 Plan and applicable award agreements. Shares of our common stock subject to awards granted
under the 2019 Plan that expire unexercised or are cancelled, terminated, or forfeited in any manner without
issuance of shares thereunder following the effective date of the 2026 Plan will become available for issuance under
the 2026 Plan.
159
Eligibility and Administration
Our employees, consultants and non-employee directors are eligible to be granted awards of ISOs, NSOs, stock
appreciation rights, restricted stock, restricted stock units and other stock-based awards under the 2019 Plan, subject
to the limitations described therein. Our board of directors administers the 2019 Plan as its plan administrator and,
subject to the provisions thereof, has the authority to take all actions and make all determinations contemplated by
the 2019 Plan and to adopt, amend and repeal such administrative rules, guidelines and practices relating to the 2019
Plan as it deems advisable.
Limitations on Awards and Shares Available
An aggregate of 34,151,952 shares of our common stock have been authorized for issuance under the 2019
Plan, as adjusted to reflect the Stock Split that will occur upon the effectiveness of this Registration Statement on
Form S-1. The shares of our common stock issued under the 2019 Plan may consist in whole or in part of authorized
but unissued shares or treasury shares. In the event that an outstanding award expires, is terminated, is surrendered,
is cancelled, or is forfeited for any reason, or if shares subject to an award are withheld to satisfy exercise price or
tax withholding obligations, then the shares allocable to the unexercised or otherwise expired, terminated,
surrendered, cancelled, or forfeited portion of such award, or the shares withheld to satisfy the exercise or purchase
price or tax withholding obligation, are currently added back to the common stock available for issuance under the
2019 Plan.
Awards
The 2019 Plan provides for the grant of ISOs, NSOs, stock appreciation rights, restricted stock, restricted stock
units and other stock-based awards. All outstanding awards under the 2019 Plan are set forth in award agreements,
which detail the terms and conditions of the awards, including any applicable vesting and payment terms and post-
termination exercise limitations. A brief description of each award type follows:
•Stock Options. Stock options provide for the purchase of shares of our common stock in the future at an
exercise price set on the grant date. ISOs granted under the 2019 Plan, in contrast to NSOs, are subject to
and required to be construed in accordance with Section 422 of the Code and may provide tax deferral
beyond exercise and favorable capital gains tax treatment to their holders if certain holding period and other
requirements of the Code are satisfied. The exercise price of a stock option may not be less than 100% of
the fair market value of the underlying share on the grant date, except with respect to certain substitute
awards granted in connection with a corporate transaction. The term of a stock option may not be longer
than ten years.
•Stock Appreciation Rights. Stock appreciation rights provide for payments to their holders based upon
increases in the price of our common stock over a set measurement price. The measurement price of any
stock appreciation right granted under the 2019 Plan must be at least 100% of the fair market value of the
underlying share on the grant date. Stock appreciation rights under the 2019 Plan may be settled in cash or
shares of our common stock, or in a combination of both, as determined by the plan administrator. The term
of a stock appreciation right may not be longer than ten years.
•Restricted Stock and RSUs. Restricted stock is an award of nontransferable shares of common stock that are
subject to certain vesting conditions and other restrictions. RSUs are contractual promises to deliver shares
of common stock in the future, which may also remain forfeitable unless and until specified conditions are
met and may be accompanied by the right to receive the equivalent value of dividends paid on shares of
common stock prior to the delivery of the underlying shares (i.e., dividend equivalent rights). RSUs under
the 2019 Plan may be settled in cash or shares of our common stock, or in a combination of both, as
determined by the administrator. The plan administrator may provide that settlement of RSUs will be
deferred on a mandatory basis or at the election of the participant.
•Other Stock-Based Awards. Other stock-based awards are awards of fully vested shares of our common
stock or other awards valued wholly or partially by referring to, or otherwise based on, shares of our
common stock or other property. Other stock-based awards may be granted to participants and may also be
160
available as a payment form in the settlement of other awards, as standalone payments and as payment in
lieu of compensation to which a participant is otherwise entitled.
Certain Transactions
In the event of certain changes in our capitalization, the plan administrator may make equitable adjustments to
the 2019 Plan and outstanding awards thereunder. In the event of our merger or consolidation with another entity,
the transfer or exchange of all of our common stock for cash, securities or other property, or our liquidation or
dissolution, the plan administrator has the discretion to provide:
(1)that awards be assumed by, or substituted with substantially equivalent awards of, the acquiring or
succeeding corporation (or an affiliate thereof);
(2)upon written notice to the applicable holders, cancel unexercised and/or unvested awards immediately prior
to the transaction unless exercised within a specified period;
(3)for awards to vest and, as applicable, become exercisable, in whole or in part, prior to or upon the
transaction;
(4)if the transaction provides a cash payment to stockholders, payments to each award holder, for the vested
portion of their awards, an amount equal to the excess of the cash price per share over any applicable
exercise, measurement, or purchase price (and applicable withholdings), in exchange for termination of the
awards;
(5)in a liquidation or dissolution, for the conversion of awards into the right to receive liquidation proceeds
(net of any applicable exercise, measurement, or purchase price and withholdings); or
(6)for any combination of the foregoing.
Repricing
Our board of directors may, without approval of the stockholders, reduce the exercise price of any outstanding
award or cancel any outstanding award in exchange for other awards with an exercise price per share that is less than
the exercise price per share of the original award.
2026 Incentive Award Plan
In connection with this offering, we adopted, and our stockholders approved, the 2026 Plan, under which we
may grant equity and cash incentive awards to eligible service providers in order to attract, motivate and retain the
talent for which we compete. The material terms of the 2026 Plan are summarized below.
Eligibility and Administration
Our employees, consultants and directors and employees and consultants of our subsidiaries are eligible to
receive awards under the 2026 Plan. Following the completion of this offering, the 2026 Plan are administered by
our board of directors with respect to awards to non-employee directors and by our compensation committee with
respect to other participants, each of which may delegate its duties and responsibilities to committees of our
directors and/or officers (referred to collectively as the plan administrator), subject to the limitations imposed under
the 2026 Plan, Section 16 of the Exchange Act, stock exchange rules and other applicable laws. The plan
administrator has the authority to take all actions and make all determinations under the 2026 Plan, to interpret the
2026 Plan and award agreements and to adopt, amend and repeal rules for the administration of the 2026 Plan as it
deems advisable. The plan administrator also has the authority to determine which eligible service providers receive
awards, grant awards and set the terms and conditions of all awards under the 2026 Plan, including any vesting and
vesting acceleration provisions, subject to the conditions and limitations in the 2026 Plan.
161
Limitation on Awards and Shares Available
The initial aggregate number of shares of our common stock available for issuance under the 2026 Plan will
equal 10% of the number of fully-diluted shares of our Class A and Class B common stock outstanding as of
immediately following the completion of this offering (which is expected to be 35,107,737 shares, assuming an
initial public offering price of $25.50 per share, which is the midpoint of the estimated price range set forth on the
cover page of this prospectus). In addition, the number of shares of our common stock available for issuance under
the 2026 Plan will be subject to an annual increase on the first day of each calendar year beginning on and including
January 1, 2027 and ending on and including January 1, 2036, equal to the lesser of (A) 5% of the aggregate number
of shares of our Class A and Class B common stock outstanding on the final day of the immediately preceding
calendar year and (B) such smaller number of shares as is determined by our board of directors. The maximum
number of shares (either Class A or Class B common stock) that may be issued pursuant to the exercise of incentive
stock options, or ISOs, granted under the 2026 Plan, will be 500,000,000. Shares issued pursuant to the 2026 Plan
may be shares of Class A common stock or Class B common stock, as determined by the plan administrator, and
may consist, in whole or in part, of authorized and unissued common stock, treasury common stock or common
stock purchased on the open market.
If an award under the 2026 Plan or the 2019 Plan expires, lapses or is terminated, exchanged for or settled in
cash, any shares subject to such award (or portion thereof) may, to the extent of such expiration, lapse, termination
or cash settlement, be used again for new grants under the 2026 Plan. Shares tendered or withheld to satisfy the
purchase or exercise price or tax withholding obligation for any award under the 2019 Plan or 2026 Plan will
become available for awards under the 2026 Plan. Further, the payment of dividend equivalents in cash in
conjunction with any awards under the 2026 Plan will not reduce the shares available for grant under the 2026 Plan.
However, the following shares may not be used again for grant under the 2026 Plan: (i) shares subject to stock
appreciation rights, or SARs, that are not issued in connection with the stock settlement of the SAR on exercise and
(ii) shares purchased on the open market with the cash proceeds from the exercise of options.
Awards granted under the 2026 Plan upon the assumption of, or in substitution for, awards authorized or
outstanding under a qualifying equity plan maintained by an entity with which we enter into a merger or similar
corporate transaction will not reduce the shares available for grant under the 2026 Plan but will count against the
maximum number of shares that may be issued upon the exercise of ISOs.
The 2026 Plan provides that, commencing with calendar year 2027, the sum of any cash compensation and the
aggregate grant date fair value (determined as of the date of the grant under Financial Accounting Standards Board
Accounting Standards Codification Topic 718, or any successor thereto) of all awards granted to a non-employee
director as compensation for services as a non-employee director during any fiscal year, or director limit, generally
may not exceed an amount equal to $750,000 (increased to $1,000,000 in the calendar year of a non-employee
director’s initial service as a non-employee director or any calendar year during which a non-employee director
serves as chair of our board of directors or lead independent director), which limits shall not apply to the
compensation for any non-employee director who serves in any capacity in addition to that of a non-employee
director for which he or she receives additional compensation or any compensation paid prior to the calendar year
following the calendar year in which the 2026 Plan becomes effective.
Awards
The 2026 Plan provides for the grant of stock options, including ISOs and nonqualified stock options, or NSOs,
SARs, restricted stock, dividend equivalents, restricted stock units, or RSUs, and other stock or cash-based awards.
Certain awards under the 2026 Plan may constitute or provide for payment of “nonqualified deferred compensation”
under Section 409A of the Code, which may impose additional requirements on the terms and conditions of such
awards. All awards under the 2026 Plan will be evidenced by award agreements, which will detail the terms and
conditions of the awards, including any applicable vesting and payment terms and post-termination exercise
limitations. Awards other than cash awards generally will be settled in shares of our common stock, but the
162
applicable award agreement may provide for cash settlement of any award. A brief description of each award type
follows.
•Stock Options and SARs. Stock options provide for the purchase of shares of our common stock in the
future at an exercise price set on the grant date. ISOs, in contrast to NSOs, may provide tax deferral beyond
exercise and favorable capital gains tax treatment to their holders if certain holding period and other
requirements of the Code are satisfied. SARs entitle their holder, upon exercise, to receive from us an
amount equal to the appreciation of the shares subject to the award between the grant date and the exercise
date. Unless otherwise determined by our board, the exercise price of a stock option or SAR may not be
less than 100% of the fair market value of the underlying share on the grant date (or 110% in the case of
ISOs granted to certain significant stockholders), except with respect to certain substitute awards granted in
connection with a corporate transaction. The term of a stock option or SAR may not be longer than ten
years (or five years in the case of ISOs granted to certain significant stockholders). Conditions applicable to
stock options and/or SARs may be based on continuing service, the attainment of performance goals and/or
such other conditions as the plan administrator may determine.
•Restricted Stock and RSUs. Restricted stock is an award of nontransferable shares of our common stock
that are subject to certain vesting conditions and other restrictions. RSUs are contractual promises to deliver
shares of our common stock in the future, which may also remain forfeitable unless and until specified
conditions are met and may be accompanied by the right to receive the equivalent value of dividends paid
on shares of our common stock prior to the delivery of the underlying shares (i.e., dividend equivalent
rights). The plan administrator may provide that the delivery of the shares underlying RSUs will be
deferred on a mandatory basis or at the election of the participant. The terms and conditions applicable to
RSUs will be determined by the plan administrator, subject to the conditions and limitations contained in
the 2026 Plan. Conditions applicable to restricted stock and RSUs may be based on continuing service, the
attainment of performance goals and/or such other conditions as the plan administrator may determine.
•Other Stock or Cash-Based Awards. Other stock or cash-based awards are awards of cash, fully vested
shares of our common stock and other awards valued wholly or partially by referring to, or otherwise based
on, shares of our common stock. Other stock or cash-based awards may be granted to participants and may
also be available as a payment form in the settlement of other awards, as standalone payments and as
payment in lieu of compensation to which a participant is otherwise entitled.
•Dividend Equivalents. Dividend equivalents represent the right to receive the equivalent value of dividends
paid on shares of our common stock and may be granted alone or in tandem with awards other than stock
options or SARs. Dividend equivalents are credited as of the dividend record dates during the period
between the date an award is granted and the date such award vests, is exercised, is distributed or expires,
as determined by the plan administrator. Dividend equivalents payable with respect to an award prior to the
vesting of such award instead will be paid out to the participant only to the extent that the vesting
conditions are subsequently satisfied and the award vests.
Certain Transactions
The plan administrator has broad discretion to take action under the 2026 Plan, as well as make adjustments to
the terms and conditions of existing and future awards, to prevent the dilution or enlargement of intended benefits
and facilitate necessary or desirable changes in the event of certain transactions and events affecting our common
stock, such as stock dividends, stock splits, mergers, acquisitions, consolidations and other corporate transactions. In
addition, in the event of certain non-reciprocal transactions with our stockholders known as “equity restructurings,”
the plan administrator will make equitable adjustments to the 2026 Plan and outstanding awards. In the event of a
change in control (as defined in the 2026 Plan), to the extent that the surviving entity declines to continue, convert,
assume or replace outstanding awards, then all such awards will become fully vested and exercisable in connection
with the transaction. Upon or in anticipation of a change in control, the plan administrator may cause any
outstanding awards to terminate at a specified time in the future and give the participant the right to exercise such
awards during a period of time determined by the plan administrator in its sole discretion. Individual award
agreements may provide for additional accelerated vesting and payment provisions.
163
Repricing
Our board of directors may, without approval of the stockholders, reduce the exercise price of any stock option
or SAR, or cancel any stock option or SAR in exchange for cash, other awards or stock options or SARs with an
exercise price per share that is less than the exercise price per share of the original stock options or SARs.
Plan Amendment and Termination
Our board of directors may amend or terminate the 2026 Plan at any time; however, no amendment, other than
an amendment that increases the number of shares available under the 2026 Plan, may materially and adversely
affect an award outstanding under the 2026 Plan without the consent of the affected participant, and stockholder
approval will be obtained for any amendment to the extent necessary to comply with applicable laws. The 2026 Plan
will remain in effect until terminated. No awards may be granted under the 2026 Plan after its termination.
Foreign Participants, Claw-back Provisions, Transferability and Participant Payments
The plan administrator may modify award terms, establish subplans and/or adjust other terms and conditions of
awards, subject to the share limits described above, in order to facilitate grants of awards subject to the laws and/or
stock exchange rules of countries outside of the United States. All awards will be subject to any Company clawback
policy as set forth in such clawback policy or the applicable award agreement. Awards under the 2026 Plan are
generally non-transferable, except by will or the laws of descent and distribution, or, subject to the plan
administrator’s consent, pursuant to a domestic relations order, and are generally exercisable only by the participant.
With regard to tax withholding, exercise price and purchase price obligations arising in connection with awards
under the 2026 Plan, the plan administrator may, in its discretion, accept cash or check, shares of our common stock
that meet specified conditions, a “market sell order” or such other consideration as it deems suitable.
Employee Stock Purchase Plan
In connection with this offering, we adopted, and our stockholders approved, the Employee Stock Purchase
Plan, or the ESPP. The material terms of the ESPP are summarized below.
Shares Available; Administration
The initial share reserve under the ESPP will equal 2% of the number of shares of our Class A and Class B
common stock outstanding as of immediately following the completion of this offering (which is expected to be
5,671,247 shares, assuming an initial public offering price of $25.50 per share, which is the midpoint of the price
range set forth on the cover page of this prospectus).
In addition, the number of shares available for issuance under the ESPP will be annually increased by an annual
increase on the first day of each calendar year beginning January 1, 2027 and ending on and including January 1,
2036, equal to the lesser of (i) 1% of the aggregate number of shares of our Class A and Class B common stock
outstanding on the final day of the immediately preceding calendar year and (ii) such smaller number of shares as is
determined by our board of directors. In no event will more than 100,000,000 shares of our Class A common stock
be available for issuance under the ESPP.
Our board of directors or a committee designated by our board of directors have authority to interpret the terms
of the ESPP and determine eligibility of participants. The compensation committee is the administrator of the ESPP.
Eligibility
The plan administrator may designate certain of our subsidiaries as participating “designated subsidiaries” in the
ESPP and may change these designations from time to time. Employees of our Company and our designated
subsidiaries are eligible to participate in the ESPP if they meet the eligibility requirements under the ESPP
established from time to time by the plan administrator. However, an employee may not be granted rights to
purchase stock under the ESPP if such employee, immediately after the grant, would own (directly or through
attribution) stock possessing 5% or more of the total combined voting power or value of all classes of our common
or other class of stock.
164
If the grant of a purchase right under the ESPP to any eligible employee who is a citizen or resident of a foreign
jurisdiction would be prohibited under the laws of such foreign jurisdiction or the grant of a purchase right to such
employee in compliance with the laws of such foreign jurisdiction would cause the ESPP to violate the requirements
of Section 423 of the Code, as determined by the plan administrator in its sole discretion, such employee will not be
permitted to participate in the ESPP.
Eligible employees become participants in the ESPP by enrolling and authorizing payroll deductions by the
deadline established by the plan administrator prior to the relevant offering date. Directors who are not employees,
as well as consultants, are not eligible to participate. Employees who choose to not participate, or are not eligible to
participate at the start of an offering period but who become eligible thereafter, may enroll in any subsequent
offering period.
Participation in an Offering
We intend for the ESPP to qualify under Section 423 of the Code and stock will be offered under the ESPP
during offering periods (which offering periods may overlap). The length of offering periods under the ESPP will be
determined by the plan administrator and may be up to 27 months long. Employee payroll deductions will be used to
purchase shares on each purchase date during an offering period. The number of purchase periods within, and
purchase dates during, each offering period will be established by the plan administrator. Offering periods under the
ESPP will commence when determined by the plan administrator. The plan administrator may, in its discretion,
modify the terms of future offering periods.
The ESPP will permit participants to purchase our Class A common stock through payroll deductions of up to
15% of their eligible compensation, unless otherwise determined by the plan administrator, which will include a
participant’s gross base salary for services to us, excluding periodic bonuses, one-time bonuses, sales commissions,
overtime payments, expense reimbursements, fringe benefits, income from equity awards and other special
payments. The plan administrator will establish a maximum number of shares that may be purchased by a participant
during any offering period or purchase period, which, in the absence of a contrary designation, will be 10,000 shares
for an offering period and/or a purchase period. In addition, no employee will be permitted to accrue the right to
purchase stock under the ESPP at a rate in excess of $25,000 worth of shares during any calendar year during which
such a purchase right is outstanding (based on the fair market value per share of our Class A common stock as of the
first day of the offering period).
On the first trading day of each offering period, each participant automatically will be granted an option to
purchase shares of our Class A common stock. The option will be exercised on the applicable purchase date(s)
during the offering period, to the extent of the payroll deductions accumulated during the applicable purchase
period. The purchase price of the shares, in the absence of a contrary determination by the plan administrator, will be
85% of the lower of the fair market value of our Class A common stock on the first trading day of the offering
period or on the applicable purchase date, which will be the final trading day of the applicable purchase period.
Participants may voluntarily end their participation in the ESPP at any time at least two weeks prior to the end
of the applicable offering period (or such longer or shorter period specified by the plan administrator), and will be
paid their accrued payroll deductions that have not yet been used to purchase shares of common stock. Participation
ends automatically upon a participant’s termination of employment.
Transferability
A participant may not transfer rights granted under the ESPP other than by will, the laws of descent and
distribution or as otherwise provided in the ESPP.
Certain Transactions
In the event of certain transactions or events affecting our common stock, such as any stock dividend or other
distribution, change in control, reorganization, merger, consolidation or other corporate transaction, the plan
administrator will make equitable adjustments to the ESPP and outstanding rights. In addition, in the event of the
foregoing transactions or events or certain significant transactions, including a change in control, the plan
165
administrator may provide for (i) either the replacement of outstanding rights with other rights or property or
termination of outstanding rights in exchange for cash, (ii) the assumption or substitution of outstanding rights by
the successor or survivor corporation or parent or subsidiary thereof, (iii) the adjustment in the number and type of
shares of stock subject to outstanding rights, (iv) the use of participants’ accumulated payroll deductions to purchase
stock on a new purchase date prior to the next scheduled purchase date and termination of any rights under ongoing
offering periods or (v) the termination of all outstanding rights. Under the ESPP, a change in control has the same
definition as given to such term in the 2026 Plan.
Plan Amendment; Termination
The plan administrator may amend, suspend or terminate the ESPP at any time. However, stockholder approval
of any amendment to the ESPP must be obtained for any amendment which increases the aggregate number or
changes the type of shares that may be sold pursuant to rights under the ESPP, amends the ESPP in any manner that
would be considered the adoption of a new plan within the meaning of Treasury regulation Section 1.423-2(c)(4), or
changes the ESPP in any manner that would cause the ESPP to no longer be an employee stock purchase plan within
the meaning of Section 423(b) of the Code.
Director Compensation
During the fiscal year ended December 31, 2025, our non-employee directors were Anne Cleary, Tanuj Dutta,
Christina Karapataki, Rachel Slaybaugh, Jane Woodward and Ion Yadigaroglu.
2025 Director Compensation Table
The following table sets forth information for 2025 regarding the compensation awarded to, earned by or paid to
the non-employee directors who served on our board of directors during fiscal year 2025. None of our non-employee
directors received cash compensation in 2025.
Name | Option Awards ($)(1) | Total ($) | ||
Anne Cleary .............................................................................................................. | — | — | ||
Tanuj Dutta(²) ........................................................................................................... | — | — | ||
Christina Karapataki(²) ............................................................................................. | — | — | ||
Rachel Slaybaugh(²) ................................................................................................. | — | — | ||
Jane Woodward(²) .................................................................................................... | 47,520 | 47,520 | ||
Ion Yadigaroglu ....................................................................................................... | — | — |
__________________
(1)Amounts reflect the aggregate grant date fair value of stock options granted during the year ended December 31, 2025 computed in
accordance with FASB ASC Topic 718, Compensation — Stock Compensation and do not necessarily correspond to the actual economic
value that may be received by the directors from these awards. We provide information regarding the assumptions used to calculate the
value of all stock options made to non-employee directors who served on our board of directors in Note 10 – Stock Based Compensation to
the consolidated financial statements included in this prospectus.
(2)Mr. Dutta and Mmes. Karapataki, Slaybaugh and Woodward will each resign from our board of directors effective upon and subject to the
completion of this offering.
The following table summarizes the number of shares of Class A common stock subject to outstanding stock
options held by each non-employee director who served on our board of directors during fiscal year 2025, as of
December 31, 2025. The awards described below have been adjusted to reflect the Stock Split, which will occur
166
upon the filing of our Amended Charter after the effectiveness of the registration statement to which this offering
relates and prior to the completion of this offering.
Name | Options Outstanding at Fiscal Year End | |
Anne Cleary ......................................................................................................................................... | 143,880 | |
Tanuj Dutta .......................................................................................................................................... | — | |
Christina Karapataki ............................................................................................................................ | — | |
Rachel Slaybaugh ................................................................................................................................ | — | |
Jane Woodward ................................................................................................................................... | 13,848 | |
Ion Yadigaroglu ................................................................................................................................... | — |
Non-Employee Director Compensation Program
In connection with this offering, we adopted, and our stockholders approved, a compensation program (the
“Director Compensation Program”) for our non-employee directors (each, an “Eligible Director”). The Director
Compensation Program provides for annual cash retainer fees and long-term equity awards. The material terms of
the Director Compensation Program are described below.
The Director Compensation Program consists of the following components:
Cash Compensation:
•Annual Retainer: $77,500
•Annual Committee Chair Retainer:
◦Audit and Risk: $20,000
◦Compensation: $15,000
◦Nominating and Corporate Governance: $15,000
•Lead Independent Director: $25,000
The annual cash retainers will be paid in quarterly installments in arrears. Annual cash retainers will be pro-
rated for any partial calendar quarter of service.
Equity Compensation:
•2026 Awards: Our board will approve the grant of RSU awards pursuant to the 2026 Plan to our non-
employee directors, which grants will become effective in connection with the completion of this offering
(the “2026 Awards”). The dollar-denominated value of each award will be $250,000 and the aggregate
dollar-denominated value of these awards will be $1,500,000. The aggregate number of shares of our Class
A common stock that will be subject to the 2026 Awards will be determined based on the initial public
offering price per share of our common stock in this offering.
The 2026 Awards will vest in full on the date of the annual meeting of stockholders to be held in 2027, or, if
earlier, the first anniversary of the completion of this offering, subject to continued service through the applicable
vesting date.
•Initial Award: An Eligible Director who is initially elected or appointed to serve on our board of directors
following the completion of this offering automatically shall be granted, on the date of such Eligible
Director’s appointment or election to our board of directors, an RSU award with an aggregate value of
$125,000, prorated based on the number of days from the immediately preceding date of an annual meeting
of stockholders (or, if none, the completion of this offering). The number of RSUs subject to the award will
167
be determined by dividing the value of the award by the price per share of our Class A common stock on
the applicable grant date.
•Annual Award: An Eligible Director who is serving on our board of directors as of the date of an annual
meeting of stockholders (beginning with calendar year 2027) automatically shall be granted, on the date of
such annual meeting, an RSU award with an aggregate value of $125,000. The number of RSUs subject to
the award will be determined by dividing the value of the award by the price per share of our Class A
common stock on the applicable grant date.
Each Initial Award and Annual Award will vest in full on the earlier to occur of the first anniversary of the grant
date and the date of the next annual meeting following the grant date, subject to continued service.
In addition, each equity award granted to an Eligible Director under the Director Compensation Program will
vest in full immediately prior to the occurrence of a “change in control” (as defined in the 2026 Plan). Compensation
under the Director Compensation Program is subject to the annual limits on non-employee director compensation set
forth in the 2026 Plan.
168
PRINCIPAL STOCKHOLDERS
The following table sets forth information with respect to the beneficial ownership of our voting securities as of
April 29, 2026, and as adjusted to reflect the Stock Split, the Preferred Stock Conversion, the Founder Share
Exchange, the Reclassification and the filing and effectiveness of our Amended Charter and adoption of our
Amended Bylaws upon the closing of this offering, in each case as if such event had occurred on April 29, 2026, and
to give effect to this offering, for:
•each person or group of affiliated persons known by us to beneficially own more than 5% of our Class A
common stock or Class B common stock;
•each of our named executive officers, directors and director nominees; and
•all of our executive officers, directors and director nominees as a group.
The number of shares beneficially owned by each stockholder as described in this prospectus is determined
under rules issued by the SEC. Under these rules, beneficial ownership includes any shares as to which the
individual or entity has sole or shared voting power or investment power. In computing the number of shares
beneficially owned by an individual or entity and the percentage ownership of that person, shares of common stock
subject to options, warrants or other rights held by such person that are currently exercisable or will become
exercisable within 60 days of April 29, 2026 are considered outstanding, although these shares are not considered
outstanding for purposes of computing the percentage ownership of any other person. The percentage of total voting
power before and after this offering for each person set forth in the table below assumes the conversion of all
options, warrants or other rights held by such person that are currently exercisable or will become exercisable within
60 days of April 29, 2026 into shares of common stock, although these shares are not considered outstanding for
purposes of computing the percentage of total voting power of any other person. The applicable percentage
ownership after this offering is based on 275,776,920 shares of our Class A common stock and 7,785,414 shares of
our Class B common stock outstanding immediately following the completion of this offering, assuming that the
underwriters do not exercise their option to purchase additional shares of Class A common stock and assuming the
issuance of up to shares of Class A common stock at the closing of this offering. Unless otherwise indicated, the
address of all listed stockholders is 811 Main Street, Suite 1700, Houston, TX 77002.
Each of the stockholders listed below has sole voting and investment power with respect to the shares
beneficially owned by such stockholder unless noted otherwise, subject to community property laws where
applicable.
169
Class A common stock | Class B common stock | Before Offering | After Giving Effect to the Offering | |||||||||||||||||
Before Offering | After Offering | Before Offering | After Offering | |||||||||||||||||
5% Holders | Shares | Percent | Shares | Percent | Shares | Percent | Shares | Percent | Percentage of total voting power (1) | |||||||||||
Devon Energy Corporation(2) . | 35,728,296 | 17.4% | 35,728,296 | 13.0% | — | — | — | — | 6.9% | 6.1% | ||||||||||
Capricorn Investment Group(3) .......... | 34,227,390 | 16.6% | 34,227,390 | 12.4% | — | — | — | — | 6.6% | 5.8% | ||||||||||
DCVC(4) .............. | 18,114,022 | 8.8% | 18,114,022 | 6.6% | — | — | — | — | 3.5% | 3.1% | ||||||||||
Breakthrough Energy Ventures(5) ...... | 14,074,589 | 6.8% | 14,074,589 | 5.1% | — | — | — | — | 2.7% | 2.4% | ||||||||||
Centaurus Capital LP(6) ... | 12,793,504 | 6.2% | 12,793,504 | 4.6% | — | — | — | — | 2.5% | 2.2% | ||||||||||
NEOs & Directors ......... | ||||||||||||||||||||
Anne Cleary(7) .... | 161,865 | * | 161,865 | * | — | — | — | — | * | * | ||||||||||
Sarah Jewett(8) .... | 673,687 | * | 673,687 | * | — | — | — | — | * | * | ||||||||||
Robert Keehan .... | — | — | — | — | — | — | — | — | — | — | ||||||||||
Tim Latimer(9) .... | — | — | — | — | 7,700,753 | 79.1% | 7,700,753 | 83.8% | 53.7% | 47.9% | ||||||||||
Trey Lowe .......... | — | — | — | — | — | — | — | — | — | — | ||||||||||
Jack Norbeck(10) .. | — | — | — | — | 2,188,905 | 25.0% | 2,188,905 | 25.8% | 16.1% | 14.2% | ||||||||||
Dawn Owens(11) .. | 716,102 | * | 716,102 | * | — | — | — | — | * | * | ||||||||||
Gustavo Torres(12) ......... | 229,307 | * | 229,307 | * | — | — | — | * | * | |||||||||||
Jessica Uhl .......... | — | — | — | - | — | — | — | — | — | — | ||||||||||
David Ulrey(13) .... | 837,051 | * | 837,051 | * | — | — | — | — | * | * | ||||||||||
Margaret Whitman ......... | — | — | — | — | — | — | — | — | - | - | ||||||||||
Quinn Woodard Jr.(14) ............... | 226,310 | * | 226,310 | * | — | — | — | — | * | * | ||||||||||
Ion Yadigaroglu(3) | 34,227,390 | 16.6% | 34,227,390 | 12.4% | — | — | — | — | 6.6% | 5.8% | ||||||||||
All executive officers, directors and director nominees as a group (14) individuals ...... | 37,807,960 | 17.9% | 37,807,960 | 13.4% | 9,889,658 | 100% | 9,889,658 | 100% | 71.8% | 64.3% | ||||||||||
__________________
*Represents beneficial ownership of less than 1.0%.
(1)Represents the voting power with respect to all shares of our Class A common stock and Class B common stock, voting together as a single
class, except under limited circumstances. Each share of our Class A common stock is entitled to one vote per share. Each share of our
Class B common stock is entitled to 40 votes per share. For more information, see “Description of Capital Stock.”
(2)Represents shares of Class A common stock held by Devon Technology Ventures Holdings, L.L.C. (“Devon Technology”). As the indirect
owner of 100% of the outstanding membership interests in Devon Technology, Devon Energy Corporation may be deemed to beneficially
own all of the shares held by Devon Technology. Devon Energy Corporation is a publicly traded company listed on the New York Stock
Exchange. The address for each of the foregoing entities is 333 West Sheridan Avenue, Oklahoma City, Oklahoma 73102.
(3)Consists of (i) 12,055,467 shares of Class A common stock held by Technology Impact Fund, LP, (ii) 14,962,430 shares of Class A
common stock held by Technology Impact Growth Fund, II, L.P., (iii) 5,448,761 shares of Class A common stock held by TIGF II Direct
Strategies LLC – Series 5 and (iv) 1,760,732 shares of Class A common stock held by TIGF II Direct Strategies LLC – Series 7. TIF
Partners, LLC is the general partner of Technology Impact Fund, LP and TIGF Partners II, LLC is the general partner of Technology Impact
Growth Fund, II, L.P. and the manager of (i) TIGF II Direct Strategies LLC – Series 5 and (ii) TIGF II Direct Strategies LLC – Series 7. Ion
Yadigaroglu and Dipender Saluja, as managers of TIF Partners, LLC and TIGF Partners II, LLC, share the power to vote and dispose of the
170
shares held by Technology Impact Fund, LP, Technology Impact Growth Fund, II, L.P., TIGF II Direct Strategies LLC – Series 5 and TIGF
II Direct Strategies LLC – Series 7. The address for each of the foregoing entities is 250 University Avenue, Suite 300, Palo Alto, CA
94301.
(4)Consists of (i) 8,806,107 shares of Class A common stock held by DCVC Climate Select, L.P., (“DCVC Climate”) and (ii) 9,307,915 shares
of Class A common stock held by DCVC VI, L.P., (“DCVC VI”). DCVC Climate Select GP, LLC (“DCVC Climate GP”) is the general
partner of DCVC Climate, and DCVC VI GP, LLC (“DCVC VI GP”) is the general partner of DCVC VI. Zachary Bogue and Matthew
Ocko are the managing members of each of DCVC Climate GP and DCVC VI GP. Zachary Bogue and Matthew Ocko exercise voting and
dispositive power over the shares held by DCVC Climate and DCVC VI. The address for each of the foregoing entities is 270 University
Avenue, Palo Alto, California 94301.
(5)Consists of (i) 11,512,307 shares of Class A common stock held by Breakthrough Energy Ventures, LLC and (ii) 2,562,282 shares of Class
A common stock held by Breakthrough Energy Ventures Select Fund I, L.P. Breakthrough Energy Ventures, LLC is managed by
Breakthrough Energy Ventures Management, L.P., the general partner of which is Breakthrough Energy Ventures Management GP, LLC.
Breakthrough Energy Ventures Select Fund I, L.P.’s general partner is Breakthrough Energy Ventures Select GP, L.P., the general partner
of which is Breakthrough Energy Ventures Select Ultimate GP, LLC, the sole member of which is Breakthrough Energy Ventures
Management GP, LLC. The address for each of the foregoing entities is 250 Summer Street, 4th Floor, Boston, Massachusetts 02210.
(6)Represents shares of Class A common stock held by Centaurus Capital LP. Centaurus Holdings, LLC is the General Partner of Centaurus
Capital LP, and is controlled by its Manager, John D. Arnold. The address for each of the foregoing entities and Mr. Arnold is 1717 West
Loop South, Suite 1800, Houston, TX 77027.
(7)Consists of 161,865 shares of Class A common stock issuable pursuant to outstanding stock options held by Ms. Cleary that are currently
exercisable or will be exercisable within 60 days of April 29, 2026.
(8)Consists of (i) 357,683 shares of Class A common stock held by Ms. Jewett and (ii) 316,004 shares of Class A common stock issuable
pursuant to outstanding stock options held by Ms. Jewett that are currently exercisable or will be exercisable within 60 days of April 29,
2026.
(9)Consists of (i) 6,297,923 shares of Class B common stock held by Mr. Latimer and (ii) 1,402,830 shares of Class B common stock issuable
pursuant to outstanding stock options held by Mr. Latimer that are currently exercisable or will be exercisable within 60 days of April 29,
2026.
(10)Consists of (i) 1,487,490 shares of Class B common stock held by Mr. Norbeck and (ii) 701,415 shares of Class B common stock issuable
pursuant to outstanding stock options held by Mr. Norbeck that are currently exercisable or will be exercisable within 60 days of April 29,
2026.
(11)Consists of 716,102 shares of Class A common stock issuable pursuant to outstanding stock options held by Ms. Owens that are currently
exercisable or will be exercisable within 60 days of April 29, 2026.
(12)Consists of (i) 140,764 shares of Class A common stock held by Mr. Torres and (ii) 88,543 shares of Class A common stock issuable
pursuant to outstanding stock options held by Mr. Torres that are currently exercisable or will be exercisable within 60 days of April 29,
2026.
(13)Consists of 837,051 shares of Class A common stock issuable pursuant to outstanding stock options held by Mr. Ulrey that are currently
exercisable or will be exercisable within 60 days of April 29, 2026.
(14)Consists of 226,310 shares of Class A common stock issuable pursuant to outstanding stock options held by Mr. Woodard that are currently
exercisable or will be exercisable within 60 days of April 29, 2026.
171
CERTAIN RELATIONSHIPS AND RELATED PARTY TRANSACTIONS
The following are summaries of certain provisions of our related party agreements and are qualified in their
entirety by reference to all of the provisions of such agreements. Because these descriptions are only summaries of
the applicable agreements, they do not necessarily contain all of the information that you may find useful. We
therefore urge you to review the agreements in their entirety. Copies of the forms of the agreements have been filed
as exhibits to the registration statement of which this prospectus is a part, and are available electronically on the
website of the SEC at www.sec.gov.
Related Party Agreements in Effect Prior to this Offering
Founder Share Exchange Agreement and Equity Award Exchange Agreement
To facilitate the Founder Share Exchange, we will enter into the Founder Share Exchange Agreement with our
Co-Founders, Tim Latimer and Jack Norbeck, PhD., pursuant to which 7,785,414 shares of our Class A common
stock expected to be held by Mr. Latimer and Dr. Norbeck following the Reclassification will automatically be
exchanged for an equivalent number of shares of Class B common stock immediately prior to the completion of this
offering.
In addition, we will enter into the Equity Award Exchange Agreement with each of Mr. Latimer and Dr.
Norbeck, pursuant to which, following the completion of this offering, each of Mr. Latimer and Dr. Norbeck will
have a right (but not an obligation) to exchange any shares of Class A common stock received by him upon the
exercise of options for an equivalent number of shares of Class B common stock. This right applies only to shares of
Class A common stock received by either of Mr. Latimer or Dr. Norbeck upon the exercise of options that were
outstanding immediately prior to the completion of this offering. As of December 31, 2025, there were 18,794,508
shares of our Class A common stock issuable upon the exercise of options held by Mr. Latimer (without regard to
vesting status), and there were 1,475,000 shares of our Class A common stock issuable upon the exercise of options
held by Dr. Norbeck (without regard to vesting status). All of these shares of Class A common stock could be
exchanged, following vesting and exercise or settlement, for an equivalent number of shares of our Class B common
stock.
Preferred Stock Issuances
In 2024, we issued an aggregate of 122,690,461 shares of our Series D-1 Preferred Stock, Series D-2 Preferred
Stock and Series D-3 Preferred Stock (including 4,766,559 shares of Series D‑2 Preferred Stock issued upon the
conversion of a convertible note outstanding and 112,098 shares of Series D‑4 Preferred Stock issued upon the
conversion of a SAFE), certain of which were issued to related persons in the amounts set forth in the table below.
172
In 2025 and 2026, we issued an aggregate of 56,537,255 shares of our Series E-1 Preferred Stock, certain of
which were issued to related persons in the amounts set forth in the table below.
Subscriber | Issuance Date | Shares Issued (Series) | Subscription Price (per share) | |||
Congruent Continuity Fund I, LP ........................ | Feb 2024 | 2,961,734 (Series D-1) | $2.53230 | |||
Congruent Cosine Fund I, LP .............................. | Feb 2024 | 987,244 (Series D-1) | $2.53230 | |||
DCVC Climate Select L.P. .................................. | Feb 2024 | 3,948,979 (Series D-1) | $2.53230 | |||
DCVC VI, L.P. ..................................................... | Feb 2024 | 3,948,978 (Series D-1) | $2.53230 | |||
Technology Impact Growth Fund II, L.P. ............ | Feb 2024 | 3,948,977 (Series D-1) | $2.53230 | |||
Energy Climate Capital I, LLC ............................ | Feb 2024 | 786,217 (Series D-1) | $2.53230 | |||
DCVC Climate Select L.P. .................................. | Dec 2024 | 946,754 (Series D-3) | $5.28120 | |||
DCVC VI, L.P. ..................................................... | Dec 2024 | 946,754 (Series D-3) | $5.28120 | |||
TIGF II Direct Strategies LLC – Series 5 ............ | Dec 2024 | 7,574,036 (Series D-3) | $5.28120 | |||
Technology Impact Growth Fund II, L.P. ............ | Dec 2024 | 3,787,018 (Series D-3) | $5.28120 | |||
Breakthrough Energy Ventures Select Fund I, L.P. ................................................................... | Dec 2024 | 1,420,131 (Series D-3) | $5.28120 | |||
Congruent Continuity Fund I, LP ........................ | Dec 2024 | 946,754 (Series D-3) | $5.28120 | |||
Congruent Cosine Fund I, LP .............................. | Dec 2024 | 378,701 (Series D-3) | $5.28120 | |||
Devon Technology Ventures Holdings, L.L.C. ... | Dec 2025 | 6,118,752 (Series E-1) | $8.17160 | |||
Breakthrough Energy Ventures Select Fund I, L.P. .................................................................. | Dec 2025 | 2,141,563 (Series E-1) | $8.17160 | |||
Congruent Continuity Fund I, LP ........................ | Dec 2025 | 611,875 (Series E-1) | $8.17160 | |||
Congruent Cosine Fund I, LP .............................. | Dec 2025 | 1,223,750 (Series E-1) | $8.17160 | |||
DCVC Climate Select, L.P. ................................. | Dec 2025 | 1,223,750 (Series E-1) | $8.17160 | |||
DCVC VI, L.P. ..................................................... | Dec 2025 | 1,921,288 (Series E-1) | $8.17160 | |||
Technology Impact Growth Fund II, L.P. ............ | Dec 2025 | 1,223,750 (Series E-1) | $8.17160 | |||
TIGF II Direct Strategies LLC - Series 7 ............. | Dec 2025 | 2,447,501 (Series E-1) | $8.17160 |
Investor Rights Agreements
We are party to certain Investor Rights Agreements with holders each of our Series A Preferred Stock, Series B
Preferred Stock, Series C Preferred Stock, Series D Preferred Stock and Series E Preferred Stock. These Investor
Rights Agreement provided customary stockholder rights that, prior to this offering, included information rights and
preemptive rights; those rights will terminate automatically upon or immediately prior to the completion of this
offering or when we become subject to Exchange Act reporting. These Investor Rights Agreements also provide
certain of our stockholders—including certain of our directors and executive officers and beneficial owners of more
than 5% of a class of our capital stock—with demand, piggyback and Form S‑3 registration rights covering their
shares, including shares of Class A common stock that will be issued upon the Preferred Stock Conversion. Prior to
the completion of this offering, we intend to terminate these Investor Rights Agreements and enter into a new
agreement that provides similar registration rights to these stockholders. For a description of these registration
rights, see “Shares Eligible for Future Sale—Registration Rights.” See “Underwriting” for a description of these
lock-up agreements.
Registration Rights Agreements
In connection with this offering, we intend to enter into a Registration Rights Agreement with certain holders of
our Class A common stock, including shares issued upon conversion of our Series A Preferred Stock, Series A-1
Preferred Stock, Series B Preferred Stock, Series C Preferred Stock, Series D-1 Preferred Stock, Series D-2
Preferred Stock, Series D-3 Preferred Stock, Series D-4 Preferred Stock, Series E-1 Preferred Stock, and Series E-2
Preferred Stock. This Registration Rights Agreement supersedes and replaces in its entirety the Amended and
173
Restated Investors’ Rights Agreement, dated as of December 4, 2025, with respect to registration rights. The
Registration Rights Agreement provides certain of our stockholders with demand, piggyback and Form S-3
registration rights covering their registrable shares. For a description of these registration rights, see “Shares Eligible
for Future Sale—Registration Rights.” In connection with this offering, holders party to the Registration Rights
Agreement have entered into lock-up agreements with the underwriters providing for certain restrictions on the sale
or transfer of shares of our common stock and certain other securities for a period of 180 days following the date of
the final prospectus. See “Underwriting” for a description of these lock-up agreements.
Technical Services Payment
In 2024, the Company paid approximately $0.2 million for technical services provided by Devon Energy, a
supplier and a major investor in the Company, and an observer to the Company’s board of directors.
Director and Officer Indemnification and Insurance
Prior to the consummation of this offering, we intend to enter into separate indemnification agreements with
each of our directors and executive officers. We have also purchased directors’ and officers’ liability insurance. See
“Description of Capital Stock — Limitations on Liability and Indemnification of Officers and Directors.”
Our Policy Regarding Related Party Transactions
Our board of directors recognizes the fact that transactions with related persons present a heightened risk of
conflicts of interests, improper valuation or the perception thereof. Prior to the consummation of this offering, our
board of directors will adopt a written policy on transactions with related persons that is in conformity with the
requirements for issuers having publicly held common stock that is listed on the NASDAQ. Under the new policy:
•any related person transaction, and any material amendment or modification to a related person transaction,
must be reviewed and approved or ratified by a committee of the board of directors composed solely of
independent directors who are disinterested or by the disinterested members of the board of directors; and
•any employment relationship or transaction involving an executive officer and any related compensation
must be approved by the compensation committee of the board of directors or recommended by the
compensation committee to the board of directors for its approval.
In connection with the review and approval or ratification of a related person transaction:
•management must disclose to the committee or disinterested directors, as applicable, the name of the related
person and the basis on which the person is a related person, the material terms of the related person
transaction, including the approximate dollar value of the amount involved in the transaction, and all the
material facts as to the related person’s direct or indirect interest in, or relationship to, the related person
transaction;
•management must advise the committee or disinterested directors, as applicable, as to whether the related
person transaction complies with the terms of our agreements governing our material outstanding
indebtedness that limit or restrict our ability to enter into a related person transaction;
•management must advise the committee or disinterested directors, as applicable, as to whether the related
person transaction will be required to be disclosed in our applicable filings under the Securities Act or the
Exchange Act, and related rules, and, to the extent required to be disclosed, management must ensure that
the related person transaction is disclosed in accordance with the Securities Act and the Exchange Act and
related rules; and
•management must advise the committee or disinterested directors, as applicable, as to whether the related
person transaction constitutes a “personal loan” for purposes of Section 402 of the Sarbanes-Oxley Act.
In addition, the related person transaction policy provides that the committee or disinterested directors, as
applicable, in connection with any approval or ratification of a related person transaction involving a non-employee
174
director should consider whether such transaction would compromise the director’s status as an “independent,”
“outside,” or “non-employee” director, as applicable, under the rules and regulations of the SEC, the NASDAQ and
the Code.
175
DESCRIPTION OF CAPITAL STOCK
General
At or prior to the consummation of this offering, we will file our Amended Charter and we will adopt our
Amended Bylaws. Our Amended Charter will authorize capital stock consisting of:
•1,040,000,000 shares of common stock, of which 1,000,000,000 shares will be designated as Class A
common stock, $0.0001 par value per share, and 40,000,000 shares will be designated as Class B common
stock, $0.0001 par value per share; and
•10,000,000 shares of preferred stock, par value $0.0001 per share.
We are selling 70,000,000 shares of our Class A common stock in this offering (80,500,000 shares if the
underwriters exercise their over-allotment option to purchase additional shares of our Class A common stock in
full).
After giving effect to (i) the Stock Split, (ii) the Preferred Stock Conversion (iii) the filing and effectiveness of
our Amended Charter and the adoption of our Amended Bylaws, (iv) the Founder Share Exchange and (v) the
Reclassification, as of April 29, 2026, there were 275,776,919 shares of our Class A common stock outstanding,
held by 317 stockholders of record, 7,785,414 shares of our Class B common stock outstanding, held by
2 stockholders of record, and no shares of our preferred stock outstanding.
The following summary describes the material provisions of our capital stock. We urge you to read our
Amended Charter and our Amended Bylaws, which are included as exhibits to the registration statement of which
this prospectus forms a part.
Certain provisions of our Amended Charter and our Amended Bylaws summarized below may be deemed to
have an anti-takeover effect and may delay or prevent a tender offer or takeover attempt that a stockholder might
consider in its best interest, including those attempts that might result in a premium over the market price for the
shares of Class A common stock.
Common Stock
We will have two series of authorized common stock: Class A common stock and Class B common stock. The
rights of holders of shares of Class A common stock and Class B common stock are identical, except with respect to
voting, conversion and transfer rights.
Voting Rights
Holders of shares of our Class A common stock will be entitled to one vote for each share held of record on all
matters submitted to a vote of stockholders. Holders of our Class B common stock are entitled to 40 votes per share
on any matter submitted to our stockholders. Holders of shares of Class A common stock and Class B common stock
will vote together as a single class on all matters (including the election of directors) submitted to a vote of
stockholders, unless otherwise required by Delaware law or our Amended Charter that becomes effective
immediately prior to the completion of this offering.
Under Delaware law, holders of our Class A common stock or Class B common stock would be entitled to vote
as a separate class if a proposed amendment to our Amended Charter would increase or decrease the aggregate
number of authorized shares of such class, increase or decrease the par value of the shares of such class, or alter or
change the powers, preferences, or special rights of the shares of such class so as to affect them adversely. As a
result, in these limited instances, the holders of a majority of the Class A common stock could defeat any
amendment to our Amended Charter. For example, if a proposed amendment of our Amended Charter provided for
the Class A common stock to rank junior to the Class B common stock with respect to (1) any dividend or
distribution, (2) the distribution of proceeds were we to be acquired, or (3) any other right, Delaware law would
require the vote of the Class A common stock. In this instance, the holders of a majority of Class A common stock
could defeat that amendment to our Amended Charter.
176
Our Amended Charter, which will come into effect immediately prior to the closing of this offering, will not
provide for cumulative voting for the election of directors.
Dividend Rights
Subject to preferences that may apply to any shares of preferred stock outstanding at the time, the holders of our
common stock are entitled to receive dividends and other distributions out of funds legally available if our board of
directors, in its discretion, determines to issue dividends and other distributions and then only at the times and in the
amounts that our board of directors may determine.
See “Dividend Policy” for additional information.
Liquidation
In the event of our dissolution or liquidation, after payment in full of all amounts required to be paid to creditors
and to the holders of preferred stock having liquidation preferences, if any, the holders of shares of our Class A
common stock will be entitled to share ratably in the remaining assets legally available for distribution.
Holders of our Class A common stock and Class B common stock are not entitled to preemptive rights and are
not subject to subscription, conversion, redemption or sinking fund provisions, except for the conversion provisions
with respect to the Class B common stock described below. There will be no redemption or sinking fund provisions
applicable to our Class A common stock or Class B common stock. The rights, preferences and privileges of the
holders of our Class A common stock and Class B common stock will be subject to and may be adversely affected
by the rights of the holders of shares of any series of our preferred stock that we may designate in the future.
Conversion
Each outstanding share of our Class B common stock is convertible at any time at the option of the holder into
one share of our Class A common stock. In addition, each share of our Class B common stock will convert
automatically into one share of our Class A common stock upon any transfer, whether or not for value, which occurs
after the closing of this offering, except for certain permitted transfers described in our Amended Charter, including
transfers to immediate family members (including upon Mr. Latimer’s or Dr. Norbeck’s death), trusts (including
grantor retained annuity trusts) for which the stockholder or their immediate family member serves as trustee, and
partnerships, corporations, and other entities exclusively owned by Mr. Latimer or Dr. Norbeck or either of their
immediate families. All of the outstanding shares of Class B common stock will convert automatically into shares of
Class A common stock upon the earliest to occur of (i) the first trading day following the seventh anniversary of this
offering, (ii) the date on which the number of shares of Class A and Class B common stock beneficially owned by
Mr. Latimer’s and Dr. Norbeck’s permitted transferees (including shares underlying outstanding options) represents
less than 25% of the shares of Class A and Class B common stock beneficially owned by Mr. Latimer and Dr.
Norbeck, in the aggregate, on the closing date of this offering, (iii) the death or disability of a Co-Founder, and (iv)
the termination of a Co-Founder for cause. Once converted or transferred and converted into our Class A common
stock, the Class B common stock will not be reissued.
Fully Paid and Non-Assessable
All shares of our Class A common stock that will be outstanding upon the completion of this offering will be
fully paid and non-assessable.
Warrants
As of April 29, 2026, we had warrants outstanding held by Centaurus Capital LP to purchase up to an aggregate
of 3,550,329 shares of our Series D-3 convertible preferred stock, or, if Series D-3 convertible preferred stock is not
our most senior class at the time of exercise, our most senior class of equity securities, at an exercise price of
$5.2812 per share. The warrants have a four-year term measured from October 6, 2025 and will expire immediately
prior to the closing of a firm commitment underwritten initial public offering of our Class A common stock, and
therefore are not expected to be outstanding following this offering. The warrants are exercisable in whole or in part
by cash payment and may be exercised on a cashless basis. The warrant contains customary anti-dilution and
177
structural adjustment provisions for reorganizations, recapitalizations, reclassifications, stock splits, combinations
and similar corporate events. Transfers of the warrants are restricted and generally require our consent (subject to
limited affiliate transfers and compliance with applicable securities laws), and the holder is subject to a customary
market stand-off of up to 180 days in connection with our first underwritten public offering.
On April 28, 2026, Centaurus Capital LP delivered to us a notice of exercise electing to exercise the warrant in
full. Because the Series D-3 convertible preferred stock was no longer our most senior class of equity securities
outstanding (based on liquidation preference) at the time of exercise, the warrant was exercised, in accordance with
its terms, for 3,550,329 shares of a newly designated series of “Shadow Preferred Stock” under the warrant,
designated as our Series E-2 convertible preferred stock. The Series E-2 convertible preferred stock has the same
powers, designations, preferences, rights, qualifications, limitations and restrictions as our Series E-1 convertible
preferred stock, except that (i) the per share liquidation preference and the initial conversion price for purposes of
price-based anti-dilution protection equal the exercise price of $5.2812 per share, and (ii) any dividend rights are
based on such exercise price rather than the original issue price of the Series E-1 convertible preferred stock.
Centaurus paid the aggregate exercise price of $18,749,997.51 in cash by wire transfer of immediately available
funds, and surrendered the original warrant upon exercise in full. As a result of this exercise, the warrant is no longer
outstanding, and no further shares are issuable thereunder.
Preferred Stock
No shares of preferred stock will be issued or outstanding immediately after the offering contemplated by this
prospectus. Our Amended Charter authorizes our board of directors to establish one or more series of preferred
stock. Unless required by law or any stock exchange, the authorized shares of preferred stock will be available for
issuance without further action by the holders of our common stock. Our board of directors is able to determine,
without stockholder approval and with respect to any series of preferred stock, the powers (including voting
powers), preferences and relative, participating, optional, or other special rights, and the qualifications, limitations,
or restrictions thereof, including, without limitation:
•the designation of the series;
•the number of shares of the series, which our board of directors may, except where otherwise provided in
the preferred stock designation, increase (but not above the total number of authorized shares of the class)
or decrease (but not below the number of shares then outstanding);
•whether dividends, if any, will be cumulative or non-cumulative and the dividend rate of the series;
•the dates at which dividends, if any, will be payable;
•the redemption or repurchase rights and price or prices, if any, for shares of the series;
•the terms and amounts of any sinking fund provided for the purchase or redemption of shares of the series;
•the amounts payable on shares of the series in the event of any voluntary or involuntary liquidation,
dissolution, or winding-up of our affairs;
•whether the shares of the series will be convertible into shares of any other class or series, or any other
security, of us or any other entity, and, if so, the specification of the other class or series or other security,
the conversion price or prices, or rate or rates, any rate adjustments, the date or dates as of which the shares
will be convertible and all other terms and conditions upon which the conversion may be made;
•restrictions on the issuance of shares of the same series or of any other class or series; and
•the voting rights, if any, of the holders of the series.
We could issue a series of preferred stock that could, depending on the terms of the series, impede or discourage
an acquisition attempt or other transaction that some, or a majority, of the holders of our Class A common stock
178
might believe to be in their best interests or in which the holders of our Class A common stock might receive a
premium over the market price of the shares of our Class A common stock. Additionally, the issuance of preferred
stock may adversely affect the rights of holders of our Class A common stock by restricting dividends on the Class
A common stock, diluting the voting power of the Class A common stock or subordinating the liquidation rights of
the Class A common stock. As a result of these or other factors, the issuance of preferred stock could have an
adverse impact on the market price of our Class A common stock. We have no current plan for the issuance of any
shares of preferred stock.
Options
As of April 29, 2026, 45,047,677 shares (or 32,407,298 shares, after giving effect to the Stock Split) of our
Class A common stock were issuable upon the exercise of outstanding stock options at a weighted-average exercise
price of approximately $1.75 (or $2.43 per share, after giving effect to the Stock Split) under the 2019 Plan. For
additional information regarding the terms of the 2019 Plan, see the section titled “Executive and Director
Compensation—Equity Compensation.”
Forum Selection
Our Amended Charter will provide that, unless we consent to the selection of an alternative forum, the Court of
Chancery of the State of Delaware (the “Court of Chancery”) is the sole and exclusive forum for: (a) any derivative
action, suit, or proceeding brought on our behalf; (b) any action, suit, or proceeding asserting a claim of breach of
fiduciary duty owed by any of our current or former directors, officers or other employees or stockholder to us or to
our stockholders, creditors or other constituents; (c) any action, suit, or proceeding asserting a claim arising pursuant
to the Delaware General Corporation Law, our Amended Charter or Amended Bylaws, or as to which the Delaware
General Corporation Law confers exclusive jurisdiction on the Court of Chancery; or (d) any action, suit, or
proceeding asserting a claim governed by the internal affairs doctrine, unless the Court of Chancery does not have
subject matter jurisdiction thereof, the federal district court of the District of Delaware or other state courts of the
State of Delaware; provided that the exclusive forum provisions will not apply to suits brought to enforce any
liability or duty created by the Exchange Act, or to any claim for which the federal courts have exclusive
jurisdiction.
Furthermore, Section 22 of the Securities Act creates concurrent jurisdiction for federal and state courts over all
suits brought to enforce any duty or liability created by the Securities Act or the rules and regulations thereunder.
Accordingly, both state and federal courts have jurisdiction to entertain such Securities Act claims. To prevent
having to litigate claims in multiple jurisdictions and the threat of inconsistent or contrary rulings by different courts,
among other considerations, our Amended Charter will further provide that, unless we consent in writing to the
selection of an alternative forum, to the fullest extent permitted by law, the federal district courts of the United States
of America are the exclusive forum for the resolution of any complaint asserting a cause of action arising under the
Securities Act; however, there is uncertainty as to whether a court would enforce such provision, and investors
cannot waive compliance with federal securities laws and the rules and regulations thereunder. Nothing in our
Amended and Restated Charter or Amended Bylaws preclude stockholders that assert claims under the Exchange
Act from bringing such claims in state or federal court, subject to applicable law.
Although we believe the provision benefits us by providing increased consistency in the application of
Delaware law in the types of lawsuits to which it applies, the provision may limit a stockholder’s ability to bring a
claim in a judicial forum that it finds favorable for disputes with us or any of our directors, officers, other employees
or stockholders, which may have the effect of discouraging lawsuits with respect to such claims or make such
lawsuits more costly for stockholders. However, our stockholders will not be deemed to have waived our
compliance with federal securities laws and the rules and regulations thereunder.
Anti-Takeover Effects of Provisions of our Amended Charter and Amended Bylaws
Our Amended Charter and our Amended Bylaws also contain provisions that may delay, defer or discourage
another party from acquiring control of us. We expect that these provisions, which are summarized below, will
discourage coercive takeover practices or inadequate takeover bids. These provisions are also designed to encourage
persons seeking to acquire control of us to first negotiate with our board of directors, which we believe may result in
179
an improvement of the terms of any such acquisition in favor of our stockholders. However, they also give our board
of directors the power to discourage acquisitions that some stockholders may favor.
Classified Board of Directors
Our Amended Charter will provide that our board of directors will be divided into three classes, with the
number of directors in each class being as nearly equal in number as possible. The directors in each class will serve
for a three-year term, one class being elected each year by our stockholders, with staggered terms. Our Amended
Charter will provide that directors may only be removed from our board of directors for cause by the affirmative
vote of two-thirds of the shares entitled to vote. See “Management—Composition of our Board of Directors.” These
provisions may have the effect of deferring, delaying or discouraging hostile takeovers, or changes in control of us
or our management.
Special Meetings of Stockholders
Our Amended Bylaws provide that only the Chief Executive Officer or a majority of our board of directors may
call special meetings of our stockholders, thus prohibiting a stockholder from calling a special meeting. These
provisions might delay the ability of our stockholders to force consideration of a proposal or for stockholders
controlling a majority of our capital stock to take any action, including the removal of directors.
Advance Notice Requirements for Stockholder Proposals and Director Nominations
In addition, our Amended Bylaws will establish an advance notice procedure for stockholder proposals to be
brought before an annual meeting or special meeting of stockholders, including proposed nominations of candidates
for election to our board of directors. Generally, in order for any matter to be “properly brought” before a meeting,
the matter must be (a) specified in a notice of meeting given by or at the direction of our board of directors, (b) if not
specified in a notice of meeting, otherwise brought before the meeting by our board of directors or the chair of the
meeting, or (c) otherwise properly brought before the meeting by a stockholder present in person who (1) was a
stockholder both at the time of giving the notice and at the time of the meeting, (2) is entitled to vote at the meeting,
and (3) has complied with the advance notice procedures specified in the Amended Bylaws or properly made such
proposal in accordance with Rule 14a-8 under the Exchange Act and the rules and regulations thereunder, which
proposal has been included in the proxy statement for the annual meeting. Further, for business to be properly
brought before an annual meeting by a stockholder, the stockholder must (a) provide Timely Notice (as defined
below) thereof in writing and in proper form to the secretary and (b) provide any updates or supplements to such
notice at the times and in the forms required by our Amended Bylaws. To be timely, a stockholder’s notice must be
delivered to, or mailed and received at, our principal executive offices not less than 90 days nor more than 120 days
prior to the one-year anniversary of the preceding year’s annual meeting; provided, however, that if the date of the
annual meeting is more than 30 days before or more than 60 days after such anniversary date, to be timely, notice by
the stockholder must be so delivered, or mailed and received, not later than the 90th day prior to such annual
meeting or, if later, the 10th day following the day on which public disclosure of the date of such annual meeting
was first made (such notice within such time periods, “Timely Notice”).
Stockholders at an annual meeting or special meeting may only consider proposals or nominations specified in
the notice of meeting or brought before the meeting by or at the direction of our board of directors or by a qualified
stockholder of record on the record date for the meeting, who is entitled to vote at the meeting and who has
delivered timely written notice in proper form to our secretary of the stockholder’s intention to bring such business
before the meeting. These provisions could have the effect of delaying stockholder actions that are favored by the
holders of a majority of our outstanding voting securities until the next stockholder meeting.
Elimination of Stockholder Action by Written Consent
Our Amended Charter and Amended Bylaws will eliminate the right of stockholders to act by written consent
without a meeting following the first date on which we cease to have shares of Class B common stock outstanding.
180
Amendment of Certificate of Incorporation or Bylaws
Upon consummation of this offering, our Amended Bylaws may be amended or repealed by a vote of our board
of directors or by the affirmative vote of two-thirds of the votes which all of our stockholders would be eligible to
cast in an election of directors. The affirmative vote of a majority of our board of directors and two-thirds in voting
power of the outstanding shares entitled to vote thereon would be required to amend our Amended Charter.
Section 203 of the DGCL
We will be governed by the provisions of Section 203 of the DGCL. In general, Section 203 prohibits a public
Delaware corporation from engaging in a “business combination” with an “interested stockholder” for a period of
three years after the time of the transaction in which the person became an interested stockholder, unless:
•the business combination or transaction which resulted in the stockholder becoming an interested
stockholder was approved by the board of directors prior to the time that the stockholder became an
interested stockholder;
•upon consummation of the transaction which resulted in the stockholder becoming an interested
stockholder, the interested stockholder owned at least 85% of the voting stock of the corporation
outstanding at the time the transaction commenced, excluding shares owned by directors who are also
officers of the corporation and shares owned by employee stock plans in which employee participants do
not have the right to determine confidentially whether shares held subject to the plan will be tendered in a
tender or exchange offer; or
•at or subsequent to the time the stockholder became an interested stockholder, the business combination
was approved by the board of directors and authorized at an annual or special meeting of the stockholders,
and not by written consent, by the affirmative vote of at least 66⅔% of the outstanding voting stock which
is not owned by the interested stockholder.
In general, Section 203 defines a “business combination” to include mergers, asset sales and other transactions
resulting in financial benefit to a stockholder and an “interested stockholder” as a person who, together with
affiliates and associates, owns, or, if such person is an affiliate or associate of the corporation, within three years did
own, 15% or more of the corporation’s outstanding voting stock. These provisions may have the effect of delaying,
deferring or preventing changes in control of our Company.
Limitations on Liability and Indemnification of Officers and Directors
The DGCL authorizes corporations to limit or eliminate the personal liability of directors to corporations and
their stockholders for monetary damages for breaches of directors’ fiduciary duties, subject to certain exceptions.
Our Amended Charter includes a provision that eliminates the personal liability of directors for monetary damages
to the corporation or its stockholders for any breach of fiduciary duty as a director, except to the extent such
exemption from liability or limitation thereof is not permitted under the DGCL. The effect of these provisions is to
eliminate the rights of us and our stockholders, through stockholders’ derivative suits on our behalf, to recover
monetary damages from a director for breach of fiduciary duty as a director, including breaches resulting from
grossly negligent behavior. However, exculpation does not apply to any breaches of the director’s duty of loyalty,
any acts or omissions not in good faith or that involve intentional misconduct or knowing violation of law, any
authorization of dividends or stock redemptions or repurchases paid or made in violation of the DGCL, or for any
transaction from which the director derived an improper personal benefit.
Our Amended Bylaws generally provide that we must indemnify and advance expenses to our directors and
officers to the fullest extent authorized by the DGCL. We also are expressly authorized to carry directors’ and
officers’ liability insurance providing indemnification for our directors, officers, and certain employees for some
liabilities. We believe that these indemnification and advancement provisions and insurance are useful to attract and
retain qualified directors and executive officers.
181
The limitation of liability, indemnification, and advancement provisions in our Amended Charter and Amended
Bylaws may discourage stockholders from bringing a lawsuit against directors for breach of their fiduciary duty.
These provisions also may have the effect of reducing the likelihood of derivative litigation against directors and
officers, even though such an action, if successful, might otherwise benefit us and our stockholders. In addition, your
investment may be adversely affected to the extent we pay the costs of settlement and damage awards against
directors and officers pursuant to these indemnification provisions.
There is currently no pending material litigation or proceeding involving any of our directors, officers, or
employees for which indemnification is sought.
Indemnification Agreements
We intend to enter into an indemnification agreement with each of our directors and executive officers as
described in “Certain Relationships and Related Party Transactions — Director and Officer Indemnification and
Insurance.” Insofar as indemnification for liabilities arising under the Securities Act may be permitted to directors or
executive officers, we have been informed that in the opinion of the SEC such indemnification is against public
policy and is therefore unenforceable.
Corporate Opportunities
Our Amended Charter provides that, to the fullest extent permitted by law, we have renounced any interest or
expectancy in, or in being offered an opportunity to participate in, an Excluded Opportunity. An “Excluded
Opportunity” is any matter, transaction or interest that is presented to, or acquired, created or developed by, or which
otherwise comes into the possession of, (i) any director who is not an employee of Fervo Energy or any of its
subsidiaries, or (ii) any holder of preferred stock or any partner, member, director, stockholder, employee or agent of
any such holder, other than someone who is an employee of Fervo Energy or any of its subsidiaries (collectively,
“Covered Persons”), unless such matter, transaction or interest is presented to, or acquired, created or developed by,
or otherwise comes into the possession of, a Covered Person expressly and solely in such Covered Person’s capacity
as a director.
Dissenters’ Rights of Appraisal and Payment
Under the DGCL, with certain exceptions, our stockholders will have appraisal rights in connection with a
merger or consolidation of Fervo Energy. Pursuant to the DGCL, stockholders who properly request and perfect
appraisal rights in connection with such merger or consolidation will have the right to receive payment of the fair
value of their shares as determined by the Court of Chancery in the State of Delaware.
Stockholders’ Derivative Actions
Under the DGCL, any of our stockholders may bring an action in our name to procure a judgment in our favor,
also known as a derivative action, provided that the stockholder bringing the action is a holder of our shares at the
time of the transaction to which the action relates or such stockholder’s shares thereafter devolved by operation of
law and such suit is brought in the Court of Chancery in the State of Delaware. See “— Exclusive Venue” above.
Stock Exchange Listing
We intend to apply to list our Class A common stock on the NASDAQ under the symbol “ FRVO.”
Transfer Agent and Registrar
The transfer agent and registrar for our Class A common stock and Class B common stock is Fidelity Stock
Transfer Services, LLC. The transfer agent and registrar’s address is 245 Summer Street, Boston, Massachusetts
02210, and its telephone number is (617) 563-5800.
182
SHARES ELIGIBLE FOR FUTURE SALE
Immediately prior to this offering, there was no public market for our Class A common stock. Future sales of
substantial amounts of Class A common stock in the public market, or the perception that such sales may occur,
could adversely affect the market price of our Class A common stock. Although we have applied to have our Class
A common stock listed on the NASDAQ, we cannot assure you that there will be an active public market for our
Class A common stock.
Upon the closing of this offering, we will have outstanding an aggregate of 275,776,919 shares of Class A
common stock, assuming the issuance of 70,000,000 shares of Class A common stock offered by us in this offering.
Of these shares, all shares sold in this offering will be freely tradable without restriction or further registration under
the Securities Act, except for any shares purchased by our “affiliates,” as that term is defined in Rule 144 under the
Securities Act, whose sales would be subject to the Rule 144 resale restrictions described below, other than the
holding period requirement.
The remaining 205,776,919 shares of Class A common stock will be “restricted securities,” as that term is
defined in Rule 144 under the Securities Act. These restricted securities are eligible for public sale only if they are
registered under the Securities Act or if they qualify for an exemption from registration under Rules 144 or 701
under the Securities Act, which are summarized below.
Registration Rights
After the completion of this offering, holders of approximately 164,204,493 shares of our outstanding Class A
common stock, or certain of their transferees, will be entitled to certain rights with respect to the registration of those
shares under the Securities Act. If these shares are registered, in most cases they will be freely tradable without
restriction under the Securities Act, subject to the Rule 144 limitations applicable to affiliates, and a large number of
shares may be sold into the public market. See “Risk Factors — Risks Relating to Owning Our Common Stock —
The grant of registration rights to certain of our stockholders, and the future exercise of such rights may adversely
affect the market price of our Class A common stock.” for additional information.
Demand Registration Rights
Subject to any lock-up agreement executed with the underwriters in connection with this offering, the holders of
a majority of the registrable shares of Class A common stock then outstanding (or a lesser percentage if the
anticipated aggregate offering price, net of selling expenses, would exceed $50,000,000) can request that we register
the offer and sale of their shares on a Form S-1 or similar long-form registration statement. We are obligated to
effect only two such long-form registrations.
Piggyback Registration Rights
Following this offering, if we propose to register any of our securities under the Securities Act in connection
with a public offering solely for cash (other than certain excluded registrations), the holders of registrable shares of
Class A common stock will be entitled to certain "piggyback" registration rights allowing such holders to include
their registrable shares of Class A common stock in such registration, subject to certain marketing and other
limitations. As a result of these limitations, in the event the managing underwriters advise us that the number of
securities requested to be included in such offering exceeds the number that can be sold without adversely affecting
the marketability, proposed offering price, timing, or method of distribution of the offering, the securities to be
included in such offering will be allocated in the following order of priority: (i) first, the securities we propose to
sell; (ii) second, the registrable securities requested to be included by the holders, allocated pro rata among such
holders based on their respective holdings; and (iii) third, other securities requested to be included in such
registration.
Notwithstanding the foregoing priority and cutback provisions, in no event will the number of registrable
securities included in the offering be reduced below 20% of the total number of securities included in such offering.
For the avoidance of doubt, this 20% floor means that the holders of registrable securities are entitled to a minimum
allocation equal to at least 20% of the total offering size (inclusive of securities offered by us, the holders, and any
183
other selling stockholders), regardless of any cutback recommendation by the underwriters. This 20% floor is
measured against the aggregate number of securities included in the offering, and not against the number of
registrable securities originally requested for inclusion by the holders.
S-3 Registration Rights
If we are eligible to file a registration statement on Form S-3, holders of at least 20% of the registrable shares of
Class A common stock then outstanding may make a written request that we register the offer and sale of their
shares of Class A common stock on a registration statement on Form S-3, so long as the request covers securities for
which the anticipated aggregate offering price is at least $10,000,000, net of selling expenses. These stockholders
may make an unlimited number of requests for registration on Form S-3; however, we will not be required to effect
a registration on Form S-3 if we have effected two such registrations within the 12-month period preceding the date
of the request, or after we have effected six short-form registrations in the aggregate. See “Certain Relationships and
Related Party Transactions — Registration Rights Agreement” for more information.
Lock-Up Agreements
In connection with this offering, we, our officers, our directors and certain other holders that represent
approximately 99% of our outstanding Class A common stock and securities directly or indirectly convertible into or
exchangeable or exercisable for our Class A common stock will agree to lock-up periods as specified herein.
We, our officers and our directors will agree that, without the prior written consent of J.P. Morgan Securities
LLC and BofA Securities, Inc., as representatives of the underwriters, we and they will not, subject to certain
exceptions, during the period ending 180 days after the date of this prospectus:
•offer, sell, contract to sell, pledge, grant any option to purchase, make any short sale or otherwise transfer
or dispose of, directly or indirectly or publicly disclose the intention to make any offer, sale, pledge or
disposition of any shares of our Class A common stock, or any options or warrants to purchase any shares
of our Class A common stock, or any securities convertible into, or exchangeable for, or that represent the
right to receive, shares of our Class A common stock; or
•enter into any swap or other arrangement that transfers to another, all or a portion of the economic
consequences of ownership of our Class A common stock or any securities convertible into or exercisable
or exchangeable for shares of our Class A common stock,
whether any transaction described above is to be settled by delivery of our Class A common stock or such other
securities, in cash or otherwise.
The representatives of the underwriters have advised us that they have no present intent or arrangement to
release any shares subject to a lock-up, and will consider the release of any lock-up on a case-by-case basis. Upon a
request to release any shares subject to a lock-up, the representatives of the underwriters would consider the
particular circumstances surrounding the request, including, but not limited to, the length of time before the lock-up
expires, the number of shares requested to be released, reasons for the request, the possible impact on the market or
our Class A common stock and whether the holder of our shares requesting the release is an officer, director or other
affiliate of ours.
Upon the expiration of the lock-up period, substantially all of the shares subject to such lock-up restrictions will
become eligible for sale, subject to the limitations discussed above. For a further description of the lock-up
agreements, see “Underwriting.”
Rule 144
Affiliate Resales of Restricted Securities
After giving effect to this offering, the Stock Split, the Reclassification, the Founder Share Exchange and the
Preferred Stock Conversion, we expect that 205,776,919 shares of our outstanding Class A common stock will be
“restricted” securities under the meaning of Rule 144 under the Securities Act and may not be sold in the absence of
184
registration under the Securities Act unless an exemption from registration is available, including the exemption
provided by Rule 144.
In general, under Rule 144 as currently in effect, beginning 90 days after the date of this prospectus, a person
who is not deemed to have been an affiliate of ours at any time during the three months preceding a sale and who
has beneficially owned shares considered to be restricted securities under Rule 144 for at least six months would be
entitled to sell those shares, subject only to the availability of current public information about us. A non-affiliated
person who has beneficially owned shares considered to be restricted securities under Rule 144 for at least one year
would be entitled to sell those shares without regard to the provisions of Rule 144.
An affiliate of ours who has beneficially owned shares of our Class A common stock for at least six months
would be entitled to sell, within any three-month period, a number of shares that does not exceed the greater of:
•1% of the number of shares of our Class A common stock then outstanding; and
•the average weekly trading volume in our Class A common stock on the NASDAQ during the four calendar
weeks preceding the filing of a notice on Form 144 with respect to such sale;
provided, in each case, that we are subject to the Exchange Act periodic reporting requirements for at least 90
days before the sale and have filed all required reports during that time period. Such sales by affiliates must also
comply with the manner of sale, current public information and notice provisions of Rule 144. In addition, if the
number of shares being sold under Rule 144 by an affiliate during any three-month period exceeds 5,000 shares or
has an aggregate sale price in excess of $50,000, the seller must file a notice on Form 144 with the SEC and the
NASDAQ concurrently with either the placing of a sale order with the broker or the execution directly with a market
maker.
An “affiliate” is a person that directly, or indirectly through one or more intermediaries, controls or is controlled
by, or is under common control with an issuer.
Non-Affiliate Resales of Restricted Securities
Under Rule 144, a person who is not an affiliate of ours at the time of sale, and has not been an affiliate at any
time during the 90 days preceding a sale, and who has beneficially owned shares of our common stock for at least
six months but less than a year, is entitled to sell such shares subject only to the availability of current public
information about us. If such person has held our shares for at least one year, such person can resell without regard
to any Rule 144 restrictions, including the 90-day public company requirement and the current public information
requirement.
Non-affiliate resales are not subject to the manner of sale, volume limitation or notice filing provisions of
Rule 144.
Rule 701
In general, under Rule 701, any of our employees, directors, officers, consultants or advisors who purchases
shares from us in connection with a compensatory stock or option plan or other written agreement before the
effective date of the registration statement of which this prospectus forms a part is entitled to sell such shares 90
days after such effective date in reliance on Rule 144. Our affiliates can resell shares in reliance on Rule 144 without
having to comply with the holding period requirement, and non-affiliates of the issuer can resell shares in reliance
on Rule 144 without having to comply with the current public information and holding period requirements.
The SEC has indicated that Rule 701 will apply to typical stock options granted by an issuer before it becomes
subject to the reporting requirements of the Exchange Act, along with the shares acquired upon exercise of such
options, including exercises after an issuer becomes subject to the reporting requirements of the Exchange Act.
185
Registration Statement on Form S-8
We intend to file a registration statement or statements on Form S-8 under the Securities Act covering shares of
Class A common stock subject to issuance upon the exercise of outstanding stock options under the 2019 Plan and
reserved for issuance under the 2026 Plan and the ESPP. These registration statements are expected to be filed as
soon as practicable after the closing date of this offering. Shares issued upon the exercise of stock options after the
effective date of the applicable Form S-8 registration statement will be eligible for resale in the public market
without restriction, subject to Rule 144 limitations applicable to affiliates and the lock-up agreements described
above. See “Executive and Director Compensation — Equity Incentive Award Plans” for a description of our equity
compensation plans.
186
MATERIAL U.S. FEDERAL INCOME TAX CONSIDERATIONS FOR NON-U.S. HOLDERS OF
COMMON STOCK
The following discussion is a summary of the material U.S. federal income tax consequences to Non-U.S.
Holders (as defined below) of the purchase, ownership and disposition of our Class A common stock issued pursuant
to this offering, but does not purport to be a complete analysis of all potential tax effects. The effects of other U.S.
federal tax laws, such as estate and gift tax laws, and any applicable state, local or non-U.S. tax laws are not
discussed. This discussion is based on the U.S. Internal Revenue Code of 1986, as amended (the “Code”), Treasury
Regulations promulgated thereunder, judicial decisions, and published rulings and administrative pronouncements of
the IRS, in each case in effect as of the date hereof. These authorities may change or be subject to differing
interpretations. Any such change or differing interpretation may be applied retroactively in a manner that could
adversely affect a Non-U.S. Holder. We have not sought and will not seek any rulings from the IRS regarding the
matters discussed below. There can be no assurance the IRS or a court will not take a contrary position to that
discussed below regarding the tax consequences of the purchase, ownership and disposition of our Class A common
stock.
This discussion is limited to Non-U.S. Holders that hold our Class A common stock as a “capital asset” within
the meaning of Section 1221 of the Code (generally, property held for investment). This discussion does not address
all U.S. federal income tax consequences relevant to a Non-U.S. Holder’s particular circumstances, including the
impact of the Medicare contribution tax on net investment income and the alternative minimum tax. In addition, it
does not address consequences relevant to Non-U.S. Holders subject to special rules, including, without limitation:
•U.S. expatriates and former citizens or long-term residents of the United States;
•persons holding our Class A common stock as part of a hedge, straddle, or other risk reduction strategy or
as part of a conversion transaction or other integrated investment;
•banks, insurance companies, and other financial institutions;
•brokers, dealers, or traders in securities;
•“controlled foreign corporations,” “passive foreign investment companies,” and corporations that
accumulate earnings to avoid U.S. federal income tax;
•partnerships or other entities or arrangements treated as partnerships for U.S. federal income tax purposes
(and investors therein);
•tax-exempt organizations or governmental organizations;
•persons deemed to sell our Class A common stock under the constructive sale provisions of the Code;
•persons who hold or receive our Class A common stock pursuant to the exercise of any employee stock
option or otherwise as compensation;
•tax-qualified retirement plans;
•“qualified foreign pension funds” as defined in Section 897(l)(2) of the Code and entities all of the interests
of which are held by qualified foreign pension funds; and
•persons holding Class B common stock.
If an entity treated as a partnership for U.S. federal income tax purposes holds our Class A common stock, the
tax treatment of a partner in the partnership will generally depend on the status of the partner, the activities of the
partnership, and certain determinations made at the partner level. Accordingly, partnerships holding our Class A
common stock and the partners in such partnerships should consult their tax advisors regarding the U.S. federal
income tax consequences to them.
187
THIS DISCUSSION IS FOR INFORMATIONAL PURPOSES ONLY AND IS NOT TAX ADVICE.
INVESTORS SHOULD CONSULT THEIR TAX ADVISORS WITH RESPECT TO THE APPLICATION
OF THE U.S. FEDERAL INCOME TAX LAWS TO THEIR PARTICULAR SITUATIONS AS WELL AS
ANY TAX CONSEQUENCES OF THE PURCHASE, OWNERSHIP, AND DISPOSITION OF OUR CLASS
A COMMON STOCK ARISING UNDER THE U.S. FEDERAL ESTATE OR GIFT TAX LAWS OR
UNDER THE LAWS OF ANY STATE, LOCAL, OR NON-U.S. TAXING JURISDICTION OR UNDER
ANY APPLICABLE INCOME TAX TREATY.
Definition of a Non-U.S. Holder
For purposes of this discussion, a “Non-U.S. Holder” is any beneficial owner of our Class A common stock that
is neither a “U.S. person” nor an entity treated as a partnership for U.S. federal income tax purposes. A U.S. person
is any person that, for U.S. federal income tax purposes, is or is treated as any of the following:
•an individual who is a citizen or resident of the United States;
•a corporation created or organized under the laws of the United States, any state thereof, or the District of
Columbia;
•an estate, the income of which is subject to U.S. federal income tax regardless of its source; or
•a trust that (1) is subject to the primary supervision of a U.S. court and the control of one or more “United
States persons” (within the meaning of Section 7701(a)(30) of the Code), or (2) has a valid election in
effect to be treated as a United States person for U.S. federal income tax purposes.
Distributions
As described in the section entitled “Dividend Policy,” we do not anticipate declaring or paying dividends to
holders of our Class A common stock in the foreseeable future. However, if we do make distributions of cash or
property on our Class A common stock, such distributions will constitute dividends for U.S. federal income tax
purposes to the extent paid from our current or accumulated earnings and profits, as determined under U.S. federal
income tax principles. Amounts not treated as dividends for U.S. federal income tax purposes will constitute a return
of capital and first be applied against and reduce a Non-U.S. Holder’s adjusted tax basis in its Class A common
stock, but not below zero. Any excess will be treated as capital gain and will be treated as described below under
“— Sale or Other Taxable Disposition.”
Subject to the discussion below on effectively connected income, dividends paid to a Non-U.S. Holder will
generally be subject to U.S. federal withholding tax at a rate of 30% of the gross amount of the dividends (or such
lower rate specified by an applicable income tax treaty, provided the Non-U.S. Holder furnishes to the applicable
withholding agent a valid IRS Form W-8BEN or W-8BEN-E (or other applicable documentation) certifying
qualification for the lower treaty rate). A Non-U.S. Holder that does not timely furnish the required documentation,
but that qualifies for a reduced treaty rate, may obtain a refund of any excess amounts withheld by timely filing an
appropriate claim for refund with the IRS. Non-U.S. Holders should consult their tax advisors regarding their
entitlement to benefits under any applicable income tax treaty.
If dividends paid to a Non-U.S. Holder are effectively connected with the Non-U.S. Holder’s conduct of a trade
or business within the United States (and, if required by an applicable income tax treaty, the Non-U.S. Holder
maintains a permanent establishment in the United States to which such dividends are attributable), the Non-U.S.
Holder will be exempt from the U.S. federal withholding tax described above. To claim the exemption, the Non-U.S.
Holder must furnish to the applicable withholding agent a valid IRS Form W-8ECI, certifying that the dividends are
effectively connected with the Non-U.S. Holder’s conduct of a trade or business within the United States.
Any such effectively connected dividends will be subject to U.S. federal income tax on a net income basis at the
regular rates. A Non-U.S. Holder that is a corporation also may be subject to a branch profits tax at a rate of 30% (or
such lower rate specified by an applicable income tax treaty) on such effectively connected dividends, as adjusted
188
for certain items. Non-U.S. Holders should consult their tax advisors regarding any applicable tax treaties that may
provide for different rules.
Sale or Other Taxable Disposition
Subject to the discussion below under “—Information Reporting and Backup Withholding”, a Non-U.S. Holder
will generally not be subject to U.S. federal income or withholding tax on any gain realized upon the sale or other
taxable disposition of our Class A common stock unless:
•the gain is effectively connected with the Non-U.S. Holder’s conduct of a trade or business within the
United States (and, if required by an applicable income tax treaty, the Non-U.S. Holder maintains a
permanent establishment in the United States to which such gain is attributable);
•the Non-U.S. Holder is a nonresident alien individual present in the United States for 183 days or more
during the taxable year of the disposition and certain other requirements are met; or
•our Class A common stock constitutes a U.S. real property interest (a “USRPI”), by reason of our status as
a U.S. real property holding corporation (a “USRPHC”), for U.S. federal income tax purposes.
Gain described in the first bullet point above generally will be subject to U.S. federal income tax on a net
income basis at the regular rates. A Non-U.S. Holder that is a corporation also may be subject to a branch profits tax
at a rate of 30% (or such lower rate specified by an applicable income tax treaty) on such effectively connected gain,
as adjusted for certain items.
A Non-U.S. Holder described in the second bullet point above will be subject to U.S. federal income tax at a
rate of 30% (or such lower rate specified by an applicable income tax treaty) on gain realized upon the sale or other
taxable disposition of our Class A common stock, which may be offset by U.S. source capital losses of the Non-U.S.
Holder (even though the individual is not considered a resident of the United States), provided the Non-U.S. Holder
has timely filed U.S. federal income tax returns with respect to such losses.
With respect to the third bullet point above, because the determination of whether we are a USRPHC depends
on the fair market value of our USRPIs relative to the fair market value of our non-U.S. real property interests and
our other business assets, there can be no assurance we currently are not a USRPHC or will not become one in the
future. Non-U.S. Holders generally are subject to a 15% withholding tax on the amount realized from a sale or other
taxable disposition of a USRPI, such as our Class A common stock, which is required to be collected from any sale
or disposition proceeds. Furthermore, such Non-U.S. Holders are subject to U.S. federal income tax (at the regular
rates) in respect of any gain on their sale or other taxable disposition of the Class A common stock and are required
to file a U.S. tax return to report such gain and pay any tax liability that is not satisfied by withholding. A Non-U.S.
Holder may, by filing a U.S. federal income tax return, be able to claim a refund for any withholding tax deducted in
excess of the tax liability on any gain. However, even if we are or were to become a USRPHC, if our Class A
common stock is considered “regularly traded on an established securities market” (within the meaning of the
Treasury Regulations), then Non-U.S. Holders will not be subject to the 15% withholding tax on the disposition of
their Class A common stock, even if such Class A common stock constitutes USRPIs. Moreover, even if we are or
were to become a USRPHC, if our Class A common stock is considered “regularly traded on an established
securities market” (within the meaning of the Treasury Regulations) and the Non-U.S. Holder actually or
constructively owns or owned, at all times during the shorter of the five-year period ending on the date of the sale or
other taxable disposition or the Non-U.S. Holder’s holding period, 5% or less of our Class A common stock taking
into account applicable constructive ownership rules, such Non-U.S. Holder may treat its ownership of our Class A
common stock as not constituting a USRPI and will not be subject to U.S. federal income tax on any gain realized
upon the sale or other taxable disposition of our Class A common stock (in addition to not being subject to the 15%
withholding tax described above) or U.S. tax return filing requirements. We expect our Class A common stock to be
treated as “regularly traded on an established securities market” so long as our Class A common stock is listed on
the NASDAQ and regularly quoted by brokers or dealers making a market in such Class A common stock.
Non-U.S. Holders should consult their tax advisors regarding tax consequences of our treatment as a USRPHC
and regarding potentially applicable income tax treaties that may provide for different rules.
189
Information Reporting and Backup Withholding
Payments of dividends on our Class A common stock will not be subject to backup withholding, provided the
applicable withholding agent does not have actual knowledge or reason to know the holder is a United States person
and the holder either certifies its non-U.S. status, such as by furnishing a valid IRS Form W-8BEN, W-8BEN-E or
W-8ECI, or otherwise establishes an exemption. However, information returns are required to be filed with the IRS
in connection with any distributions on our Class A common stock paid to the Non-U.S. Holder, regardless of
whether such distributions constitute dividends or whether any tax was actually withheld. In addition, proceeds of
the sale or other taxable disposition of our Class A common stock within the United States or conducted through
certain U.S.-related brokers generally will not be subject to backup withholding or information reporting, if the
applicable withholding agent receives the certification described above and does not have actual knowledge or
reason to know that such holder is a United States person, or the holder otherwise establishes an exemption.
Proceeds of a disposition of our Class A common stock conducted through a non-U.S. office of a non-U.S. broker
generally will not be subject to backup withholding or information reporting.
Copies of information returns that are filed with the IRS may also be made available under the provisions of an
applicable treaty or agreement to the tax authorities of the country in which the Non-U.S. Holder resides or is
established.
Backup withholding is not an additional tax. Any amounts withheld under the backup withholding rules may be
allowed as a refund or a credit against a Non-U.S. Holder’s U.S. federal income tax liability, provided the required
information is timely furnished to the IRS.
Additional Withholding Tax on Payments Made to Foreign Accounts
Withholding taxes may be imposed under Sections 1471 to 1474 of the Code (such Sections commonly referred
to as the Foreign Account Tax Compliance Act, or FATCA), on certain types of payments made to non-U.S.
financial institutions and certain other non-U.S. entities. Specifically, a 30% withholding tax may be imposed on
dividends on, or (subject to the proposed Treasury Regulations discussed below) gross proceeds from the sale or
other disposition of, our Class A common stock paid to a “foreign financial institution” or a “non-financial foreign
entity” (each as defined in the Code), unless (1) the foreign financial institution undertakes certain diligence and
reporting obligations, (2) the non-financial foreign entity either certifies it does not have any “substantial United
States owners” (as defined in the Code) or furnishes to the applicable withholding agent a certification identifying
each direct and indirect substantial United States owner, or (3) the foreign financial institution or non-financial
foreign entity otherwise qualifies for an exemption from these rules and provides appropriate documentation (such
as an IRS Form W-8BEN-E). If the payee is a foreign financial institution and is subject to the diligence and
reporting requirements in (1) above, it must enter into an agreement with the U.S. Department of the Treasury
requiring, among other things, that it undertake to identify accounts held by certain “specified United States
persons” or “United States owned foreign entities” (each as defined in the Code), annually report certain information
about such accounts, and withhold 30% on certain payments to non-compliant foreign financial institutions and
certain other account holders. Foreign financial institutions located in jurisdictions that have an intergovernmental
agreement with the United States governing FATCA may be subject to different rules. Under certain circumstances,
a holder might be eligible for refunds or credits of such taxes.
Under the applicable Treasury Regulations and administrative guidance, withholding under FATCA generally
applies to payments of dividends on our Class A common stock. While withholding under FATCA would have
applied also to payments of gross proceeds from the sale or other disposition of our Class A common stock on or
after January 1, 2019, proposed Treasury Regulations eliminate FATCA withholding on payments of gross proceeds
entirely. Taxpayers generally may rely on these proposed Treasury Regulations until final Treasury Regulations are
issued.
Prospective investors should consult their tax advisors regarding the potential application of withholding under
FATCA to their investment in our Class A common stock.
190
UNDERWRITING
We are offering the shares of Class A common stock described in this prospectus through a number of
underwriters. J.P. Morgan Securities LLC and BofA Securities, Inc. are acting as joint book-running managers of the
offering and as representatives of the underwriters. We have entered into an underwriting agreement with the
underwriters. Subject to the terms and conditions of the underwriting agreement, we have agreed to sell to the
underwriters, and each underwriter has severally agreed to purchase, at the public offering price less the
underwriting discounts and commissions set forth on the cover page of this prospectus, the number of shares of
Class A common stock listed next to its name in the following table:
Name | Number of Shares | |
J.P. Morgan Securities LLC ................................................................................................................. | ||
BofA Securities, Inc. ............................................................................................................................ | ||
RBC Capital Markets, LLC ................................................................................................................. | ||
Barclays Capital Inc. ............................................................................................................................. | ||
Robert W. Baird & Co. Incorporated .................................................................................................... | ||
BBVA Securities Inc. ............................................................................................................................ | ||
Guggenheim Securities, LLC ................................................................................................................ | ||
MUFG Securities Americas Inc. ........................................................................................................... | ||
SG Americas Securities, LLC ............................................................................................................... | ||
William Blair & Company, L.L.C. ....................................................................................................... | ||
Piper Sandler & Co. ............................................................................................................................. | ||
Nomura Securities International, Inc. ................................................................................................... | ||
WR Securities, LLC .............................................................................................................................. | ||
Total ...................................................................................................................................................... | 70,000,000 |
_______________
“Wolfe | Nomura Alliance” is the marketing name used by Wolfe Research Securities and Nomura Securities International, Inc. in connection
with certain equity capital markets activities conducted jointly by the firms. Both Nomura Securities International, Inc. and WR Securities,
LLC are serving as underwriters in the offering described herein. In addition, WR Securities, LLC and certain of its affiliates may provide
sales support services, investor feedback, investor education, and/or other independent equity research services in connection with this
offering.
The underwriters are committed to purchase all the shares of Class A common stock offered by us if they
purchase any shares. The underwriting agreement also provides that if an underwriter defaults, the purchase
commitments of non-defaulting underwriters may also be increased or the offering may be terminated.
The underwriters propose to offer the shares of Class A common stock directly to the public at the initial public
offering price set forth on the cover page of this prospectus and to certain dealers at that price less a concession not
in excess of $ per share. Any such dealers may resell shares to certain other brokers or dealers at a discount of up to
$ per share from the initial public offering price. After the initial offering of the shares to the public, if all of the
shares of Class A common stock are not sold at the initial public offering price, the underwriters may change the
offering price and the other selling terms. Sales of any shares made outside of the United States may be made by
affiliates of the underwriters.
The underwriters have an option to buy up to 10,500,000 additional shares of Class A common stock from us to
cover sales of shares by the underwriters which exceed the number of shares specified in the table above. The
underwriters have 30 days from the date of this prospectus to exercise this option to purchase additional shares. If
any shares are purchased with this option to purchase additional shares, the underwriters will purchase shares in
approximately the same proportion as shown in the table above. If any additional shares of Class A common stock
are purchased, the underwriters will offer the additional shares on the same terms as those on which the shares are
being offered.
191
The Cornerstone Investors have, severally and not jointly, indicated an interest in purchasing up to an aggregate
of $350 million in shares of our Class A common stock in this offering at the initial public offering price and on the
same terms and conditions as the other purchasers in this offering. The shares of Class A common stock to be
purchased by the Cornerstone Investors will not be subject to a lock-up agreement with the underwriters. Because
this indication of interest is not a binding agreement or commitment to purchase, the Cornerstone Investors may
determine to purchase more, fewer, or no shares in this offering, or the underwriters may determine to sell more,
fewer, or no shares to the Cornerstone Investors. The underwriters will receive the same underwriting discount on
any shares of our Class A common stock purchased by the Cornerstone Investors as they will from the other shares
sold to the public in this offering.
The underwriting fee is equal to the public offering price per share of Class A common stock less the amount
paid by the underwriters to us per share of Class A common stock. The underwriting fee is $ per share. The
following table shows the per share and total underwriting discounts and commissions to be paid to the underwriters
assuming both no exercise and full exercise of the underwriters’ option to purchase additional shares.
Without option to purchase additional shares exercise | With full option to purchase additional shares exercise | ||
Per Share .................................................................................................................... | $ | $ | |
Total ........................................................................................................................... | $ | $ |
We estimate that the total expenses of this offering, including registration, filing and listing fees, printing fees
and legal and accounting expenses, but excluding the underwriting discounts and commissions, will be
approximately $9,203,268.
A prospectus in electronic format may be made available on the web sites maintained by one or more
underwriters, or selling group members, if any, participating in the offering. The underwriters may agree to allocate
a number of shares to underwriters and selling group members for sale to their online brokerage account holders.
Internet distributions will be allocated by the representatives to underwriters and selling group members that may
make Internet distributions on the same basis as other allocations.
We have agreed that we will not (i) offer, pledge, sell, contract to sell, sell any option or contract to purchase,
purchase any option or contract to sell, grant any option, right or warrant to purchase, lend or otherwise transfer or
dispose of, directly or indirectly, or submit to, or file with, the Securities and Exchange Commission a registration
statement under the Securities Act relating to, any shares of our Class A common stock or securities convertible into
or exercisable or exchangeable for any shares of our Class A common stock, or publicly disclose the intention to
make any offer, sale, pledge, loan, disposition or filing, or (ii) enter into any swap or other arrangement that transfers
all or a portion of the economic consequences associated with the ownership of any shares of Class A common stock
or any such other securities (regardless of whether any of these transactions are to be settled by the delivery of
shares of Class A common stock or such other securities, in cash or otherwise), in each case without the prior written
consent of J.P. Morgan Securities LLC and BofA Securities, Inc. for a period of 180 days after the date of this
prospectus, other than the shares of our Class A common stock to be sold in this offering.
The restrictions on our actions, as described above, do not apply to certain transactions, including (i) the
issuance of shares of Class A common stock or securities convertible into or exercisable for shares of our Class A
common stock pursuant to the conversion or exchange of convertible or exchangeable securities or the exercise of
warrants or options (including net exercise) or the settlement of RSUs (including net settlement), in each case
outstanding on the date of the underwriting agreement and described in this prospectus; (ii) grants of stock options,
stock awards, restricted stock, RSUs, or other equity awards and the issuance of shares of our Class A common
stock or securities convertible into or exercisable or exchangeable for shares of our Class A common stock (whether
upon the exercise of stock options or otherwise) to our employees, officers, directors, advisors, or consultants
pursuant to the terms of an equity compensation plan in effect as of the closing of this offering and described in this
prospectus, provided that such recipients enter into a lock-up agreement with the underwriters; or (iii) our filing of
any registration statement on Form S-8 relating to securities granted or to be granted pursuant to any plan in effect
192
on the date of the underwriting agreement and described in this prospectus or any assumed benefit plan pursuant to
an acquisition or similar strategic transaction.
Our directors and executive officers, and our shareholders holding in the aggregate 97% of the outstanding
shares of our Class A common stock (such persons, the “lock-up parties”) have entered into lock-up agreements with
the underwriters prior to the commencement of this offering pursuant to which each lock-up party, with limited
exceptions, for a period of 180 days after the date of this prospectus (such period, the “restricted period”), may not
(and may not cause any of their direct or indirect affiliates to), without the prior written consent of J.P. Morgan
Securities LLC and BofA Securities, Inc., (1) offer, pledge, sell, contract to sell, sell any option or contract to
purchase, purchase any option or contract to sell, grant any option, right or warrant to purchase, lend or otherwise
transfer or dispose of, directly or indirectly, any shares of our Class A common stock or any securities convertible
into or exercisable or exchangeable for our Class A common stock (including, without limitation, Class A common
stock or such other securities which may be deemed to be beneficially owned by such lock-up parties in accordance
with the rules and regulations of the SEC and securities which may be issued upon exercise of a stock option or
warrant (collectively with the Class A common stock, the “lock-up securities”)), (2) enter into any hedging, swap or
other agreement or transaction that transfers, in whole or in part, any of the economic consequences of ownership of
the lock-up securities, whether any such transaction described in clause (1) or (2) above is to be settled by delivery
of lock-up securities, in cash or otherwise, (3) make any demand for, or exercise any right with respect to, the
registration of any lock-up securities, or (4) publicly disclose the intention to do any of the foregoing. Such persons
or entities have further acknowledged that these undertakings preclude them from engaging in any hedging or other
transactions or arrangements (including, without limitation, any short sale or the purchase or sale of, or entry into,
any put or call option, or combination thereof, forward, swap or any other derivative transaction or instrument,
however described or defined) designed or intended, or which could reasonably be expected to lead to or result in, a
sale or disposition or transfer (by any person or entity, whether or not a signatory to such agreement) of any
economic consequences of ownership, in whole or in part, directly or indirectly, of any lock-up securities, whether
any such transaction or arrangement (or instrument provided for thereunder) would be settled by delivery of lock-up
securities, in cash or otherwise.
The restrictions described in the immediately preceding paragraph and contained in the lock-up agreements
between the underwriters and the lock-up parties do not apply, subject in certain cases to various conditions, to
certain transactions, including (a) transfers or disposals of lock-up securities: (i) as a bona fide gift or gifts or
charitable contributions, or for bona fide estate planning purposes, (ii) by will or intestacy or any other testamentary
document, (iii) to any member of the undersigned’s immediate family or to any trust for the direct or indirect benefit
of the lock-up party or any immediate family member, (iv) to a corporation, partnership, limited liability company,
investment fund or other entity (A) of which the lock-up party or its immediate family members are the legal and
beneficial owner of all of the outstanding equity securities or similar interests or (B) controlled by, or under common
control or common investment management with, the lock-up party or its immediate family member, (v) to a
nominee or custodian of a person or entity to whom a disposition or transfer would be permissible under clauses (i)
through (iv), (vi) in the case of a corporation, partnership, limited liability company, trust or other business entity,
(A) to another corporation, partnership, limited liability company, trust or other business entity that is an affiliate of
the lock-up party, or to any investment fund or other entity controlling, controlled by, managing or managed by or
under common control with the lock-up party or its affiliates or (B) as part of a disposition, transfer or distribution to
limited partners, members or stockholders of the lock-up party; (vii) by operation of law, (viii) to us upon death or
disability of the lock-up party, or, if the lock-up party is an employee, upon death, disability or termination of
employment of such employee, (ix) as part of a sale or transfer of lock-up securities acquired in open market
transactions after the completion of this offering, (x) to us in connection with the vesting, settlement or exercise of
restricted stock units, options, warrants or other rights to purchase shares of our Class A common stock (including
“net” or “cashless” exercise), including for the payment of exercise price and tax and remittance payments, or (xi)
pursuant to a bona fide third-party tender offer, merger, consolidation or other similar transaction approved by our
board of directors and made to all shareholders involving a change in control, provided that if such transaction is not
completed, all such lock-up securities would remain subject to the restrictions in the immediately preceding
paragraph; (b) exercise of the options, settlement of RSUs or other equity awards, or the exercise of warrants granted
pursuant to plans described in this prospectus, provided that any lock-up securities received upon such exercise,
vesting or settlement would be subject to restrictions similar to those in the immediately preceding paragraph; (c) the
193
conversion of outstanding preferred stock, warrants to acquire preferred stock, or convertible securities into shares
of our Class A common stock or warrants to acquire shares of our Class A common stock, provided that any
common stock or warrant received upon such conversion would be subject to restrictions similar to those in the
immediately preceding paragraph; and (d) the establishment by lock-up parties of trading plans under Rule 10b5-1
under the Exchange Act, provided that such plan does not provide for the transfer of lock-up securities during the
restricted period.
J.P. Morgan Securities LLC and BofA Securities, Inc., in their sole discretion, may release the securities subject
to any of the lock-up agreements with the underwriters described above, in whole or in part at any time.
Sales, short sales, or hedging transactions involving our equity securities, whether before or after this offering
and whether or not we believe them to be prohibited, could adversely affect the price of our Class A common stock.
We have agreed to indemnify the underwriters against certain liabilities, including liabilities under the
Securities Act of 1933.
We will apply to have our Class A common stock approved for listing/quotation on the NASDAQ under the
symbol “FRVO”.
In connection with this offering, the underwriters may engage in stabilizing transactions, which involves
making bids for, purchasing and selling shares of Class A common stock in the open market for the purpose of
preventing or retarding a decline in the market price of the Class A common stock while this offering is in progress.
These stabilizing transactions may include making short sales of Class A common stock, which involves the sale by
the underwriters of a greater number of shares of Class A common stock than they are required to purchase in this
offering, and purchasing shares of Class A common stock on the open market to cover positions created by short
sales. Short sales may be “covered” shorts, which are short positions in an amount not greater than the underwriters’
option to purchase additional shares referred to above, or may be “naked” shorts, which are short positions in excess
of that amount. The underwriters may close out any covered short position either by exercising their option to
purchase additional shares, in whole or in part, or by purchasing shares in the open market. In making this
determination, the underwriters will consider, among other things, the price of shares available for purchase in the
open market compared to the price at which the underwriters may purchase shares through the option to purchase
additional shares. A naked short position is more likely to be created if the underwriters are concerned that there
may be downward pressure on the price of the Class A common stock in the open market that could adversely affect
investors who purchase in this offering. To the extent that the underwriters create a naked short position, they will
purchase shares in the open market to cover the position.
The underwriters have advised us that, pursuant to Regulation M of the Securities Act of 1933, they may also
engage in other activities that stabilize, maintain or otherwise affect the price of the Class A common stock,
including the imposition of penalty bids. This means that if the representatives of the underwriters purchase Class A
common stock in the open market in stabilizing transactions or to cover short sales, the representatives can require
the underwriters that sold those shares as part of this offering to repay the underwriting discount received by them.
These activities may have the effect of raising or maintaining the market price of the Class A common stock or
preventing or retarding a decline in the market price of the Class A common stock, and, as a result, the price of the
Class A common stock may be higher than the price that otherwise might exist in the open market. If the
underwriters commence these activities, they may discontinue them at any time. The underwriters may carry out
these transactions on the NASDAQ, in the over-the-counter market or otherwise.
Prior to this offering, there has been no public market for our Class A common stock. The initial public offering
price will be determined by negotiations between us and the representatives of the underwriters. In determining the
initial public offering price, we and the representatives of the underwriters expect to consider a number of factors
including:
•the information set forth in this prospectus and otherwise available to the representatives;
•our prospects and the history and prospects for the industry in which we compete;
194
•an assessment of our management;
•our prospects for future earnings;
•the general condition of the securities markets at the time of this offering;
•the recent market prices of, and demand for, publicly traded common stock of generally comparable
companies; and
•other factors deemed relevant by the underwriters and us.
Neither we nor the underwriters can assure investors that an active trading market will develop for our Class A
common stock, or that the shares of Cass A common stock will trade in the public market at or above the initial
public offering price.
Other than in the United States, no action has been taken by us or the underwriters that would permit a public
offering of the securities offered by this prospectus in any jurisdiction where action for that purpose is required. The
securities offered by this prospectus may not be offered or sold, directly or indirectly, nor may this prospectus or any
other offering material or advertisements in connection with the offer and sale of any such securities be distributed
or published in any jurisdiction, except under circumstances that will result in compliance with the applicable rules
and regulations of that jurisdiction. Persons into whose possession this prospectus comes are advised to inform
themselves about and to observe any restrictions relating to the offering and the distribution of this prospectus. This
prospectus does not constitute an offer to sell or a solicitation of an offer to buy any securities offered by this
prospectus in any jurisdiction in which such an offer or a solicitation is unlawful.
Certain of the underwriters and their affiliates may provide from time to time in the future certain commercial
banking, financial advisory, investment banking and other services for us and such affiliates in the ordinary course
of their business, for which they have received and may continue to receive customary fees and commissions. In
addition, from time to time, certain of the underwriters and their affiliates may effect transactions for their own
account or the account of customers, and hold on behalf of themselves or their customers, long or short positions in
our debt or equity securities or loans, and may do so in the future. Bernstein Institutional Services LLC is serving as
selling agent on behalf of SG Americas Securities, LLC in the offering described herein. Bernstein Institutional
Services LLC and certain of its affiliates may provide investor feedback, research, market sounding, block
monitoring, market intelligence, historical market, or trading information and origination and deal execution support
to SG Americas Securities, LLC in connection with this offering and may also provide such services in the general
course of business.
Reserved Share Program
At our request, an affiliate of BofA Securities, Inc., a participating underwriter, has reserved for sale, at the
initial public offering price, up to 5% of the shares of Class A common stock to be issued by us and offered by this
prospectus for sale to some of our directors, officers and employees and related persons. If these persons purchase
reserved shares it will reduce the number of shares available for sale to the general public. Any reserved shares that
are not so purchased will be offered by the underwriters to the general public on the same basis as the other shares
offered by this prospectus.
Selling Restrictions
Other than in the United States, no action has been taken by us or the underwriters that would permit a public
offering of the securities offered by this prospectus in any jurisdiction where action for that purpose is required. The
securities offered by this prospectus may not be offered or sold, directly or indirectly, nor may this prospectus or any
other offering material or advertisements in connection with the offer and sale of any such securities be distributed
or published in any jurisdiction, except under circumstances that will result in compliance with the applicable rules
and regulations of that jurisdiction. Persons into whose possession this prospectus comes are advised to inform
themselves about and to observe any restrictions relating to the offering and the distribution of this prospectus. This
195
prospectus does not constitute an offer to sell or a solicitation of an offer to buy any securities offered by this
prospectus in any jurisdiction in which such an offer or a solicitation is unlawful.
European Economic Area
In relation to each Member State of the European Economic Area (each a “Relevant State”), no Class A
common stock has been offered or will be offered pursuant to the offering to the public in that Relevant State prior
to the publication of a prospectus in relation to the Class A common stock which has been approved by the
competent authority in that Relevant State or, where appropriate, approved in another Relevant State and notified to
the competent authority in that Relevant State, all in accordance with the Prospectus Regulation, except that offers of
Class A common stock may be made to the public in that Relevant State at any time under the following exemptions
under the Prospectus Regulation:
(a)to any legal entity which is a qualified investor as defined under Article 2 of the Prospectus Regulation;
(b)to fewer than 150 natural or legal persons (other than qualified investors as defined under Article 2 of the
Prospectus Regulation), subject to obtaining the prior consent of the representatives for any such offer; or
(c)in any other circumstances falling within Article 1(4) of the Prospectus Regulation,
provided that no such offer of Class A common stock shall require us or any representative to publish a
prospectus pursuant to Article 3 of the Prospectus Regulation or supplement a prospectus pursuant to Article 23 of
the Prospectus Regulation, and each person who initially acquires any Class A common stock or to whom any offer
is made will be deemed to have represented, acknowledged and agreed to and with each of the representatives and us
that it is a “qualified investor” within the meaning of Article 2(e) of the Prospectus Regulation. In the case of any
Class A common stock being offered to a financial intermediary as that term is used in the Prospectus Regulation,
each such financial intermediary will be deemed to have represented, acknowledged and agreed that the Class A
common stock acquired by it in the offer have not been acquired on a non-discretionary basis on behalf of, nor have
they been acquired with a view to their offer or resale to, persons in circumstances which may give rise to an offer of
any Class A common stock to the public other than their offer or resale in a Relevant State to qualified investors as
so defined or in circumstances in which the prior consent of the representatives has been obtained to each such
proposed offer or resale.
For the purposes of this provision, the expression an “offer to the public” in relation to any Class A common
stock in any Relevant State means the communication in any form and by any means of sufficient information on the
terms of the offer and any Class A common stock to be offered so as to enable an investor to decide to purchase or
subscribe for any Class A common stock, and the expression “Prospectus Regulation” means Regulation (EU)
2017/1129.
United Kingdom
No Class A common stock has been offered or will be offered pursuant to the offering to the public in the
United Kingdom prior to the publication of a prospectus in relation to the Class A common stock which (i) has been
approved by the Financial Conduct Authority or (ii) is to be treated as if it had been approved by the Financial
Conduct Authority in accordance with the transitional provisions in Article 74 (transitional provisions) of the
Prospectus Amendment etc. (EU Exit) Regulations 2019/1234, except that the Class A common stock may be
offered to the public in the United Kingdom at any time:
(a)to any legal entity which is a qualified investor as defined under Article 2 of the UK Prospectus Regulation;
(b)to fewer than 150 natural or legal persons (other than qualified investors as defined under Article 2 of the
UK Prospectus Regulation), subject to obtaining the prior consent of the representatives for any such offer;
or
(c)in any other circumstances falling within Section 86 of the Financial Services and Markets Act 2000
(“FSMA”).
196
provided that no such offer of the Class A common stock shall require us or any representative to publish a
prospectus pursuant to Section 85 of the FSMA or supplement a prospectus pursuant to Article 23 of the UK
Prospectus Regulation. For the purposes of this provision, the expression an “offer to the public” in relation to the
Class A common stock in the United Kingdom means the communication in any form and by any means of
sufficient information on the terms of the offer and any Class A common stock to be offered so as to enable an
investor to decide to purchase or subscribe for any Class A common stock and the expression “UK Prospectus
Regulation” means Regulation (EU) 2017/1129 as it forms part of domestic law by virtue of the European Union
(Withdrawal) Act 2018.
In addition, in the United Kingdom, this document is being distributed only to, and is directed only at, and any
offer subsequently made may only be directed at persons who are “qualified investors” (as defined in the Prospectus
Regulation) (i) who have professional experience in matters relating to investments falling within Article 19(5) of
the Financial Services and Markets Act 2000 (Financial Promotion) Order 2005, as amended (the “Order”) and/or
(ii) who are high net worth companies (or persons to whom it may otherwise be lawfully communicated) falling
within Article 49(2)(a) to (d) of the Order (all such persons together being referred to as “relevant persons”) or
otherwise in circumstances which have not resulted and will not result in an offer to the public of the Class A
common stock in the United Kingdom within the meaning of the FSMA.
Any person in the United Kingdom that is not a relevant person should not act or rely on the information
included in this document or use it as basis for taking any action. In the United Kingdom, any investment or
investment activity that this document relates to may be made or taken exclusively by relevant persons.
Canada
The Class A common stock may be sold in Canada only to purchasers purchasing, or deemed to be purchasing,
as principal that are accredited investors, as defined in National Instrument 45-106 Prospectus Exemptions or
subsection 73.3(1) of the Securities Act (Ontario), and are permitted clients, as defined in National Instrument
31-103 Registration Requirements, Exemptions and Ongoing Registrant Obligations. Any resale of the Class A
common stock must be made in accordance with an exemption from, or in a transaction not subject to, the
prospectus requirements of applicable securities laws.
Securities legislation in certain provinces or territories of Canada may provide a purchaser with remedies for
rescission or damages if this prospectus (including any amendment thereto) contains a misrepresentation, provided
that the remedies for rescission or damages are exercised by the purchaser within the time limit prescribed by the
securities legislation of the purchaser’s province or territory. The purchaser should refer to any applicable provisions
of the securities legislation of the purchaser’s province or territory for particulars of these rights or consult with a
legal advisor.
Pursuant to section 3A.3 of National Instrument 33-105 Underwriting Conflicts (NI 33-105), the underwriters
are not required to comply with the disclosure requirements of NI 33-105 regarding underwriter conflicts of interest
in connection with this offering.
Hong Kong
The Class A common stock has not been offered or sold and will not be offered or sold in Hong Kong, by
means of any document, other than (a) to “professional investors” as defined in the Securities and Futures Ordinance
(Cap. 571 of the Laws of Hong Kong) (the “SFO”) of Hong Kong and any rules made thereunder; or (b) in other
circumstances which do not result in the document being a “prospectus” as defined in the Companies (Winding Up
and Miscellaneous Provisions) Ordinance (Cap. 32) of Hong Kong (the “CO”) or which do not constitute an offer to
the public within the meaning of the CO. No advertisement, invitation or document relating to the Class A common
stock has been or may be issued or has been or may be in the possession of any person for the purposes of issue,
whether in Hong Kong or elsewhere, which is directed at, or the contents of which are likely to be accessed or read
by, the public of Hong Kong (except if permitted to do so under the securities laws of Hong Kong) other than with
respect to Class A common stock which are or are intended to be disposed of only to persons outside Hong Kong or
only to “professional investors” as defined in the SFO and any rules made thereunder.
197
Singapore
This prospectus has not been registered as a prospectus with the Monetary Authority of Singapore. Accordingly,
no Class A common stock has been or will be offered or sold and no Class A common stock has been or will be
made the subject of an invitation for subscription or purchase, and no prospectus or any other document or material
in connection with the offer or sale, or invitation for subscription or purchase, of the Class A common stock, has
been or will be circulated or distributed, whether directly or indirectly, to any person in Singapore other than (i) to
an institutional investor (as defined in Section 4A of the Securities and Futures Act 2001 of Singapore, as modified
or amended from time to time (the “SFA”)) pursuant to Section 274 of the SFA or (ii) to an accredited investor (as
defined in Section 4A of the SFA) pursuant to and in accordance with the conditions specified in Section 275 of the
SFA.
Singapore SFA Product Classification — In connection with Section 309B of the SFA and the CMP
Regulations 2018, unless otherwise specified before an offer of Class A common stock, we have determined, and
hereby notify all relevant persons (as defined in Section 309A(1) of the SFA), that the Class A common stock are
“prescribed capital markets products” (as defined in the CMP Regulations 2018) and Excluded Investment Products
(as defined in MAS Notice SFA 04-N12: Notice on the Sale of Investment Products and MAS Notice FAA-N16:
Notice on Recommendations on Investment Products).
Japan
The Class A common stock has not been and will not be registered pursuant to Article 4, Paragraph 1 of the
Financial Instruments and Exchange Act. Accordingly, none of the Class A common stock nor any interest therein
may be offered or sold, directly or indirectly, in Japan or to, or for the benefit of, any “resident” of Japan (which
term as used herein means any person resident in Japan, including any corporation or other entity organized under
the laws of Japan), or to others for re-offering or resale, directly or indirectly, in Japan or to or for the benefit of a
resident of Japan, except pursuant to an exemption from the registration requirements of, and otherwise in
compliance with, the Financial Instruments and Exchange Act and any other applicable laws, regulations and
ministerial guidelines of Japan in effect at the relevant time.
Switzerland
This prospectus does not constitute an offer to the public or a solicitation to purchase or invest in any Class A
common stock. No Class A common stock has been offered or will be offered to the public in Switzerland, except
that offers of Class A common stock may be made to the public in Switzerland at any time under the following
exemptions under the Swiss Financial Services Act (“FinSA”):
(a)to any person which is a professional client as defined under the FinSA;
(b)to fewer than 500 persons (other than professional clients as defined under the FinSA), subject to obtaining
the prior consent of the representatives for any such offer; or
(c)in any other circumstances falling within Article 36 FinSA in connection with Article 44 of the Swiss
Financial Services Ordinance;
provided that no such offer of Class A common stock shall require us or any representative to publish a
prospectus pursuant to Article 35 FinSA.
The Class A common stock has not been and will not be listed or admitted to trading on a trading venue in
Switzerland.
Neither this document nor any other offering or marketing material relating to the Class A common stock
constitutes a prospectus as such term is understood pursuant to the FinSA, and neither this document nor any other
offering or marketing material relating to the Class A common stock may be publicly distributed or otherwise made
publicly available in Switzerland.
198
Dubai International Financial Centre
This prospectus relates to an Exempt Offer in accordance with the Markets Law, DIFC Law No. 1 of 2012, as
amended. This prospectus is intended for distribution only to persons of a type specified in the Markets Law, DIFC
Law No. 1 of 2012, as amended. It must not be delivered to, or relied on by, any other person. The Dubai Financial
Services Authority (DFSA) has no responsibility for reviewing or verifying any documents in connection with
Exempt Offers. The DFSA has not approved this prospectus nor taken steps to verify the information set forth herein
and has no responsibility for this prospectus. The Class A common stock to which this prospectus relates may be
illiquid and/or subject to restrictions on their resale. Prospective purchasers of the Class A common stock offered
should conduct their own due diligence on the Class A common stock. If you do not understand the contents of this
prospectus, you should consult an authorized financial advisor.
In relation to its use in the DIFC, this prospectus is strictly private and confidential and is being distributed to a
limited number of investors and must not be provided to any person other than the original recipient, and may not be
reproduced or used for any other purpose. The interests in the Class A common stock may not be offered or sold
directly or indirectly to the public in the DIFC.
Australia
This prospectus:
(a)does not constitute a disclosure document or a prospectus under Chapter 6D.2 of the Corporations Act 2001
(Cth) (the “Corporations Act”);
(b)has not been, and will not be, lodged with the Australian Securities and Investments Commission (“ASIC”),
as a disclosure document for the purposes of the Corporations Act and does not purport to include the
information required of a disclosure document for the purposes of the Corporations Act; and
(c)may only be provided in Australia to select investors who are able to demonstrate that they fall within one
or more of the categories of investors, available under section 708 of the Corporations Act (“Exempt
Investors”).
The Class A common stock may not be directly or indirectly offered for subscription or purchased or sold, and
no invitations to subscribe for or buy the Class A common stock may be issued, and no draft or definitive offering
memorandum, advertisement or other offering material relating to any Class A common stock may be distributed in
Australia, except where disclosure to investors is not required under Chapter 6D of the Corporations Act or is
otherwise in compliance with all applicable Australian laws and regulations. By submitting an application for the
Class A common stock, you represent and warrant to us that you are an Exempt Investor.
As any offer of Class A common stock under this document will be made without disclosure in Australia under
Chapter 6D.2 of the Corporations Act, the offer of the Class A common stock for resale in Australia within 12
months may, under section 707 of the Corporations Act, require disclosure to investors under Chapter 6D.2 if none
of the exemptions in section 708 applies to that resale. By applying for the Class A common stock, you undertake to
us that you will not, for a period of 12 months from the date of issue of the Class A common stock, offer, transfer,
assign or otherwise alienate those Class A common stock to investors in Australia except in circumstances where
disclosure to investors is not required under Chapter 6D.2 of the Corporations Act or where a compliant disclosure
document is prepared and lodged with ASIC.
Bermuda
The Class A common stock may be offered or sold in Bermuda only in compliance with the provisions of the
Investment Business Act of 2003 of Bermuda which regulates the sale of securities in Bermuda. Additionally, non-
Bermudian persons (including companies) may not carry on or engage in any trade or business in Bermuda unless
such persons are permitted to do so under applicable Bermuda legislation.
199
Brazil
The offer and sale of the Class A common stock has not been and will not be registered with the Brazilian
Securities Commission (Comissão de Valores Mobiliários, or “CVM”) and, therefore, will not be carried out by any
means that would constitute a public offering in Brazil under CVM Resolution No. 160, dated July 13, 2022, as
amended, or unauthorized distribution under Brazilian laws and regulations. The Class A common stock will be
authorized for trading on organized non-Brazilian securities markets and may only be offered to Brazilian
Professional Investors (as defined by applicable CVM regulation), who may only acquire the Class A common stock
through a non-Brazilian account, with settlement outside Brazil in non-Brazilian currency. The trading of the Class
A common stock on regulated securities markets in Brazil is prohibited.
Israel
In the State of Israel this prospectus shall not be regarded as an offer to the public to purchase shares of our
Class A common stock under the Israeli Securities Law, 5728 - 1968, or the Israeli Securities Law, which requires a
prospectus to be published and authorized by the Israel Securities Authority if it complies with certain provisions of
Section 15 of the Israeli Securities Law, including, inter alia, if: (i) the offer is made, distributed or directed to not
more than 35 investors, subject to certain conditions; or (ii) the offer is made, distributed or directed to certain
qualified investors defined in the First Addendum of the Israeli Securities Law, subject to certain conditions. We
have not and will not take any action that would require us to publish a prospectus in accordance with and subject to
the Israeli Securities Law. We have not and will not distribute this prospectus or make, distribute or direct an offer to
subscribe for our shares of Class A common stock to any person within the State of Israel.
200
LEGAL MATTERS
The validity of the shares of common stock offered hereby will be passed upon for us by Latham & Watkins
LLP, Houston, Texas. Certain legal matters related to this offering will be passed upon for the underwriters by
Vinson & Elkins L.L.P., Houston, Texas.
EXPERTS
The financial statements of Fervo Energy Company as of December 31, 2025 and 2024 and for each of the two
years in the period ended December 31, 2025, included in this Prospectus, have been audited by Deloitte & Touche
LLP, an independent registered public accounting firm, as stated in their report. Such financial statements are
included in reliance upon the report of such firm given their authority as experts in accounting and auditing.
Estimates of our heat initially in place and technically recoverable geothermal resources of certain of our
properties as of December 31, 2025 and June 30, 2024, included herein and elsewhere in this prospectus were based
upon reports prepared by independent engineering firm, DeGolyer and MacNaughton, of Dallas, Texas. We have
included these estimates in reliance on the authority of such firm as an expert in such matters.
WHERE YOU CAN FIND MORE INFORMATION
We have filed with the Securities and Exchange Commission a registration statement on Form S-1 under the
Securities Act with respect to the shares of Class A common stock offered hereby. This prospectus, which
constitutes a part of the registration statement, does not contain all of the information set forth in the registration
statement or the exhibits and schedules filed with the registration statement. For further information about us and the
Class A common stock offered hereby, we refer you to the registration statement and the exhibits filed with the
registration statement. Statements contained in this prospectus regarding the contents of any contract or any other
document that is filed as an exhibit to the registration statement are not necessarily complete, and each such
statement is qualified in all respects by reference to the full text of such contract or other document filed as an
exhibit to the registration statement. The SEC also maintains an internet website that contains reports, proxy
statements and other information about registrants, like us, that file electronically with the SEC. The address of that
website is www.sec.gov.
Upon the closing of this offering, we will be required to file periodic reports, proxy statements, and other
information with the SEC pursuant to the Exchange Act. These reports, proxy statements, and other information will
be available on the website of the SEC referred to above.
We also maintain a website at www.fervoenergy.com, through which you may access these materials free of
charge as soon as reasonably practicable after they are electronically filed with, or furnished to, the SEC.
Information contained on, or that can be accessed through, our website is not a part of this prospectus and the
inclusion of our website address in this prospectus is an inactive textual reference only.
Fervo Energy Company and Subsidiaries
Consolidated Financial Statements
As of and for the years ended December 31, 2025 and 2024
F-1
TABLE OF CONTENTS
Page | |
Report of Independent Registered Public Accounting Firm ............................................................................. | |
Consolidated Balance Sheets ....................................................................................................................... | |
Consolidated Statements of Operations ....................................................................................................... | |
Stockholders’ Deficit ................................................................................................................................ | |
Consolidated Statements of Cash Flows ...................................................................................................... | |
Notes to Consolidated Financial Statements ................................................................................................ |
F-2
REPORT OF INDEPENDENT REGISTERED PUBLIC ACCOUNTING FIRM
To the stockholders and the Board of Directors of Fervo Energy Company:
Opinion on the Financial Statements
We have audited the accompanying consolidated balance sheets of Fervo Energy Company and subsidiaries (the
“Company”) as of December 31, 2025 and 2024, the related consolidated statements of operations, redeemable
preferred stock, redeemable noncontrolling interest and stockholders' deficit, and cash flows for each of the two
years in the period ended December 31, 2025, and the related notes and the schedule listed in the Index at Item 16
(collectively referred to as the “financial statements”). In our opinion, the financial statements present fairly, in all
material respects, the financial position of the Company as of December 31, 2025 and 2024, and the results of its
operations and its cash flows for each of the two years in the period ended December 31, 2025, in conformity with
accounting principles generally accepted in the United States of America.
Basis for Opinion
These financial statements are the responsibility of the Company’s management. Our responsibility is to express
an opinion on the Company’s financial statements based on our audits. We are a public accounting firm registered
with the Public Company Accounting Oversight Board (United States) (PCAOB) and are required to be independent
with respect to the Company in accordance with the U.S. federal securities laws and the applicable rules and
regulations of the Securities and Exchange Commission and the PCAOB.
We conducted our audits in accordance with the standards of the PCAOB. Those standards require that we plan
and perform the audit to obtain reasonable assurance about whether the financial statements are free of material
misstatement, whether due to error or fraud. The Company is not required to have, nor were we engaged to perform,
an audit of its internal control over financial reporting. As part of our audits, we are required to obtain an
understanding of internal control over financial reporting but not for the purpose of expressing an opinion on the
effectiveness of the Company’s internal control over financial reporting. Accordingly, we express no such opinion.
Our audits included performing procedures to assess the risks of material misstatement of the financial
statements, whether due to error or fraud, and performing procedures that respond to those risks. Such procedures
included examining, on a test basis, evidence regarding the amounts and disclosures in the financial statements. Our
audits also included evaluating the accounting principles used and significant estimates made by management, as
well as evaluating the overall presentation of the financial statements. We believe that our audits provide a
reasonable basis for our opinion.
/s/ Deloitte & Touche LLP
Houston, Texas
March 30, 2026
We have served as the Company’s auditor since 2023.
F-3
(Dollars and shares in thousands) | As of December 31, | ||
2025 | 2024 | ||
ASSETS | |||
Current assets: | |||
Cash and cash equivalents ................................................................................... | $461,836 | $193,428 | |
Grant receivables ................................................................................................. | 10,580 | 3,952 | |
Prepaid expenses and other .................................................................................. | 9,714 | 7,917 | |
Total current assets .......................................................................................... | 482,130 | 205,297 | |
Deposits ............................................................................................................... | 15,234 | 25,020 | |
Construction-in-process ....................................................................................... | 789,571 | 258,900 | |
Operating leases right of use assets ..................................................................... | 58,713 | 25,672 | |
Restricted cash ..................................................................................................... | 6,000 | 6,000 | |
Other long-term assets .......................................................................................... | 13,520 | 10,410 | |
Total assets ...................................................................................................... | $1,365,168 | $531,299 | |
LIABILITIES AND EQUITY | |||
Current liabilities: | |||
Accounts payable .................................................................................................... | $10,789 | $35,036 | |
Accrued capital expenditures .................................................................................. | 119,303 | 22,869 | |
Operating lease liabilities ....................................................................................... | 4,822 | 1,928 | |
Other current liabilities ........................................................................................... | 16,997 | 6,992 | |
Total current liabilities ...................................................................................... | 151,911 | 66,825 | |
Long-term debt, net of issuance costs .................................................................... | 172,837 | 39,019 | |
Operating lease liabilities ....................................................................................... | 72,639 | 40,851 | |
Other long-term liabilities ...................................................................................... | 11,407 | 299 | |
Total liabilities ................................................................................................ | 408,794 | 146,994 | |
Commitments and Contingencies (Note 21) ........................................................... | |||
Redeemable convertible preferred stock | |||
Redeemable convertible preferred stock, par value $0.0001 per share; 283,546 and 223,458 authorized; 279,995 and 223,458 issued and outstanding as of December 31, 2025 and 2024, respectively ........................................................ | 1,022,942 | 561,500 | |
Redeemable noncontrolling interest | |||
Cape Phase I HoldCo - Redeemable noncontrolling interest ................................ | 102,586 | — | |
Cape Phase I Intermediate HoldCo - Redeemable noncontrolling interest .......... | 77,344 | — | |
Stockholders’ (deficit) equity: | |||
Common stock, par value $0.0001 per share; 358,279 and 280,000 authorized; 13,146 and 12,470 issued and outstanding as of December 31, 2025 and 2024, respectively ............................................................................................ | 1 | 1 | |
Additional paid-in capital .................................................................................... | — | 2,582 | |
Treasury stock, at cost; 375 and 0 shares as of December 31, 2025 and 2024, respectively ...................................................................................................... | (1,960) | — | |
Accumulated deficit ............................................................................................. | (244,539) | (179,778) | |
Total stockholders’ (deficit) equity ................................................................... | (246,498) | (177,195) | |
Total liabilities, redeemable convertible preferred stock, redeemable noncontrolling interests and stockholders’ (deficit) equity ......................... | $1,365,168 | $531,299 | |
The accompanying notes are an integral part of these consolidated financial statements.
F-4
The following table presents the assets and liabilities of consolidated variable interest entities (“VIEs”), which
are included in the Consolidated Balance Sheets above. The assets in the table below may only be used to settle
obligations of consolidated VIEs and are in excess of those obligations. The liabilities in the table below include
liabilities for which creditors do not have recourse to the general credit of the Company. Additionally, the assets and
liabilities in the table below exclude intercompany balances that eliminate upon consolidation.
(Dollars in thousands) | As of December 31, |
2025 | |
Assets of consolidated VIEs, included in total assets above: | |
Cash and cash equivalents ................................................................................................................ | $13,882 |
Prepaid expenses and other .............................................................................................................. | 545 |
Total current assets ........................................................................................................................ | 14,427 |
Deposits ............................................................................................................................................ | 7,158 |
Construction-in-process ................................................................................................................... | 361,213 |
Total assets of consolidated VIEs ............................................................................................... | 382,798 |
Liabilities of consolidated VIEs, included in total liabilities above: | |
Accrued capital expenditures.............................................................................................................. | 17,061 |
Other current liabilities ....................................................................................................................... | 2,970 |
Total current liabilities ..................................................................................................................... | 20,031 |
Long-term debt, net of issuance costs ................................................................................................ | 142,837 |
Other long-term liabilities .................................................................................................................. | 1,468 |
Total liabilities of consolidated VIEs .......................................................................................... | 164,336 |
Total net assets of consolidated VIEs ............................................................................................... | $218,462 |
The accompanying notes are an integral part of these consolidated financial statements.
F-5
(Dollars and shares in thousands except per share amounts) | Year ended December 31, | ||
2025 | 2024 | ||
Revenues ................................................................................................................... | $138 | $199 | |
Costs and expenses: | |||
Operation and maintenance .................................................................................... | 388 | 380 | |
Research and development income, net .................................................................. | (133) | (97) | |
General and administrative expenses ..................................................................... | 38,718 | 34,735 | |
Operating lease expenses ....................................................................................... | 9,681 | 6,895 | |
Depreciation and amortization ................................................................................ | 290 | 124 | |
Operating loss ...................................................................................................... | (48,806) | (41,838) | |
Other income (expense): | |||
Interest income ....................................................................................................... | 4,192 | 1,787 | |
Interest expense ...................................................................................................... | (8,406) | (766) | |
Other non-operating expense .................................................................................. | (4,767) | (237) | |
Loss before income taxes .......................................................................................... | (57,787) | (41,054) | |
Income tax expense ................................................................................................. | (1) | (56) | |
Net loss ..................................................................................................................... | $(57,788) | $(41,110) | |
Net loss per share information: | |||
Net loss ................................................................................................................... | $(57,788) | $(41,110) | |
Less: Remeasurement of redeemable noncontrolling interest ................................. | (12,727) | — | |
Net loss attributable to common shares, basic and diluted .................................... | (70,515) | (41,110) | |
Weighted average shares, basic and diluted ...................................................... | 12,462 | 12,438 | |
Net loss per share attributable to common stockholders, basic and diluted ...... | $(5.66) | $(3.31) | |
The accompanying notes are an integral part of these consolidated financial statements.
F-6
Fervo Energy Company and Subsidiaries
Consolidated Statements of Redeemable Preferred Stock, Redeemable Noncontrolling Interest and Stockholders’ Deficit
Redeemable convertible preferred stock | Redeemable non- controlling interest | Common stock | Treasury stock | Additional paid-in capital | Accumulated deficit | Total stockholders’ deficit | ||||||||||||||||
(Dollars and shares in thousands) | Shares | Amount | Shares | Amount | Shares | Amount | Shares | Amount | ||||||||||||||
Balance at January 1, 2025 ........ | 223,458 | $561,500 | — | $— | 12,470 | $1 | — | $— | $2,582 | $(179,778) | $(177,195) | |||||||||||
Issuance of shares in subsidiaries, net of issuance cost of $973 ........................... | — | — | 12 | 167,203 | — | — | — | — | — | — | — | |||||||||||
Remeasurement of redeemable noncontrolling interests ......... | — | — | — | 12,727 | — | — | — | — | (5,754) | (6,973) | (12,727) | |||||||||||
Issuance of Series E-1 redeemable convertible preferred stock, net of issuance cost of $558 ............. | 56,537 | 461,442 | — | — | — | — | — | — | — | — | — | |||||||||||
Repurchase of shares ................. | — | — | — | — | — | — | 375 | (1,960) | — | — | (1,960) | |||||||||||
Stock-based compensation ........ | — | — | — | — | — | — | — | — | 2,665 | — | 2,665 | |||||||||||
Exercise of stock-based awards by employees and directors ... | — | — | — | — | 676 | — | — | — | 507 | — | 507 | |||||||||||
Net loss ...................................... | — | — | — | — | — | — | — | — | — | (57,788) | (57,788) | |||||||||||
Balance at December 31, 2025 .. | 279,995 | $1,022,942 | 12 | $179,930 | 13,146 | $1 | 375 | $(1,960) | $— | $(244,539) | $(246,498) | |||||||||||
The accompanying notes are an integral part of these consolidated financial statements.
F-7
Fervo Energy Company and Subsidiaries
Consolidated Statements of Redeemable Preferred Stock, Redeemable Noncontrolling Interest and Stockholders’ Deficit
Redeemable convertible preferred stock | Common stock | Additional paid- in capital | Accumulated deficit | Total stockholders’ deficit | ||||||||||
(Dollars and shares in thousands) | Shares | Amount | Shares | Amount | ||||||||||
Balance at January 1, 2024 .................... | 100,768 | $182,257 | 12,341 | $1 | $1,142 | $(138,668) | $(137,525) | |||||||
Issuance of Series D-1 redeemable convertible preferred stock, net of issuance costs of $1,090 ...................... | 92,344 | 232,753 | — | — | — | — | — | |||||||
Conversion of 2023 convertible notes to Series D-2 redeemable convertible preferred stock ..................................... | 4,766 | 12,025 | — | — | — | — | — | |||||||
Issuance of Series D-3 redeemable convertible preferred stock, net of issuance costs of $627 .......................... | 25,468 | 133,873 | — | — | — | — | — | |||||||
Conversion of Simple Agreement for Future Equity (“SAFE”) to Series D-4 redeemable convertible preferred stock ..................................................... | 112 | 592 | — | — | — | — | — | |||||||
Stock-based compensation ..................... | — | — | — | — | 1,370 | — | 1,370 | |||||||
Exercise of stock-based awards by employees and directors ...................... | — | — | 129 | — | 70 | — | 70 | |||||||
Net loss .................................................... | — | — | — | — | — | (41,110) | (41,110) | |||||||
Balance at December 31, 2024 .............. | 223,458 | $561,500 | 12,470 | $1 | $2,582 | $(179,778) | $(177,195) | |||||||
The accompanying notes are an integral part of these consolidated financial statements.
F-8
(Dollars in thousands) | Year ended December 31, | ||
2025 | 2024 | ||
Cash flows from operating activities: | |||
Net loss ..................................................................................................................... | $(57,788) | $(41,110) | |
Adjustments to reconcile net loss to net cash used in operating activities: | |||
Depreciation and amortization ............................................................................. | 290 | 124 | |
Amortization of debt issuance costs ..................................................................... | 1,946 | 689 | |
Stock-based compensation ................................................................................... | 2,665 | 1,370 | |
Non-cash expense related to long-term operating leases ..................................... | 3,973 | 4,091 | |
Non-cash expense related to warrant valuation .................................................... | 3,390 | — | |
Non-cash expense related to derivative valuation ................................................ | 1,680 | — | |
Changes in operating assets and liabilities: | |||
Grant receivables .............................................................................................. | — | (1,764) | |
Prepaid expenses and other .............................................................................. | (1,797) | (7,043) | |
Other ............................................................................................................... | — | (7,430) | |
Deposits ........................................................................................................... | 9,785 | (7,106) | |
Accounts payable ............................................................................................. | (2,857) | 3,503 | |
Other current liabilities ................................................................................... | 6,956 | (72) | |
Net cash used in operating activities .......................................................... | (31,757) | (54,748) | |
Cash flows from investing activities: | |||
Capital expenditures ................................................................................................. | (465,659) | (178,693) | |
Net cash used in investing activities .................................................................... | (465,659) | (178,693) | |
Cash flows from financing activities: | |||
Proceeds from issuance of common stock ................................................................ | 492 | 70 | |
Proceeds from issuance of redeemable convertible preferred stock .......................... | 462,000 | 368,343 | |
Issuance costs related to redeemable convertible preferred stock ............................. | (558) | (1,717) | |
Proceeds from issuance of subsidiary stock .............................................................. | 168,176 | — | |
Issuance costs related to subsidiary stock .................................................................. | (973) | — | |
Proceeds from issuance of warrants .......................................................................... | 6,824 | — | |
Proceeds from issuance of SAFE .............................................................................. | — | 500 | |
Proceeds from long-term debt .................................................................................. | 134,961 | 40,684 | |
Debt issuance costs related to long-term debt .......................................................... | (3,155) | (4,126) | |
Treasury stock purchased .......................................................................................... | (1,943) | — | |
Net cash provided by financing activities ............................................................ | 765,824 | 403,754 | |
Net change in cash and cash equivalents and restricted cash ................................... | 268,408 | 170,313 | |
Cash and cash equivalents and restricted cash at beginning of period ..................... | 199,428 | 29,115 | |
Cash and cash equivalents and restricted cash at end of period ............................... | $467,836 | $199,428 | |
Supplemental disclosure of cash flow information: | |||
Accrued capital expenditures (at end of period) ....................................................... | 129,051 | 54,146 | |
Adjustment of redeemable noncontrolling interest .................................................... | 12,727 | — | |
Cash paid for interest, net of amounts capitalized ..................................................... | 8,266 | — | |
Cash paid for taxes .................................................................................................... | 52 | 2 | |
Non-cash activity related to conversion of convertible note .................................... | — | 12,025 | |
Non-cash activity related to conversion of SAFE ..................................................... | — | 592 | |
The accompanying notes are an integral part of these consolidated financial statements.
F-9
NOTE 1 – NATURE OF BUSINESS
Fervo Energy Company (the “Company” or “Fervo”) is a Delaware Corporation formed on May 27, 2017, to
commercialize technology to own, develop, and operate geothermal assets. Fervo’s innovations include technologies
such as advanced computational models, horizontal drilling, and distributed fiber optic sensing that were developed
with various partners to increase the productivity and lifetime of geothermal wells. The Company’s geographical
area of operation is in the western region of the United States.
The U.S. federal government encourages production of electricity from geothermal resources. The Company
requested and received grants for research and development and project development from the Department of
Energy (“DOE”).
As of December 31, 2025, the Company has not yet commenced principal operations. The Company’s activities
to date have been primarily focused on technological development, capital raising, and the establishment of
geothermal production capabilities.
NOTE 2 – SIGNIFICANT ACCOUNTING POLICIES
Basis of Presentation
The consolidated financial statements are prepared in accordance with accounting principles generally accepted
in the United States of America (“U.S. GAAP”) and include the accounts of the Company and of all majority-owned
subsidiaries in which the Company exercises control over operating and financial policies. Intercompany accounts
and transactions have been eliminated in consolidation. Certain amounts reported in the prior year have been
reclassified to conform to the current year’s presentation.
Use of Estimates in Preparation of Consolidated Financial Statements
The preparation of consolidated financial statements in conformity with U.S. GAAP requires management to
make estimates and assumptions that affect the reported amounts of assets and liabilities and the disclosure of
contingent assets and liabilities at the dates of such consolidated financial statements and the reported amounts of
revenues and expenses during the reporting periods. Actual results could differ from those estimates, and such
differences could be material to the Company’s consolidated financial statements.
The most significant estimates and assumptions affecting the Company’s consolidated financial statements
relate to the evaluation of long‑lived assets for impairment, asset retirement obligations at initial recognition,
valuation of warrants, accounting for investments and joint ventures, determination of the incremental borrowing
rate (“IBR”) used to measure lease liabilities, and the valuation of stock‑based compensation awards. These
estimates require management to make judgments regarding future cash flows, discount rates, volatility assumptions,
credit risk, and other market‑based and entity‑specific inputs.
Comprehensive Loss
The Company does not have any other comprehensive income or loss for the years ended December 31, 2025
and 2024. As such, net loss and comprehensive loss are the same for the periods presented.
Cash and Cash Equivalents and Restricted Cash
The Company considers all highly liquid instruments, with an original maturity of three months or less, to be
cash equivalents. Under the terms of certain contracts, the Company is required to maintain an escrow account that
serves as a development security and is classified as restricted cash.
F-10
The following table represents the Company’s cash and cash equivalents and restricted cash:
(Dollars in thousands) | As of December 31, | ||
2025 | 2024 | ||
Cash ................................................................................................................... | $19,844 | $7,511 | |
Money market .................................................................................................... | 441,992 | 185,917 | |
Restricted cash ................................................................................................... | 6,000 | 6,000 | |
Total cash and cash equivalents and restricted cash .......................................... | $467,836 | $199,428 | |
Deposits and Other
Deposits consist primarily of performance bonds for completion of projects and subsequent delivery of product
according to the contractual terms. As of December 31, 2025 and 2024 deposits totaled $15.2 million and $25.0
million, respectively. As of December 31, 2025 and 2024, prepaid annual service fees paid to a service provider
totaled $7.5 million and $7.5 million, respectively. As of December 31, 2025, $2.0 million is included in prepaid
expenses and other and $5.5 million is included in other long-term assets, whereas as of December 31, 2024, the
$7.5 million is included in other long-term assets.
Exploration and Development Costs
The Company capitalizes costs incurred in connection with the exploration and development of geothermal
resources once it acquires land rights to the geothermal resource. Prior to acquiring land rights, the Company makes
an initial assessment that an economically feasible geothermal reservoir is probable on that land. The Company
determines the economic feasibility of potential geothermal resources, with all available data and external
assessments. Costs associated with the initial assessment are expensed and included in research and development
expenses in the Consolidated Statements of Operations.
The Company obtains the right to conduct geothermal development and operations on land owned by the
Bureau of Land Management (“BLM”), various states or with private parties. The annual land lease payments made
during the exploration, development and construction phase are reflected as operating lease expenses in the
Consolidated Statements of Operations.
Following the acquisition of land rights to the potential geothermal resource, the Company conducts further
studies and surveys, including water and soil analyses, among others. The Company then initiates a suite of
geophysical surveys to assess the resource and determine drilling locations. If the results of these activities support
the initial assessment of the feasibility of the geothermal resource, the Company then proceeds to exploratory
drilling and other related activities which may include drilling of temperature gradient holes, drilling of slim holes,
building access roads to drilling locations, drilling full size production and/or injection wells and flow tests. Costs
associated with these activities and other directly attributable costs, including permitting costs, are capitalized. If the
Company concludes that a geothermal resource will not support commercial operations, capitalized costs are
expensed in the period such determination is made.
All exploration and development costs that are being capitalized will be depreciated over their estimated useful
lives when the related geothermal well is substantially complete and ready for use. A geothermal well is
substantially complete and ready for use when electricity generation commences.
Property, Plant and Equipment, Net
Construction-in-process represents the capitalized costs related to power plants. All costs associated with the
acquisition, development and construction of power plants are capitalized. Major improvements will be capitalized
and repairs and maintenance will be expensed. Property, plant and equipment for power plants will be stated at cost,
net of accumulated depreciation.
Other property, plant and equipment, net included within other long-term assets was $3.7 million and $0.8
million as of December 31, 2025 and 2024, respectively, and consist of leasehold improvements, equipment, and
F-11
office equipment and furniture. Other property, plant and equipment are depreciated using the straight-line method
over the following estimated useful lives of the assets:
Useful lives | |
Leasehold improvements ...................................................................................................................... | 5 years |
Equipment ............................................................................................................................................. | 15 years |
Office equipment .................................................................................................................................. | 5 years |
Office furniture ..................................................................................................................................... | 7 years |
Capitalized Interest Costs
Interest incurred during the construction period of certain property, plant and equipment is capitalized until the
underlying assets are placed in service, at which time amortization of the capitalized interest begins, straight-line,
over the estimated useful lives of the related assets. Capitalized interest was $8.5 million and $0.9 million for the
years ended December 31, 2025 and 2024, respectively.
Asset Retirement Obligations
The Company accounts for asset retirement obligations (“ARO”) in accordance with Accounting Standards
Codification (“ASC”) 410-20, Asset Retirement and Environmental Obligations. The Company’s AROs primarily
relate to the future costs of plugging and abandoning geothermal wells and restoring the land to its original condition
as required by applicable laws and regulations.
The Company recognizes the fair value of a liability for an ARO in the period in which it is incurred, if a
reasonable estimate of fair value can be made. The ARO liability represents the present value of the estimated future
costs to retire the asset, discounted using the Company’s credit-adjusted risk-free rate at the time the obligation is
incurred.
A corresponding amount equal to the ARO liability is capitalized as part of the carrying amount of the related
long-lived asset and depreciated on a straight-line basis over the useful life of the asset. The ARO liability is
accreted each period to reflect the passage of time, with accretion expense recognized as a component of operating
expense. The ARO liability is included within Other long-term liabilities on the Consolidated Balance Sheets.
Revisions to estimated future cash flows or timing are recognized as increases or decreases to both the ARO
liability and the related asset. The costs are ultimately settled when the wells and facilities are plugged, dismantled,
and the site is restored in accordance with regulatory requirements.
Impairment of Long-lived Assets
The Company evaluates long-lived assets, such as construction-in-process and right-of-use (“ROU”) assets for
impairment whenever events or changes in circumstances indicate that the carrying amount of an asset may not be
recoverable. Factors which could trigger an impairment include, a significant decrease in the market price, a change
in the extent or manner in which a long-lived asset is being used or in its physical condition, adverse change in legal
factors or in the business climate, significant increase in costs necessary to complete a project, current period
operating or cash flow loss combined with a history of operating or cash flow losses, or when it concludes that it is
more likely than not that an asset will be disposed of or sold. No impairment of long-lived assets was recorded
during the years ended December 31, 2025 and 2024.
Leases
The Company determines if an arrangement contains a lease at inception. Operating leases are recorded on the
Consolidated Balance Sheets as ROU assets and lease liabilities. Lease liabilities are measured at the present value
of the remaining lease payments, discounted using the Company’s IBR at lease commencement, unless the rate
implicit in the lease is readily determinable.
F-12
ROU assets are initially measured based on the lease liability, adjusted for any prepaid or upfront bonus
payments, lease incentives received, and initial direct costs incurred. In the initial measurement, the Company
recognizes payments associated with renewal options when it is reasonably certain that the Company will exercise
that option. Lease expenses for operating leases are recognized on a straight-line basis over the lease term.
Certain of the Company’s geothermal leases require production-based royalty payments, which may be
calculated as a percentage of the gross proceeds earned by the Company over the lease term. Royalty rates vary
based on several factors, including the type of lessor (e.g., federal, state or private) and the progression of the lease
term. These royalty payments are considered variable lease payments that do not depend on an index or a rate.
Accordingly, they are excluded from the initial measurement of the lease liability and are recognized as a variable
lease expense as incurred.
The Company elected the practical expedient to not separate lease and non-lease components for all classes of
underlying assets. Additionally, the Company has elected not to recognize leases with an original term of 12 months
or less on the Consolidated Balance Sheets.
Research and Development
Research and development costs incurred by the Company for the development of existing and new geothermal
and related technologies are expensed as incurred. Gross research and development expense totaled less than $0.1
million and $2.6 million for the years ended December 31, 2025 and 2024, respectively. The 2025 expense primarily
related to the Direct Air Capture (“DAC”) Hub, while the 2024 expense was primarily associated with Project Red, a
commercial pilot developed in partnership with NGP Blue Mountain I, LLC (“NGP”).
Per the agreement, the Company provided the design, engineering, construction and installation of its
proprietary geothermal well and reservoir engineering solutions (the “System”). In November 2023, the System
began flowing commercial quantities of geothermal energy to NGP during the Initial Production period and the
Commercial Operation date was declared on April 30, 2024. Upon achieving commercial operation, the Company
began providing non-routine maintenance of the System.
Stock-based Compensation
Stock-based compensation expense related to stock-based awards is recognized based on the fair value of the
awards granted. The fair value of each stock option award is estimated on the grant date utilizing the Black-Scholes
option-pricing model. The stock options issued are equity classified. The related stock-based compensation expense
is recognized on a straight-line basis over the requisite service period of the awards, and there are no additional
conditions for vesting other than service conditions. Forfeitures are accounted for as they occur.
The Black-Scholes option-pricing model requires the input of highly subjective assumptions, including the fair
value of the underlying common stock, the expected term of the stock option, the expected volatility of the price of
the Company’s common stock, risk-free interest rates, and the expected dividend yield of common stock. The
assumptions used to determine the fair value of the option awards represent management’s best estimates. These
estimates involve inherent uncertainties and the application of management’s judgment.
Net Income (Loss) Per Share
The Company follows the two-class method when computing net income (loss) per share. The two-class method
requires income available to common shareholders for the period to be allocated between common and participating
securities based upon their respective rights to receive distributions as if all income for the period had been
distributed. Preferred shares are participating securities because they are entitled to undistributed earnings based on
the liquidation preferences. Preferred shares do not have the contractual obligation to share in the losses of the
Company on a basis that is objectively determinable. Therefore, they are excluded from the allocation of
undistributed losses in determining net loss per share.
Basic net income (loss) per share is computed by dividing the net income (loss) attributable to the common
shareholders by the weighted average number of common shares outstanding during the period. Diluted net income
F-13
(loss) is computed by adjusting net income (loss) to reallocate undistributed earnings based on the potential impact
of dilutive securities. Diluted net income (loss) per share is computed by dividing the diluted net income (loss) by
the weighted average number of common shares outstanding during the period, including potential dilutive common
shares assuming the dilutive effect of common shares equivalents.
Fair Value
The fair value measurement guidance clarifies that fair value represents the amount that would be received upon
selling an asset or paid upon transferring a liability in an orderly transaction between market participants at the
measurement date. As such, fair value is a market-based measurement that should be determined based on
assumptions that market participants would use in pricing an asset or liability. The guidance establishes a fair value
hierarchy that prioritizes the inputs to valuation techniques used to measure fair value. The hierarchy gives the
highest priority to unadjusted quoted prices in active markets for identical assets or liabilities (Level 1
measurements) and the lowest priority to unobservable inputs (Level 3 measurements). The three levels of the fair
value hierarchy under the fair value measurement guidance are described below:
Level 1 — unadjusted observable inputs that reflect quoted prices for identical assets or liabilities in active
markets;
Level 2 — inputs other than quoted prices included in Level 1 that are observable for the asset or liability either
directly or indirectly;
Level 3 — unobservable inputs.
The carrying value of the Company’s cash and cash equivalents, grants receivable, prepaid expenses and other,
accounts payable, accrued capital expenditures, operating lease liabilities and other current liabilities reported on the
Consolidated Balance Sheets approximate fair value due to the short-term nature of the instruments. The Company’s
preferred stock warrants (“Warrants”) are measured at fair value on a recurring basis and are classified within Level
3 of the fair value hierarchy due to the use of significant unobservable inputs in the valuation model. The carrying
value of non-financial assets, such as construction-in-progress, is adjusted to fair value on a non-recurring basis
when they are impaired. During the years ended December 31, 2025 and 2024, there were no transfers between the
fair value hierarchy levels.
Income Taxes
The Company files a corporate income tax return. Deferred taxes are provided on a liability method whereby
deferred tax assets are recognized for deductible temporary differences and operating losses and tax credit
carryforwards and deferred tax liabilities are recognized for taxable temporary differences. Temporary differences
are the differences between the reported amounts of assets and liabilities and their tax bases. Deferred tax assets are
reduced by a valuation allowance when, in the opinion of management, it is “more likely than not” that some portion
or all of the deferred tax assets will not be realized. Deferred tax assets and liabilities are adjusted for the effects of
changes in tax laws and rates on the date of enactment.
The Company reviews its tax benefits claimed or expected to be claimed on its tax return for uncertainty. The
Company recognizes a tax benefit from an uncertain tax position only if it is “more likely than not” that the tax
position will be sustained on examination by taxing authorities, based on the technical merits of the position. The tax
benefits recognized in the consolidated financial statements from such a position are measured based on the largest
benefit that has a greater than 50 percent likelihood of being realized upon ultimate settlement.
The Company has historically and continues to incur research and development costs. These costs have
historically been capitalized and amortized for tax purposes according to Section 174 beginning in tax year 2022 to
2024. Beginning in 2025, the Company can either expense immediately research and development costs incurred in
the United States or capitalize and amortize over a period of fifteen years after the passage of the One Big Beautiful
Bill (“OBBB”). In addition, the Company is still considered to be in a start-up phase. Startup costs are capitalized
and amortized over a period of 15 years in accordance with Section 195.
F-14
Government Grants
The Company receives funding from the DOE, primarily through cost-share cooperative agreements, research
grants, and development contracts that support the advancement of enhanced geothermal system (“EGS”)
technologies and related infrastructure.
The Company recognizes grant proceeds when the qualifying expenditures or performance conditions specified
in the grant agreement have been incurred. Grant receivables are recorded when the Company has satisfied the
applicable grant conditions and management determines that collection from the granting agency is probable based
on the executed agreement and the Company’s compliance with the grant requirements.
Reimbursement-type awards (DOE cost-share agreements) are recognized on a systematic basis over the periods
in which the related qualifying expenditures are incurred. Grant proceeds that offset capitalized project costs are
recorded as a reduction of the construction-in-process on the Consolidated Balance Sheets. Grant proceeds related to
research and development offset the research and development costs in the Consolidated Statements of Operations.
Debt Issuance Costs
Debt issuance costs for term loans are presented as a direct deduction from the carrying amount of the related
debt and are amortized over the life of the respective borrowing in the Consolidated Statements of Operations in
interest expense. As of December 31, 2025 and 2024, the Company had $2.8 million and $1.6 million, respectively,
in unamortized debt issuance costs.
Debt issuance costs for credit facility agreements are treated as an asset and amortized over the term of the loan
in the Consolidated Statements of Operations in interest expense. As of December 31, 2025 and 2024, the Company
had $2.3 million and $2.1 million, respectively, in unamortized debt issuance costs.
Power Purchase Agreements
The Company’s business model focuses on developing, constructing, and operating geothermal power
generation facilities that provide fixed-price, clean baseload electricity to utilities and other creditworthy off-takers.
The Company expects to generate revenue primarily from the sale of bundled capacity, power, and related attributes
under long-term Power Purchase Agreements (“PPA”). Pricing under these PPAs is generally fixed for the duration
of the contract, although some of the Company’s PPAs may have price escalators based on an index or other rates
specified in the applicable PPA. The Company’s current PPAs have an initial term of 15 years. The Company’s
PPAs are expected to go into effect starting in 2026.
The current portfolio of PPAs is associated with two separate facilities: a geothermal project located in Beaver
County, Utah, and a geothermal project located in Churchill County, Nevada. These facilities are part of larger
geothermal developments and may be expanded over time. The current facilities are both integrated into the
California Independent System Operator (“CAISO”) grid network via Dynamic Resource-Specific System Resource
designations. The Company will manage energy scheduling and CAISO market participation.
Management assesses each PPA for the existence of leases under ASC Topic 842, Leases (“ASC 842”). If a
PPA is or contains a lease, it will be accounted for under ASC 842. If not a lease, Management assesses each PPA
under ASC 815, Derivatives and Hedging (“ASC 815”). If a PPA is or contains a derivative, it will be accounted for
under ASC 815. If a PPA is neither a lease nor a derivative, Management will account for the contract as a contract
with a customer under ASC Topic 606, Revenue from Contracts with Customers (“ASC 606”). No PPAs have been
determined to be or contain a lease. While PPAs may meet the definition of a derivative under ASC 815, the
Company has elected to apply the Normal Purchase Normal Sale scope exception to the power sales given that they
represent sales of power made in the ordinary course of business. Therefore, the PPAs are accounted for as
executory contracts and will be recognized under ASC 606 at the point in time sales commence.
Revenue
During the years ended December 31, 2025 and 2024, revenue includes ancillary fees associated with rights to
geothermal production. These revenues are recognized as performance obligations are met. These revenues are not
F-15
material to the consolidated financial statements. The Company has not yet commenced large-scale commercial
electricity generation, and the Company has not generated revenue from utility-scale geothermal power sales or
PPAs during the periods presented.
Variable Interest Entities
The Company evaluates its involvement with legal entities to determine whether they are VIEs under ASC 810,
Consolidation (“ASC 810”). An entity is a VIE when it lacks sufficient equity at risk or when the equity holders lack
the characteristics of a controlling financial interest. When the Company has a variable interest in a VIE, it assesses
whether it is the primary beneficiary, which requires both (i) the power to direct the activities that most significantly
affect the VIE’s economic performance and (ii) the obligation to absorb losses or the right to receive benefits that
could be significant.
Determining whether the Company is the primary beneficiary requires judgment and may change as
arrangements evolve. The Company performs an ongoing reassessment of its variable interests and primary
beneficiary status whenever reconsideration events occur, including changes in ownership, governance, contractual
arrangements, financing structures, or other relevant facts and circumstances.
As part of its geothermal development activities, the Company may enter into project‑level entities, financing
structures, or partnership arrangements that give rise to variable interests. Where the Company is the primary
beneficiary, the VIE is consolidated and its assets, liabilities, and results are included in the consolidated financial
statements; noncontrolling interest may be recorded if the Company does not own 100% of the outstanding equity of
the VIE. Where the Company is not the primary beneficiary, its interests are accounted for under the equity method
or other applicable guidance, and the Company’s exposure to loss is limited to its investment and any contractual
support. As of December 31, 2025, all VIEs are consolidated by the Company.
Warrants Liability
The Company determines the accounting classification of warrants it issues as either liability or equity classified
by first assessing whether the warrants meet liability classification in accordance with ASC 480, Distinguishing
Liabilities from Equity (“ASC 480”), then in accordance with ASC 815. Under ASC 480, warrants are considered
liability classified if the warrants are mandatorily redeemable, obligate the Company to settle the warrants or the
underlying shares by paying cash or other assets, or warrants that must or may require settlement by issuing variable
number of shares. If warrants do not meet liability classification under ASC 480, the Company assesses the
requirements under ASC 815, which states that contracts that require or may require the issuer to settle the contract
for cash are liabilities recorded at fair value, irrespective of the likelihood of the transaction occurring that triggers
the net cash settlement feature. If the warrants do not require liability classification under ASC 815, and in order to
conclude equity classification, the Company also assesses whether the warrants are indexed to its common stock and
whether the warrants are classified as equity under ASC 815 or other applicable GAAP. After all relevant
assessments, the Company concludes whether the warrants are classified as liability or equity. Liability classified
warrants require fair value accounting at issuance and subsequent to initial issuance with all changes in fair value
after the issuance date recorded in the Consolidated Statements of Operations. Liability classified warrants are
included within Other long-term liabilities on the Consolidated Balance Sheets. Equity classified warrants only
require fair value accounting at issuance with no changes recognized subsequent to the issuance date. The Company
does not currently have any equity classified warrants.
Recent Accounting Pronouncements
The Company continuously monitors and evaluates new accounting pronouncements issued by the Financial
Accounting Standards Board to determine their potential impact on the Company’s consolidated financial statements
and related disclosures, with particular focus on standards that may affect the Company’s unique geothermal
development activities, long-term asset accounting, and revenue recognition as it scales its commercial operations.
As of December 31, 2025 and 2024, the Company evaluated several recently issued accounting standards, including
the following that may have implications on its financial reporting, as discussed below.
F-16
The Company is an emerging growth company (“EGC”) as defined in the Jumpstart Our Business Startups Act
of 2012 (“JOBS Act”). As an EGC, the Company has elected to use the extended transition period for adopting new
or revised accounting standards that have different effective dates for public and private companies until the earlier
of the date that it (i) is no longer an emerging growth company or (ii) affirmatively and irrevocably opts out of the
extended transition period provided in the JOBS Act, while also maintaining the ability to early adopt certain
accounting pronouncements.
Accounting Standards Recently Implemented
In December 2023, the Financial Accounting Standards Board (“FASB”) issued ASU 2023-09, Income Taxes
(Topic 740), “Improvements to Income Tax Disclosures,” which establishes new income tax disclosure requirements
in addition to modifying and eliminating certain existing requirements. Under the new guidance, entities must
consistently categorize and provide greater disaggregation of information in the rate reconciliation. They must also
further disaggregate income taxes paid. The standard is intended to benefit stockholders by providing more detailed
income tax disclosures that would be useful in making capital allocation decisions. The guidance applies to all
entities subject to income taxes and is effective for annual periods beginning after December 15, 2024. The guidance
will be applied on a prospective basis with the option to apply the standard retrospectively. Early adoption is
permitted. The Company adopted this standard on a prospective basis for the year ended December 31, 2025. See
Note 18 – Income Taxes for additional information.
In November 2023, the Financial Accounting Standards Board (“FASB”) issued ASU 2023-07, Segment
Reporting (Topic 280), “Improvements to Reportable Segment Disclosures,” which requires disclosure of significant
segment expenses regularly provided to the chief operating decision maker (“CODM”) and included within each
reported measure of segment profit or loss. All disclosure requirements in this standard are required for entities with
a single reportable segment. The standard is effective for fiscal years beginning after December 15, 2023, and
interim periods within fiscal years beginning after December 15, 2024. Early adoption is permitted. The
amendments should be applied on a retrospective basis to all periods presented. The Company adopted the standard
in the year ended December 31, 2024. The adoption of ASU 2023-07 resulted in an additional segment reporting
disclosure in the Company’s consolidated financial statements, with no impact to the Company’s financial position
or results of operations. See Note 15 – Segment Information for additional information.
Accounting Standards to be Implemented
In December 2025, the FASB issued ASU 2025-11, “Interim Reporting (Topic 270) Narrow-Scope
Improvements”, which clarifies interim disclosure requirements and the applicability of Topic 270. The objective of
the update is to provide clarity about current interim requirements. The amendments in this update also include a
disclosure principle that requires entities to disclose events since the end of the last annual reporting period that have
a material impact on the entity. The amendments in this ASU are required to be adopted for interim reporting
periods within annual reporting periods beginning after December 15, 2027. Early adoption is permitted. The
Company is evaluating the impact of this guidance on its consolidated financial statements and related disclosures.
In December 2025, the FASB issued ASU 2025-10, “Government Grants (Topic 832): Accounting for
Government Grants Received by Business Entities”, which establishes authoritative guidance on the accounting for
government grants received by business entities. This update will be effective for annual reporting periods beginning
after December 15, 2028, and interim reporting periods within those annual reporting periods. Early adoption
permitted. The Company is evaluating the impact of this guidance on its consolidated financial statements and
related disclosures.
In November 2024, the FASB issued ASU 2024-03, “Income Statement—Reporting Comprehensive Income—
Expense Disaggregation Disclosures (Subtopic 220-40): Disaggregation of Income Statement Expenses”, which
requires disclosure of additional information about certain income statement expense categories. The new standard
should be applied prospectively with retrospective application and early adoption permitted. In January 2025, the
FASB issued ASU 2025-01, “Income Statement - Reporting Comprehensive Income - Expense Disaggregation
Disclosures (Subtopic 220-40).” This update amends the effective date of ASU 2024-03 to clarify that all public
business entities are required to adopt the guidance in annual reporting periods beginning after December 15, 2026,
F-17
and interim periods within annual reporting periods beginning after December 15, 2027. The Company is evaluating
the impact of this guidance on its consolidated financial statements and related disclosures.
Recent Legislation Matters
On July 4, 2025, the OBBB was signed into law, repealing and phasing out certain energy tax credits from the
Inflation Reduction Act of 2022 (“IRA”). The OBBB modifies the qualifications for Production Tax Credits
(“PTC”) and Investment Tax Credits (“ITC”), affecting eligibility based on construction timelines and foreign
involvement. It also allows full depreciation of certain geothermal power plant costs in the service year. When
claiming tax credits, ITCs reduce the depreciation tax basis by half the credit amount, while PTCs do not. The
Company is continuing to evaluate the effect of the OBBB on its consolidated financial statements and related
disclosures. The ultimate impact will depend on the Company’s project construction timelines, tax credit elections,
and forthcoming interpretive guidance, and therefore cannot be reasonably estimated as of December 31, 2025.
NOTE 3 – DEBT AND OFF-BALANCE SHEET ARRANGEMENTS
Long-term debt, net of issuance costs, consisted of the following:
(Dollars in thousands) | As of December 31, | ||
2025 | 2024 | ||
Long-term debt | |||
XRC Term Loan ............................................................................................ | $145,600 | $40,639 | |
Mercuria ........................................................................................................ | 30,000 | — | |
Total principal due for long-term debt ........................................................ | 175,600 | 40,639 | |
Less: Unamortized debt issuance cost .......................................................... | (2,763) | (1,620) | |
Total long-term debt, net of issuance costs .................................................... | $172,837 | $39,019 | |
XRC Term Loan Agreement
In August 2024, Cape Generating Station 3 LLC and Cape Generating Station 5 LLC, wholly owned
subsidiaries of the Company, issued two promissory notes under a loan agreement with XRL ALC, LLC (“XRC”).
Tranche A includes notes of up to $64.0 million and Tranche B includes notes of up to $36.0 million. In May 2025,
Cape Generating Station 3 LLC and Cape Generating Station 5 LLC entered into the First Amendment to the credit
agreement. In connection with the amendment, the Company issued an additional promissory note of $45.6 million
under Tranche C. In September 2025, the Company entered into a Second Loan Modification Agreement with XRC,
which included updates to certain terms of the credit agreement, including provisions related to the prepayment of
the loan. Under the modified terms, the Company is required to pay a prepayment premium upon repayment of the
outstanding borrowings under the facility. The Company entered into these agreements to fund the construction of
subsurface and surface facilities to be utilized in the generation of geothermal power. The maturity date of Tranche
A, Tranche B, and Tranche C of the term loan is August 13, 2027. Upon lender approval, the Company may elect to
extend the maturity date for two additional one-year periods. Interest charges are accrued and are indexed to the
prime rate, subject to a spread of 3.5% and a floor of 11%. As of December 31, 2025 and 2024, $145.6 million and
$40.6 million, respectively, was drawn which is offset by the remaining unamortized debt issuance costs of $2.8
million and $1.6 million, respectively. Total debt issuance costs incurred totaled $1.9 million and $1.8 million in
connection with the note for the years ended December 31, 2025 and 2024, respectively. The estimated fair value as
of December 31, 2025 and 2024 was $140.7 million and $43.2 million, respectively using a discounted cash flow
model based on current market interest rates for similar instruments, which is classified as Level 2 in the fair value
hierarchy. The XRC Term Loan Agreement includes customary affirmative and negative covenants, including
payment and covenant events of default. These covenants restrict the Company’s ability to incur or assume
additional indebtedness, grant or assume liens, engage in fundamental changes such as mergers, consolidations,
liquidations, or the sale of substantially all assets, make restricted payments, modify project documents in ways
materially adverse to the lender, engage in transactions with affiliates, or enter into restrictive agreements.
Separately, if an event of default occurs, the lender may cease making any further loan advances and/or declare all
F-18
outstanding obligations immediately due and payable. As of December 31, 2025 and 2024, the Company was in
compliance with all covenants.
Under the terms of the XRC Loan Agreement, the promissory notes are secured on a first-priority basis by a lien
on all the assets of Cape Generating Station 3 LLC and Cape Generating Station 5 LLC.
Mercuria Credit Agreement and Letter of Credit Facility Agreement
In November 2024, Fervo HoldCo LLC, a wholly owned subsidiary of the Company, entered into a
$40.0 million credit agreement and $80.0 million letter of credit facility agreement with Mercuria Energy Trading
SA (“Mercuria”). In May 2025, Fervo HoldCo LLC entered into the First Amendment to the credit agreement,
which increased the term loan commitment by $60.0 million, resulting in total borrowing capacity of $100.0 million.
The Company entered into the credit agreement to fund the development, construction and operation of geothermal
energy, transmission and delivery of renewable power. Due to the Company’s early development stage, additional
credit support is required to support the execution of various agreements required for the Company’s operations,
which is fulfilled through the letter of credit facility. This agreement allows the lender to issue letters of credit on the
Company’s behalf, guaranteeing payment if Fervo were unable to fulfill its payment obligations under these
agreements. The maturity date of the credit agreement is November 20, 2027. Interest charges on the credit
agreement accrue at the secured overnight financing rate (“SOFR”) plus a margin of 0.1% and an additional spread
of 7.5%.
As of December 31, 2025 and 2024, the Company had $30.0 million and no borrowing outstanding under the
credit agreement, respectively, and $35.5 million and $3.6 million outstanding under the letter of credit facility
agreement, respectively. In connection with the credit facility, the Company incurred debt issuance costs of $1.2
million and $2.2 million during the years ended December 31, 2025 and 2024, respectively. These costs are recorded
in other long-term assets on the Consolidated Balance Sheets and are amortized over the term of the credit
agreement.
The Mercuria Credit Agreement as well as the Letter of Credit Facility described below include various
affirmative and negative covenants including restrictions on the Company’s ability to incur additional indebtedness,
grant liens, make restricted payments or investments beyond those existing at the effective date, engage in
fundamental changes such as mergers or asset sales, conduct affiliate transactions, enter swap agreements outside
ordinary business, modify organizational documents adversely to lenders, or change the Company’s business nature.
Additionally, the Mercuria Credit Agreement requires compliance with financial covenants including (i) a net asset
to total exposure of not less than 2.5, (ii) a financial total debt to equity capital contributions not to exceed 0.6, and
(iii) total exposure to total consolidated capital not to exceed 0.4. As of December 31, 2025 and 2024, the Company
was in compliance with all covenants.
Surety Bond Arrangements
Fervo routinely arranges for the issuance of various forms of surety bonds to third parties in support of its
subsidiaries’ contractual arrangements for power purchase agreements, land development agreements, and contracts
associated with development and construction of its power plants. In the event a subsidiary were to fail to perform
its obligations under a contract supported by such a surety bond, and the issuing bank or surety were to make
payment to the third party, the Company would be responsible for reimbursing the issuing bank or surety within an
agreed timeframe, typically a period of one to five days. To the extent liabilities are incurred as a result of activities
covered by the surety bonds, such liabilities are included on the Consolidated Balance Sheets. As of December 31,
2025 and 2024, the Company has outstanding surety bonds totaling $57.5 million and $51.0 million, respectively.
F-19
NOTE 4 – ASSET RETIREMENT OBLIGATIONS
The following table summarizes the changes in the Company’s AROs for the periods indicated:
(Dollars in thousands) | As of December 31, | ||
2025 | 2024 | ||
Beginning balance ............................................................................................. | $299 | $— | |
Liabilities incurred during the period ............................................................... | 843 | 299 | |
Accretion expense ............................................................................................. | 51 | — | |
Ending balance .................................................................................................. | $1,193 | $299 | |
NOTE 5 – OTHER CURRENT LIABILITIES
The schedule below details the Company’s other current liabilities presented on the Consolidated Balance
Sheets for the periods indicated:
(Dollars in thousands) | As of December 31, | ||
2025 | 2024 | ||
Accrued expenses .............................................................................................. | $9,035 | $2,848 | |
Bonus accrual ..................................................................................................... | 4,830 | 2,591 | |
Derivative ........................................................................................................... | 1,680 | — | |
Deferred grant income ....................................................................................... | 888 | 1,479 | |
Payroll liabilities ................................................................................................ | 564 | 74 | |
Total other current liabilities ............................................................................. | $16,997 | $6,992 | |
Note: Deferred grant income is attributable to a grant with an organization for the Company to provide research
and development.
NOTE 6 – LEASES
BLM geothermal leases provide the geothermal lessee the right and privilege to drill for, extract, produce,
remove, utilize, sell, and dispose of geothermal resources on certain lands, together with the right to build and
maintain necessary improvements thereon. The actual ownership of the geothermal resources and other minerals
beneath the land is retained in the federal mineral estate. The geothermal lease does not grant the geothermal lessee
the exclusive right to develop the lands, although the geothermal lessee does hold the exclusive right to develop
geothermal resources within the lands. Since BLM leases do not grant to the geothermal lessee the exclusive right to
use the surface of the land, BLM may grant rights to others for activities that do not unreasonably interfere with the
geothermal lessee’s uses of the same land, including use, off-road vehicles, and/or wind or solar energy
developments. The Company has domestic leases on federal, state, and private land in California, Colorado, Idaho,
Nevada, New Mexico, Utah and Washington.
The Company also has leases for its office space and field vehicles. The Company recognized $9.7 million and
$6.9 million, respectively, in total lease expense as reflected in operating lease expenses in the Consolidated
Statements of Operations for the years ended December 31, 2025 and 2024. Total cash payments related to leases
were $9.5 million and $2.8 million, respectively for the years ended December 31, 2025 and 2024.
F-20
The following table presents information regarding operating leases recorded on the Consolidated Balance
Sheets where the Company is the lessee for the periods indicated.
(Dollars in thousands) | As of December 31, | ||
Carrying values by asset category | 2025 | 2024 | |
ROU Asset: | |||
Geothermal land leases ................................................................................. | $45,609 | $24,316 | |
Office space ................................................................................................... | 6,635 | 952 | |
Equipment ..................................................................................................... | 6,188 | — | |
Vehicles ......................................................................................................... | 282 | 404 | |
Total ............................................................................................................ | $58,713 | $25,672 | |
Lease Liability(1): | |||
Geothermal land leases ................................................................................. | $62,744 | $41,420 | |
Office space ................................................................................................... | 8,144 | 969 | |
Equipment ..................................................................................................... | 6,300 | — | |
Vehicles ......................................................................................................... | 273 | 390 | |
Total ............................................................................................................ | $77,461 | $42,779 | |
By asset category | As of December 31, | ||
2025 | 2024 | ||
Weighted average remaining term | |||
Geothermal land leases ................................................................................. | 14 years | 16 years | |
Office space ................................................................................................... | 3 years | 1 year | |
Equipment ..................................................................................................... | 9 years | — | |
Vehicles ......................................................................................................... | 2 years | 3 years | |
Weighted average discount rate(2): | |||
Geothermal land leases ................................................................................. | 11% | 12% | |
Office space ................................................................................................... | 9% | 11% | |
Equipment ..................................................................................................... | 12% | —% | |
Vehicles ......................................................................................................... | 10% | 10% | |
_________________
(1)The short-term and long-term lease liability totals $4.8 million and $72.6 million as of December 31, 2025, respectively, and $1.9 million
and $40.9 million as of December 31, 2024.
(2)The discount rate for each category of assets represents the Company’s IBR for leases.
The IBR is a significant estimate related to the Company’s operating lease liabilities. It was calculated by
determining a credit rating based on credit metrics of comparable publicly traded companies, developing a yield
curve for publicly traded debt matching the credit rating, and then developing a weighted average IBR based on
those yield curves.
F-21
The following is a schedule showing the Company’s future minimum lease payments associated with the
operating leases together with the present value of the net minimum lease payments for the periods indicated.
(Dollars in thousands) | As of December 31, |
2025 | |
2026 ................................................................................................................................................... | $6,261 |
2027 ................................................................................................................................................... | 7,235 |
2028 ................................................................................................................................................... | 6,188 |
2029 ................................................................................................................................................... | 12,035 |
2030 ................................................................................................................................................... | 11,380 |
Thereafter .......................................................................................................................................... | 133,508 |
Total minimum lease payments ............................................................................................... | $176,607 |
Less: Amount representing interest .................................................................................................. | 99,146 |
Total lease obligation .............................................................................................................. | $77,461 |
Less: Current lease obligation .......................................................................................................... | 4,822 |
Long-term lease obligation ...................................................................................................... | $72,639 |
NOTE 7 – CONCENTRATIONS
All operations and efforts of the Company are focused in the geothermal industry and are subject to the related
risks of the industry. The Company’s projects are located in Nevada and Utah. The Company faces competition
from geothermal developers as well as other renewable energy providers and developers.
Competition occurs in the very early stage of development. The early stage is primarily obtaining the rights to
the resource for development of future projects or acquiring a site already in a more advanced stage of development.
The Company is also potentially subject to concentrations of credit risk in its project deposits. However, the
Company has not historically experienced any write downs and management does not believe significant credit risks
exists as of December 31, 2025 and 2024.
NOTE 8 – COMMON STOCK
Voting Rights
The holders of common stock are entitled to one vote for each share on all voting matters other than matters that
solely relate to the terms of one or more outstanding series of preferred stock.
Dividends and Liquidation Rights
The Company cannot pay dividends on common stock unless the holders of the redeemable convertible
preferred stock outstanding at the time simultaneously receive a dividend on each outstanding share of preferred
stock as described in Note 9 – Redeemable Convertible Preferred Stock. During the years ended December 31, 2025
and 2024, no dividends on the Company’s common stock have been paid or declared by the Company.
In the event of any voluntary or involuntary liquidation, dissolution, winding up of the Company, or any
deemed liquidation event, such as a merger or disposition of substantially all of the Company’s assets (“Deemed
Liquidation Event”), holders of common stock are entitled to share in any distribution of assets remaining after
distributions to redeemable convertible preferred stockholders as described further below.
Other Rights
The holders of common stock are entitled to elect two directors to the Board of Directors (“Board”) of the
Company.
F-22
Restricted Net Assets
Fervo HoldCo LLC, a wholly owned direct subsidiary of the Company, entered into the Mercuria Credit
Agreement, which includes certain covenants limiting the ability of the Company’s subsidiaries to make cash
distributions to Fervo Energy Company, the parent entity. The net assets subject to restriction under the provisions
of the Mercuria Credit Agreement were estimated at $483.8 million and $243.6 million as of December 31, 2025
and 2024 respectively. The restricted amount represents the net assets of the subsidiaries subject to the distribution
limitations contained in the Credit Agreement and excludes the Company’s stockholders’ equity, which is not
considered an asset subject to such restrictions. See Note 3 – Debt and Off-Balance Sheet Arrangements for further
information regarding the Mercuria Credit Agreement.
NOTE 9 – REDEEMABLE CONVERTIBLE PREFERRED STOCK
As of December 31, 2025 and 2024, the Company authorized twelve and ten series of redeemable convertible
preferred stock, respectively.
As of December 31, 2025, redeemable convertible preferred stock consisted of the following:
(Dollars in thousands, except per share amounts) | Shares Authorized | Shares Issued and Outstanding | Issuance Price Per Share | Carrying Value | Aggregate Liquidation Preference | ||||
As of December 31, 2025 | |||||||||
Series A .......................................... | 14,542 | 14,542 | 0.77 | $11,250 | $11,250 | ||||
Series A-1 ....................................... | 2,453 | 2,453 | 0.05 | 1,897 | 1,897 | ||||
Series B .......................................... | 24,597 | 24,596 | 1.15 | 28,324 | 28,324 | ||||
Series C-1 ....................................... | 43,482 | 43,482 | 2.53 | 110,100 | 110,100 | ||||
Series C-2 ....................................... | 5,018 | 5,018 | 2.03 | 12,665 | 12,665 | ||||
Series C-3 ....................................... | 10,676 | 10,676 | 1.69 | 18,021 | 18,021 | ||||
Series D-1 ....................................... | 92,344 | 92,344 | 2.53 | 232,753 | 233,843 | ||||
Series D-2 ....................................... | 4,767 | 4,767 | 2.15 | 12,025 | 12,025 | ||||
Series D-3 ....................................... | 25,468 | 25,468 | 5.28 | 133,873 | 134,500 | ||||
Series D-4 ....................................... | 112 | 112 | 4.49 | 592 | 592 | ||||
Series E-1 ....................................... | 56,537 | 56,537 | 8.17 | 461,442 | 462,000 | ||||
Series E-2 ....................................... | 3,550 | — | 5.28 | — | — | ||||
Total ........................................... | 283,546 | 279,995 | $1,022,942 | $1,025,217 |
As of December 31, 2024, redeemable convertible preferred stock consisted of the following:
(Dollars in thousands, except per share amounts) | Shares Authorized | Shares Issued and Outstanding | Issuance Price Per Share | Carrying Value | Aggregate Liquidation Preference | ||||
As of December 31, 2024 | |||||||||
Series A ........................................... | 14,542 | 14,542 | $0.77 | $11,250 | $11,250 | ||||
Series A-1 ....................................... | 2,453 | 2,453 | 0.05 | 1,897 | 1,897 | ||||
Series B ........................................... | 24,596 | 24,596 | 1.15 | 28,324 | 28,324 | ||||
Series C-1 ........................................ | 43,482 | 43,482 | 2.53 | 110,100 | 110,100 | ||||
Series C-2 ........................................ | 5,018 | 5,018 | 2.03 | 12,665 | 12,665 | ||||
Series C-3 ........................................ | 10,676 | 10,676 | 1.69 | 18,021 | 18,021 | ||||
Series D-1 ....................................... | 92,344 | 92,344 | 2.53 | 232,753 | 233,843 | ||||
Series D-2 ....................................... | 4,767 | 4,767 | 2.15 | 12,025 | 12,025 | ||||
Series D-3 ....................................... | 25,468 | 25,468 | 5.28 | 133,873 | 134,500 |
F-23
(Dollars in thousands, except per share amounts) | Shares Authorized | Shares Issued and Outstanding | Issuance Price Per Share | Carrying Value | Aggregate Liquidation Preference | ||||
Series D-4 ....................................... | 112 | 112 | 4.49 | 592 | 592 | ||||
Total .......................................... | 223,458 | 223,458 | $561,500 | $563,217 |
The holders of the redeemable convertible preferred stock have the following rights, preferences, and privileges:
Voting Rights
Each holder of redeemable convertible preferred stock is entitled to the number of votes calculated on an as
converted to common stock basis. The preferred stockholders vote together as a single class with the holders of
common stock.
Dividends
If a dividend is declared, the holders of the redeemable convertible preferred stock receive the same amount per
share as the common stockholders for the number of shares of common stock that would be received on an as
converted to common stock basis. No such dividends have been declared or paid during the years ended December
31, 2025 and 2024.
Conversion
Each share of redeemable convertible preferred stock is convertible at any time at the election of the holder into
common stock. The conversion rate is determined by dividing the original issue price, by the conversion price at the
time of conversion, with the conversion price initially equal to the original issue price, subject to customary anti-
dilutive adjustments for stock splits, dividends, and other applicable corporate events. As of December 31, 2025 and
2024, each share of redeemable convertible preferred stock was convertible into one share of common stock.
Conversion is mandatory upon the occurrence of either: (i) an initial public offering (“IPO”) resulting in at least
$100.0 million in proceeds to the Company, net of underwriting discount and commissions, provided that the Series
E redeemable convertible preferred stock will only automatically convert if such IPO is also at a price per share of at
least $12.26 or (ii) the date and time, or the occurrence of an event, specified by vote or written consent of the
holders of a majority of the outstanding shares of redeemable convertible preferred stock, which must include Series
E holders. The mandatory conversion is subject to the then-effective conversion rate.
Liquidation Preference
In the event of any voluntary or involuntary liquidation, dissolution, winding up of the Company, or any
Deemed Liquidation Event, first the holders of the Series E redeemable convertible preferred stock are entitled to
receive proceeds in an amount which is the greater of: (x) the amount to be received if the redeemable convertible
preferred stock were converted into common stock immediately prior to the event, and (y) the original issue price
plus declared and unpaid dividends. If the distribution is insufficient to pay the holders the full amount to which they
are entitled, the holders of Series E convertible redeemable preferred stock will share ratably in any distribution of
assets in proportion to the shares held. After full payment to the Series E holders, the Series D holders are entitled to
receive proceeds using the same formula as described for the Series E holders above. After full payment to the
Series D holders, the holders of the Series A, Series B, and Series C redeemable convertible preferred stock are
entitled to the remaining funds available for distribution up to the greater of: (x) the amount to be received if the
redeemable convertible preferred stock were converted into common stock immediately prior to the event, and (y)
the original issue price plus declared and unpaid dividends. If the distribution is insufficient to pay the holders the
full amount to which they are entitled, the holders of the Series A, Series B, and Series C redeemable convertible
preferred stock will share ratably in any distribution of assets in proportion to the shares held.
Redemption Rights
Holders of the redeemable convertible preferred stock have redemption rights in the case of a Deemed
Liquidation Event, where the redeemable convertible preferred stockholders are entitled to proceeds as described
F-24
above. A Deemed Liquidation Event is deemed to be in the control of the redeemable convertible preferred
stockholders as the redeemable convertible preferred stockholders control the Board.
There are no redemption rights held by the Company as it relates to the redeemable convertible preferred stock.
Protective Provisions
The Series A, Series B, Series C, Series D, and Series E redeemable convertible preferred stockholders each as a
separate class have the ability to elect one member of the Board, for a total of five Board members. Additionally, the
Series A, Series B, Series C, Series D, and Series E redeemable convertible preferred stock have protective rights
that require a majority vote on matters such as liquidation events, changes to capital stock, changes to the number of
directors on the Board, or sales of significant assets outside the ordinary course of business.
The Series D redeemable convertible preferred stock includes protective rights requiring a majority vote on
matters such as those adversely impacting the rights of the Series D redeemable convertible preferred stock,
including those that impact the authorized number of Series D redeemable convertible preferred stock.
The Series E redeemable convertible preferred stock includes protective rights requiring a majority vote on
matters such as liquidation events unless Series E-1 holders receive at least 1.5 times the original issue price per
share until December 4, 2027, matters which adversely impact the rights of the Series E redeemable convertible
stock holders, including those that impact the authorized number of Series E redeemable convertible preferred stock,
and those that impact the authorized number of Series D redeemable convertible preferred stock.
Classification of Redeemable Convertible Preferred Stock
Although the Company’s redeemable convertible preferred stock is not mandatorily redeemable, it is classified
outside of permanent equity because it is redeemable upon a Deemed Liquidation Event considered to be outside of
the Company’s control. Accordingly, redeemable convertible preferred stock is presented as mezzanine equity on
the Consolidated Balance Sheets.
The redeemable convertible preferred stock is not remeasured to redemption value because a Deemed
Liquidation Event is not deemed probable of occurring as of December 31, 2025 and 2024, and therefore, these
instruments were not deemed probable of becoming redeemable.
NOTE 10 – STOCK BASED COMPENSATION
In 2019, the Company adopted a stock incentive plan (the “2019 Stock Incentive Plan” or the “Plan”). Awards
in the form of both incentive and non-qualified stock options, restricted stock, stock appreciation rights and other
stock-based awards may be made under the Plan.
In 2025, the Plan was amended to authorize additional shares that can be issued under the Plan, for up to
43,512,256 shares of common stock. In the event that shares previously issued under the Plan are reacquired by the
Company pursuant to a forfeiture provision, or repurchase by the Company, such shares shall be added back to the
number of shares then available for issuance under the Plan. Shares issued under the Plan may consist in whole or in
part of authorized but unissued shares or treasury shares. As of December 31, 2025 and 2024, 15,558,217 and
10,949,131 shares, respectively, were available for issuance under the Plan, and 280,000 shares were reserved for
restricted stock.
As of December 31, 2025, all outstanding stock-based awards were in the form of stock options issued to
employees. Options granted under the Plan are exercisable at various dates as determined upon grant and will expire
10 years from the date of grant. The exercise price of each option is determined by the Board based on the estimated
fair value of the Company’s stock on the date of the grant. The exercise price shall not be less than 100% of the fair
market value of the Company’s common stock at the time the option is granted. The stock options issued under the
Plan generally vest over a four-year period, with a one year cliff vest and monthly vesting thereafter until the four
year anniversary of the grant date. The impact of stock option exercises on cash flows is reflected in the financing
section of the Consolidated Statements of Cash Flows. The Company issues common stock upon the exercise of
stock options.
F-25
The following table summarizes stock option activity under the Plan:
(Stock options data and aggregate intrinsic value in thousands) | Stock Options Outstanding | Weighted – Average Exercise Price | Weighted – Average Grant Date Fair Value | Weighted – Average Remaining Contractual Term (in years) | Aggregate Intrinsic Value | ||||
Outstanding at January 1, 2025 ........ | 16,666 | $0.84 | $0.42 | $— | |||||
Granted ............................................. | 10,704 | 3.08 | 1.44 | — | |||||
Exercised .......................................... | (676) | 0.76 | 0.39 | 760 | |||||
Forfeited ........................................... | (416) | 1.62 | 1.03 | — | |||||
Expired ............................................. | (161) | 0.59 | 0.30 | — | |||||
Outstanding at December 31, 2025 .. | 26,117 | $1.75 | $1.10 | 8.36 | $65,348 | ||||
Vested and exercisable at December 31, 2025 .......................... | 10,466 | $0.80 | $0.40 | 7.09 | $36,148 |
The intrinsic value for options exercised is the difference between the estimated fair value of the stock and the
exercise price of the stock option at the date of exercise. The Company received $0.5 million, and $0.1 million,
respectively, in cash from the exercise of stock options during the years ended December 31, 2025 and 2024.
The Black-Scholes option-pricing model assumptions used to value the employee stock options at the grant
dates were as follows:
Year ended December 31, | |||
2025 | 2024 | ||
Fair value of common stock .................................................................................................... | $2.12 - $4.25 | $0.98 | |
Expected volatility ................................................................................................................... | 75.0% | 70.0% | |
Expected term (in years) ......................................................................................................... | 3.08 - 6.08 | 3.08 | |
Risk-free interest rate .............................................................................................................. | 3.75% - 4.25% | 4.6% | |
Expected dividend yield .......................................................................................................... | 0.0% | 0.0% | |
The assumptions and estimates were determined as follows:
Fair Value Per Share of the Company’s Common Stock—Because the Company’s common stock is not yet
publicly traded, the Company must estimate the fair value of its common stock. The Board considers numerous
objective and subjective factors to determine the fair value of the Company’s common stock at each meeting in
which awards are approved. The factors considered include, but are not limited to: (i) the results of
contemporaneous independent third-party valuations of the Company’s common stock, (ii) the prices, rights,
preferences, and privileges of the Company’s redeemable convertible preferred stock relative to those of its common
stock, (iii) the lack of marketability of the Company’s common stock, (iv) the Company’s actual operating and
financial performance and estimated trends and prospects for its future performance current business conditions and
financial projections, (v) the likelihood of achieving a liquidity event, such as an IPO, direct listing, or sale of the
Company, given prevailing market conditions; and (vi) precedent transactions involving the Company’s shares.
Stock-Based Compensation Expense
During the years ended December 31, 2025 and 2024, the Company recorded $2.7 million and $1.4 million,
respectively, as stock-based compensation in the general and administrative expenses in the Consolidated Statements
of Operations.
As of December 31, 2025, unrecognized stock-based compensation expense related to unvested stock options
was $24.4 million, which is expected to be recognized over a weighted-average period of 3.63 years.
F-26
NOTE 11 – CONVERTIBLE NOTES
On April 6, 2023, the Company entered into convertible notes (“2023 Notes”) with a principal owner owning
greater than 10% of the Company, for a principal amount of $10.0 million in exchange for cash proceeds of $10.0
million. These 2023 Notes accrue interest at a rate of 3.1% per annum and mature on the earlier of April 6, 2025, or
upon a Change of Control or Liquidation Event, unless sooner converted in a Qualified Financing Transaction or
repaid. Upon consummation of a Qualified Financing Transaction, which consists of any transaction or series of
related transactions that results in issuance of a series of preferred stock with aggregate proceeds to the Company of
not less than $100.0 million, the 2023 Notes outstanding automatically convert into shares of a series of preferred
stock of the Company. The conversion price per share is equal to 85.0% of the relevant financing price per share and
the Company bifurcated from the 2023 Notes an embedded derivative representing the conversion. In February
2024, pursuant to the issuance of Series D-1 redeemable convertible preferred stock, a Qualified Financing
Transaction occurred and the 2023 Notes converted to Series D-2 redeemable convertible preferred stock, with a
value of $12.0 million, which included the $10.0 million face value, $0.3 million in accumulated interest, and the
$1.7 million settlement of the embedded derivative. Of the accumulated interest, $0.1 million of interest expense
was incurred during the year ended December 31, 2024.
In September 2024, the Company entered into a SAFE with an investor for cash proceeds of $0.5 million
(“Development Investment Amount”). Upon consummation of an Equity Financing, which consists of any
transaction or series of related transactions that results in issuance of a series of preferred stock with a fixed
valuation, the holder of the SAFE has the option to convert the SAFE into shares of a series of preferred stock of the
Company. The conversion is based on the Development Investment Amount plus the accrued but unpaid amount of
interest on the Development Investment Amount at an annual rate of 3.4%, using a conversion price which is the
lowest cash price per share paid by cash investors in the Equity Financing multiplied by 85.0%. In December 2024,
pursuant to the issuance of Series D-3 redeemable convertible preferred stock, an Equity Financing occurred and the
SAFE was elected to be converted to Series D-4 redeemable convertible preferred stock, with a value of $0.6
million.
NOTE 12 – WARRANTS
As of December 31, 2025, the Company had 3,550,329 Warrants outstanding. The Warrants were issued on
October 6, 2025 in connection with the issuance of Class A Units (“Intermediate Class A Units”) issued by Cape
Phase 1 Intermediate HoldCo, LLC (“Cape P1 Intermediate HoldCo”) to Centaurus Capital LP (“the Holder” or
“Centaurus”) and entitle Centaurus to purchase shares of the Company’s most senior class of preferred stock
outstanding at the time of exercise based on liquidation preference. The Intermediate Class A Units are further
discussed in Note 14 - Noncontrolling Interests.
The Warrants are freestanding financial instruments that have a fixed exercise price of $5.28 per share. The
Warrants may be exercised at any time by the holder prior to (i) the fourth anniversary of the issuance date or (ii)
immediately prior to the completion of a firm commitment underwritten initial public offering. The Warrants may be
exercised by payment of the aggregate exercise price, exercised on a cashless basis whereby the number of shares
issued is determined based on the excess of the fair value of the underlying shares over the exercise price and no
cash consideration is paid by the holder to the Company. The Warrants may expire unexercised if the exercise
conditions are not met.
Upon the occurrence of an acquisition or similar transaction, if the surviving or successor entity assumes the
obligations of the Warrants, the Warrants remain outstanding and convert into the right to receive the same form and
amount of securities, cash, or other consideration that the holder would have received had the Warrants been
exercised immediately prior to the transaction. If the Warrants are not assumed, the Warrants terminate and the
holder becomes entitled to receive consideration equal to the excess, if any, of the value of the underlying shares
over the aggregate exercise price.
The Warrants are exercisable for preferred stock that is contingently redeemable under circumstances outside
the Company’s control and are classified as mezzanine equity. Therefore, the Warrants are classified as liabilities in
accordance with ASC 480, and are recorded at fair value, with changes in fair value recognized in earnings each
F-27
reporting period. Upon issuance, the Warrants were recorded at a fair value of $6.8 million. During the year ended
December 31, 2025, the Company recognized a loss due to the valuation of the Warrants of $3.4 million which is
reflected within Other non-operating expense in the Consolidated Statements of Operations. As of December 31,
2025, the fair value of the Warrants was approximately $10.2 million and is recorded within Other long-term
liabilities in the Consolidated Balance Sheets.
Fair Value Measurement and Settlement Amounts
Upon issuance, the Warrants were measured at fair value using a Black-Scholes option pricing model which
only considered a going concern scenario. As of December 31, 2025, the Warrants were measured at fair value using
a Black-Scholes option pricing model, weighted between a going concern scenario and IPO scenario. The Company
estimated the valuation of the Warrants using the following assumptions:
At issuance | |
October 6, 2025 | |
Series D-3 Redeemable Convertible Preferred Stock price .................................................................. | $5.28 |
Expected volatility ................................................................................................................................ | 75.0% |
Expected term (in years) ...................................................................................................................... | 3.00 |
Risk-free interest rate ............................................................................................................................ | 3.6% |
Expected dividend yield ........................................................................................................................ | 0.0% |
As of December 31, 2025 | |||
Going concern scenario | IPO scenario | ||
Series D-3 Redeemable Convertible Preferred Stock price ....................................... | $8.17 | $8.17 | |
Expected volatility ..................................................................................................... | 75.0% | 75.0% | |
Expected term (in years) ............................................................................................ | 3.00 | 0.50 | |
Risk-free interest rate ................................................................................................. | 3.6% | 3.6% | |
Expected dividend yield ............................................................................................ | 0.0% | 0.0% | |
Due to the use of significant unobservable inputs of stock price, volatility and expected term in the valuation,
the Warrants are classified within Level 3 of the fair value hierarchy. Accordingly, significant judgment is required
in selecting these assumptions. Actual assumptions may differ from the Company’s current estimates and such
differences could materially impact the fair value of the Warrants.
Changes in the fair value of the Company’s equity directly affects the fair value of the Warrants. No Warrants
have been exercised as of December 31, 2025.
NOTE 13 – VARIABLE INTEREST ENTITY
The Company evaluated its interests in certain legal entities and determined that Cape Phase 1 HoldCo, LLC
(“Cape P1 HoldCo”) and Cape P1 Intermediate HoldCo are VIEs under ASC 810 as of December 31, 2025. The
Company concluded that it is the primary beneficiary of these VIEs because it has (i) the power to direct the
activities that most significantly impact these VIEs’ economic performance and (ii) the obligation to absorb losses or
the right to receive benefits that could potentially be significant to these VIEs. The Company holds its interest in
Cape P1 Intermediate HoldCo through other consolidated subsidiaries. Cape P1 HoldCo is consolidated into Cape
P1 Intermediate HoldCo as the direct owner of its equity interests. Accordingly, the Company has consolidated Cape
P1 HoldCo and Cape P1 Intermediate HoldCo in the accompanying consolidated financial statements and
recognized noncontrolling interests related to these VIEs. Refer to Note 14 – Noncontrolling Interests.
The assets of Cape P1 HoldCo and Cape P1 Intermediate HoldCo may only be used to settle the obligations of
the respective VIEs, and creditors of these entities do not have recourse to the general credit of the Company. The
Company’s maximum exposure to loss as a result of its involvement with these VIEs is limited to its investment in
the entities and any contractual arrangements that require the Company to provide financial support. The Company’s
F-28
ongoing financial support includes a capital commitment totaling to $161.2 million for Cape P1 HoldCo. The
Company also has construction capital commitments of $207.7 million to fund future construction costs and support
the ongoing operations of its project subsidiaries, as well as three maintenance capital commitments totaling $35.7
million for Cape P1 Intermediate HoldCo.
Management reassesses its involvement with Cape P1 HoldCo and Cape P1 Intermediate HoldCo on an ongoing
basis to determine whether the Company continues to be the primary beneficiary, including consideration of changes
in governance, contractual arrangements, financing structures, or other facts and circumstances that could affect the
Company’s consolidation conclusions. The Company will also reassess whether Cape P1 HoldCo and Cape P1
Intermediate HoldCo continue to be VIEs upon the occurrence of a reconsideration event.
NOTE 14 – NONCONTROLLING INTERESTS
As discussed in Note 13 – Variable Interest Entity, the Company has consolidated Cape P1 HoldCo and Cape
P1 Intermediate HoldCo, which were determined to be VIEs for which the Company is the primary beneficiary.
Both entities issued Class A Units to third party-investors that represent equity interests in the respective
consolidated subsidiaries. Because the Company does not own 100% of the outstanding equity in these entities, the
Class A Units are accounted for as noncontrolling interests in the consolidated financial statements.
The Class A Units issued by Cape P1 HoldCo (“CP1 HoldCo Class A Units”) and Intermediate Class A Units
contain redemption features that are outside the control of the respective issuers but are contingent upon the
availability of distributable cash. Accordingly, these Class A Units are classified as redeemable noncontrolling
interest and are presented as mezzanine equity on the Consolidated Balance Sheets.
The distributions of available cash related to Cape P1 HoldCo are first made to the holders of the CP1 HoldCo
Class A Units in satisfaction of any accumulated and unpaid yield associated with the CP1 HoldCo Class A Units as
of such time, until the capital balance of the CP1 HoldCo Class A Unit holders has been reduced to $0.00. CP1
HoldCo Class A Units are initially recorded at fair value at the time of issuance, less the direct and incremental
issuance costs. The CP1 HoldCo Class A Units are subsequently measured at the current redemption value to the
extent such current redemption value exceeds the attribution of income (loss) to the CP1 HoldCo Class A Units.
The distributions of available cash and certain tax credits related to Cape P1 Intermediate HoldCo for
Intermediate Class A Units are allocated based on the applicable sharing ratio at any given time with a targeted
internal rate of return. Intermediate Class A Units are initially recorded at proceeds received less the fair value of the
warrants issued along with the Intermediate Class A Units and allocated issuance cost. Intermediate Class A Units
are subsequently remeasured at their maximum redemption value, to the extent such amounts exceed the allocation
of income or loss attributable to the noncontrolling interest. Additionally, two derivatives were identified as being
embedded in the Intermediate Class A Units. Both embedded derivatives had a de minimis fair value at inception
and so no amount was bifurcated at that time. As of December 31, 2025, conditions relevant to the embedded
derivatives was evaluated and one feature was determined to have a fair value of $1.7 million. This amount is
included in Other current liabilities.
The following table is a summary of the changes in redeemable noncontrolling interest for CP1 HoldCo Class A
Units for the year ended December 31, 2025:
(Dollars in thousands) | |
Balance at December 31, 2024 ............................................................................................................. | $— |
Redeemable noncontrolling interests .................................................................................................... | 99,500 |
Remeasurement of redeemable noncontrolling interest ........................................................................ | 3,086 |
Balance at December 31, 2025 ............................................................................................................. | $102,586 |
F-29
The following table is a summary of the changes in redeemable noncontrolling interest for Intermediate Class A
Units for the year ended December 31, 2025:
(Dollars in thousands) | |
Balance at December 31, 2024 ............................................................................................................. | $— |
Redeemable noncontrolling interests .................................................................................................... | 67,703 |
Remeasurement of redeemable noncontrolling interest ........................................................................ | 9,641 |
Balance at December 31, 2025 ............................................................................................................. | $77,344 |
NOTE 15 – SEGMENT INFORMATION
The Company engages in a single line of business focused on commercializing technology to own, develop, and
operate geothermal assets as the dispatchable foundation to a 100% clean energy future. All of the Company’s assets
and operations are in the United States.
Fervo operates in a single operating and reportable segment, which is consistent with the reporting structure of
the Company’s internal organization and the use of the consolidated financial information of Fervo by the
Company’s CODM to allocate resources and assess performance. The CODM is the Company’s chief executive
officer.
The primary measure of segment profit or loss used by the CODM is net loss, as presented in the Consolidated
Statements of Operations. The measure of segment assets is reported on the Consolidated Balance Sheets as total
assets. Total expenditures for additions to long-lived assets are as reported in the Consolidated Statements of Cash
Flows. The significant segment expenses regularly provided to the CODM and included in the measure of segment
profit or loss are those presented in the Consolidated Statements of Operations.
All segment financial information for the Company is as reported on the respective consolidated financial
statements.
NOTE 16 – EARNINGS PER SHARE
Basic and diluted net loss per share is calculated as follows:
(Dollars and shares in thousands, except per share amounts) | Year ended December 31, | ||
2025 | 2024 | ||
Numerator: | |||
Net loss attributable to common shares ..................................................................... | $(70,515) | $(41,110) | |
Denominator: | |||
Weighted-average common shares ........................................................................... | 12,462 | 12,438 | |
Net loss per share – basic and diluted ................................................................. | $(5.66) | $(3.31) | |
The following potentially dilutive instruments, based on amounts outstanding, that could result in dilution, were
excluded from the diluted earnings per share computation because including them would have had an anti-dilutive
effect:
(Shares in thousands) | Year ended December 31, | ||
2025 | 2024 | ||
Preferred shares ........................................................................................................ | 279,995 | 223,458 | |
Options based awards ............................................................................................... | 26,117 | 17,826 | |
Warrants ..................................................................................................................... | 3,550 | — | |
Total .......................................................................................................................... | 309,662 | 241,284 | |
F-30
NOTE 17 – GRANT INCOME
Grant income of $0.1 million and $2.7 million attributable to research and development is netted against eligible
expenses in research and development, net in the Consolidated Statements of Operations for the years ended
December 31, 2025 and 2024, respectively. Grant income totaling $14.1 million and $2.4 million attributable to
project development is netted against construction-in-progress on the Consolidated Balance Sheets for the years
ended December 31, 2025 and 2024, respectively.
In 2024, the Company was awarded a reimbursement-type award from the DOE in the amount of $22.1 million.
The effective date of the grant was July 1, 2024 and the contract expires July 1, 2026. Funding under the grant is
received as qualifying expenditures are incurred in accordance with the terms of the grant agreement.
NOTE 18 – INCOME TAXES
The Company is responsible for federal and state income taxes in various jurisdictions. Deferred income taxes
are calculated for temporary differences using an asset and liability approach. Under this approach, deferred tax
assets or liabilities are recognized for the estimated future tax effects attributable to the temporary differences
(differences between the tax basis of an asset or liability and its reported amount in consolidated financial
statements) and carryforwards, based on provision of the enacted tax law. The Company files income tax returns in
the United States and various states.
As the Company is still in a start-up phase of development, there is nominal current income tax expense and
deferred income tax expense for the years ended December 31, 2025 and 2024.
As of December 31, 2025 and 2024, the Company had approximately $85.7 million and $41.2 million,
respectively, of net operating loss carryforwards for Federal tax purposes, all of which are indefinitely lived.
The Company’s loss before income tax consisted of:
(Dollars in thousands) | Year ended December 31, | ||
2025 | 2024 | ||
United States .............................................................................................................. | $(57,787) | $(41,054) | |
The components of current and deferred income tax expense included in the Consolidated Statements of
Operations for years ended December 31, 2025 and 2024 are as follows:
(Dollars in thousands) | Year ended December 31, | ||
2025 | 2024 | ||
Current: | |||
Federal ..................................................................................................................... | $— | $53 | |
State and local ......................................................................................................... | 1 | 3 | |
Foreign .................................................................................................................... | — | — | |
Total ...................................................................................................................... | $1 | $56 | |
Deferred: | |||
Federal ..................................................................................................................... | $— | $— | |
State and local ......................................................................................................... | — | — | |
Foreign .................................................................................................................... | — | — | |
Total ...................................................................................................................... | $— | $— | |
Total income tax expense .......................................................................................... | $1 | $56 | |
F-31
The difference between income tax expense and amounts calculated using the statutory rate of 21% for the years
ended December 31, 2025 and 2024 is as follows:
Year ended December 31, 2025 | Year ended December 31, 2024 | ||||||
(Dollars in thousands) | Tax | Percent | Tax | Percent | |||
Tax benefit at U.S. Federal statutory rate ................... | $(12,135) | 21.0% | $(8,614) | 21.0% | |||
Increase (decrease) in income taxes resulting from: .. | |||||||
Conversion of notes ............................................... | — | —% | 25 | —% | |||
Stock options ......................................................... | — | —% | 192 | (0.5)% | |||
State taxes .............................................................. | 1 | —% | 3 | —% | |||
Other ...................................................................... | 468 | (0.8)% | 18 | —% | |||
Change in valuation allowance .............................. | 11,667 | (20.2)% | 8,432 | (20.6)% | |||
Total tax expense ........................................................ | $1 | —% | $56 | (0.1)% | |||
The components of deferred taxes consisted of the following:
(Dollars in thousands) | As of December 31, | ||
2025 | 2024 | ||
Deferred Tax Assets | |||
Section 174 costs .............................................................................................. | $7,932 | $9,836 | |
Start-up costs ..................................................................................................... | 12,305 | 13,659 | |
NOL carryforward ............................................................................................ | 17,995 | 8,641 | |
Lease liability .................................................................................................... | 16,267 | 8,984 | |
Compensation ................................................................................................... | 1,204 | 657 | |
Grant revenue ..................................................................................................... | 2,458 | 821 | |
Inventory ............................................................................................................ | 8,252 | — | |
Investment in partnerships ................................................................................. | 1,272 | — | |
Other ................................................................................................................. | 583 | 248 | |
Deferred tax assets ............................................................................................ | $68,268 | $42,846 | |
Deferred Tax Liabilities | |||
Intangible drilling costs (IDC) .......................................................................... | $(9,145) | $(2,337) | |
Right of use asset .............................................................................................. | (12,330) | (5,391) | |
Total deferred tax liabilities .............................................................................. | $(21,475) | $(7,728) | |
Net deferred tax assets ....................................................................................... | 46,793 | 35,118 | |
Valuation allowance ......................................................................................... | (46,793) | (35,118) | |
Net deferred tax assets ....................................................................................... | $— | $— | |
In recording deferred income tax assets, the Company considers whether it is more likely than not that some
portion or all of the deferred income tax assets will be realized. The ultimate realization of deferred income tax
assets is dependent upon the generation of future taxable income of the appropriate character during the periods in
which those deferred income tax assets would be deductible. The Company considers the scheduled reversal of
deferred income tax liabilities and projected future taxable income for this determination. Due to the Company’s
limited historical earnings, management continues to believe that it is more likely than not that Fervo will not be
able to realize its net deferred tax assets, and therefore a valuation allowance remains on the net deferred tax asset
balance. The deferred income tax valuation allowance is as follows:
F-32
(Dollars in thousands) | 2025 | 2024 | |
Balance at beginning of year .................................................................................... | $35,118 | $26,686 | |
Additions .................................................................................................................. | 11,667 | 8,432 | |
Prior year adjustment ................................................................................................. | 8 | — | |
Balance at end of year .............................................................................................. | $46,793 | $35,118 |
The Company’s federal and state income tax returns for all tax years are generally open under statutes for
examination. The Company made no payment for federal income taxes, during the years ended December 31, 2025
and 2024, resulting in a tax net operating loss carryforward. A net operating loss carried forward from a tax year
which would otherwise be closed for statute can be examined if the tax year of utilization is open under statute.
As of December 31, 2025 and 2024, there are no uncertain tax benefits that could be recognized within the next
12 months that would impact the Company’s effective tax rate.
NOTE 19 – EMPLOYEE BENEFIT PLAN
The Company maintains a 401(k) defined contribution plan that is subject to the provisions of the Employee
Retirement Income Security Act of 1974 (“ERISA”). Each year, the employees participating in the plan may
contribute up to the maximum amount allowed for federal income tax purposes, as defined in the plan documents.
The Company may make contributions to the plan as determined annually. Such contributions may include a
discretionary matching contribution based on a percentage of the employee’s contribution, a discretionary
contribution amount, or a discretionary profit-sharing contribution for active participants employed on the last day of
the year. During the years ended December 31, 2025 and 2024, the Company made contributions to the plan totaling
$1.5 million and $0.8 million, respectively.
NOTE 20 – RELATED PARTY TRANSACTIONS
The Company evaluates its relationships and transactions with related parties in accordance with ASC 850,
Related Party Disclosures. Related parties include affiliates, principal owners, management, members of the Board
of Directors, and their immediate family members, as well as entities under common control or significant influence.
For the years ended December 31, 2025 and 2024, the Company incurred $0.3 million and $0.2 million
respectively, related to technical services provided by supplier who is a major investor in the Company and an
observer to the Company’s Board of Directors. These costs were recorded in general and administrative expenses in
the Consolidated Statements of Operations.
NOTE 21 – COMMITMENTS AND CONTINGENCIES
Contractual Commitments
As of December 31, 2025, the Company had contractual commitments of approximately of $528.8 million,
primarily related to our Cape Station Phase I and Cape Station Phase II facilities. Of this amount, $346.5 million is
due in 2026 and $182.3 million is due thereafter.
Litigation and Other Legal Proceedings
The Company records liabilities related to litigation and other legal proceedings when they are either known or
considered probable and can be reasonably estimated. Legal proceedings are inherently unpredictable and subject to
significant uncertainties, and significant judgment is required to determine both probability and the estimated
amount. As a result of these uncertainties, any liabilities recorded are based on the best information available at the
time. As any new information becomes available, the Company reassesses the potential liability related to pending
litigation. Management is not aware of any legal, environmental or other commitments or contingencies that would
have a material effect on the Company’s financial condition, results of operations or cash flows for the periods
presented.
F-33
Environmental permits
U.S. environmental permitting regimes with respect to geothermal projects center upon several general areas of
focus. The first involves land use approvals. These may take the form of Special Use Permits or Conditional Use
Permits from local planning authorities or a series of development and utilization plan approvals and right-of-way
approvals where the geothermal facility is entirely or partly on BLM lands. Certain federal approvals require a
review of environmental impacts in conformance with the federal National Environmental Policy Act. These federal
and local land use approvals typically impose conditions and restrictions on the construction, scope and operation of
geothermal projects.
The second category of permitting focuses on the installation and use of the geothermal wells themselves.
Geothermal projects typically have three types of wells: (i) exploration wells designed to define and verify the
geothermal resource, (ii) production wells to extract the hot geothermal liquids (also known as brine), and
(iii) injection wells to inject the brine back into the subsurface resource. For all wells drilled in Nevada, a geothermal
drilling permit must be obtained from the Nevada Division of Minerals.
A third category of permits involves the regulation of potential air emissions associated with the construction
and operation of wells. Generally, each well requires a preconstruction air permit and storm water discharge permit
before earthwork can commence.
A fourth category of permits, required in Nevada, includes ministerial permits such as building permits,
hazardous materials storage and management permits, and pressure vessel operating permits.
In some cases, projects may also require permits, issued by the applicable federal agencies or authorized state
agencies, regarding threatened or endangered species, permits to impact wetlands or other waters and notices of
construction of structures which may have an impact on airspace. Environmental laws and regulations may change
in the future that may modify the time to receive such permits and associated costs of compliance.
All of the material environmental permits and approvals currently required have been obtained. The Company
sometimes experiences regulatory delays in obtaining various permits and approvals required for projects in
development and construction. These delays may lead to increases in the time and cost to complete these projects.
The Company’s operations are designed and conducted to comply with applicable environmental permits and
approval requirements. Non-compliance with any such requirements could result in fines and penalties and could
also affect the Company’s ability to operate the affected project.
Environmental laws and regulations
The Company’s facilities and operations are subject to several federal, state, local and foreign environmental
laws and regulations relating to development, construction and operation. In the U.S., these may include the Clean
Air Act, the Clean Water Act, the Emergency Planning and Community Right-to-Know Act, the Endangered
Species Act, the National Environmental Policy Act, the Resource Conservation and Recovery Act, and related state
laws and regulations.
NOTE 22 – SUBSEQUENT EVENTS
Management has evaluated subsequent events that occurred after the date of the Consolidated Balance Sheets
through March 30, 2026, the date the financial statements were issued.
•Subsequent to December 31, 2025, the Company entered into agreements relating to the potential
development of geothermal energy projects, including a framework arrangement that establishes a
structured development process for future project evaluation. The framework includes development-related
commitments requiring the Company to submit specified project feasibility packages representing
approximately 1 GW of aggregate capacity within a defined period. The agreements also include provisions
under which the Company may be required to pay liquidated damages or termination fees under specified
circumstances, including potential payments of approximately $15.0 million if certain development
F-34
requirements are not met. The execution of these agreements did not result in the recognition of any assets
or liabilities as of December 31, 2025.
•On March 6, 2026, Cape Phase 1 Borrower LLC and Phase 1 WellCo LLC (the “Borrowers”), subsidiaries
of the Company, entered into a senior secured credit agreement with a syndicate of lenders led by MUFG
Bank, Ltd., as administrative agent, and HSBC Bank USA, National Association, as collateral agent, to
finance the development and construction of the Company’s Cape Station Phase I geothermal project
located in Beaver County, Utah. In connection with the financing, the Borrowers executed customary
project finance and related closing deliverables. As of the date the financial statements were issued, no
amounts had been drawn under the facility. Accordingly, the execution of the agreement did not result in
the recognition of any assets or liabilities as of December 31, 2025.
The Company expects to draw on the project financing facility in the near team. In connection with this
transaction, the Company expects to repay the outstanding borrowings under the XRC Term Loan. Pursuant
to the Second Loan Modification Agreement, the Company will be required to pay prepayment premiums
within one business day following such repayment. Accordingly, the Company estimates the prepayment
premium to be approximately $6.5 million, subject to final settlement.
•Subsequent to December 31, 2025, the Company granted stock options to employees and directors under
the Plan, which was amended on March 6, 2026 to authorize additional shares that can be issued for up to
47,472,828 shares of common stock. On January 26, 2026, the Company granted 5,817,000 stock options
with a grant date fair value of $2.91 per option. On March 6, 2026, the Company granted 13,844,588 stock
options with a grant date fair value of $5.81 per option. The grant-date fair value of the 2026 stock options
granted was estimated using the Black-Scholes option-pricing model using the following assumptions:
Fair value of common stock ................................................................................................................... | $4.25 - $8.49 |
Expected volatility .................................................................................................................................. | 75.0% |
Expected term (in years) ........................................................................................................................ | 6.08 |
Risk-free interest rate .............................................................................................................................. | 3.75% - 3.83% |
Expected dividend yield ......................................................................................................................... | 0.0% |
The Company determined the fair value of its common stock considering similar factors as disclosed in
Note 10 – Stock Based Compensation and utilized a weighted average calculation considering fair value
under both an IPO scenario and a going concern scenario.
•On March 27, 2026, the Company entered into an agreement to purchase turbines and related equipment.
The agreement includes a three-year order period from April 1, 2026, to March 31, 2029, during which the
Company has committed to a minimum purchase obligation of $15.0 million.
Other than the matters described above, the Company identified no subsequent events that require adjustment to
or disclosure in the consolidated financial statements.
70,000,000 Shares
Fervo Energy Company
Class A Common Stock

J.P. Morgan | BofA Securities | RBC Capital Markets | Barclays |
Baird | BBVA | Guggenheim Securities | MUFG |
Societe Generale | William Blair | Piper Sandler | Wolfe | Nomura Alliance |
Until , 2026 (the 25th day after the date of this prospectus), all dealers effecting transactions in these
securities, whether or not participating in this offering, may be required to deliver a prospectus. This is in addition to
a dealer’s obligation to deliver a prospectus when acting as an underwriter and with respect to an unsold allotment or
subscription.
II-1
PART II
INFORMATION NOT REQUIRED IN THE PROSPECTUS
Item 13. Other expenses of issuance and distribution.
The following table sets forth all fees and expenses, other than the underwriting discounts and commissions
payable solely by Fervo Energy Company in connection with the offer and sale of the securities being registered. All
amounts shown are estimated except for the SEC registration fee, the Financial Industry Regulatory Authority, Inc.,
or FINRA, filing fee and the exchange listing fee.
Amount to be paid | |
SEC registration fee .............................................................................................................................. | $289,044 |
FINRA filing fee ................................................................................................................................... | $225,500 |
Exchange listing fee .............................................................................................................................. | $150,000 |
Accounting fees and expenses .............................................................................................................. | $3,000,000 |
Legal fees and expenses ........................................................................................................................ | $3,750,000 |
Printing and engraving expenses .......................................................................................................... | $200,000 |
Transfer agent and registrar fees ........................................................................................................... | $15,000 |
Miscellaneous expenses ........................................................................................................................ | $1,573,724 |
Total ...................................................................................................................................................... | $9,203,268 |
Item 14. Indemnification of directors and officers.
Section 102 of the General Corporation Law of the State of Delaware permits a corporation to eliminate the
personal liability of directors of a corporation to the corporation or its stockholders for monetary damages for a
breach of fiduciary duty as a director, except where the director breached his duty of loyalty, failed to act in good
faith, engaged in intentional misconduct or knowingly violated a law, authorized the payment of a dividend or
approved a stock repurchase in violation of Delaware corporate law or obtained an improper personal benefit. Our
Amended Charter will provide that no director of Fervo Energy Company shall be personally liable to it or its
stockholders for monetary damages for any breach of fiduciary duty as a director, notwithstanding any provision of
law imposing such liability, except to the extent that the General Corporation Law of the State of Delaware prohibits
the elimination or limitation of liability of directors for breaches of fiduciary duty.
Section 145 of the General Corporation Law of the State of Delaware provides that a corporation has the power
to indemnify a director, officer, employee, or agent of the corporation, or a person serving at the request of the
corporation for another corporation, partnership, joint venture, trust or other enterprise in related capacities against
expenses (including attorneys’ fees), judgments, fines and amounts paid in settlement actually and reasonably
incurred by the person in connection with an action, suit or proceeding to which he was or is a party or is threatened
to be made a party to any threatened, ending or completed action, suit or proceeding by reason of such position, if
such person acted in good faith and in a manner he reasonably believed to be in or not opposed to the best interests
of the corporation, and, in any criminal action or proceeding, had no reasonable cause to believe his conduct was
unlawful, except that, in the case of actions brought by or in the right of the corporation, no indemnification shall be
made with respect to any claim, issue or matter as to which such person shall have been adjudged to be liable to the
corporation unless and only to the extent that the Court of Chancery or other adjudicating court determines that,
despite the adjudication of liability but in view of all of the circumstances of the case, such person is fairly and
reasonably entitled to indemnity for such expenses which the Court of Chancery or such other court shall deem
proper.
Upon consummation of this offering, our Amended Charter and Amended Bylaws will provide indemnification
for our directors and officers to the fullest extent permitted by the General Corporation Law of the State of
Delaware. We will indemnify each person who was or is a party or threatened to be made a party to any threatened,
pending or completed action, suit or proceeding (other than an action by or in the right of us) by reason of the fact
II-2
that he or she is or was, or has agreed to become, a director or officer, or is or was serving, or has agreed to serve, at
our request as a director, officer, partner, employee or trustee of, or in a similar capacity with, another corporation,
partnership, joint venture, trust or other enterprise (all such persons being referred to as an “Indemnitee”), or by
reason of any action alleged to have been taken or omitted in such capacity, against all expenses (including
attorneys’ fees), judgments, fines and amounts paid in settlement actually and reasonably incurred in connection
with such action, suit or proceeding and any appeal therefrom, if such Indemnitee acted in good faith and in a
manner he or she reasonably believed to be in, or not opposed to, our best interests, and, with respect to any criminal
action or proceeding, he or she had no reasonable cause to believe his or her conduct was unlawful. Our Amended
Charter and Amended Bylaws will provide that we will indemnify any Indemnitee who was or is a party to an action
or suit by or in the right of us to procure a judgment in our favor by reason of the fact that the Indemnitee is or was,
or has agreed to become, a director or officer, or is or was serving, or has agreed to serve, at our request as a
director, officer, partner, employee or trustee of, or in a similar capacity with, another corporation, partnership, joint
venture, trust or other enterprise, or by reason of any action alleged to have been taken or omitted in such capacity,
against all expenses (including attorneys’ fees) and, to the extent permitted by law, amounts paid in settlement
actually and reasonably incurred in connection with such action, suit or proceeding, and any appeal therefrom, if the
Indemnitee acted in good faith and in a manner he or she reasonably believed to be in, or not opposed to, our best
interests, except that no indemnification shall be made with respect to any claim, issue or matter as to which such
person shall have been adjudged to be liable to us, unless a court determines that, despite such adjudication but in
view of all of the circumstances, he or she is entitled to indemnification of such expenses. Notwithstanding the
foregoing, to the extent that any Indemnitee has been successful, on the merits or otherwise, he or she will be
indemnified by us against all expenses (including attorneys’ fees) actually and reasonably incurred in connection
therewith. Expenses must be advanced to an Indemnitee under certain circumstances.
Prior to the consummation of this offering, we intend to enter into separate indemnification agreements with
each of our directors and executive officers. Each indemnification agreement will provide, among other things, for
indemnification to the fullest extent permitted by law and our Amended Charter and Amended Bylaws against any
and all expenses, judgments, fines, penalties and amounts paid in settlement of any claim. The indemnification
agreements will provide for the advancement or payment of all expenses to the indemnitee and for the
reimbursement to us if it is found that such indemnitee is not entitled to such indemnification under applicable law
and our Amended Charter and Amended Bylaws.
We maintain a general liability insurance policy that covers certain liabilities of directors and officers of our
corporation arising out of claims based on acts or omissions in their capacities as directors or officers.
In any underwriting agreement we enter into in connection with the sale of common stock being registered
hereby, the underwriters will agree to indemnify, under certain conditions, us, our directors, our officers and persons
who control us within the meaning of the Securities Act of 1933, as amended, or the Securities Act, against certain
liabilities.
Item 15. Recent sales of unregistered securities.
Set forth below is information regarding all unregistered securities sold by us since January 1, 2023. Also
included is the consideration received by us for such shares and information relating to the section of the Securities
Act, or rule of the SEC, under which exemption from registration was claimed.
Convertible Notes
In 2023, we issued and sold an aggregate principal amount of $10.0 million of convertible notes to an existing
strategic corporate investor (the “CN Notes”). The CN Notes were converted into 4,766,559 shares of Series D‑2
Preferred Stock at a conversion price of $2.152455 per share upon the closing of the Company’s February 2024
Series D financing, reflecting a 15% discount to the $2.5323 per‑share cash price.
II-3
Preferred Stock Issuances
In February 2024, we issued and sold an aggregate of 68,650,241 shares of our Series D‑1 Preferred Stock, par
value $0.0001 per share, to institutional and strategic investors at a purchase price of $2.53, for an aggregate price of
approximately $173.8 million.
In August 2024, we issued and sold an aggregate of 23,693,875 shares of our Series D‑1 Preferred Stock, par
value $0.0001 per share, to institutional and strategic investors at a purchase price of $2.53, for an aggregate price of
approximately $60.0 million.
In December 2024, we issued and sold an aggregate of 25,467,691 shares of our Series D‑3 Preferred Stock, par
value $0.0001 per share, to institutional and strategic investors at a purchase price of $5.28, for an aggregate price of
approximately $134.5 million.
In December 2025, we issued and sold an aggregate of 56,537,255 shares of our Series E-1 Preferred Stock, par
value $0.0001 per share, to institutional and strategic investors at a purchase price of $8.17, for an aggregate price of
approximately $462 million.
In January 2026, we issued and sold an aggregate of 9,178 shares of our Series E-1 Preferred Stock, par value
$0.0001 per share, to strategic investors at a purchase price of $8.17, for an aggregate price of approximately $75
thousand.
Equity Awards
Between January 1, 2023 and the date of this registration statement, we granted to our employees and others
options to purchase an aggregate of 2,516,194 shares of Class A common stock under the Fervo Energy Company
2019 Stock Incentive Plan at a weighted average price of $0.74 per share.
The issuances of the securities in the transactions described above were deemed to be exempt from registration
under the Securities Act in reliance upon Section 4(a)(2) of the Securities Act and/or Rule 506, Rule 701 or
Regulation S promulgated thereunder. The securities were issued directly by us and did not involve a public offering
or general solicitation. The recipients of such securities represented their intentions to acquire the securities for
investment purposes only and not with a view to, or for sale in connection with, any distribution thereof.
None of the transactions set forth in Item 15 involved any underwriters, underwriting discounts or commissions
or any public offering. All recipients had adequate access, through their relationships with us, to information about
us. The sales of these securities were made without any general solicitation or advertising.
Item 16. Exhibits and financial statements.
(a)Exhibits
The exhibits filed herewith are set forth on the Index to Exhibits filed as a part of this Registration Statement
beginning on page II-10 hereof.
(b)Financial Statement Schedules
Schedule I - Condensed Financial Information of Parent (Fervo Energy Company) as of and for the years ended
December 31, 2024 and December 31, 2025.
II-4
Schedule I - Condensed Financial Information of Fervo Energy Company (Parent Company Only)
Fervo Energy Company
Condensed Balance Sheets of Parent
(Dollars and shares in thousands) | As of December 31, | ||
2025 | 2024 | ||
ASSETS | |||
Current assets: | |||
Cash and cash equivalents .................................................................................... | $447,933 | $185,761 | |
Other current assets ............................................................................................... | 12,611 | 2,026 | |
Total current assets ............................................................................................. | 460,544 | 187,787 | |
Investment in subsidiaries ....................................................................................... | 483,807 | 243,642 | |
Other assets ............................................................................................................. | 16,083 | 1,951 | |
Total assets ......................................................................................................... | $960,434 | 433,380 | |
LIABILITIES AND EQUITY | |||
Current liabilities: | |||
Accounts payable .................................................................................................. | $10,789 | $20,524 | |
Accrued capital expenditures ................................................................................ | 78,708 | 20,654 | |
Due to Cape Phase I Intermediate HoldCo, LLC ................................................. | 63,349 | — | |
Other current liabilities ......................................................................................... | 13,476 | 7,504 | |
Total current liabilities ....................................................................................... | 166,322 | 48,682 | |
Other long-term liabilities ....................................................................................... | 17,668 | 393 | |
Total liabilities .................................................................................................... | 183,990 | 49,075 | |
Redeemable convertible preferred stock | |||
Redeemable convertible preferred stock, par value $0.0001 per share; 283,546 and 223,458 authorized; 279,995 and 223,458 issued and outstanding as of December 31, 2025 and 2024, respectively ........................................................ | 1,022,942 | 561,500 | |
Stockholders’ deficit: | |||
Common stock, par value $0.0001 per share; 358,279 and 280,000 authorized; 12,771 and 12,470 issued and outstanding as of December 31, 2025 and 2024, respectively ............................................................................................... | 1 | 1 | |
Additional paid-in capital ..................................................................................... | — | 2,582 | |
Treasury stock, at cost; 375 and 0 shares as of December 31, 2025 and 2024, respectively ........................................................................................................ | (1,960) | — | |
Accumulated deficit .............................................................................................. | (244,539) | (179,778) | |
Total stockholders’ deficit .................................................................................. | (246,498) | (177,195) | |
Total liabilities, redeemable convertible preferred stock, and stockholders’ deficit ............................................................................................................... | $960,434 | $433,380 | |
The accompanying note is an integral part of these condensed financial statements of parent.
II-5
Schedule I - Condensed Financial Information of Fervo Energy Company (Parent Company Only)
Fervo Energy Company
Condensed Statements of Operations of Parent
(Dollars in thousands) | Year ended December 31, | ||
2025 | 2024 | ||
Costs and expenses: | |||
Research and development expenses, net ............................................................. | $(133) | $(97) | |
General and administrative expenses .................................................................... | 36,412 | 33,606 | |
Operating loss ..................................................................................................... | (36,279) | (33,509) | |
Other income (expense): | |||
Interest income ...................................................................................................... | 4,192 | 1,478 | |
Other non-operating expense ................................................................................ | (2,769) | (439) | |
Equity in loss of subsidiaries ................................................................................ | (22,932) | (8,640) | |
Net loss ............................................................................................................... | $(57,788) | $(41,110) | |
The accompanying note is an integral part of these condensed financial statements of parent.
II-6
Schedule I - Condensed Financial Information of Fervo Energy Company (Parent Company Only)
Fervo Energy Company
Condensed Statements of Redeemable Convertible Preferred Stock and Stockholders’ Deficit of Parent
(Dollars and shares in thousands) | Redeemable Convertible Preferred Stock | Common Stock | Treasury Stock | Additional paid-in capital | Accumulated Deficit | Total Stockholders’ Deficit | ||||||||||||
Shares | Amount | Shares | Amount | Shares | Amount | |||||||||||||
Balance at January 1, 2024 ............ | 100,768 | $182,257 | 12,341 | $1 | — | $— | $1,142 | $(138,668) | $(137,525) | |||||||||
Issuance of Series D-1 redeemable convertible preferred stock, net of issuance costs of $1,090 ............... | 92,344 | 232,753 | — | — | — | — | — | — | — | |||||||||
Conversion of 2023 convertible notes to Series D-2 redeemable convertible preferred stock ........... | 4,766 | 12,025 | — | — | — | — | — | — | — | |||||||||
Issuance of Series D-3 redeemable convertible preferred stock, net of issuance costs of $627 .................. | 25,468 | 133,873 | — | — | — | — | — | — | — | |||||||||
Issuance of Series D-4 redeemable convertible preferred stock ........... | 112 | 592 | — | — | — | — | — | — | — | |||||||||
Stock-based compensation ............... | — | — | — | — | — | — | 1,370 | — | 1,370 | |||||||||
Exercise of stock-based awards by employees and directors ............... | — | — | 129 | — | — | — | 70 | — | 70 | |||||||||
Net loss ............................................. | — | — | — | — | — | — | — | (41,110) | (41,110) | |||||||||
Balance at December 31, 2024 ....... | 223,458 | $561,500 | 12,470 | $1 | — | $— | $2,582 | $(179,778) | $(177,195) | |||||||||
Remeasurement of redeemable non controlling interests in subsidiaries ................................... | — | — | — | — | — | — | (5,754) | (6,973) | (12,727) | |||||||||
Issuance of Series E redeemable convertible preferred stock, net of issuance cost of $558 .................... | 56,537 | 461,442 | — | — | — | — | — | — | ||||||||||
Repurchase of Shares ....................... | — | — | — | — | 375 | (1,960) | — | — | (1,960) | |||||||||
Stock-based compensation ............... | — | — | — | — | — | — | 2,665 | — | 2,665 | |||||||||
Exercise of stock-based awards by employees and directors ............... | — | — | 676 | — | — | — | 507 | — | 507 | |||||||||
Net loss ............................................. | — | — | — | — | — | (57,788) | (57,788) | |||||||||||
Balance at December 31, 2025 ....... | 279,995 | $1,022,942 | 13,146 | $1 | 375 | $(1,960) | $— | $(244,539) | $(246,498) | |||||||||
The accompanying note is an integral part of these condensed financial statements of parent.
II-7
Schedule I - Condensed Financial Information of Fervo Energy Company (Parent Company Only)
Fervo Energy Company
Condensed Statements of Cash Flows of Parent
(Dollars in thousands) | Year ended December 31, | ||
2025 | 2024 | ||
Cash flows from operating activities: | |||
Net cash used in operating activities ................................................................ | $(31,392) | $(9,483) | |
Cash flows from investing activities: | |||
Investment in subsidiaries ..................................................................................... | (171,243) | (194,437) | |
Other investing activities ...................................................................................... | (2,008) | (176) | |
Net cash used in investing activities ................................................................ | (173,251) | (194,613) | |
Cash flows from financing activities: | |||
Proceeds from issuance of common stock ........................................................... | 492 | 70 | |
Proceeds from issuance of redeemable convertible preferred stock ..................... | 462,000 | 368,343 | |
Issuance costs related to redeemable convertible preferred stock ........................ | (558) | (1,717) | |
Proceeds from issuance of warrants | 6,824 | — | |
Proceeds from issuance of SAFE .......................................................................... | — | 500 | |
Proceeds paid for repurchase treasury shares | (1,943) | — | |
Net cash provided by financing activities ........................................................ | 466,815 | 367,196 | |
Net change in cash and cash equivalents ................................................................... | 262,172 | 163,100 | |
Cash and cash equivalents at beginning of period ..................................................... | 185,761 | 22,661 | |
Cash and cash equivalents at end of period ............................................................... | $447,933 | $185,761 | |
Supplemental disclosure of cash flow information: | |||
Accrued capital expenditures (at end of period) | 151,857 | 20,654 | |
Non- cash contribution to subsidiaries - Remeasurement of redeemable noncontrolling interests in subsidiaries ............................................................. | 12,727 | — | |
Non-cash activity related to conversion of SAFE ................................................ | — | 592 | |
Non-cash activity related to conversion of convertible note ............................... | — | 12,025 | |
The accompanying note is an integral part of these condensed financial statements of parent.
II-8
Schedule I - Condensed Financial Information of Fervo Energy Company (Parent Company Only)
Fervo Energy Company
Note to condensed financial statements of parent
NOTE 1 – BASIS OF PRESENTATION
The condensed financial statements of parent have been prepared in accordance with Rule 12-04, Schedule I of
Regulation S-X, as the restricted net assets of the subsidiaries of Fervo Energy Company (as defined in Rule
4-08(e)(3) of Regulation S-X) exceed the specified threshold amount of the consolidated net assets of the Company.
Because the Company has a consolidated accumulated deficit, the 25% threshold described in Rule 4-08 does not
apply and any restrictions of net assets at the subsidiaries trigger the requirement to present parent company-only
financial information. There are restrictions in the Mercuria Credit Agreement, as described in Note 8 – Common
Stock to the Fervo Energy Company consolidated financial statements, which includes certain covenants limiting the
ability of the Company’s subsidiaries to make cash distributions to Fervo Energy Company. Accordingly, the
condensed financial statements of parent in this Schedule is presented on a parent-only basis in which Fervo Energy
Company’s investments in its consolidated subsidiaries are presented under the equity method of accounting. The
condensed financial statements of parent should be read in conjunction with the Fervo Energy Company
consolidated financial statements.
Fervo conducts geothermal exploration, drilling, and power generation activities through various wholly owned
project subsidiaries, including entities formed for well field development, construction and operation of power
generation facilities, and fulfillment of long-term power purchase agreements (“PPAs”).
The schedule below details the Company’s other current liabilities presented in the Condensed Balance Sheets
of Parent for the periods indicated:
(Dollars in thousands) | As of December 31, | ||
2025 | 2024 | ||
Accrued expenses ...................................................................................................... | $6,611 | $2,784 | |
Bonus accrual ............................................................................................................ | 4,830 | 2,591 | |
Deferred grant income ............................................................................................... | 888 | 1,479 | |
Operating lease liabilities .......................................................................................... | 583 | 576 | |
Payroll liabilities ........................................................................................................ | 564 | 74 | |
Total other current liabilities ..................................................................................... | $13,476 | $7,504 | |
II-9
Item 17. Undertakings.
(a)The undersigned registrant hereby undertakes to provide to the underwriters at the closing specified in the
underwriting agreement certificates in such denominations and registered in such names as required by the
underwriters to permit prompt delivery to each purchaser.
(b)Insofar as indemnification for liabilities arising under the Securities Act may be permitted to directors,
officers and controlling persons of the registrant pursuant to the foregoing provisions, or otherwise, the
registrant has been advised that in the opinion of the SEC such indemnification is against public policy as
expressed in the Securities Act and is, therefore, unenforceable. In the event that a claim for
indemnification against such liabilities (other than the payment by the registrant of expenses incurred or
paid by a director, officer or controlling person of the registrant in the successful defense of any action, suit
or proceeding) is asserted by such director, officer or controlling person in connection with the securities
being registered, the registrant will, unless in the opinion of its counsel the matter has been settled by
controlling precedent, submit to a court of appropriate jurisdiction, the question whether such
indemnification by it is against public policy as expressed in the Securities Act and will be governed by the
final adjudication of such issue.
(c)The undersigned hereby further undertakes that:
(1)For purposes of determining any liability under the Securities Act the information omitted from the
form of prospectus filed as part of this registration statement in reliance upon Rule 430A and contained
in a form of prospectus filed by the registrant pursuant to Rule 424(b)(1) or (4) or 497(h) under the
Securities Act shall be deemed to be part of this registration statement as of the time it was declared
effective.
(2)For the purpose of determining any liability under the Securities Act each post-effective amendment
that contains a form of prospectus shall be deemed to be a new registration statement relating to the
securities offered therein, and the offering of such securities at that time shall be deemed to be the
initial bona fide offering thereof.
(3)For the purpose of determining liability of the registrant under the Securities Act of 1933 to any
purchaser in the initial distribution of the securities, the undersigned registrant undertakes that in a
primary offering of securities of the undersigned registrant pursuant to this registration statement,
regardless of the underwriting method used to sell the securities to the purchaser, if the securities are
offered or sold to such purchaser by means of any of the following communications, the undersigned
registrant will be a seller to the purchaser and will be considered to offer or sell such securities to such
purchaser:
(i)Any preliminary prospectus or prospectus of the undersigned registrant relating to the offering
required to be filed pursuant to Rule 424 under the Securities Act;
(ii)Any free writing prospectus relating to the offering prepared by or on behalf of the undersigned
registrant or used or referred to by the undersigned registrant;
(iii)The portion of any other free writing prospectus relating to the offering containing material
information about the undersigned registrant or its securities provided by or on behalf of the
undersigned registrant; and
(iv)Any other communication that is an offer in the offering made by the undersigned registrant to the
purchaser.
II-10
INDEX TO EXHIBITS
Exhibit No. | ||
1.1** | ||
3.1** | ||
3.2 | ||
3.3** | ||
3.4** | ||
4.1** | ||
4.2** | ||
5.1 | ||
10.1†** | ||
10.1(a)†** | ||
10.1(b)†** | ||
10.1(c)†** | ||
10.1(d)†+* * | ||
10.1(e)†+* * | ||
10.2†** | ||
10.2(a)†** | ||
10.2(b)†** | ||
10.3†** | ||
10.4†** | ||
10.5†** | ||
10.6†** | ||
10.7†** | ||
10.8** | ||
10.9+** | ||
10.10+** | ||
10.11+** | ||
10.12+** | ||
10.13+** | ||
10.14+** | ||
10.15+** | ||
10.16+** | ||
10.17** |
II-11
Exhibit No. | ||
10.18** | ||
21.1** | ||
23.1 | ||
23.2 | ||
23.3 | ||
24.1** | ||
99.1+** | ||
99.2+** | ||
99.3+** | ||
99.4+** | ||
99.5+** | ||
99.6+** | ||
99.7+** | ||
99.8+** | ||
99.9+** | ||
99.10+** | ||
107 |
__________________
** Previously filed.
†Indicates a management contract or compensatory plan or arrangement.
+ Portions of this exhibit (indicated by “[***]”) have been omitted as the registrant has determined that (i) the omitted information is not
material and (ii) the omitted information is the type that the registrant treats as private or confidential.
II-12
SIGNATURES
Pursuant to the requirements of the Securities Act of 1933, as amended, Fervo Energy Company has duly
caused this registration statement to be signed on its behalf by the undersigned, thereunto duly authorized, in
Houston, Texas on this 11th day of May, 2026.
FERVO ENERGY COMPANY | |
By: | /s/ Timothy Latimer |
Name: | Timothy Latimer |
Title: | Chief Executive Officer, Chair of the Board |
Pursuant to the requirements of the Securities Act of 1933, this registration statement has been signed by the
following persons in the capacities indicated on May 11, 2026.
Signature | Title | |
/s/ Timothy Latimer | Chief Executive Officer (Principal Executive Officer), Director | |
Timothy Latimer | ||
/s/ David Ulrey | Chief Financial Officer (Principal Financial and Accounting Officer) | |
David Ulrey | ||
* | Director | |
Margaret C. Whitman | ||
* | Director | |
Robert Keehan | ||
* | Director | |
Jessica Uhl | ||
* | Director | |
Anne Cleary | ||
* | Director | |
Robert Lowe III | ||
* | Director | |
Ion Yadigaroglu |
*By: | /s/ Timothy Latimer |
Timothy Latimer | |
Attorney-in-Fact |