Exhibit 99.2
KAYNEBDC.COM KAYNE ANDERSON BDC, INC. EARNINGS PRESENTATION First Quarter 2026
2 Disclaimer and Forward-Looking Statement This presentation may contain "forward-looking statements" that involve substantial risks and uncertainties. Such statements involve known and unknown risks, uncertainties and other factors and undue reliance should not be placed thereon. These forward-looking statements are not historical facts, but rather are based on current expectations, estimates and projections about Kayne Anderson BDC, Inc. ("KBDC"), its current and prospective portfolio investments, its industry, its beliefs and opinions, and its assumptions. Words such as "anticipates," "expects," "intends," "plans," "will," "may," "continue," "believes," "seeks," "estimates," "would," "could," "should," "targets," "projects," "outlook," "potential," "predicts" and variations of these words and similar expressions are intended to identify forward-looking statements. These statements are not guarantees of future performance and are subject to risks, uncertainties and other factors, some of which are beyond KBDC's control and difficult to predict and could cause actual results to differ materially from those expressed or forecasted in the forward-looking statements including, without limitation, the risks, uncertainties and other factors identified in KBDC's filings with the SEC. All forward-looking statements speak only as of the date of this presentation. KBDC does not undertake any obligation to update or revise any forward-looking statements or any other information contained herein, except as required by applicable law.

EXECUTIVE SUMMARY
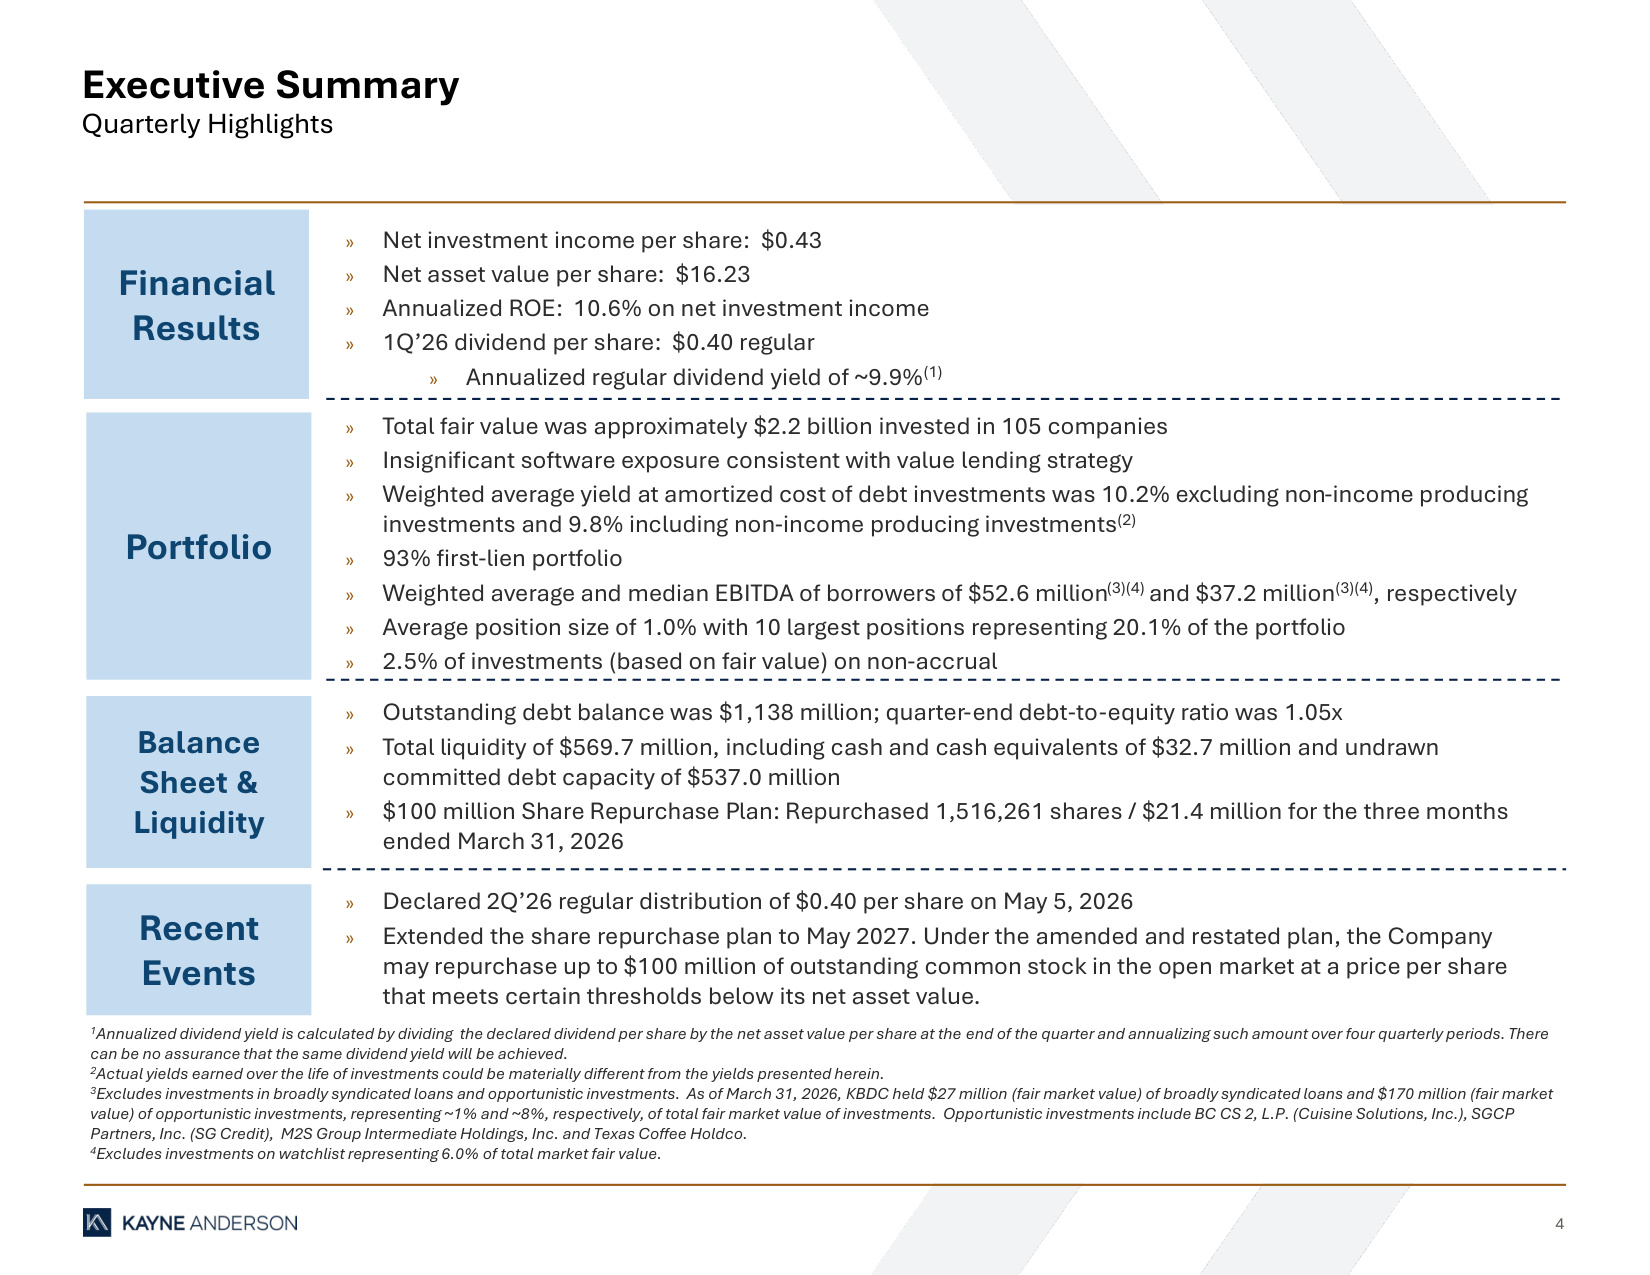
4 Executive Summary Quarterly Highlights 1Annualized dividend yield is calculated by dividing the declared dividend per share by the net asset value per share at the end of the quarter and annualizing such amount over four quarterly periods. There can be no assurance that the same dividend yield will be achieved. 2Actual yields earned over the life of investments could be materially different from the yields presented herein. 3Excludes investments in broadly syndicated loans and opportunistic investments. As of March 31, 2026, KBDC held $27 million (fair market value) of broadly syndicated loans and $170 million (fair market value) of opportunistic investments, representing ~1% and ~8%, respectively, of total fair market value of investments. Opportunistic investments include BC CS 2, L.P. (Cuisine Solutions, Inc.), SGCP Partners, Inc. (SG Credit), M2S Group Intermediate Holdings, Inc. and Texas Coffee Holdco. 4Excludes investments on watchlist representing 6.0% of total market fair value. Financial Results Portfolio Balance Sheet & Liquidity Recent Events » Net investment income per share: $0.43 » Net asset value per share: $16.23 » Annualized ROE: 10.6% on net investment income » 1Q'26 dividend per share: $0.40 regular » Annualized regular dividend yield of ~9.9%(1) » Total fair value was approximately $2.2 billion invested in 105 companies » Insignificant software exposure consistent with value lending strategy » Weighted average yield at amortized cost of debt investments was 10.2% excluding non-income producing investments and 9.8% including non-income producing investments(2) » 93% first-lien portfolio » Weighted average and median EBITDA of borrowers of $52.6 million(3)(4) and $37.2 million(3)(4), respectively » Average position size of 1.0% with 10 largest positions representing 20.1% of the portfolio » 2.5% of investments (based on fair value) on non-accrual » Outstanding debt balance was $1,138 million; quarter-end debt-to-equity ratio was 1.05x » Total liquidity of $569.7 million, including cash and cash equivalents of $32.7 million and undrawn committed debt capacity of $537.0 million » $100 million Share Repurchase Plan: Repurchased 1,516,261 shares / $21.4 million for the three months ended March 31, 2026 » Declared 2Q'26 regular distribution of $0.40 per share on May 5, 2026 » Extended the share repurchase plan to May 2027. Under the amended and restated plan, the Company may repurchase up to $100 million of outstanding common stock in the open market at a price per share that meets certain thresholds below its net asset value.
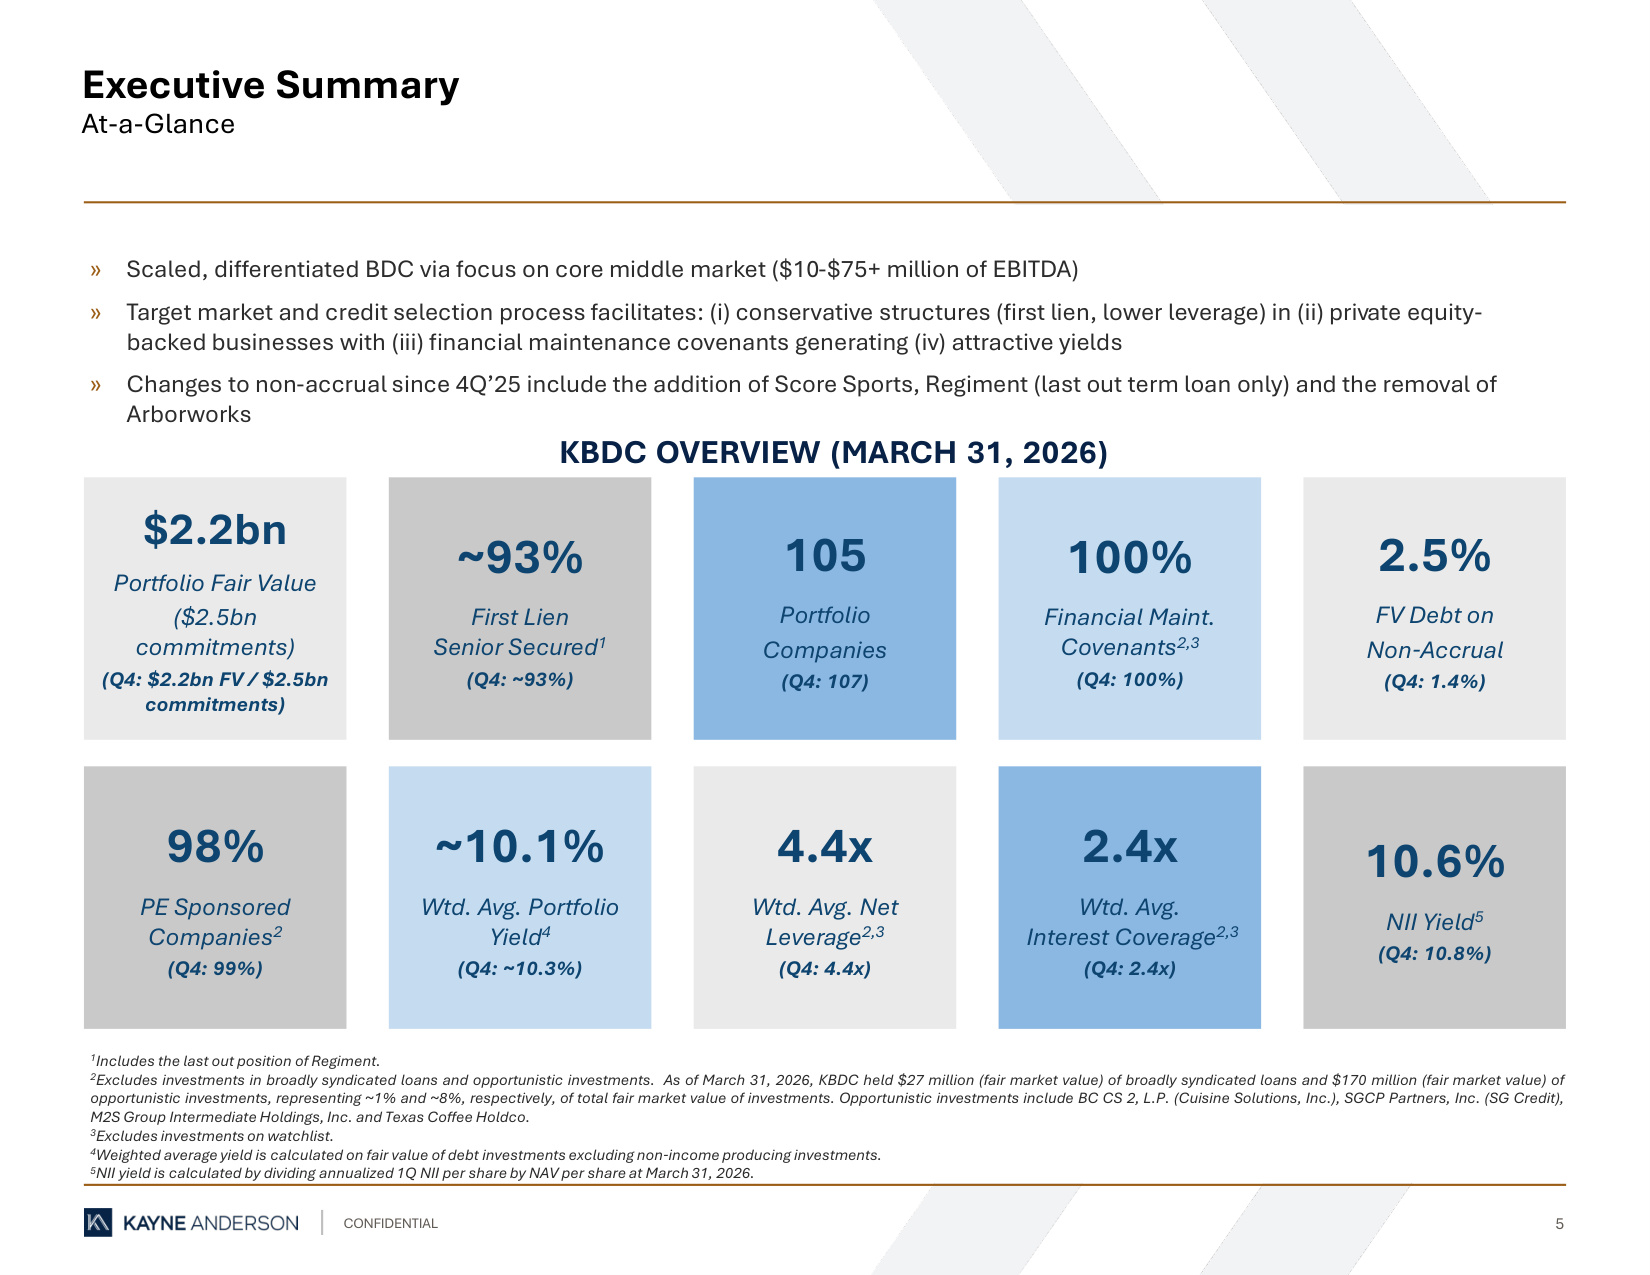
CONFIDENTIAL 5 » Scaled, differentiated BDC via focus on core middle market ($10-$75+ million of EBITDA) » Target market and credit selection process facilitates: (i) conservative structures (first lien, lower leverage) in (ii) private equity- backed businesses with (iii) financial maintenance covenants generating (iv) attractive yields » Changes to non-accrual since 4Q'25 include the addition of Score Sports, Regiment (last out term loan only) and the removal of Arborworks Executive Summary At-a-Glance 1Includes the last out position of Regiment. 2Excludes investments in broadly syndicated loans and opportunistic investments. As of March 31, 2026, KBDC held $27 million (fair market value) of broadly syndicated loans and $170 million (fair market value) of opportunistic investments, representing ~1% and ~8%, respectively, of total fair market value of investments. Opportunistic investments include BC CS 2, L.P. (Cuisine Solutions, Inc.), SGCP Partners, Inc. (SG Credit), M2S Group Intermediate Holdings, Inc. and Texas Coffee Holdco. 3Excludes investments on watchlist. 4Weighted average yield is calculated on fair value of debt investments excluding non-income producing investments. 5NII yield is calculated by dividing annualized 1Q NII per share by NAV per share at March 31, 2026. KBDC OVERVIEW (MARCH 31, 2026) $2.2bn Portfolio Fair Value ($2.5bn commitments) (Q4: $2.2bn FV / $2.5bn commitments) 100% Financial Maint. Covenants2,3 (Q4: 100%) ~93% First Lien Senior Secured1 (Q4: ~93%) 98% PE Sponsored Companies2 (Q4: 99%) 105 Portfolio Companies (Q4: 107) 2.4x Wtd. Avg. Interest Coverage2,3 (Q4: 2.4x) ~10.1% Wtd. Avg. Portfolio Yield4 (Q4: ~10.3%) 4.4x Wtd. Avg. Net Leverage2,3 (Q4: 4.4x) 2.5% FV Debt on Non-Accrual (Q4: 1.4%) 10.6% NII Yield5 (Q4: 10.8%)
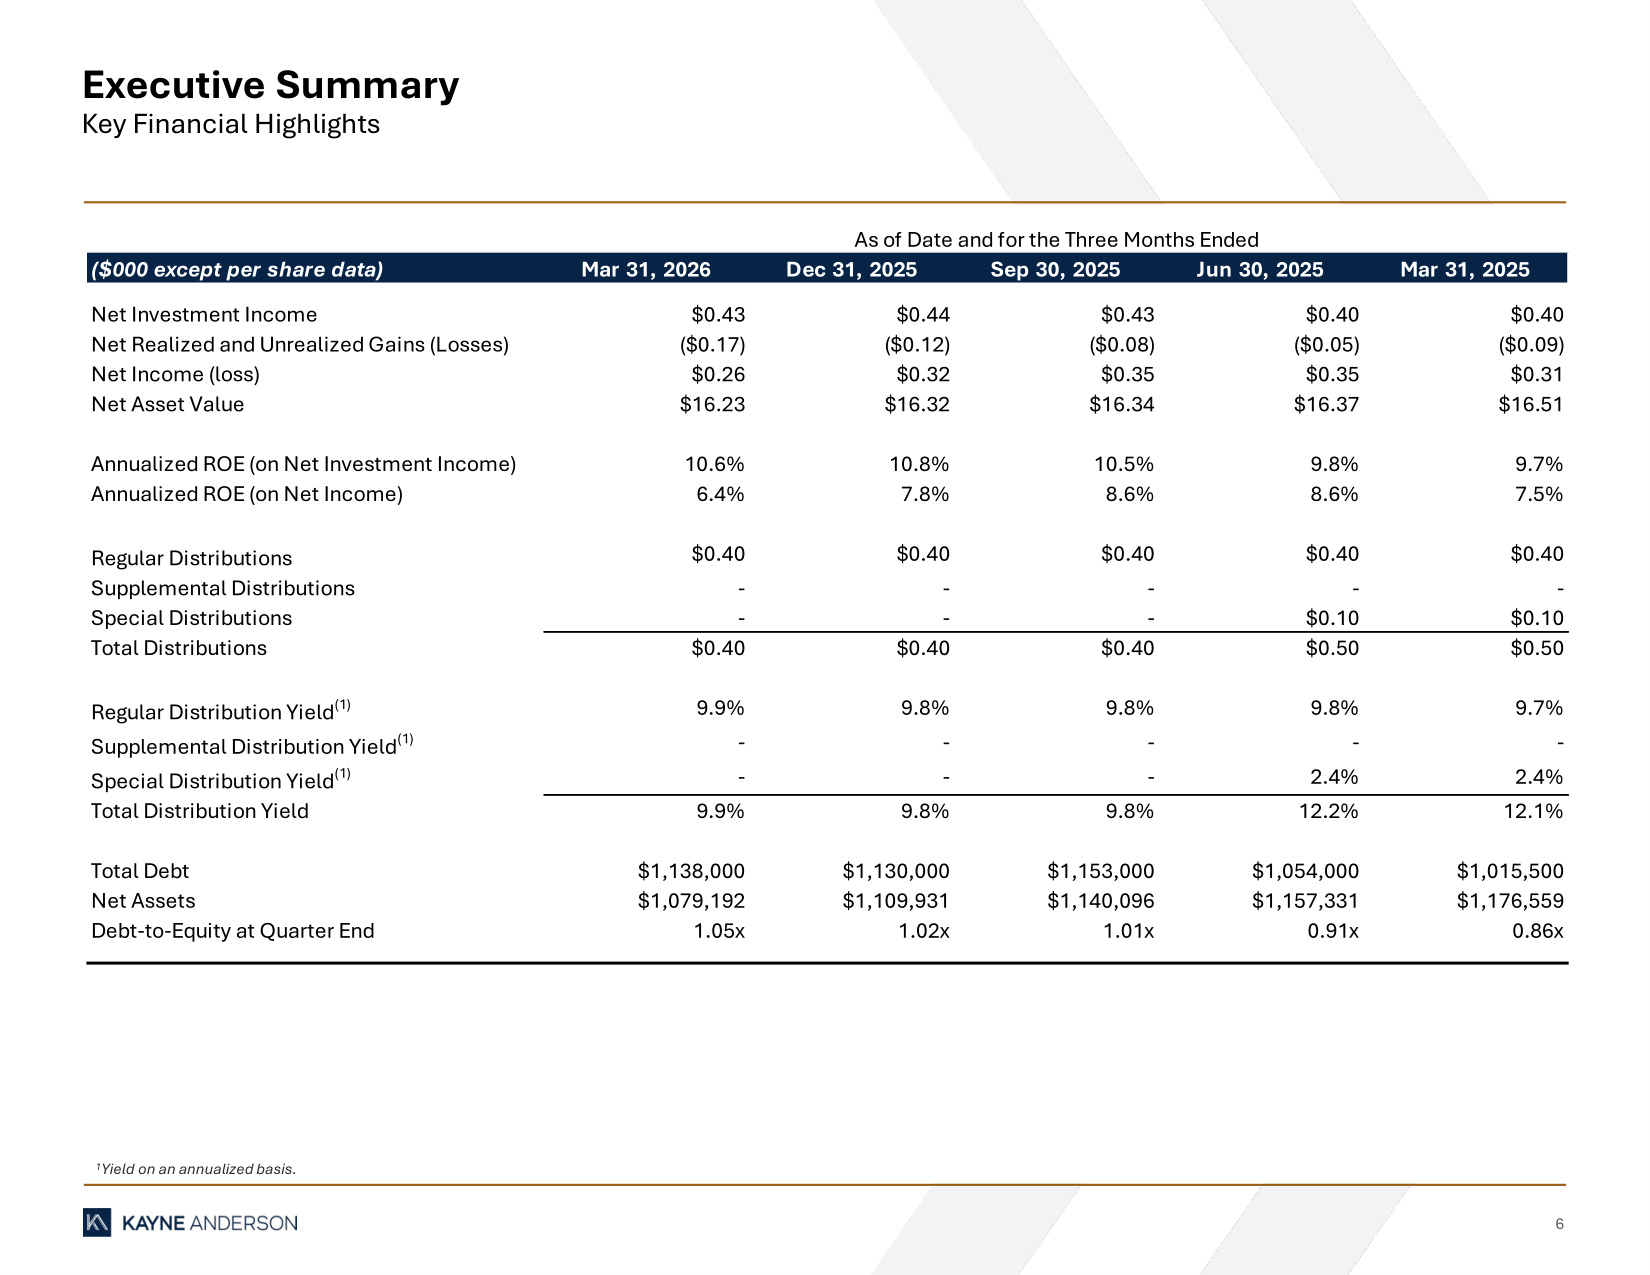
6 Executive Summary Key Financial Highlights 1Yield on an annualized basis. ($000 except per share data) Mar 31, 2026 Dec 31, 2025 Sep 30, 2025 Jun 30, 2025 Mar 31, 2025 Net Investment Income $0.43 $0.44 $0.43 $0.40 $0.40 Net Realized and Unrealized Gains (Losses) ($0.17) ($0.12) ($0.08) ($0.05) ($0.09) Net Income (loss) $0.26 $0.32 $0.35 $0.35 $0.31 Net Asset Value $16.23 $16.32 $16.34 $16.37 $16.51 Annualized ROE (on Net Investment Income) 10.6% 10.8% 10.5% 9.8% 9.7% Annualized ROE (on Net Income) 6.4% 7.8% 8.6% 8.6% 7.5% Regular Distributions $0.40 $0.40 $0.40 $0.40 $0.40 Supplemental Distributions - - - - - Special Distributions - - - $0.10 $0.10 Total Distributions $0.40 $0.40 $0.40 $0.50 $0.50 Regular Distribution Yield(1) 9.9% 9.8% 9.8% 9.8% 9.7% Supplemental Distribution Yield(1) - - - - - Special Distribution Yield(1) - - - 2.4% 2.4% Total Distribution Yield 9.9% 9.8% 9.8% 12.2% 12.1% Total Debt $1,138,000 $1,130,000 $1,153,000 $1,054,000 $1,015,500 Net Assets $1,079,192 $1,109,931 $1,140,096 $1,157,331 $1,176,559 Debt-to-Equity at Quarter End 1.05x 1.02x 1.01x 0.91x 0.86x As of Date and for the Three Months Ended

PORTFOLIO OVERVIEW
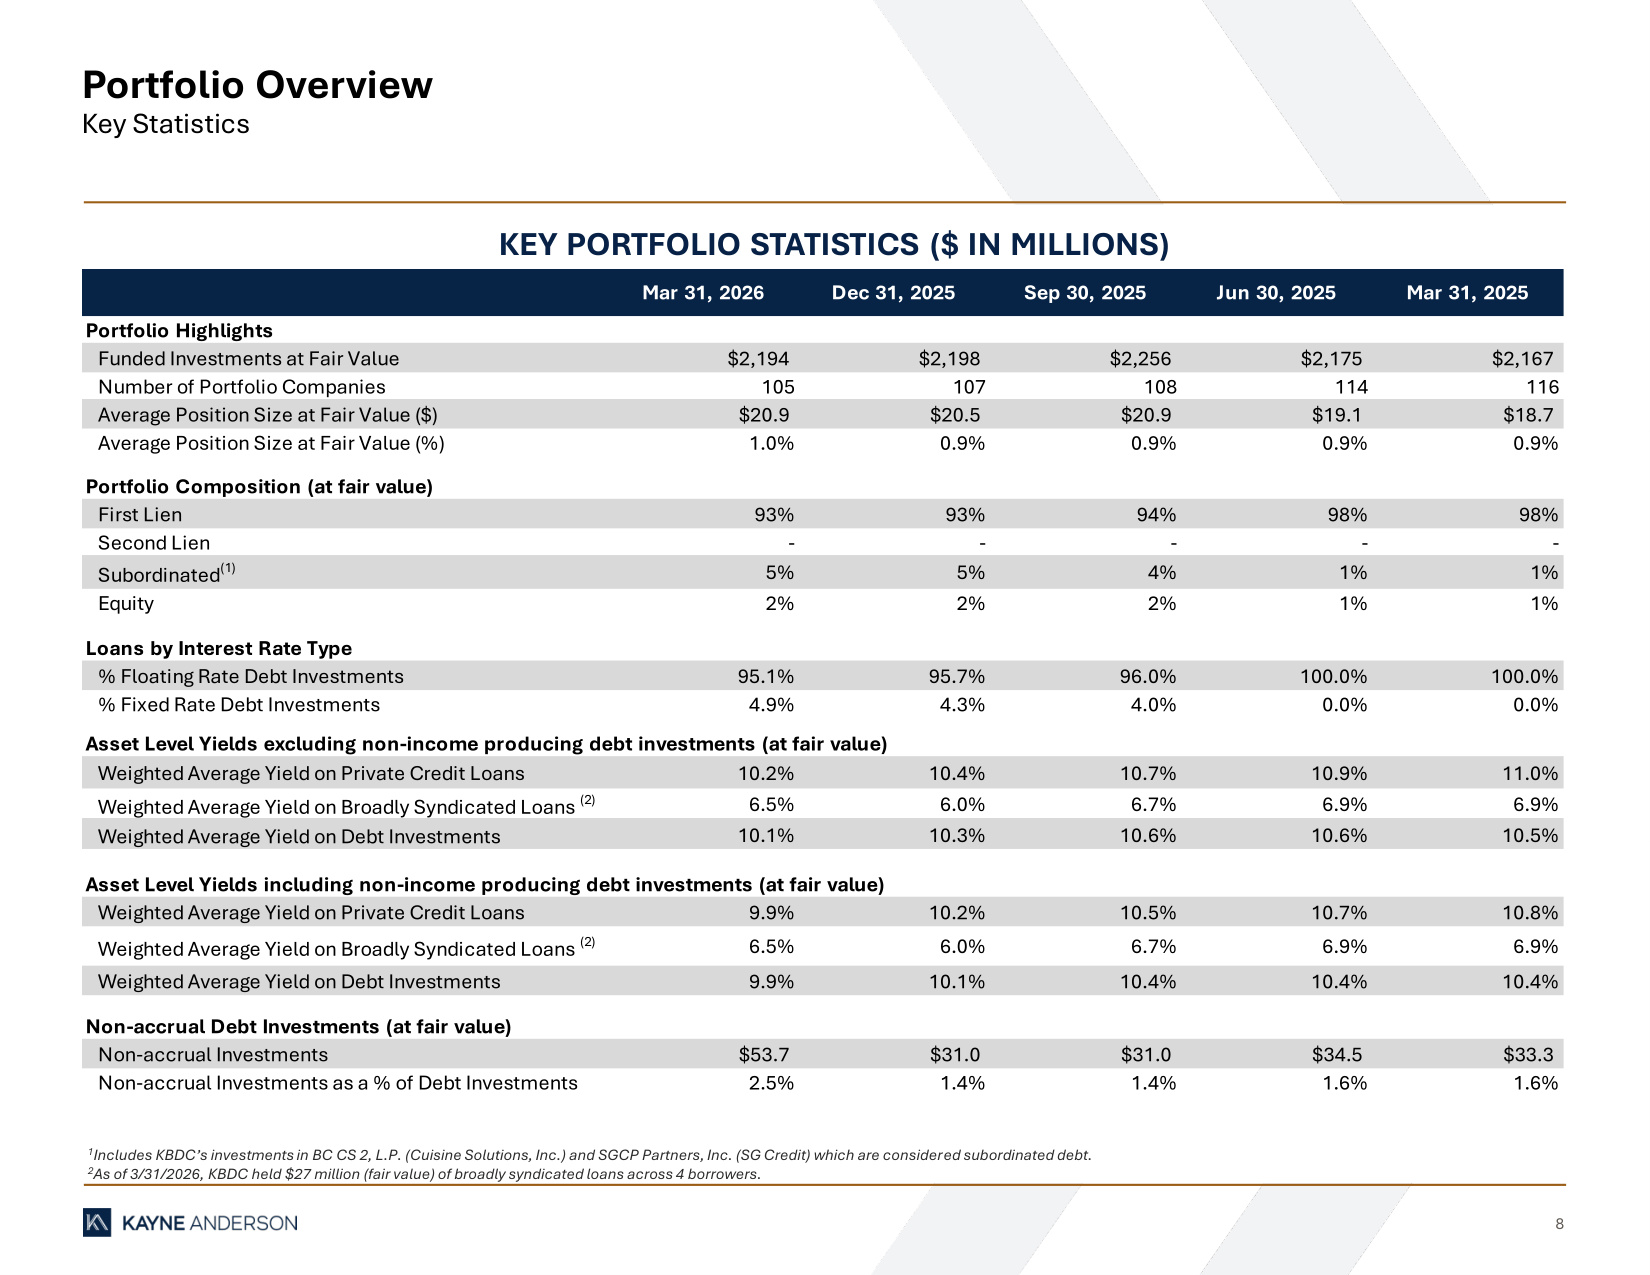
8 Portfolio Overview Key Statistics 1Includes KBDC's investments in BC CS 2, L.P. (Cuisine Solutions, Inc.) and SGCP Partners, Inc. (SG Credit) which are considered subordinated debt. 2As of 3/31/2026, KBDC held $27 million (fair value) of broadly syndicated loans across 4 borrowers. KEY PORTFOLIO STATISTICS ($ IN MILLIONS) Mar 31, 2026 Dec 31, 2025 Sep 30, 2025 Jun 30, 2025 Mar 31, 2025 Portfolio Highlights Funded Investments at Fair Value $2,194 $2,198 $2,256 $2,175 $2,167 Number of Portfolio Companies 105 107 108 114 116 Average Position Size at Fair Value ($) $20.9 $20.5 $20.9 $19.1 $18.7 Average Position Size at Fair Value (%) 1.0% 0.9% 0.9% 0.9% 0.9% Portfolio Composition (at fair value) First Lien 93% 93% 94% 98% 98% Second Lien - - - - - Subordinated(1) 5% 5% 4% 1% 1% Equity 2% 2% 2% 1% 1% Loans by Interest Rate Type % Floating Rate Debt Investments 95.1% 95.7% 96.0% 100.0% 100.0% % Fixed Rate Debt Investments 4.9% 4.3% 4.0% 0.0% 0.0% Asset Level Yields excluding non-income producing debt investments (at fair value) Weighted Average Yield on Private Credit Loans 10.2% 10.4% 10.7% 10.9% 11.0% Weighted Average Yield on Broadly Syndicated Loans (2) 6.5% 6.0% 6.7% 6.9% 6.9% Weighted Average Yield on Debt Investments 10.1% 10.3% 10.6% 10.6% 10.5% Asset Level Yields including non-income producing debt investments (at fair value) Weighted Average Yield on Private Credit Loans 9.9% 10.2% 10.5% 10.7% 10.8% Weighted Average Yield on Broadly Syndicated Loans (2) 6.5% 6.0% 6.7% 6.9% 6.9% Weighted Average Yield on Debt Investments 9.9% 10.1% 10.4% 10.4% 10.4% Non-accrual Debt Investments (at fair value) Non-accrual Investments $53.7 $31.0 $31.0 $34.5 $33.3 Non-accrual Investments as a % of Debt Investments 2.5% 1.4% 1.4% 1.6% 1.6%
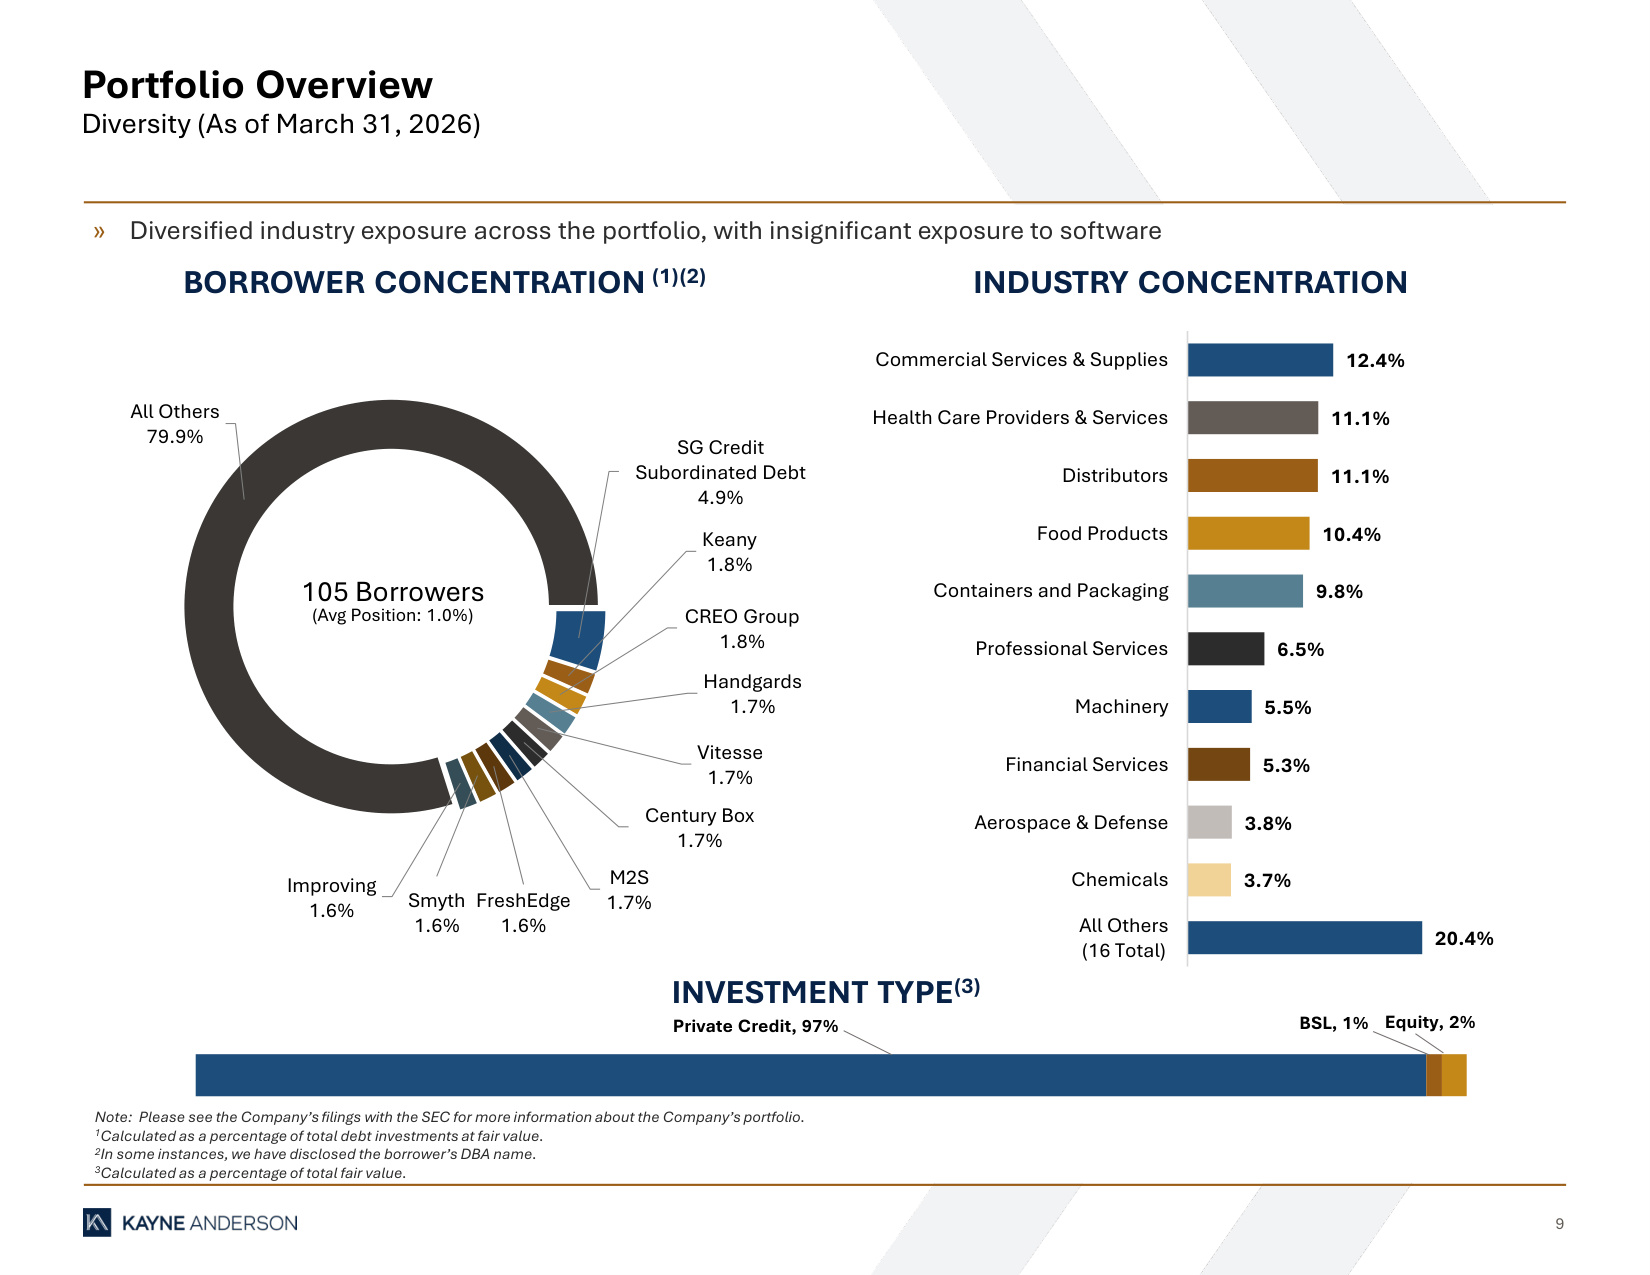
9 SG Credit Subordinated Debt 4.9% Keany 1.8% CREO Group 1.8% Handgards 1.7% Vitesse 1.7% Century Box 1.7% M2S 1.7% FreshEdge 1.6% Smyth 1.6% Improving 1.6% All Others 79.9% Portfolio Overview Diversity (As of March 31, 2026) Note: Please see the Company's filings with the SEC for more information about the Company's portfolio. 1Calculated as a percentage of total debt investments at fair value. 2In some instances, we have disclosed the borrower's DBA name. 3Calculated as a percentage of total fair value. BORROWER CONCENTRATION (1)(2) INDUSTRY CONCENTRATION INVESTMENT TYPE(3) (Avg Position: 1.0%) 105 Borrowers » Diversified industry exposure across the portfolio, with insignificant exposure to software 20.4% 3.7% 3.8% 5.3% 5.5% 6.5% 9.8% 10.4% 11.1% 11.1% 12.4% All Others (16 Total) Chemicals Aerospace & Defense Financial Services Machinery Professional Services Containers and Packaging Food Products Distributors Health Care Providers & Services Commercial Services & Supplies Private Credit, 97% BSL, 1% Equity, 2%
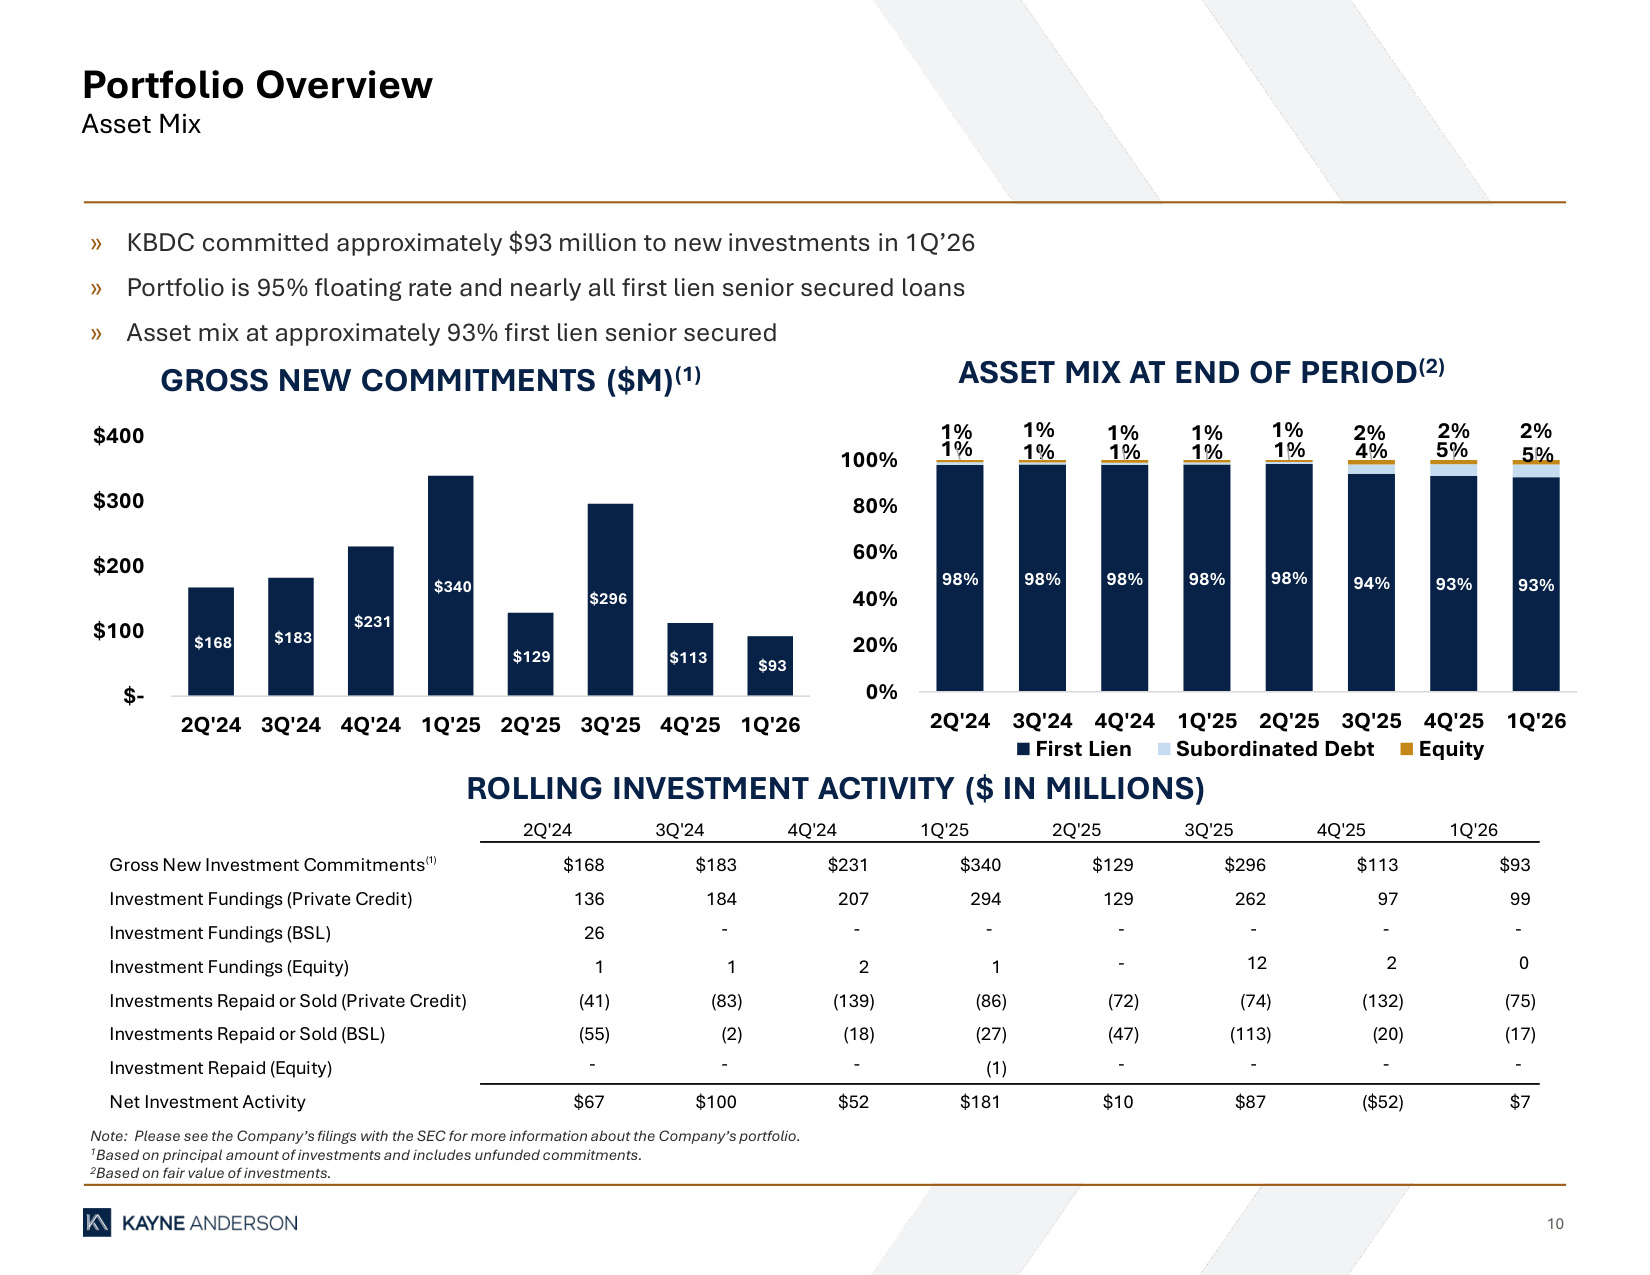
10 Portfolio Overview Asset Mix GROSS NEW COMMITMENTS ($M)(1) ASSET MIX AT END OF PERIOD(2) » KBDC committed approximately $93 million to new investments in 1Q'26 » Portfolio is 95% floating rate and nearly all first lien senior secured loans » Asset mix at approximately 93% first lien senior secured ROLLING INVESTMENT ACTIVITY ($ IN MILLIONS) Note: Please see the Company's filings with the SEC for more information about the Company's portfolio. 1Based on principal amount of investments and includes unfunded commitments. 2Based on fair value of investments. 2Q'24 3Q'24 4Q'24 1Q'25 2Q'25 3Q'25 4Q'25 1Q'26 Gross New Investment Commitments(1) $168 $183 $231 $340 $129 $296 $113 $93 Investment Fundings (Private Credit) 136 184 207 294 129 262 97 99 Investment Fundings (BSL) 26 - - - - - - - Investment Fundings (Equity) 1 1 2 1 - 12 2 0 Investments Repaid or Sold (Private Credit) (41) (83) (139) (86) (72) (74) (132) (75) Investments Repaid or Sold (BSL) (55) (2) (18) (27) (47) (113) (20) (17) Investment Repaid (Equity) - - - (1) - - - - Net Investment Activity $67 $100 $52 $181 $10 $87 ($52) $7 98% 98% 98% 98% 98% 94% 93% 93% 1% 1% 1% 1% 1% 4% 5% 5% 1% 1% 1% 1% 1% 2% 2% 2% 0% 20% 40% 60% 80% 100% 2Q'24 3Q'24 4Q'24 1Q'25 2Q'25 3Q'25 4Q'25 1Q'26 First Lien Subordinated Debt Equity $168 $183 $231 $340 $129 $296 $113 $93 $- $100 $200 $300 $400 2Q'24 3Q'24 4Q'24 1Q'25 2Q'25 3Q'25 4Q'25 1Q'26

FINANCIAL HIGHLIGHTS
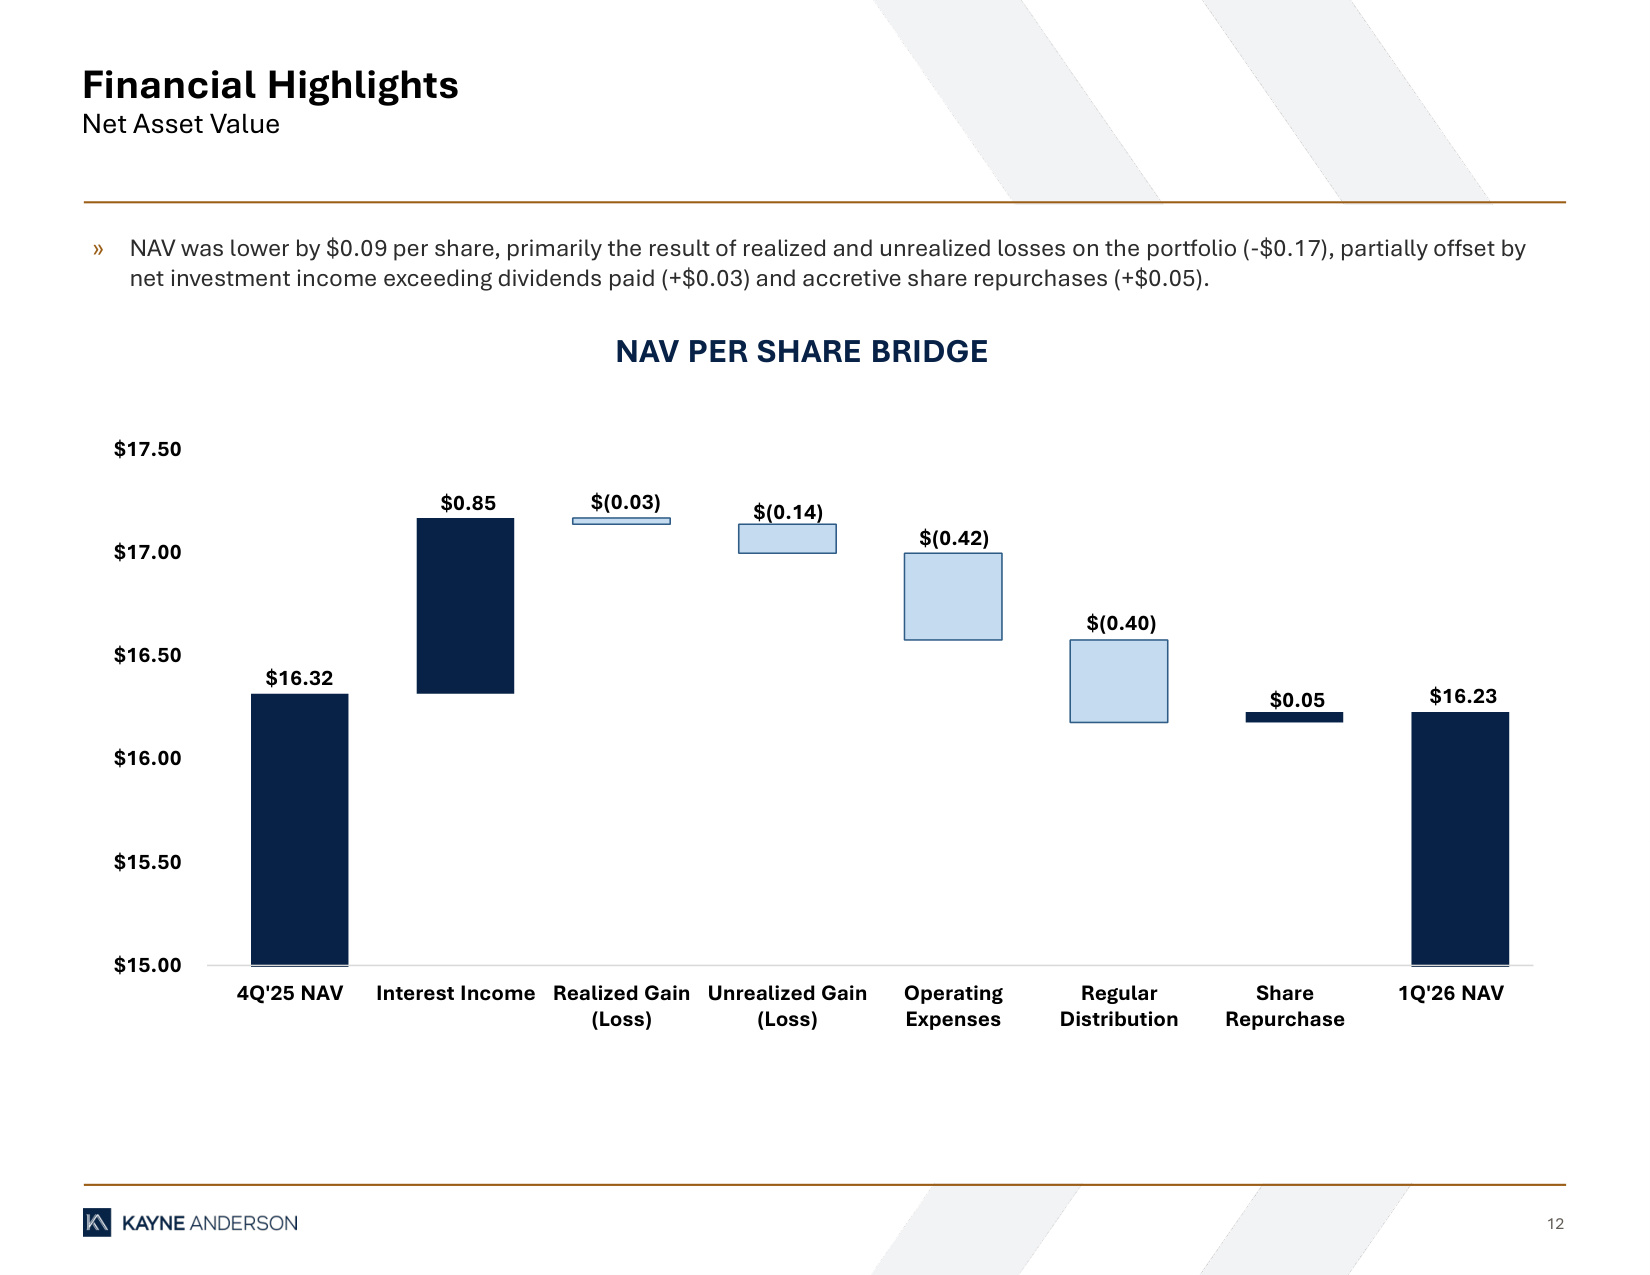
12 Financial Highlights Net Asset Value NAV PER SHARE BRIDGE » NAV was lower by $0.09 per share, primarily the result of realized and unrealized losses on the portfolio (-$0.17), partially offset by net investment income exceeding dividends paid (+$0.03) and accretive share repurchases (+$0.05). $16.32 $0.85 $(0.03) $(0.14) $(0.42) $(0.40) $0.05 $16.23 $15.00 $15.50 $16.00 $16.50 $17.00 $17.50 4Q'25 NAV Interest Income Realized Gain (Loss) Unrealized Gain (Loss) Operating Expenses Regular Distribution Share Repurchase 1Q'26 NAV
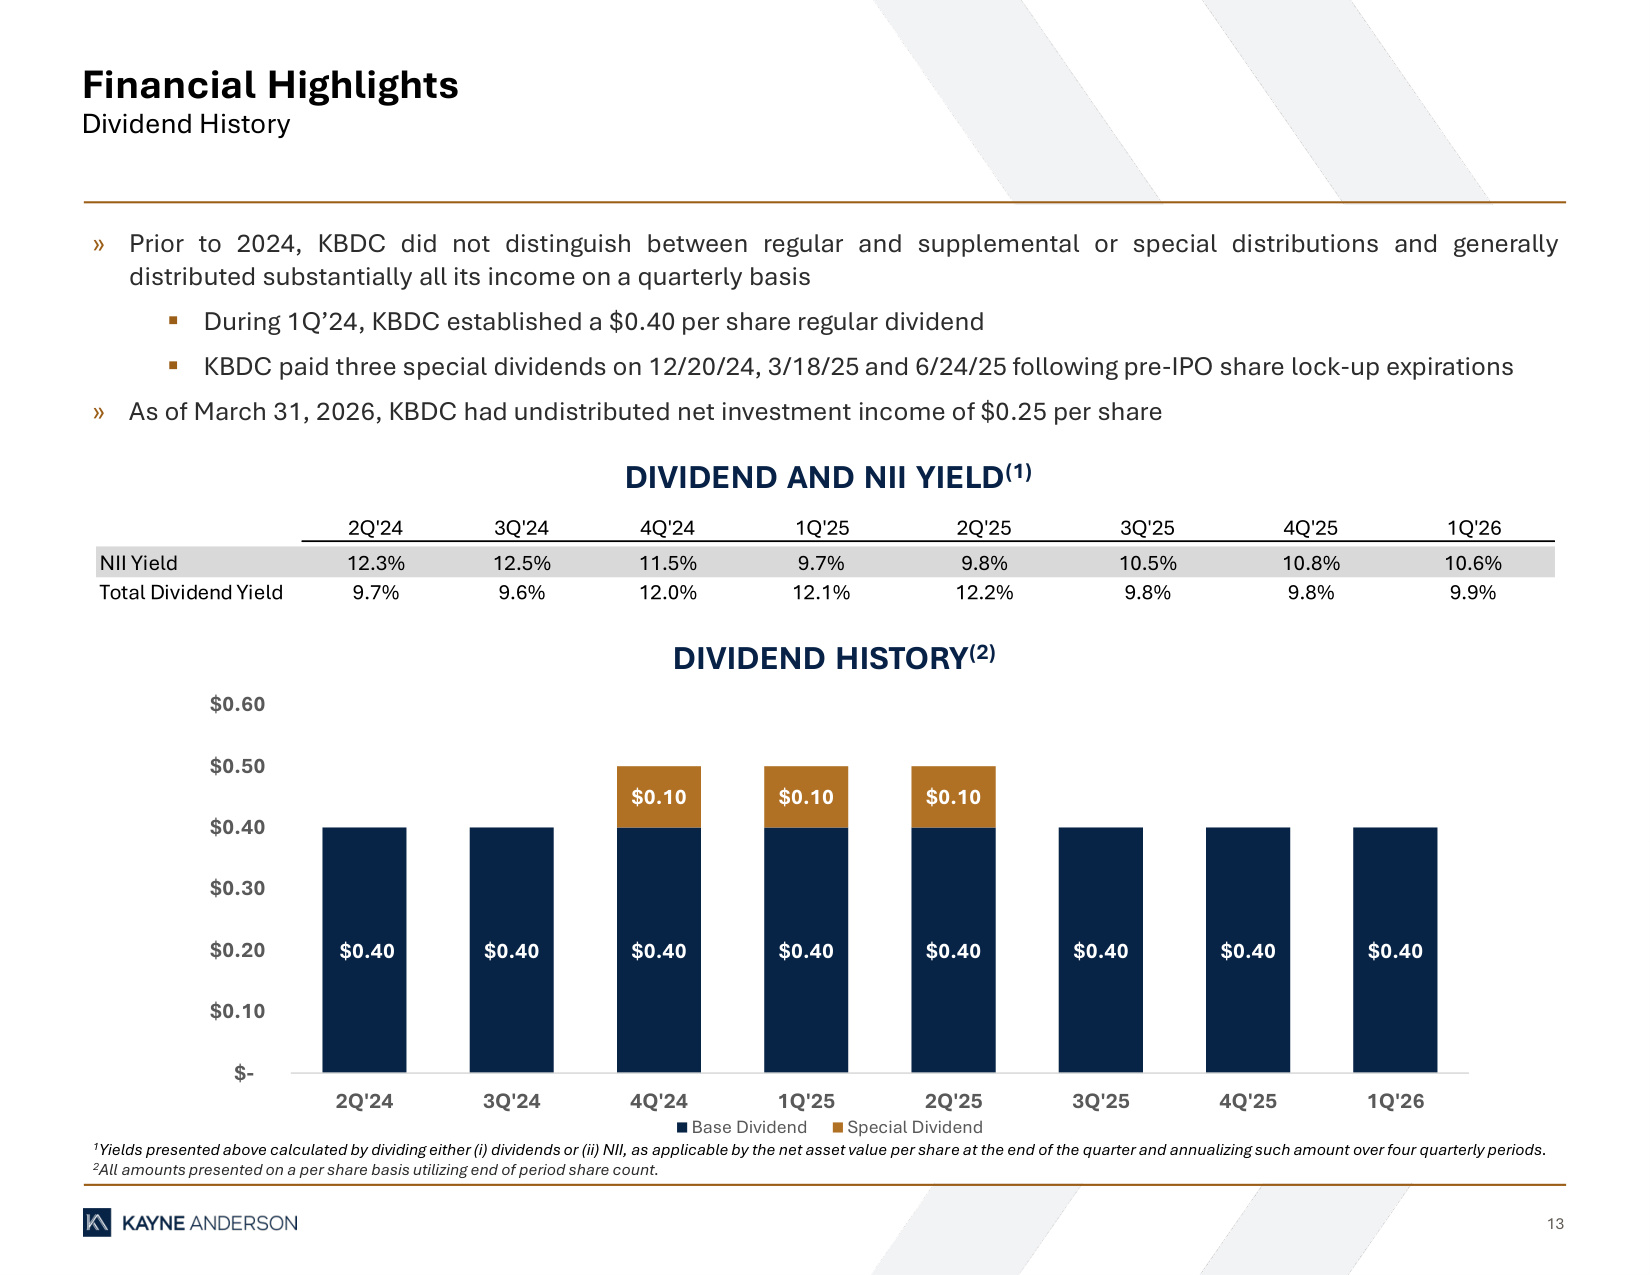
13 Financial Highlights Dividend History 1Yields presented above calculated by dividing either (i) dividends or (ii) NII, as applicable by the net asset value per share at the end of the quarter and annualizing such amount over four quarterly periods. 2All amounts presented on a per share basis utilizing end of period share count. DIVIDEND HISTORY(2) DIVIDEND AND NII YIELD(1) » Prior to 2024, KBDC did not distinguish between regular and supplemental or special distributions and generally distributed substantially all its income on a quarterly basis ▪ During 1Q'24, KBDC established a $0.40 per share regular dividend ▪ KBDC paid three special dividends on 12/20/24, 3/18/25 and 6/24/25 following pre-IPO share lock-up expirations » As of March 31, 2026, KBDC had undistributed net investment income of $0.25 per share 2Q'24 3Q'24 4Q'24 1Q'25 2Q'25 3Q'25 4Q'25 1Q'26 NII Yield 12.3% 12.5% 11.5% 9.7% 9.8% 10.5% 10.8% 10.6% Total Dividend Yield 9.7% 9.6% 12.0% 12.1% 12.2% 9.8% 9.8% 9.9% $0.40 $0.40 $0.40 $0.40 $0.40 $0.40 $0.40 $0.40 $0.10 $0.10 $0.10 $- $0.10 $0.20 $0.30 $0.40 $0.50 $0.60 2Q'24 3Q'24 4Q'24 1Q'25 2Q'25 3Q'25 4Q'25 1Q'26 Base Dividend Special Dividend
BALANCE SHEET AND OPERATING RESULTS
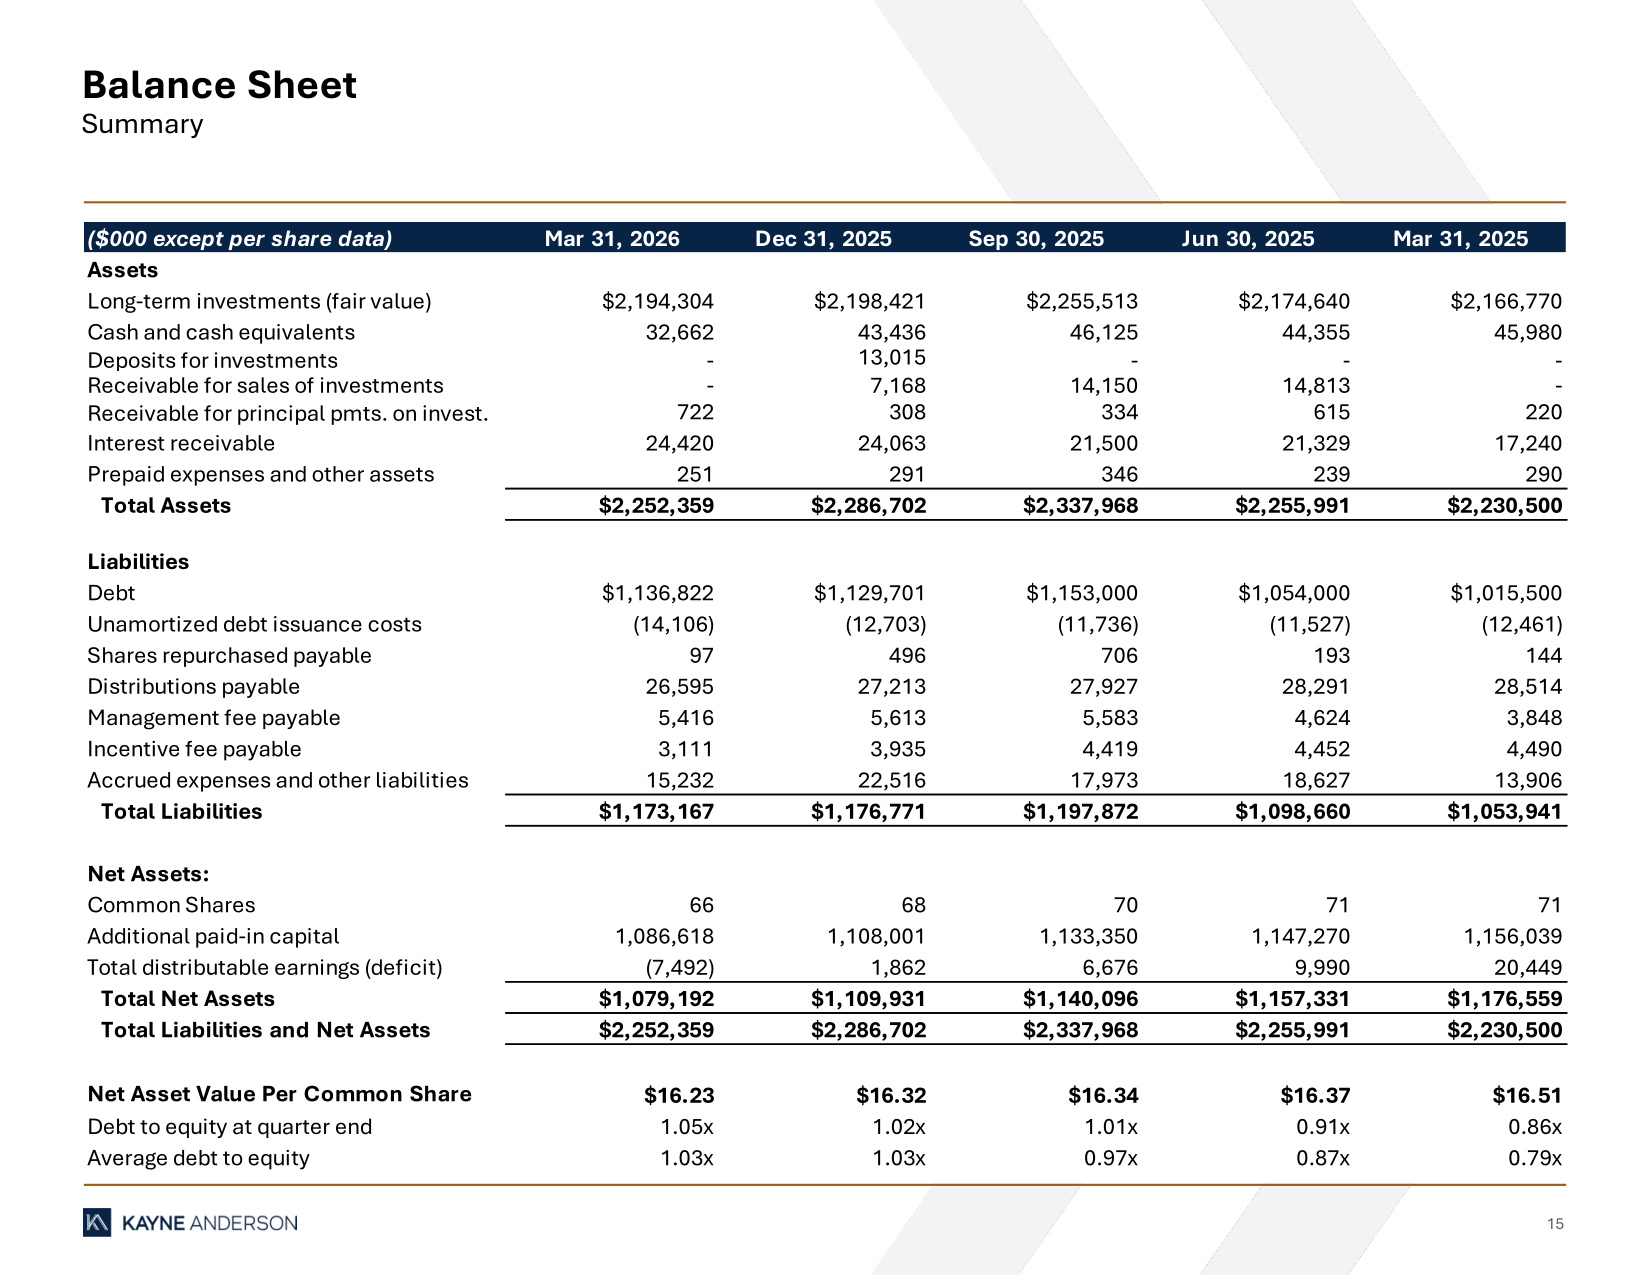
15 Balance Sheet Summary ($000 except per share data) Mar 31, 2026 Dec 31, 2025 Sep 30, 2025 Jun 30, 2025 Mar 31, 2025 Assets Long-term investments (fair value) $2,194,304 $2,198,421 $2,255,513 $2,174,640 $2,166,770 Cash and cash equivalents 32,662 43,436 46,125 44,355 45,980 Deposits for investments - 13,015 - - - Receivable for sales of investments - 7,168 14,150 14,813 - Receivable for principal pmts. on invest. 722 308 334 615 220 Interest receivable 24,420 24,063 21,500 21,329 17,240 Prepaid expenses and other assets 251 291 346 239 290 Total Assets $2,252,359 $2,286,702 $2,337,968 $2,255,991 $2,230,500 Liabilities Debt $1,136,822 $1,129,701 $1,153,000 $1,054,000 $1,015,500 Unamortized debt issuance costs (14,106) (12,703) (11,736) (11,527) (12,461) Shares repurchased payable 97 496 706 193 144 Distributions payable 26,595 27,213 27,927 28,291 28,514 Management fee payable 5,416 5,613 5,583 4,624 3,848 Incentive fee payable 3,111 3,935 4,419 4,452 4,490 Accrued expenses and other liabilities 15,232 22,516 17,973 18,627 13,906 Total Liabilities $1,173,167 $1,176,771 $1,197,872 $1,098,660 $1,053,941 Net Assets: Common Shares 66 68 70 71 71 Additional paid-in capital 1,086,618 1,108,001 1,133,350 1,147,270 1,156,039 Total distributable earnings (deficit) (7,492) 1,862 6,676 9,990 20,449 Total Net Assets $1,079,192 $1,109,931 $1,140,096 $1,157,331 $1,176,559 Total Liabilities and Net Assets $2,252,359 $2,286,702 $2,337,968 $2,255,991 $2,230,500 Net Asset Value Per Common Share $16.23 $16.32 $16.34 $16.37 $16.51 Debt to equity at quarter end 1.05x 1.02x 1.01x 0.91x 0.86x Average debt to equity 1.03x 1.03x 0.97x 0.87x 0.79x
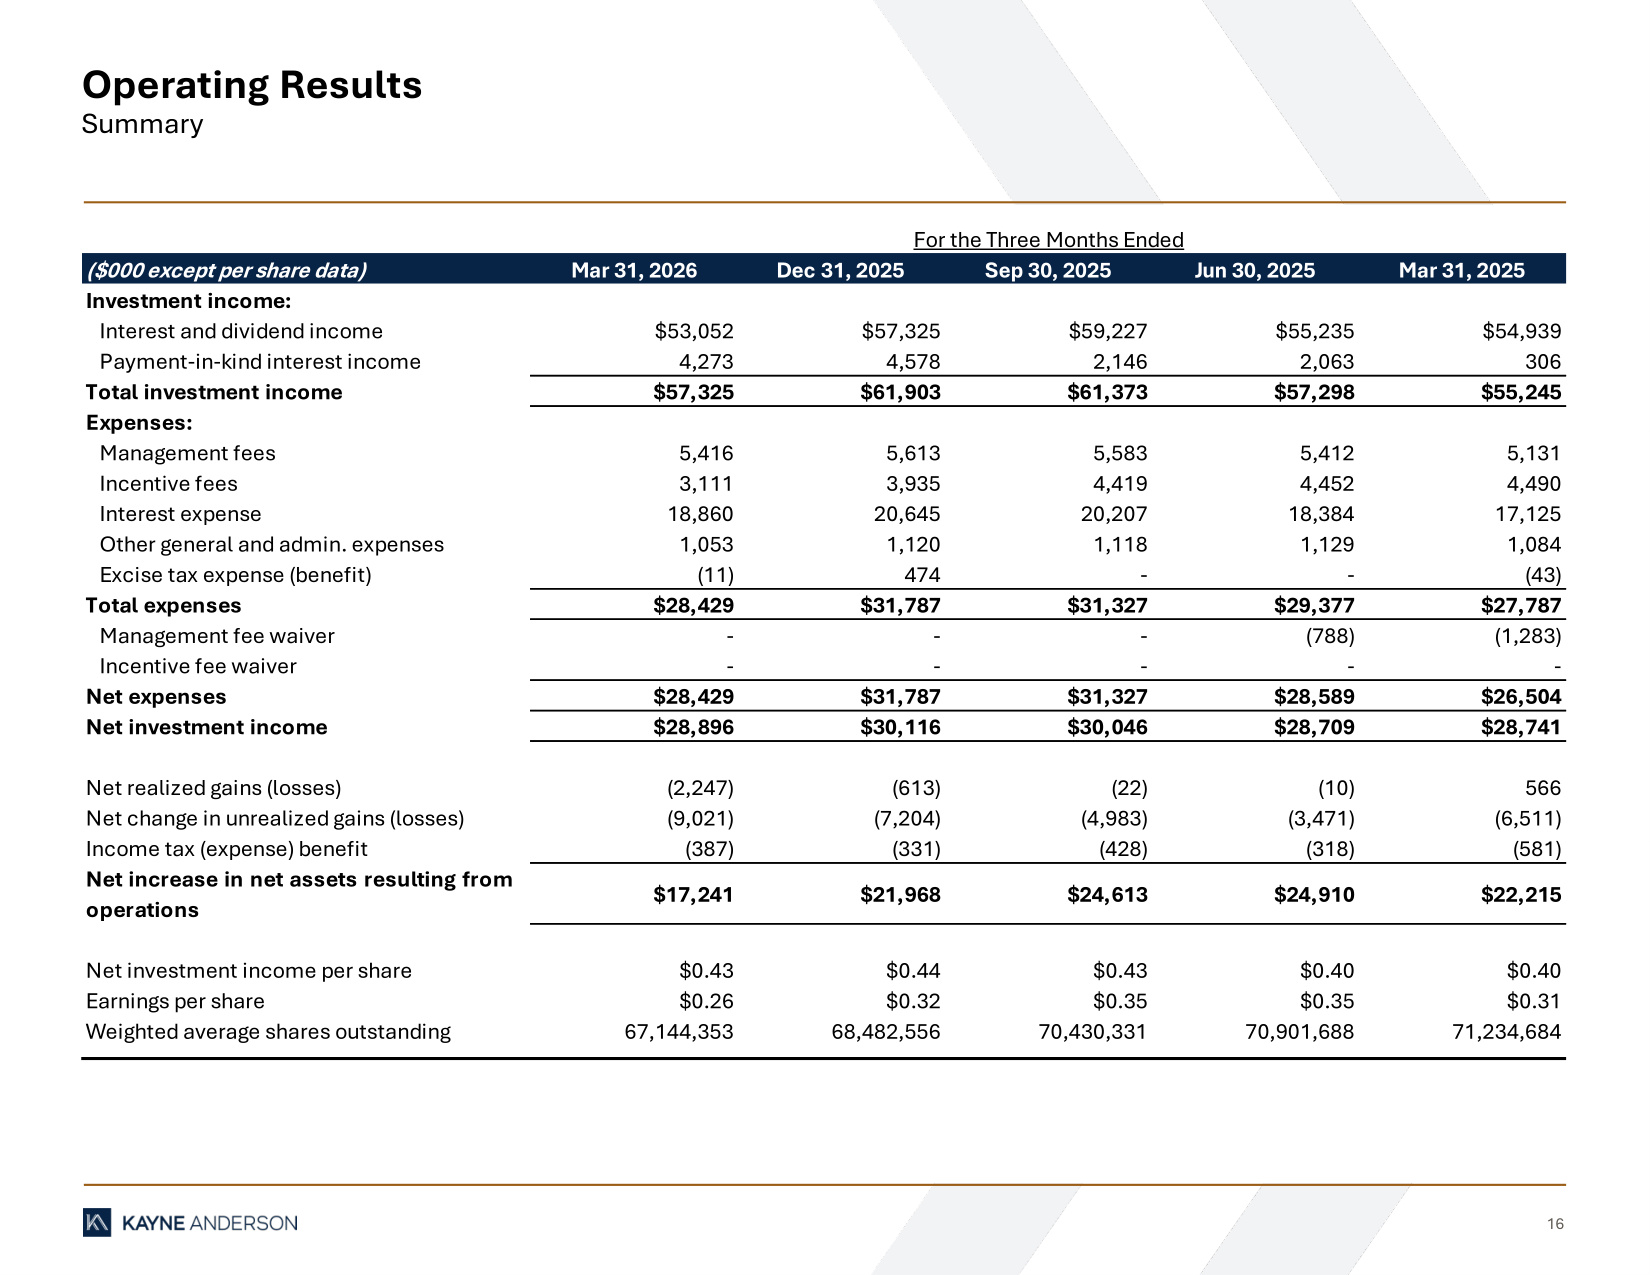
16 Operating Results Summary ($000 except per share data) Mar 31, 2026 Dec 31, 2025 Sep 30, 2025 Jun 30, 2025 Mar 31, 2025 Investment income: Interest and dividend income $53,052 $57,325 $59,227 $55,235 $54,939 Payment-in-kind interest income 4,273 4,578 2,146 2,063 306 Total investment income $57,325 $61,903 $61,373 $57,298 $55,245 Expenses: Management fees 5,416 5,613 5,583 5,412 5,131 Incentive fees 3,111 3,935 4,419 4,452 4,490 Interest expense 18,860 20,645 20,207 18,384 17,125 Other general and admin. expenses 1,053 1,120 1,118 1,129 1,084 Excise tax expense (benefit) (11) 474 - - (43) Total expenses $28,429 $31,787 $31,327 $29,377 $27,787 Management fee waiver - - - (788) (1,283) Incentive fee waiver - - - - - Net expenses $28,429 $31,787 $31,327 $28,589 $26,504 Net investment income $28,896 $30,116 $30,046 $28,709 $28,741 Net realized gains (losses) (2,247) (613) (22) (10) 566 Net change in unrealized gains (losses) (9,021) (7,204) (4,983) (3,471) (6,511) Income tax (expense) benefit (387) (331) (428) (318) (581) Net increase in net assets resulting from operations $17,241 $21,968 $24,613 $24,910 $22,215 Net investment income per share $0.43 $0.44 $0.43 $0.40 $0.40 Earnings per share $0.26 $0.32 $0.35 $0.35 $0.31 Weighted average shares outstanding 67,144,353 68,482,556 70,430,331 70,901,688 71,234,684 For the Three Months Ended
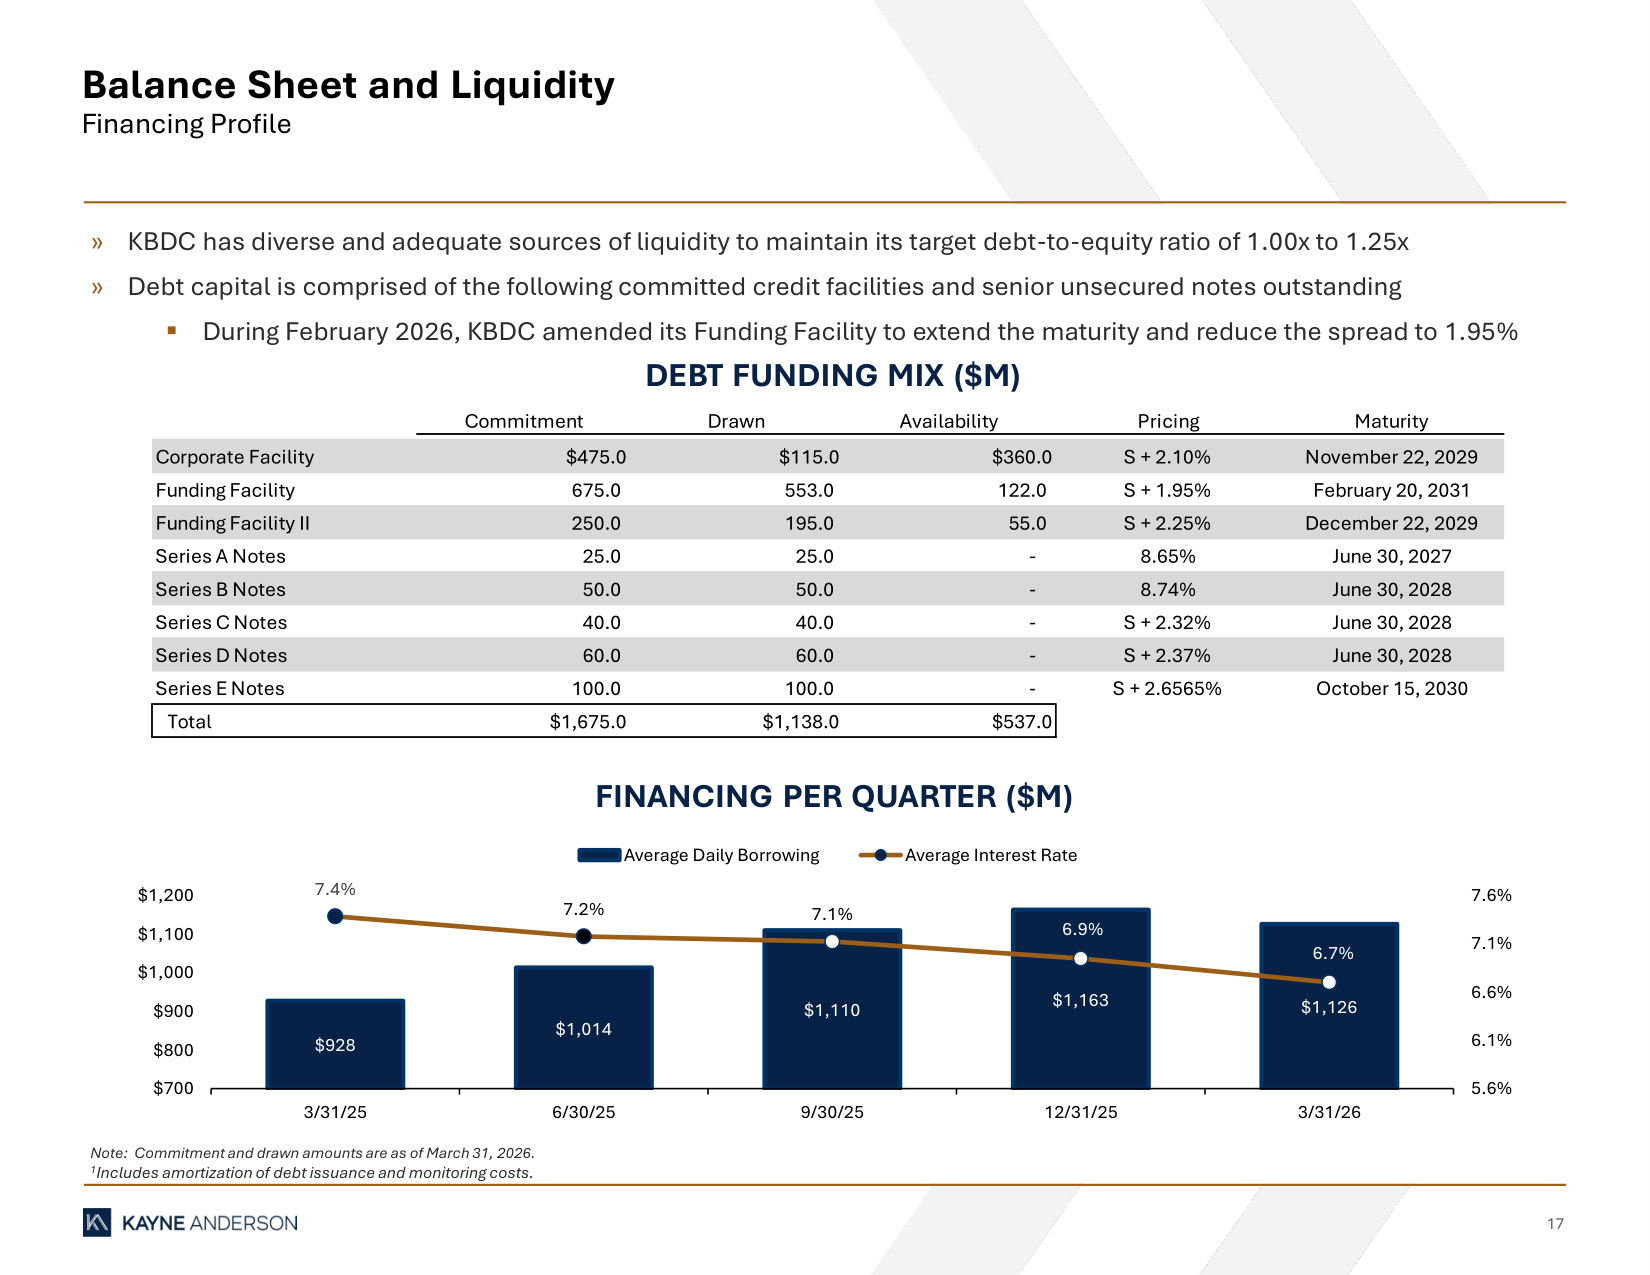
17 Balance Sheet and Liquidity Financing Profile Note: Commitment and drawn amounts are as of March 31, 2026. 1Includes amortization of debt issuance and monitoring costs. DEBT FUNDING MIX ($M) FINANCING PER QUARTER ($M) » KBDC has diverse and adequate sources of liquidity to maintain its target debt-to-equity ratio of 1.00x to 1.25x » Debt capital is comprised of the following committed credit facilities and senior unsecured notes outstanding ▪ During February 2026, KBDC amended its Funding Facility to extend the maturity and reduce the spread to 1.95% Commitment Drawn Availability Pricing Maturity Corporate Facility $475.0 $115.0 $360.0 S + 2.10% November 22, 2029 Funding Facility 675.0 553.0 122.0 S + 1.95% February 20, 2031 Funding Facility II 250.0 195.0 55.0 S + 2.25% December 22, 2029 Series A Notes 25.0 25.0 - 8.65% June 30, 2027 Series B Notes 50.0 50.0 - 8.74% June 30, 2028 Series C Notes 40.0 40.0 - S + 2.32% June 30, 2028 Series D Notes 60.0 60.0 - S + 2.37% June 30, 2028 Series E Notes 100.0 100.0 - S + 2.6565% October 15, 2030 Total $1,675.0 $1,138.0 $537.0 $928 $1,014 $1,110 $1,163 $1,126 7.4% 7.2% 7.1% 6.9% 6.7% 5.6% 6.1% 6.6% 7.1% 7.6% $700 $800 $900 $1,000 $1,100 $1,200 3/31/25 6/30/25 9/30/25 12/31/25 3/31/26 Average Daily Borrowing Average Interest Rate