

PUBLIC
March 2026
Management’s Discussion and Analysis
and Annual Financial Statements: 31 December 2025
This document is being disclosed to the public in accordance with ADB’s Access to Information Policy.

CONTENTS
Management’s Discussion and Analysis
Executive Summary
| I. | Overview | 1 | ||
| II. | Ordinary Capital Resources | 2 | ||
| A. | Basis of Financial Reporting | 2 | ||
| B. | Overall Financial Results | 4 | ||
| C. | Operating Activities | 7 | ||
| 1. | Loans | 8 | ||
| 2. | Equity Investments | 16 | ||
| 3. | Guarantees | 16 | ||
| 4. | Other Debt Securities | 18 | ||
| 5. | Nonsovereign Cofinancing and Direct Mobilization | 18 | ||
| 6. | Transaction Advisory Services | 18 | ||
| 7. | Debt Management Products | 19 | ||
| D. | Funding Resources | 19 | ||
| 1. | Equity | 19 | ||
| 2. | Borrowings | 20 | ||
| E. | Liquidity Management | 23 | ||
| 1. | Liquidity Portfolio | 23 | ||
| 2. | Prudential Minimum Liquidity | 24 | ||
| 3. | Contractual Cash Obligations | 25 | ||
| F. | Risk Management | 25 | ||
| 1. | Credit Risk | 26 | ||
| 2. | Market Risk | 34 | ||
| 3. | Liquidity Risk | 35 | ||
| 4. | Operational Risk | 35 | ||
| 5. | Capital Adequacy | 36 | ||
| 6. | Asset and Liability Management | 37 | ||
| G. | Internal Control over Financial Reporting | 37 | ||
| H. | Critical Accounting Policies and Estimates | 37 | ||
| III. | Special Funds | 39 | ||
| A. | Asian Development Fund | 39 | ||
| B. | Technical Assistance Special Fund | 41 | ||
| C. | Japan Special Fund | 42 | ||
| D. | Asian Development Bank Institute | 42 | ||
| E. | Regional Cooperation and Integration Fund | 43 | ||
| F. | Climate Change Fund | 43 | ||
| G. | Asia Pacific Disaster Response Fund | 44 | ||
| H. | Financial Sector Development Partnership Special Fund | 44 | ||
| IV. | Trust Funds and Cofinancing Under Administration | 45 | ||
| Appendix: | Ordinary Capital Resources Condensed Management Reporting (Non-GAAP measure) Balance Sheets | 47 |
Financial Statements, Management’s Report on Internal Control over Financial Reporting, and Independent Auditor’s Reports
| I. Ordinary Capital Resources (OCR) | ||
| Management’s Report on Internal Control over Financial Reporting | 50 | |
| Independent Auditor’s Report on Internal Control over Financial Reporting | 51 | |
| Independent Auditor’s Report on Financial Statements | 53 | |
| OCR-1 | Balance Sheet | 56 |
| OCR-2 | Statement of Income and Expenses | 58 |
| OCR-3 | Statement of Comprehensive Income | 59 |
| OCR-4 | Statement of Changes in Equity | 60 |
| OCR-5 | Statement of Cash Flows | 61 |
| OCR-6 | Summary Statement of Loans — Operations | 62 |
| OCR-7 | Summary Statement of Borrowings | 64 |
| OCR-8 | Statement of Subscriptions to Capital Stock and Voting Power | 66 |
| OCR-9 | Notes to Financial Statements | 68 |
| II. Asian Development Fund (ADF) | ||
| Management’s Report on Internal Control over Financial Reporting | 119 | |
| Independent Auditor’s Report on Internal Control over Financial Reporting | 120 | |
| Independent Auditor’s Report on Financial Statements | 122 | |
| ADF-1 | Balance Sheet | 125 |
| ADF-2 | Statement of Income and Expenses | 126 |
| ADF-3 | Statement of Comprehensive Loss | 127 |
| ADF-4 | Statement of Changes in Fund Balances | 127 |
| ADF-5 | Statement of Cash Flows | 128 |
| ADF-6 | Statement of Resources | 129 |
| ADF-7 | Notes to Financial Statements | 130 |
| III. Technical Assistance Special Fund (TASF) | ||
| Management’s Report on Internal Control over Financial Reporting | 139 | |
| Independent Auditor’s Report on Internal Control over Financial Reporting | 140 | |
| Independent Auditor’s Report on Financial Statements | 142 | |
| TASF-1 | Statement of Financial Position | 145 |
| TASF-2 | Statement of Activities and Changes in Net Assets | 146 |
| TASF-3 | Statement of Cash Flows | 147 |
| TASF-4 | Statement of Resources | 148 |
| TASF-5 | Notes to Financial Statements | 149 |
| IV. Japan Special Fund (JSF) | ||
| Management’s Report on Internal Control over Financial Reporting | 157 | |
| Independent Auditor’s Report on Internal Control over Financial Reporting | 158 | |
| Independent Auditor’s Report on Financial Statements | 160 | |
| JSF-1 | Statement of Financial Position | 163 |
| JSF-2 | Statement of Activities and Changes in Net Assets | 164 |
| JSF-3 | Statement of Cash Flows | 165 |
| JSF-4 | Notes to Financial Statements | 166 |
| V. Asian Development Bank Institute (ADBI) | ||
| Independent Auditor’s Report on Financial Statements | 172 | |
| ADBI-1 | Statement of Financial Position | 175 |
| ADBI-2 | Statement of Activities and Changes in Net Assets | 176 |
| ADBI-3 | Statement of Cash Flows | 177 |
| ADBI-4 | Notes to Financial Statements | 178 |
| VI. Regional Cooperation and Integration Fund (RCIF) | ||
| Management’s Report on Internal Control over Financial Reporting | 191 | |
| Independent Auditor’s Report on Internal Control over Financial Reporting | 192 | |
| Independent Auditor’s Report on Financial Statements | 194 | |
| RCIF-1 | Statement of Financial Position | 197 |
| RCIF-2 | Statement of Activities and Changes in Net Assets | 198 |
| RCIF-3 | Statement of Cash Flows | 199 |
| RCIF-4 | Notes to Financial Statements | 200 |
| VII. Climate Change Fund (CCF) | ||
| Management’s Report on Internal Control over Financial Reporting | 206 | |
| Independent Auditor’s Report on Internal Control over Financial Reporting | 207 | |
| Independent Auditor’s Report on Financial Statements | 209 | |
| CCF-1 | Statement of Financial Position | 212 |
| CCF-2 | Statement of Activities and Changes in Net Assets | 213 |
| CCF-3 | Statement of Cash Flows | 214 |
| CCF-4 | Notes to Financial Statements | 215 |
| VIII. Asia Pacific Disaster Response Fund (APDRF) | ||
| Management’s Report on Internal Control over Financial Reporting | 221 | |
| Independent Auditor’s Report on Internal Control over Financial Reporting | 222 | |
| Independent Auditor’s Report on Financial Statements | 224 | |
| APDRF-1 | Statement of Financial Position | 227 |
| APDRF-2 | Statement of Activities and Changes in Net Assets | 228 |
| APDRF-3 | Statement of Cash Flows | 229 |
| APDRF-4 | Notes to Financial Statements | 230 |
| IX. Financial Sector Development Partnership Special Fund (FSDPSF) | ||
| Management’s Report on Internal Control over Financial Reporting | 236 | |
| Independent Auditor’s Report on Internal Control over Financial Reporting | 237 | |
| Independent Auditor’s Report on Financial Statements | 239 | |
| FSDPSF-1 | Statement of Financial Position | 242 |
| FSDPSF-2 | Statement of Activities and Changes in Net Assets | 243 |
| FSDPSF-3 | Statement of Cash Flows | 244 |
| FSDPSF-4 | Notes to Financial Statements | 245 |
|
1
|
ADB. 2024. Strategy 2030 Midterm Review: An Evolution Approach for the Asian Development Bank.
|
|
2
|
The figures are for ordinary capital resources (OCR) and Special Funds. Special Funds include the Asian Development Fund (ADF), Technical Assistance Special Fund (TASF), Japan Special Fund (JSF), Regional
Cooperation and Integration Fund (RCIF), Asia Pacific Disaster Response Fund (APDRF), Climate Change Fund (CCF) and Financial Sector Development Partnership Special Fund (FSDPSF).
|
|
3
|
US dollar equivalent based on the Board of Governors’ Resolution No. 427 exchange rates.
|
|
4
|
ADB. 2025. Board of Governors’ Resolution No. 437 – Removal of the ADB Charter Lending Limitation.
|
|
1
|
ADB. 1966. Agreement Establishing the Asian Development Bank.
|
|
2
|
Following the provisions of Board of Governors’ Resolution No. 431, one nonregional member became a regional member effective 30 April 2025.
|
|
3
|
The figures are for ordinary capital resources (OCR) and Special Funds. Special Funds include the Asian Development Fund (ADF), Technical Assistance Special Fund (TASF), Japan Special Fund (JSF), Regional
Cooperation and Integration Fund (RCIF), Asia Pacific Disaster Response Fund (APDRF), Climate Change Fund (CCF) and Financial Sector Development Partnership Special Fund (FSDPSF).
|
|
4
|
ADB. 2025. Capital Utilization Plan. https://www.adb.org/documents/capital-utilization-plan
|
|
A.
|
Basis of Financial Reporting |
|
5
|
ADB’s Charter stipulates that the Board of Governors shall determine the allocation of net income annually.
|
|
B.
|
Overall Financial Results
|
|
Item
|
2025
|
2024
|
Change
|
|||||||||
|
Revenue from loans—operationsa
|
7,102
|
8,038
|
(936
|
)
|
||||||||
|
Sovereign regular
|
5,927
|
6,841
|
(914
|
)
|
||||||||
|
Sovereign concessional
|
721
|
717
|
4
|
|||||||||
|
Nonsovereign
|
454
|
480
|
(26
|
)
|
||||||||
|
Revenue from investments for liquidity purpose
|
2,553
|
2,713
|
(160
|
)
|
||||||||
|
Interest
|
2,551
|
2,731
|
(180
|
)
|
||||||||
|
Realized gains (losses) on sale of investments
|
2
|
(18
|
)
|
20
|
||||||||
|
Revenue from equity investments—operations
|
169
|
115
|
54
|
|||||||||
|
Net realized gainsb, c
|
8
|
13
|
(5
|
)
|
||||||||
|
Dividends and others
|
9
|
4
|
5
|
|||||||||
|
Realized gains on equity method investmentsd
|
45
|
71
|
(26
|
)
|
||||||||
|
Unrealized gains on equity method investmentsd
|
107
|
27
|
80
|
|||||||||
|
Revenue from guarantees—operations
|
27
|
27
|
0
|
|||||||||
|
Revenue from other debt securities—operations
|
47
|
47
|
(0
|
)
|
||||||||
|
Interest and others
|
45
|
47
|
(2
|
)
|
||||||||
|
Realized gains
|
2
|
–
|
2
|
|||||||||
|
Revenue from other sources
|
94
|
84
|
10
|
|||||||||
|
Borrowings and related expensese
|
(7,520
|
)
|
(8,717
|
)
|
1,197
|
|||||||
|
(Provision) Release of provision for credit losses
|
(24
|
)
|
45
|
(69
|
)
|
|||||||
|
Administrative expenses—OCR
|
(817
|
)
|
(729
|
)
|
(88
|
)
|
||||||
|
Other expenses
|
(44
|
)
|
(30
|
)
|
(14
|
)
|
||||||
|
Net unrealized gains
|
316
|
36
|
280
|
|||||||||
|
Fair value changes
|
313
|
41
|
272
|
|||||||||
|
Reclassification of unrealized gains on divested equity investmentsc
|
–
|
(2
|
) |
2
|
||||||||
|
Translation adjustments of nonfunctional currencies
|
3 | (3 | ) | 6 |
||||||||
| Net income | 1,903 | 1,629 |
274 |
|||||||||
|
Appropriation of guarantee fees to special reserve
|
(20 | ) | (27 | ) | 7 |
|||||||
| Net income after appropriation of guarantee fees to special reserve | 1,883 | 1,602 |
281
|
|||||||||
| Adjustments |
(423
|
)
|
(63
|
)
|
(360
|
)
|
||||||
|
Net unrealized gains
|
(316
|
)
|
(36
|
)
|
(280
|
)
|
||||||
|
Unrealized gains on equity method investmentsd
|
(107 | ) | (27 | ) | (80 | ) | ||||||
|
Allocable net income (non-GAAP measure)
|
1,460 |
1,539 |
(79 | ) | ||||||||
|
a
|
Includes interest revenue, commitment charges, amortization of front-end fees and loan origination cost and interest on asset swaps. Excludes funding costs.
|
|
b
|
Includes $10 million ($13 million – 2024) realized gains on disposal of equity investments, net of $2 million (nil – 2024) impairment loss on equity method investments.
|
|
c
|
Sale of equity investments in 2024 resulted in reclassification of the unrealized gains up to 31 December 2023 of $2 million to realized gains. The net realized gains up to the date of sale in 2025
amounted to $10 million ($13 million – 2024).
|
|
d
|
Pertains to ADB’s proportionate share of gains or losses from equity method investments.
|
|
e
|
Net of $1 million (nil – 2024) realized gains from early redemption of borrowings.
|
|
-
|
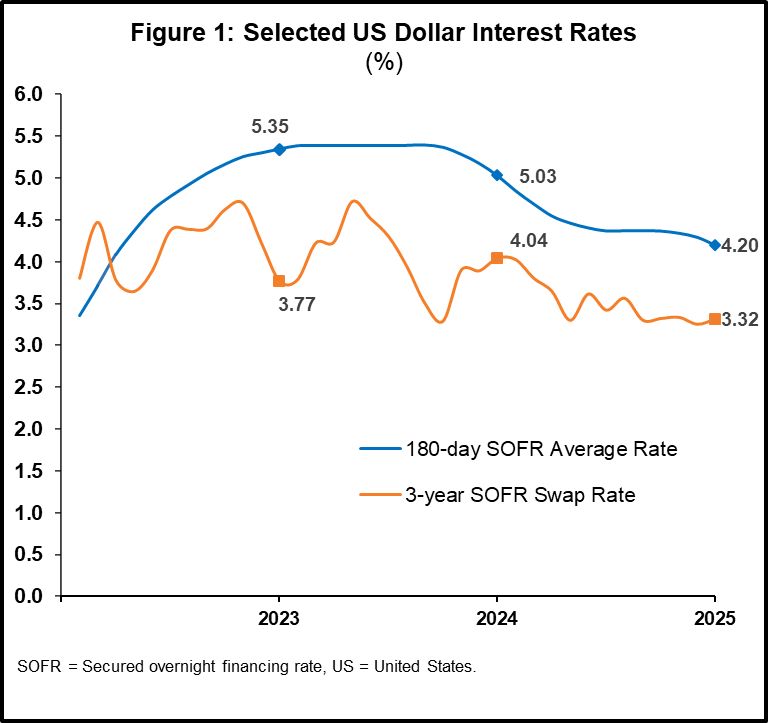
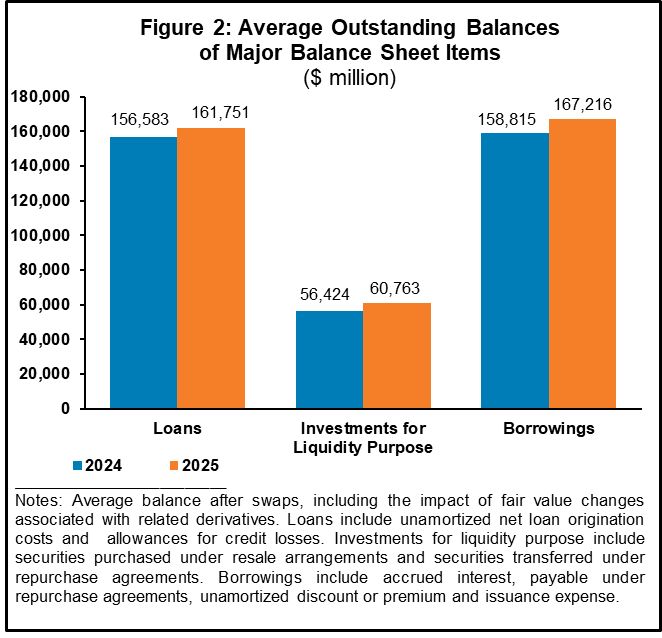
Revenue from loans, excluding funding costs, decreased by $936 million primarily because of the lower average interest rates (Figure 1) applied to regular OCR loans partially offset by the
increase in average loans outstanding in 2025 (Figure 2),
|
|
-
|
Revenue from investments for liquidity purpose decreased by $160 million mainly because of the $180 million decrease in interest revenue driven by the lower short-term interest rates
on debt-funded liquidity investments compared to 2024 (Figure 1),
|
|
-
|
Revenue from equity investments, excluding unrealized gains on equity method investments, decreased by $26 million ($62 million – 2025, $88 million – 2024) mainly due to the lower
realized gains on equity method investments,
|
|
-
|
Borrowings and related expenses decreased by $1,197 million mainly because of the lower level of short-term interest rates (Figure 1). Consistent with the market movements, average
cost of borrowings under management reporting basis decreased to 4.5% in 2025 from 5.5% in 2024,
|
|
-
|
Provision for credit losses amounted to $24 million for the year ended 31 December 2025. The provision in 2025 was mainly driven by a weaker macroeconomic outlook amid geopolitical
tensions and global trade uncertainties,
|
|
-
|
Administrative expenses of OCR increased by $88 million primarily because of the higher salaries and benefits expenses, and
|
|
|
|
6
|
Allocable net income is defined as net income after appropriation of guarantee fees to special reserve and certain adjustments set aside in the cumulative revaluation adjustments account.
|
| - |
$316 million net unrealized gains for the year ended 31 December 2025 ($36 million – 2024) was largely due to the fair value gains of derivatives driven mainly by the change in medium-and long-term interest rates from end of
2024 levels (Table 2).
|
|
Item
|
2025
|
2024
|
Change
|
|||||||||
|
Fair value changes from:
|
313
|
41
|
272
|
|||||||||
|
Borrowings and related derivatives
|
106
|
485
|
(379
|
)
|
||||||||
|
Loans related derivatives
|
139
|
(401
|
)
|
540
|
||||||||
|
Investments related derivatives
|
59
|
(25
|
)
|
84
|
||||||||
|
Equity investments
|
9
|
(18
|
)
|
27
|
||||||||
|
Reclassification of unrealized gains on divested equity investment
|
–
|
(2
|
)
|
2
|
||||||||
|
Translation adjustments of nonfunctional currencies
|
3
|
(3
|
)
|
6
|
||||||||
|
Total
|
316
|
36
|
280
|
|||||||||
|
Item
|
2025
|
2024
|
2023
|
|||||||||
|
Operational Highlights ($ million)
|
||||||||||||
|
Loans, Guarantees, EI, and ODS Committeda
|
27,717
|
22,920
|
22,518
|
|||||||||
|
Loans, EI, and ODS Disbursements
|
18,171
|
17,911
|
17,077
|
|||||||||
|
Loans and ODS Principal Repayments and Prepayments
|
13,232
|
12,956
|
10,585
|
|||||||||
|
Loans, EI, and ODS Outstanding
|
163,607
|
156,112
|
153,088
|
|||||||||
|
Statutory Reporting Basis
|
||||||||||||
|
Net Income ($ million)
|
1,903
|
1,629
|
938
|
|||||||||
|
Return on Earning Assetsb
|
0.9
|
0.8
|
0.5
|
|||||||||
|
Return on Equityc
|
3.3
|
2.9
|
1.7
|
|||||||||
|
Return on Loansd
|
4.5
|
4.9
|
4.7
|
|||||||||
|
Return on Investments for Liquidity Purposee
|
4.3
|
4.8
|
3.9
|
|||||||||
|
Cost of Borrowingsf
|
4.4
|
5.2
|
5.2
|
|||||||||
|
Management Reporting Basis (non-GAAP measure)g
|
||||||||||||
|
Allocable Net Incomeh ($ million)
|
1,460
|
1,539
|
1,423
|
|||||||||
|
Return on Earning Assetsb
|
0.7
|
0.7
|
0.7
|
|||||||||
|
Return on Equityc
|
2.6
|
2.8
|
2.7
|
|||||||||
|
Return on Loansd
|
4.4
|
5.2
|
5.0
|
|||||||||
|
Return on Investments for Liquidity Purposee
|
4.2
|
4.8
|
4.5
|
|||||||||
|
Cost of Borrowingsf
|
4.5
|
5.5
|
5.2
|
|||||||||
|
Capital Utilization Ratioi
|
72.6
|
71.5
|
70.0
|
|||||||||
|
a
|
Includes commitments under the private sector programs namely, the Trade and Supply Chain Finance and the Microfinance Program.
|
|
b
|
Net income (for statutory reporting basis) or allocable net income (for management reporting basis) divided by average earning assets. Earning assets comprise investments for
liquidity purpose, loans outstanding, equity investments, and other debt securities (all after swaps, if applicable).
|
|
c
|
Net income (for statutory reporting basis) or allocable net income (for management reporting basis) divided by average equity balances.
|
|
d
|
Interest revenue on loans, commitment fees, other revenue or expenses on loans and related swaps, and gains or losses on related swaps divided by average outstanding loans
after swaps. For the year ended 31 December 2025, under statutory basis reporting, the return on regular and concessional OCR loans was 5.0% and 2.7%, respectively, while under management basis reporting, the return on regular
and concessional OCR loans was 5.0% and 2.1%, respectively.
|
|
e
|
Interest revenue and gains or losses on investments and related swaps divided by average balances of investments after swaps.
|
|
f
|
Financial expenses and gains or losses on borrowings and related swaps divided by average outstanding borrowings after swaps.
|
|
g
|
Management reporting basis ratios exclude impact of unrealized gains or losses from fair value changes associated with certain financial instruments, unrealized gains or
losses on equity method investments, and nonnegotiable and noninterest-bearing demand obligations on account of subscribed capital.
|
|
h
|
Allocable net income is defined as net income after appropriation of guarantee fees to special reserve and certain adjustments set aside in the cumulative revaluation
adjustments account.
|
|
i
|
Capital utilization ratio is the ratio of the total economic capital used to usable equity. The capital utilization ratios are computed based on the 2023 capital adequacy
framework.
|
| C. |
Operating Activities
|
| 1. |
Loans
|
| 7 |
ADB. 2025. Board of Governors’ Resolution No. 437 – Removal of the ADB Charter Lending Limitation.
|
|
-
|
Project –Also known as investment lending, it finances expenditures incurred for discrete investment projects and focuses on project implementation. Disbursements in this modality are linked
to expenditures for inputs. Nonsovereign loans fall under this modality.
|
|
-
|
Policy-based – This modality provides sovereign budget support for structural reforms and development expenditure programs in DMCs. In certain circumstances, it may also be used to provide
balance of payments or counter-cyclical fiscal support. It is linked to the implementation of policy reforms, disbursed quickly, and targeted to sector-wide and economy-wide impact.
|
|
-
|
Results-based – It supports government-owned sector programs and disburses ADB funds based on the achievement of program results.
|
| Sovereign |
||||||||||||||||
| Regular |
Concessional |
NSO | Total | |||||||||||||
|
2025
|
||||||||||||||||
|
Project Loan
|
73,812
|
22,327
|
6,683
|
102,822
|
||||||||||||
|
Policy-based Loan
|
39,310
|
12,193
|
–
|
51,503
|
||||||||||||
|
Results-based Loan
|
6,791
|
1,194
|
–
|
7,985
|
||||||||||||
|
Total Outstanding
|
119,913
|
35,714
|
6,683
|
162,310
|
||||||||||||
|
Accounting adjustmentsa
|
(551
|
)
|
(88
|
)
|
(39
|
)
|
(678
|
)
|
||||||||
|
119,361
|
35,626
|
6,644
|
161,631
|
|||||||||||||
|
Allowance for credit losses on loans
|
(84
|
)
|
(168
|
)
|
(316
|
)
|
(568
|
)
|
||||||||
|
Loans Outstanding
|
119,277
|
35,458
|
6,328
|
161,063
|
||||||||||||
|
2024
|
||||||||||||||||
|
Project Loan
|
72,968
|
21,441
|
5,754
|
100,163
|
||||||||||||
|
Policy-based Loan
|
36,537
|
11,133
|
–
|
47,670
|
||||||||||||
|
Results-based Loan
|
5,872
|
866
|
–
|
6,738
|
||||||||||||
|
Total Outstanding
|
115,377
|
33,439
|
5,754
|
154,570
|
||||||||||||
|
Accounting adjustmentsa
|
(25
|
)
|
(107
|
)
|
(34
|
)
|
(166
|
)
|
||||||||
|
115,352
|
33,332
|
5,720
|
154,404
|
|||||||||||||
|
Allowance for credit losses on loans
|
(91
|
)
|
(163
|
)
|
(286
|
)
|
(540
|
)
|
||||||||
|
Loans Outstanding
|
115,261
|
33,169
|
5,434
|
153,864
|
|
a
|
Includes fair value adjustment on loans, unamortized loan origination cost, and unamortized front-end fee.
|
|
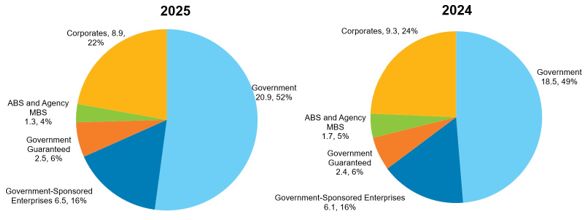
|
Figure 3: Sectoral Breakdown of OCR Loans Outstanding
as of 31 December 2025 and 2024
($ billion)
|
|
|
|
|
2025: $162.3 billion
|
2024: $154.6 billion
|
|
|
|
 |
 |
|
|
|
OCR = ordinary capital resources.
Notes: OCR loans include sovereign and nonsovereign loans outstanding and exclude $568 million ($540 million – 2024) allowance for credit losses, and $678
million ($166 million – 2024) accounting adjustments for fair value adjustment on loans, unamortized loan origination cost, and unamortized front-end fee.
|
|
|
|
Item
|
2025
|
2024
|
||||||
|
Allowance for credit losses on loans
|
568
|
540
|
||||||
|
Sovereign regular OCR loans
|
84
|
91
|
||||||
|
Sovereign concessional OCR loansa
|
168
|
163
|
||||||
|
Nonsovereign loans
|
316
|
286
|
||||||
|
Allowance for credit losses on other debt securities
|
21
|
14
|
||||||
|
Liability for credit losses on off-balance sheet exposures
|
144
|
121
|
||||||
|
Totalb
|
733 |
675 |
||||||
| 2025 |
2024 | |||||||||||||||||||
|
Numbera
|
Amount
($ million)
|
Numbera
|
Amount
($ million)
|
Change
($ million)
|
||||||||||||||||
|
Sovereign Regular
|
72
|
18,238
|
60
|
13,473
|
4,765
|
|||||||||||||||
|
Project
|
46
|
9,047
|
36
|
6,390
|
2,657
|
|||||||||||||||
|
Policy-based
|
16
|
6,131
|
20
|
5,651
|
480
|
|||||||||||||||
|
Results-based
|
10
|
3,059
|
4
|
1,431
|
1,628
|
|||||||||||||||
|
Sovereign Concessional
|
44
|
3,479
|
56
|
4,610
|
(1,131
|
)
|
||||||||||||||
|
Project
|
28
|
1,689
|
37
|
2,773
|
(1,084
|
)
|
||||||||||||||
|
Policy-based
|
12
|
1,370
|
17
|
1,480
|
(110
|
)
|
||||||||||||||
|
Results-based
|
4
|
420
|
2
|
357
|
63
|
|||||||||||||||
|
Nonsovereign—Project
|
49
|
2,258
|
39
|
2,029
|
229
|
|||||||||||||||
|
Total
|
165
|
23,974
|
155
|
20,111
|
3,863
|
|||||||||||||||
|
a
|
Commitments for sovereign loans and nonsovereign project loans are counted based on the number of loans committed.
|
|
2025
|
2024 | |||||||||||||||
|
Disbursements
|
Repaymentsa
|
Disbursements
|
Repaymentsa
|
|||||||||||||
|
Sovereign Regular
|
11,865
|
9,330
|
12,898
|
9,319
|
||||||||||||
|
Project
|
5,541
|
5,353
|
6,278
|
4,831
|
||||||||||||
|
Policy-based
|
5,234
|
3,703
|
5,611
|
4,294
|
||||||||||||
|
Results-based
|
1,090
|
274
|
1,009
|
194
|
||||||||||||
|
Sovereign Concessional
|
3,322
|
2,015
|
3,367
|
1,982
|
||||||||||||
|
Project
|
1,593
|
1,464
|
1,697
|
1,457
|
||||||||||||
|
Policy-based
|
1,370
|
507
|
1,459
|
486
|
||||||||||||
|
Results-based
|
359
|
44
|
212
|
39
|
||||||||||||
|
Nonsovereignb
|
2,529
|
1,683
|
1,346
|
1,590
|
||||||||||||
|
Total
|
17,716
|
13,028
|
17,610
|
12,891
|
||||||||||||
|
a
|
Includes prepayment of $479 million for nine sovereign regular OCR loans, $2 million for one sovereign concessional OCR loan, and $105 million for 17
nonsovereign loans for the year ended 31 December 2025 ($606 million for six sovereign regular OCR loans and $210 million for 18 nonsovereign loans – 2024). Amounts are based on the United States dollar equivalent as of
receipt of payment.
|
|
b
|
Includes loan disbursement and repayments under the private sector programs.
|
| Sovereign |
||||||||||||||||||||||||
|
Product
|
Regular |
Concessional
|
Nonsovereign
|
|||||||||||||||||||||
|
2025
|
2024 |
2025
|
2024 | 2025 |
2024 | |||||||||||||||||||
|
Flexible loan producta
|
116,460
|
114,212 |
n/a
|
n/a
|
4,591
|
4,172
|
||||||||||||||||||
|
Local currency loans
|
3,360
|
1,013 |
n/a
|
n/a
|
2,092
|
1,582
|
||||||||||||||||||
|
Concessional loans
|
n/a
|
n/a |
35,714
|
33,439
|
n/a
|
n/a
|
||||||||||||||||||
|
Pool-based single currency loansb
|
93
|
152 |
n/a
|
n/a |
n/a
|
n/a | ||||||||||||||||||
|
Total Outstanding
|
119,913
|
115,377 |
35,714
|
33,439
|
6,683
|
5,754
|
||||||||||||||||||
|
Accounting adjustmentsc
|
(551
|
)
|
(25 | ) |
(88
|
)
|
(107
|
)
|
(39
|
)
|
(34
|
)
|
||||||||||||
|
Allowance for credit losses
|
(84
|
)
|
(91 | ) |
(168
|
)
|
(163
|
)
|
(316
|
)
|
(286
|
)
|
||||||||||||
|
Loans Outstanding
|
119,277
|
115,261 |
35,458
|
33,169
|
6,328
|
5,434
|
||||||||||||||||||
|
a
|
Includes fixed rate loans amounting to $5,509 million for sovereign regular OCR loans and $496 million for nonsovereign loans as of 31 December 2025 ($7,474 million for sovereign
regular OCR and $500 million for nonsovereign loans – 2024).
|
| b |
PSCLs are legacy loan products and are no longer offered.
|
| c |
Includes fair value adjustment on loans, unamortized loan origination cost, and unamortized front-end fee.
|
|
8
|
The Euro Interbank Offered Rate (EURIBOR) and New Zealand Dollar (NZD) bank bill rate will continue to be used for Euro and NZD loans, respectively.
|
|
Item
|
FLP
|
CSF
|
SPBL
|
LCL
|
|
A. Loan Term
|
For project and results-based,
flexible loan terms of up to 19 years of average loan maturity; For policy-based, loan term of 15 years including a grace period of up to 3 years |
Loan term of 7 years, including
a grace period of up to 3 years |
Loan term of 5 to 8 years,
including a grace period of up
to 3 years |
For project and results-based,
flexible loan terms of up to 19 years of average loan maturity; For policy-based, loan term of 15 years including a grace period of up to 3 years |
|
B. Cost-Base Ratea
|
|
|||
|
1. US dollar
|
6-month SOFR compounded in arrears
6-month TONA compounded in arrears
6-month EURIBOR
6-month Bank Bill Rate
|
|
||
|
2. Yen
|
|
|||
|
3. Euro
|
|
|||
|
4. New Zealand dollar
|
|
|||
|
5. Yuan
|
|
3-month SHIBOR
|
||
|
6. Tenge
|
|
ADB Funding Rate
|
||
|
7. Lari
|
|
ADB Funding Rate
|
||
|
C. Lending Spreadb
|
50
|
75
|
200
|
50
|
|
D. Maturity Premiumc for loans
with average maturity of
|
|
|||
|
1. < 9 years
|
0
|
|||
|
2. 9 years up to 13 years
|
0–40
|
|||
|
3. >13 years up to 16 years
|
0–50
|
|||
|
4. >16 years up to 19 years
|
0–75
|
|||
|
E. Surcharge or (Rebate)d
|
|
|
|
|
|
1. US dollar
|
37
|
42
|
|
|
|
2. Yen
|
(10)
|
|
|
|
|
3. Euro
|
23
|
|
|
|
|
4. New Zealand dollar
|
51
|
|
|
|
|
5. Yuan
|
|
|
(35)
|
|
|
F. Commitment Chargese
|
15
|
15
|
75
|
15
|
|
a
|
The LCL cost-base rate depends on whether financing in a local currency is based on back-to-back funding or the pool-based approach. For back-to-back funding, the cost-base rate comprises ADB’s
cost of a funding transaction undertaken to finance a specific loan. For a pool-based funding approach, the cost-base rate is based on the local floating-rate benchmark.
|
|
b
|
The current FLP and LCL effective contractual spread is 50 basis points for loans negotiated on or after 1 January 2014. The terms of emergency assistance loans are similar to FLP terms.
|
|
c
|
For loans which formal negotiations were completed on or after 1 April 2012, a maturity premium is added to the contractual spread and applied for the entire life of the loan. A limit of 19
years applies to the average loan maturity of FLP loans and LCLs. For all loans to regular OCR-only borrowing countries, approved on or after 1 January 2021, a new pricing structure was implemented to adjust the pricing
framework and introduce diversity in the current flat pricing structure for countries in different stages of development. The new maturity premium is applied for the life of a loan regardless of country group changes during
the tenor of the loan.
|
|
d
|
To maintain the principle of the cost pass-through pricing policy, ADB passes on its actual funding cost margin to its borrowers through a surcharge or rebate and these are incorporated into the
interest rate for the succeeding interest period. Rebates or surcharges for all FLPs are determined in January and July every year on the basis of the average funding cost margin below or above the relevant benchmark for the
preceding six months. The information presented is applicable from 1 July to 31 December 2025.
|
|
e
|
The commitment charge is levied on undisbursed balances beginning 60 days after signing of the applicable loan agreement. For loans under contingent disaster financing, the borrower will pay, in
lieu of commitment charges, a front-end fee of 25 or 10 basis points of the committed loan amount depending on the contingent disaster financing option.
|
|
Terms
|
Concessional
Assistance-Only
Countriesa
|
OCR Blend
Countriesb, c
|
SIDS
|
Emergency
Assistance
|
||||||||||||
|
A. Maturity (years)
|
24 – 32
|
25
|
40
|
40
|
||||||||||||
|
B. Grace period (years)
|
8
|
5
|
10
|
10
|
||||||||||||
|
C. Interest rate during the grace period
|
1.0
|
%
|
2.0
|
%
|
1.0
|
%
|
1.0
|
%
|
||||||||
|
D. Interest rate during the amortization period
|
1.5
|
%
|
2.0
|
%
|
1.0
|
%
|
1.0
|
%
|
||||||||
|
E. Principal repayment
|
|
|||||||||||||||
|
1. First 10 years after the grace period
|
Equal |
Equal |
2.0 |
%d | 2.0 |
%d | ||||||||||
|
2. Year thereafter
|
|
Equal |
|
Equal |
4.0
|
%d
|
4.0
|
%d
|
||||||||
|
a
|
Countries that are eligible for sovereign concessional OCR loans and/or Asian Development Fund grants.
|
|
b
|
Countries that are eligible for both sovereign regular and concessional OCR loans.
|
|
c
|
Applicable for projects with loan negotiations completed on or after 1 January 2013.
|
|
d
|
Principal repayment will be calculated based on the approved loan amount multiplied by the annual rate of 2.0% for the first 10 years after the grace
period and 4.0% thereafter.
|
|
2.
|
Equity Investments
|
|
Item
|
2025
|
2024
|
||||||
|
Direct investments
|
983
|
773
|
||||||
|
Private equity funds
|
1,009
|
854
|
||||||
|
Total equity investments
|
1,992
|
1,627
|
||||||
|
3.
|
Guarantees
|
|
9
|
Prudential buffer represents 80% and 100% of the signed and undisbursed amounts for private equity funds and direct equity investments, respectively.
|
|
-
|
Trade and Supply Chain Finance Program. The Trade Finance Program and the Supply Chain Finance Program were merged to create operational efficiency
and more holistic solutions to clients.
|
|
-
|
Microfinance Program. The MFP provides risk participation on revolving basis for loans made by commercial financial institutions to microfinance
institutions in ADB’s DMCs. As of 31 December 2025, MFP revolving cover is up to $600 million. The program provided guarantees financed by ADB amounting to $217 million in 2025 ($254 million – 2024) and the outstanding
guarantee amount as of 31 December 2025 was $167 million ($199 million – 2024).
|
|
2025
|
2024
|
Change
|
||||||||||
|
Short-term
|
1,871
|
1,789
|
81
|
|||||||||
|
Long-term
|
533
|
435
|
98
|
|||||||||
|
Totala
|
2,404
|
2,225
|
179
|
|||||||||
|
MFP = Microfinance Program, OCR = ordinary capital resources, TSCFP = Trade and Supply Chain Finance Program
|
||||||||||||
|
Notes: Short-term has maturity of less than 365 days. Long-term has maturity of 365 days or more. Numbers may not sum precisely because of rounding.
|
||||||||||||
|
a Includes $1,788 million guarantees ($1,625 million – 2024) and
$399 million loans ($346 million – 2024) under TSCFP, and $217 million ($254 million – 2024) guarantees under MFP.
|
||||||||||||
|
4.
|
Other Debt Securities
|
|
5.
|
Nonsovereign Cofinancing and Direct Mobilization
|
|
6.
|
Transaction Advisory Services
|
|
7.
|
Debt Management Products
|
|
D.
|
Funding Resources
|
|
1.
|
Equity
|
|
2025
|
2024
|
|||||||
|
Authorized (SDR106,392)
|
||||||||
|
Subscribed (SDR106,392)
|
$
|
145,833
|
$
|
138,749
|
||||
|
Less: Callable capital subscribed
|
138,525
|
131,796
|
||||||
|
Paid-in capital subscribed
|
7,308
|
6,953
|
||||||
|
Less: Other adjustmentsa
|
19
|
25
|
||||||
|
7,289
|
6,928
|
|||||||
|
Add: (1) ADF assets transferb
|
30,748
|
30,748
|
||||||
|
(2) Other reservesc
|
19,973
|
18,759
|
||||||
|
Total Equity
|
$
|
58,010
|
$
|
56,435
|
||||
|
ADF = Asian Development Fund, SDR = special drawing rights, OCR = ordinary capital resources.
|
|
|
| a |
Comprises discount and nonnegotiable, noninterest-bearing demand obligations on account of subscribed capital. (See OCR-1 of the Financial Statements).
|
|
| b | The transfer of ADF assets to OCR on 1 January 2017 was treated as a contribution from ADF which was recognized as a one-time income. | |
| c | Includes ordinary reserve, special reserve, surplus, cumulative revaluation adjustments, and net income after appropriation less net notional amounts required to maintain value of currency holdings and accumulated other comprehensive loss. (See OCR-1 of the Financial Statements). | |
|
For the years ended
|
||||||||
|
2024
|
2023
|
|||||||
|
Net Income
|
1,629
|
938
|
||||||
|
Adjustment to cumulative revaluation adjustments
|
(63
|
)
|
513
|
|||||
|
Appropriation of guarantee fees to special reserve
|
(27
|
)
|
(28
|
)
|
||||
|
Allocable net income (non-GAAP measure)
|
1,539
|
1,423
|
||||||
|
Allocation to ordinary reserve
|
1,016
|
1,005
|
||||||
|
Allocation to special funds
|
||||||||
|
Asian Development Fund
|
394
|
293
|
||||||
|
Technical Assistance Special Fund
|
130
|
110
|
||||||
|
Asia Pacific Disaster Response Fund
|
–
|
15
|
||||||
|
Total Allocated Net Income
|
1,539
|
1,423
|
||||||
|
( ) = negative, – = nil, OCR = ordinary capital resources.
Note: Numbers may not sum precisely because of rounding.
|
||||||||
|
2.
|
Borrowings
|
|
Themes
|
Amount
($ million)
|
Maturity range of
bonds issueda
|
|||
|
Green
|
9,914
|
1 to 14 years
|
|||
|
Gender
|
6,864
|
1 to 20 years
|
|||
|
Health
|
5,835
|
1 to 20 years
|
|||
|
Education
|
1,464
|
0.8 to 10 years
|
|||
|
Blue
|
539
|
5 to 15 years
|
|||
|
Water
|
401
|
1 to 15 years
|
|||
|
Biodiversity & Nature
|
97 |
10 years
|
|||
|
Total Outstanding Thematic Bonds
|
25,115
|
||||
|
Note: Numbers may not sum precisely because of rounding.
a Refers to maturity from bond’s issue date. Bonds with call options are assumed to be called on the first call or trigger date.
|
|||||
|
Item
|
2025
|
2024
|
||||||
|
Bonds
|
|
|
||||||
|
Total Principal Amount
|
41,704
|
33,130
|
||||||
|
Total Proceeds Amount
|
38,201
|
32,992
|
||||||
|
Average Maturity to First Call (years)a
|
4.6
|
4.5
|
||||||
|
Average Final Maturity (years)a
|
6.8
|
4.8
|
||||||
|
Euro Commercial Papers
|
|
|
||||||
|
Total Principal Amount
|
8,343
|
10,984
|
||||||
|
Total Proceeds Amount
|
8,308
|
10,921
|
||||||
|
Number of Transactions
|
75
|
91 |
||||||
|
a
|
Weighted average maturity calculations are based on weighted proceeds amount. 2024 figures were previously calculated based on weighted principal
amount and were restated based on weighted proceeds amount.
|
|
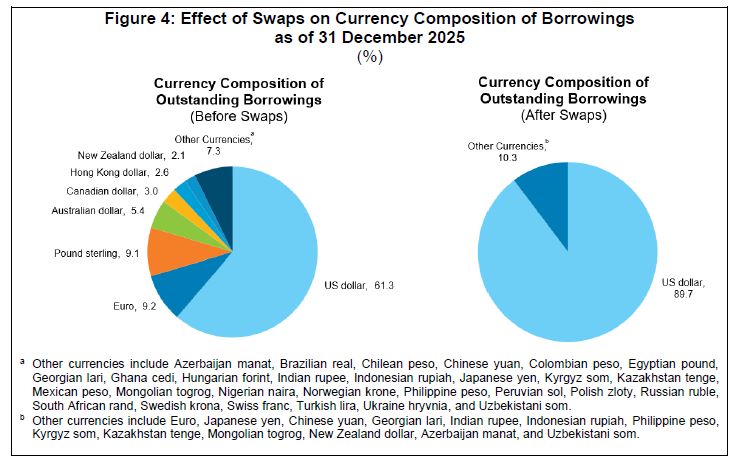
10
|
Australian dollar, Brazilian real, Canadian dollar, Chinese yuan, Egyptian pound, Euro, Georgian lari, Ghanaian cedi, Hong Kong dollar, Hungarian forint, Kazakhstan tenge, Mexican peso, Mongolian
togrog, Nigerian naira, Norwegian krone, Peruvian sol, Philippine peso, Polish zloty, Pound sterling, South African rand, Swedish krona, Swiss franc, Turkish lira, US dollar, and Uzbekistan sum.
|
|
E.
|
Liquidity Management
|
|
1.
|
Liquidity Portfolio
|
|
Investments
Outstandinga
($ million)
|
Return on Investment Portfolio
|
|||||||||||||||||||||||
|
Amortized Costb
(%)
|
Fair Valuec
(%)
|
|||||||||||||||||||||||
|
Item
|
2025
|
2024
|
2025
|
2024
|
2025
|
2024
|
||||||||||||||||||
|
Equity-Funded Liquidity Portfolio
|
19,842
|
19,817
|
3.2
|
3.0
|
5.8
|
3.8
|
||||||||||||||||||
|
Debt-Funded Liquidity Portfoliod
|
23,723
|
22,264
|
0.3
|
0.4
|
0.3
|
0.4
|
||||||||||||||||||
|
Cash Cushion Portfolio
|
15,693
|
6,199
|
4.6
|
5.7
|
4.7
|
6.0
|
||||||||||||||||||
|
Operational Cash Portfolio
|
206
|
214
|
3.3
|
4.7
|
3.3
|
4.7
|
||||||||||||||||||
|
Ad hoc Portfolio
|
1,344
|
1,236
|
2.6
|
2.6
|
6.3
|
3.6
|
||||||||||||||||||
|
Total
|
60,808
|
49,730
|
||||||||||||||||||||||
|
a
|
Includes securities transferred under repurchase agreements, securities purchased under resale arrangements, and investment related
swaps. The composition of the liquidity portfolio may shift from year to year as part of ongoing liquidity management.
|
|
b
|
Based on income from investments and realized gains and losses reported in the Statement of Income and Expenses.
|
|
c
|
Includes unrealized gains and losses reported in other comprehensive income and losses and movements are dependent on prevailing market
environment.
|
|
d
|
The return on debt-funded liquidity portfolio is presented as spread over funding cost on both amortized and fair value basis.
|
|
2.
|
Prudential Minimum Liquidity
|
| 3. |
Contractual Cash Obligations
|
|
Maturities
|
||||||||||||
|
Item
|
within
one year
|
more than one year
|
Total
|
|||||||||
|
Long-Term Debt
|
37,653
|
128,298
|
165,951
|
|||||||||
|
Undisbured Commitmentsa
|
15,075
|
42,851
|
57,925
|
|||||||||
|
Other Liabilities
|
2,402
|
79
|
2,480
|
|||||||||
|
Total
|
55,129
|
171,227
|
226,356
|
|||||||||
|
a
|
Includes undisbursed commitments for loans, equity investments, and other debt securities.
|
| F. |
Risk Management
|
|
11
|
ADB. 1966. By-Laws of the Asian Development Bank.
|
| 1. |
Credit Risk
|
|
ADB Internal
Rating Scale
|
Credit Rating
Agency Equivalent
|
ADB Definitions
|
|
1
|
AAA / Aaa to A / A2
|
Lowest expectation of credit risk
|
|
2
|
A– / A3
|
Very low credit risk
|
|
3
|
BBB+ / Baa1
|
Low credit risk
|
|
4
|
BBB / Baa2
|
Low credit risk
|
|
5
|
BBB– / Baa3
|
Low to moderate credit risk
|
|
6
|
BB+ / Ba1
|
Moderate credit risk
|
|
7
|
BB / Ba2
|
Moderate credit risk
|
|
8
|
BB– / Ba3
|
Moderate credit risk
|
|
9
|
B+ / B1
|
Significant credit risk
|
|
10
|
B / B2
|
Significant credit risk
|
|
11
|
B– / B3
|
High credit risk
|
|
12
|
CCC+ / Caa1
|
High credit risk
|
|
13
|
CCC / Caa2 to C
|
Very high credit risk
|
|
14
|
D
|
Nonaccrual
|
|
2025
|
2024
|
|||||||||||||||
|
Exposure
|
Rating
|
Exposure
|
Rating
|
|||||||||||||
|
Item
|
($ million)
|
(1–14)
|
($ million)
|
(1–14)
|
|
|||||||||||
|
Loans and guaranteesa
|
165,205
|
156,970
|
||||||||||||||
|
a. Sovereign operationsb
|
156,220
|
10.0 / B
|
|
149,030
|
10.1 / B
|
|
||||||||||
|
1. Regular OCR Loans and guarantees
|
120,563
|
9.4 / B+
|
|
115,647
|
9.4 / B+
|
|
||||||||||
|
2. Concessional OCR Loans
|
35,657
|
10.8 / B–
|
33,384
|
11.2 / B–
|
||||||||||||
|
b. Nonsovereign operations
|
8,985
|
8.9 / B+
|
|
7,939
|
9.8 / B
|
|
||||||||||
|
Equity Investmentsc
|
1,992
|
1,627
|
||||||||||||||
|
a. Sovereign operations
|
187
|
n/a
|
177
|
n/a
|
||||||||||||
|
b. Nonsovereign operations
|
1,805
|
n/a
|
1,450
|
n/a
|
||||||||||||
|
Treasuryd
|
60,724
|
|
AA |
50,198
|
|
AA
|
||||||||||
|
a. Fixed income
|
40,030
|
|
AA
|
38,041
|
|
AA | ||||||||||
|
b. Cash instruments
|
20,577
|
|
AA–
|
12,046
|
|
AA–
|
||||||||||
|
c. Derivatives
|
117
|
|
AA |
110
|
|
AA–
|
||||||||||
|
Aggregate Exposure
|
227,922
|
208,795
|
||||||||||||||
|
a
|
Sum of outstanding loan balances, present value of guaranteed obligation, and securities classified as debt net of specific provision.
|
|
b
|
As of 31 December 2025, $9 billion of the sovereign loan and guarantee credit exposure is part of the exposure exchange mechanism with
peer MDBs ($6 billion – 2024). The amount indicated excludes the ADB sovereign loans which are guaranteed by the MDB and includes the same amount of ADB guarantee issued to that MDB as
part of the exchange.
|
|
c
|
At fair values.
|
|
d
|
Average rating based on ratings from international credit rating agencies.
|
|
12
|
The average risk ratings are based on the average probability of default weighted by the outstanding credit exposure which is related back
to the internal rating scale based on the probability of default for each internal risk rating category. The probabilities of default are updated regularly. The computation of the average
risk rating for the period uses the most recent set of probabilities of default available at the end of the corresponding period. Starting year-end 2025, the calculation excludes exposures
in nonaccrual status (14 or D), which are already in default.
|
|
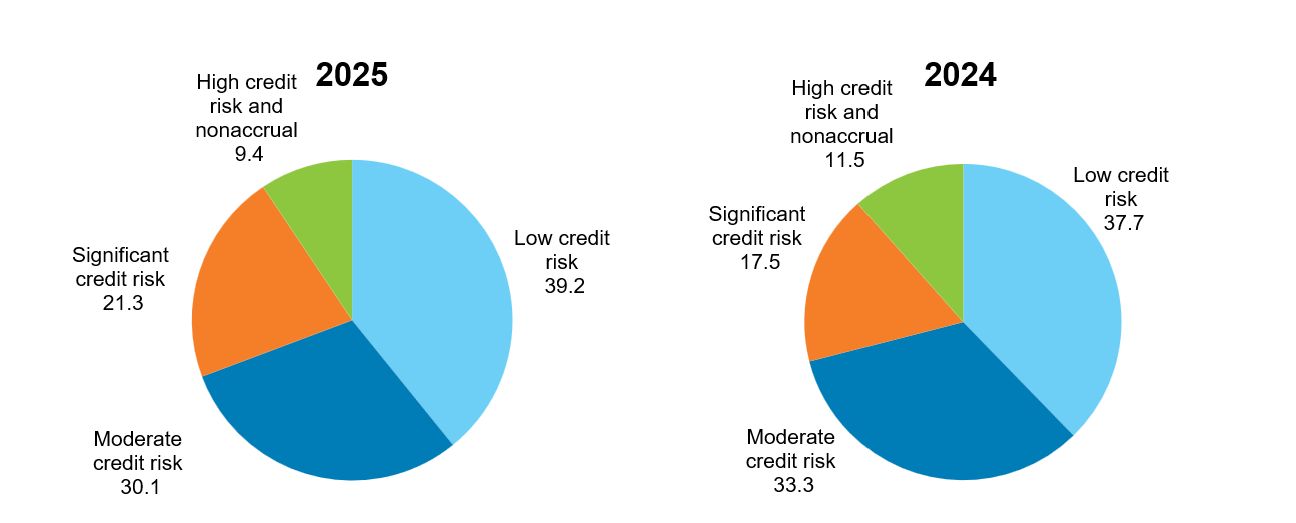
Figure 6: Sovereign Loan and Guarantee Exposure by Credit Quality
as of 31 December 2025 and 2024
(%)
|
||
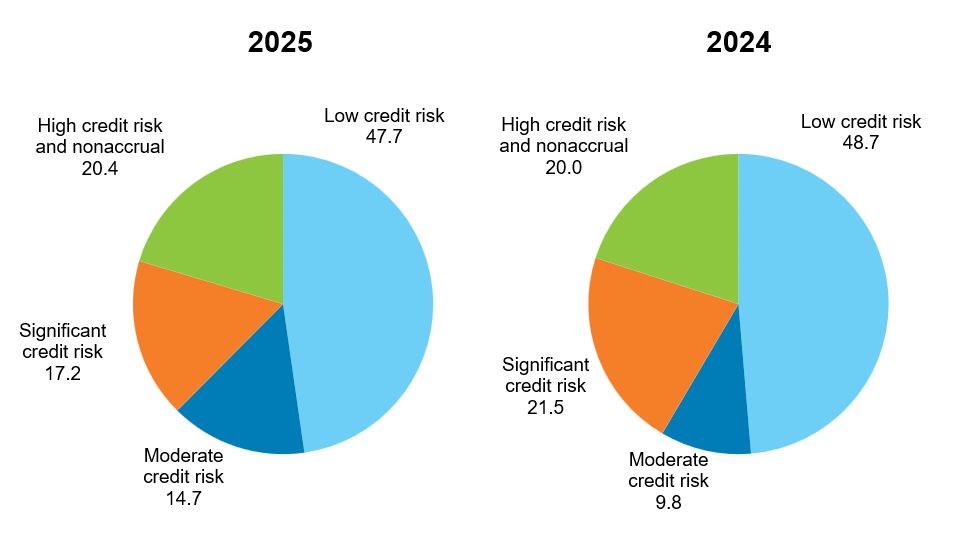 Notes: Low credit risk = exposures with risk rating 1–5, moderate credit risk = exposures with risk rating 6–8, significant credit risk
= exposures with risk rating 9–10, high credit risk and nonaccrual = exposures with risk rating 11–14.
|
||
|
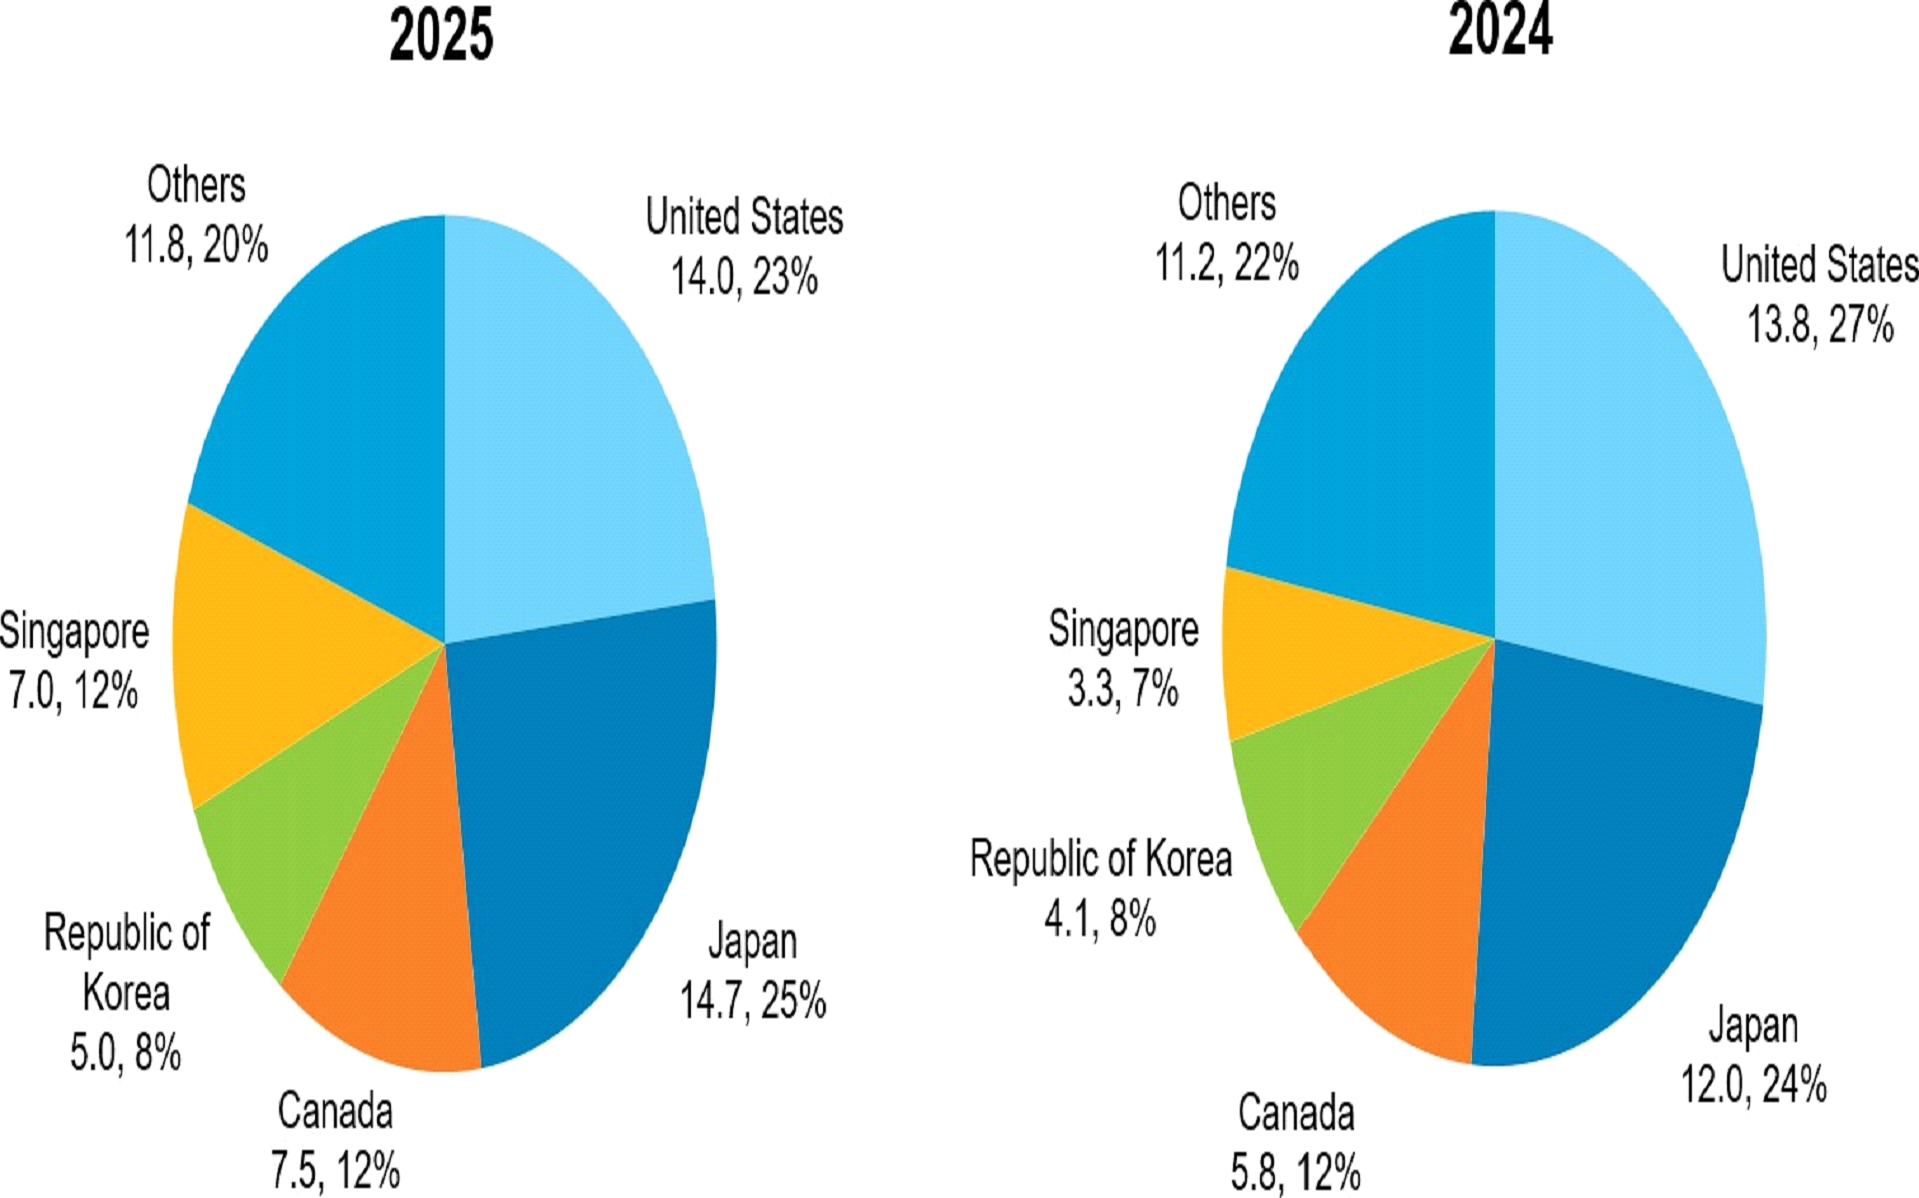
Figure 7: Sovereign Country Exposure
as of 31 December 2025 and 2024
($ billion, unless otherwise stated)
|
||
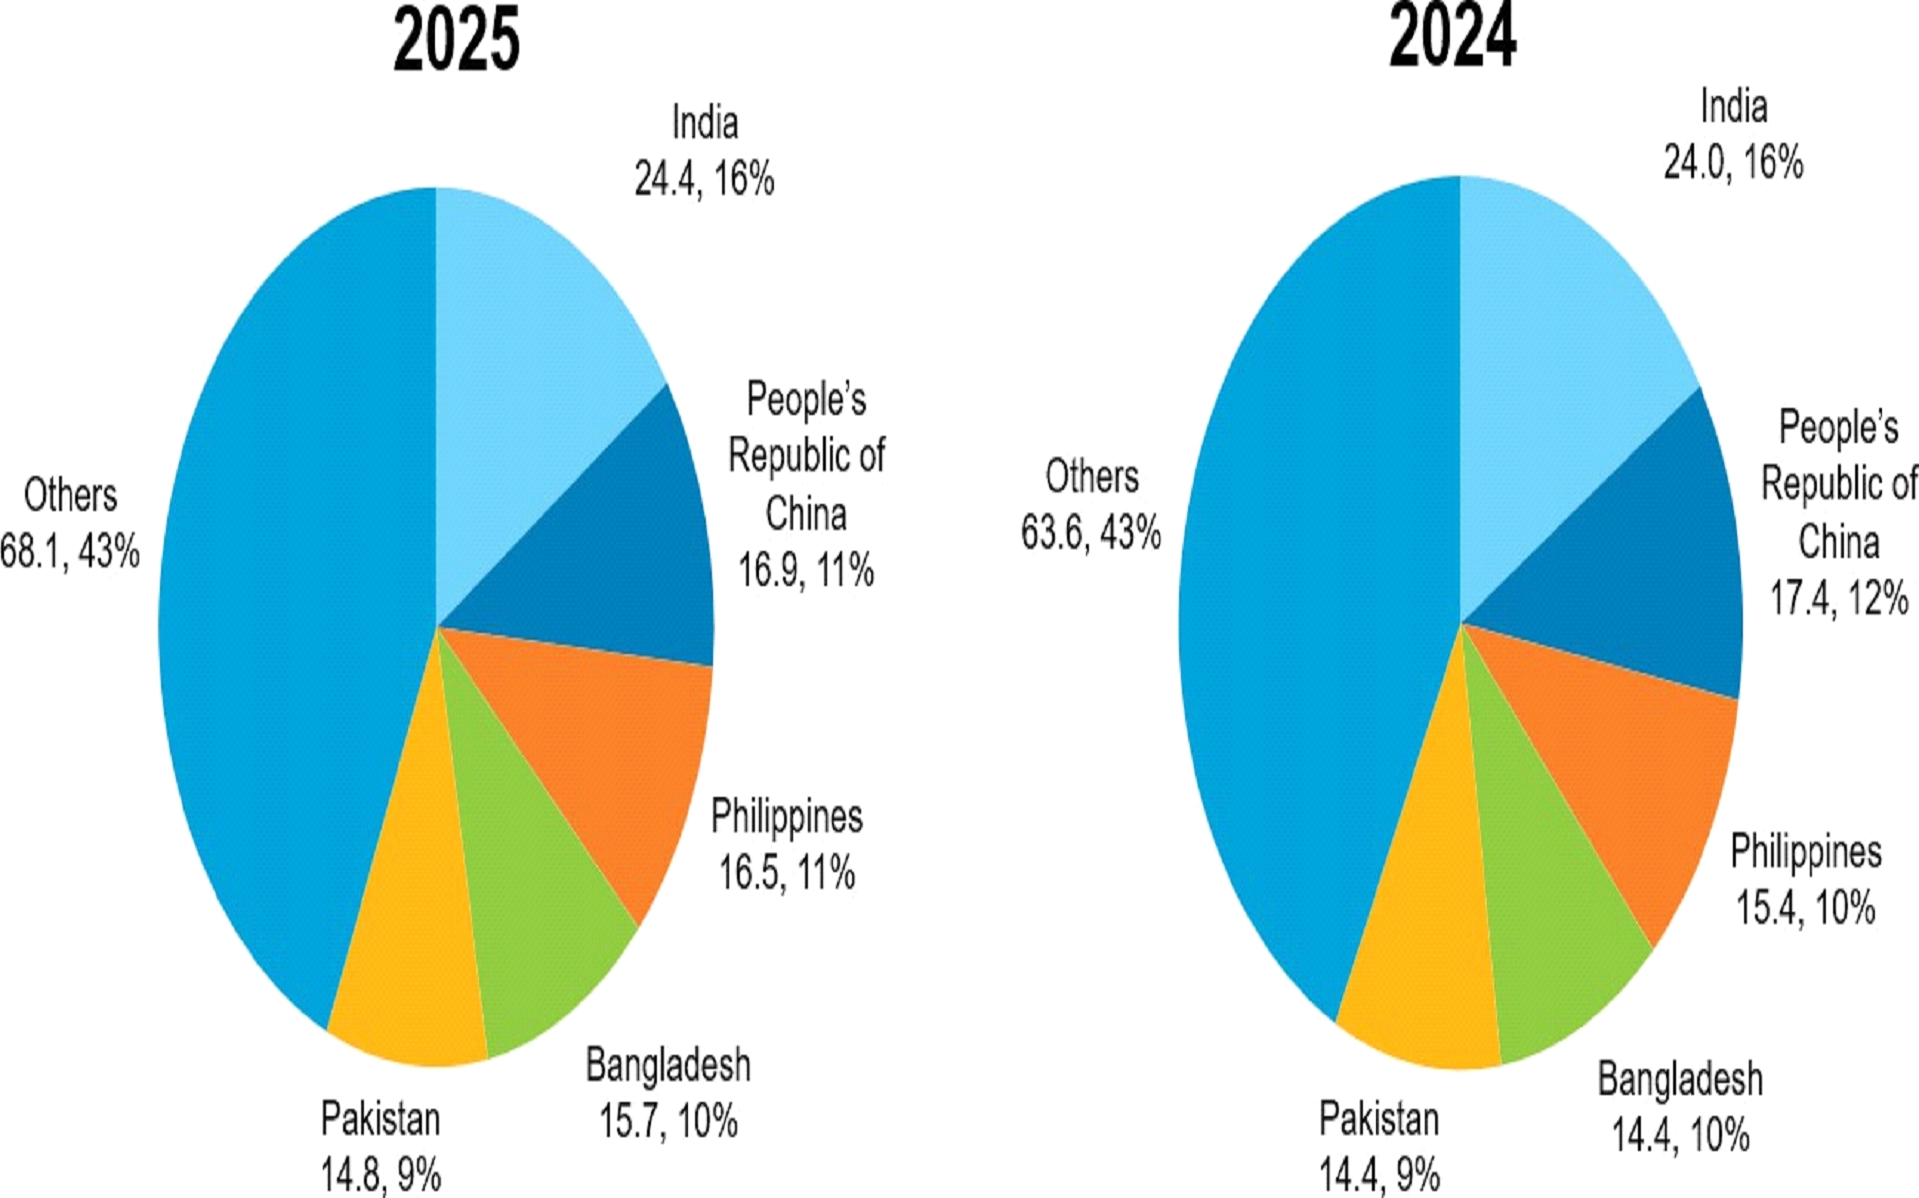 Note: The sum of disbursed and outstanding loan balances, present value of guaranteed obligations and fair values of equities.
|
||
|
Figure 8: Nonsovereign Loan and Guarantee Exposure by Credit Quality
as of 31 December 2025 and 2024
(%)
|
||
 |
||
|
Notes: Low credit risk = exposures with risk rating 1–5, moderate credit risk = exposures with risk rating 6–8, significant credit risk =
exposures with risk rating 9–10, high credit risk and nonaccrual = exposures with risk rating 11–14. The breakdown represents the split of net exposure after allowance for credit
losses for individually impaired transactions.
|
|
Figure 9: Nonsovereign Country Exposurea
as of 31 December 2025 and 2024
($ billion, unless otherwise stated)
|
||
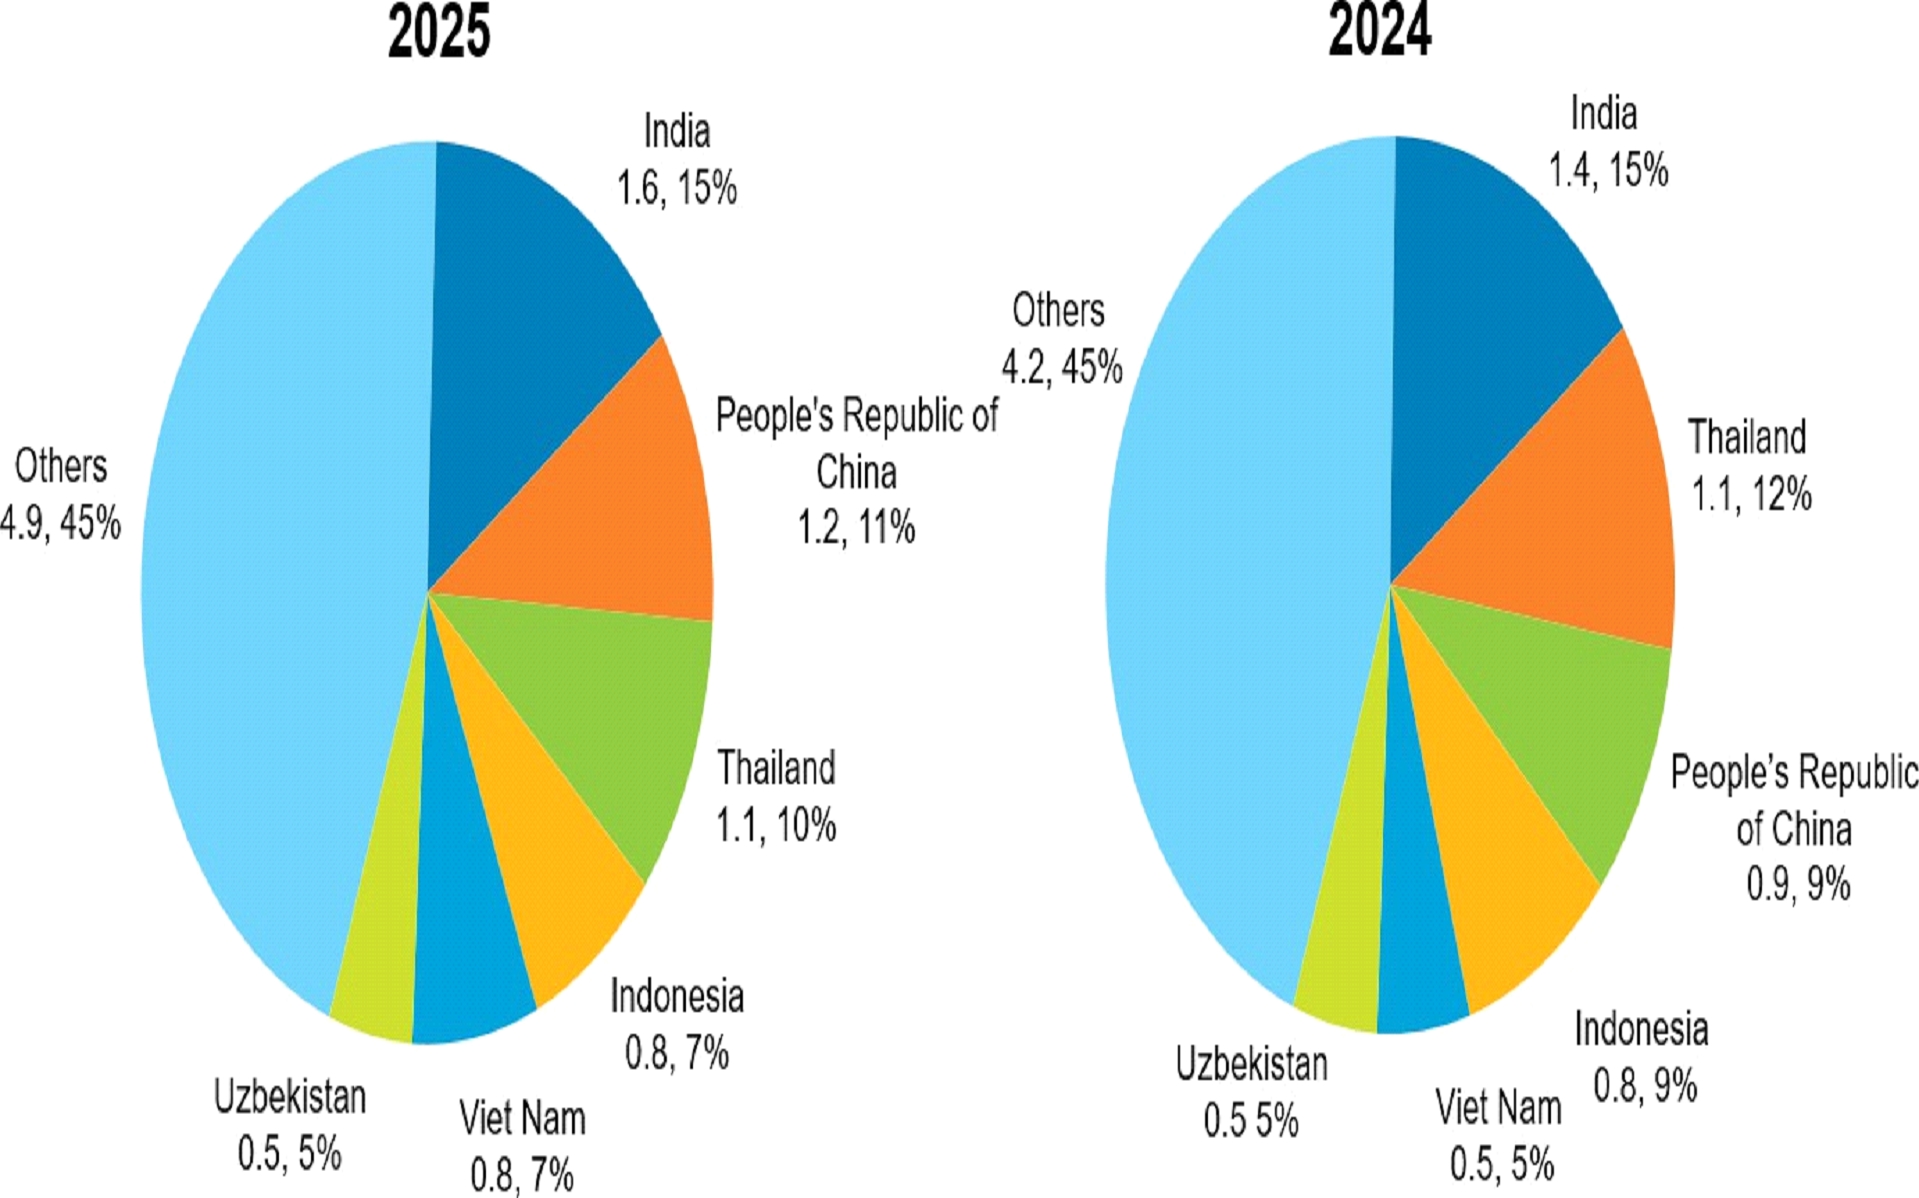
Note: Numbers may not sum precisely because of rounding.
a
The sum of disbursed and outstanding loan balances and other debt securities, present value of guaranteed obligations and fair values of equities.
|
|
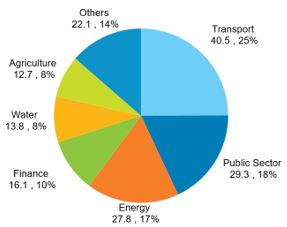
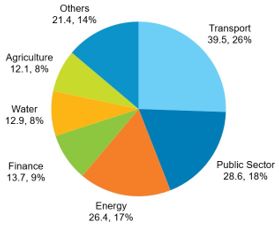
Figure 10: Nonsovereign Sector Exposure
as of 31 December 2025 and 2024
($ billion, unless otherwise stated)
|
||
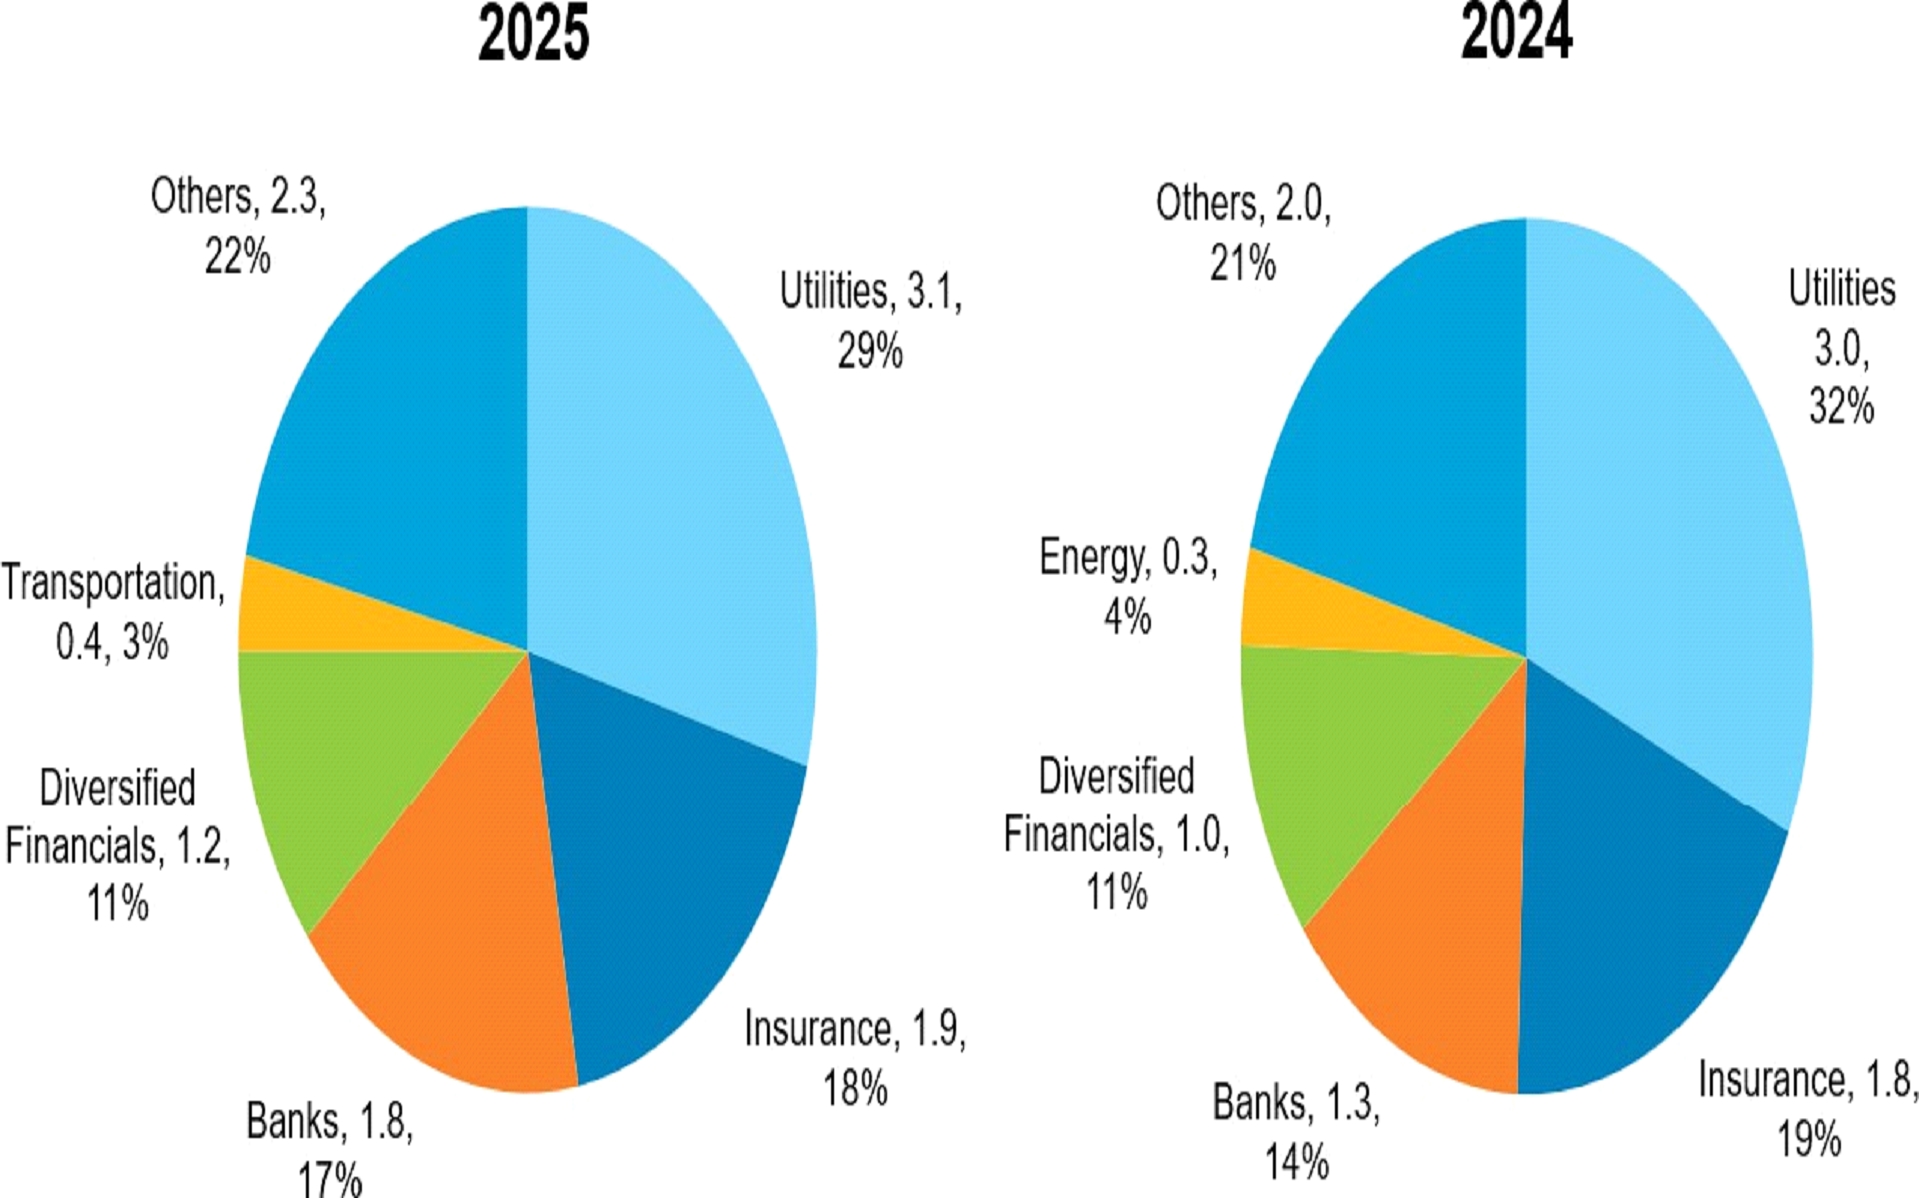 Notes: Numbers may not sum precisely because of rounding. Percentages may not total 100% because of rounding.
|
|
Figure 11: Breakdown of Treasury Credit Exposure
as of 31 December 2025
($ billion, unless otherwise stated)
|
||
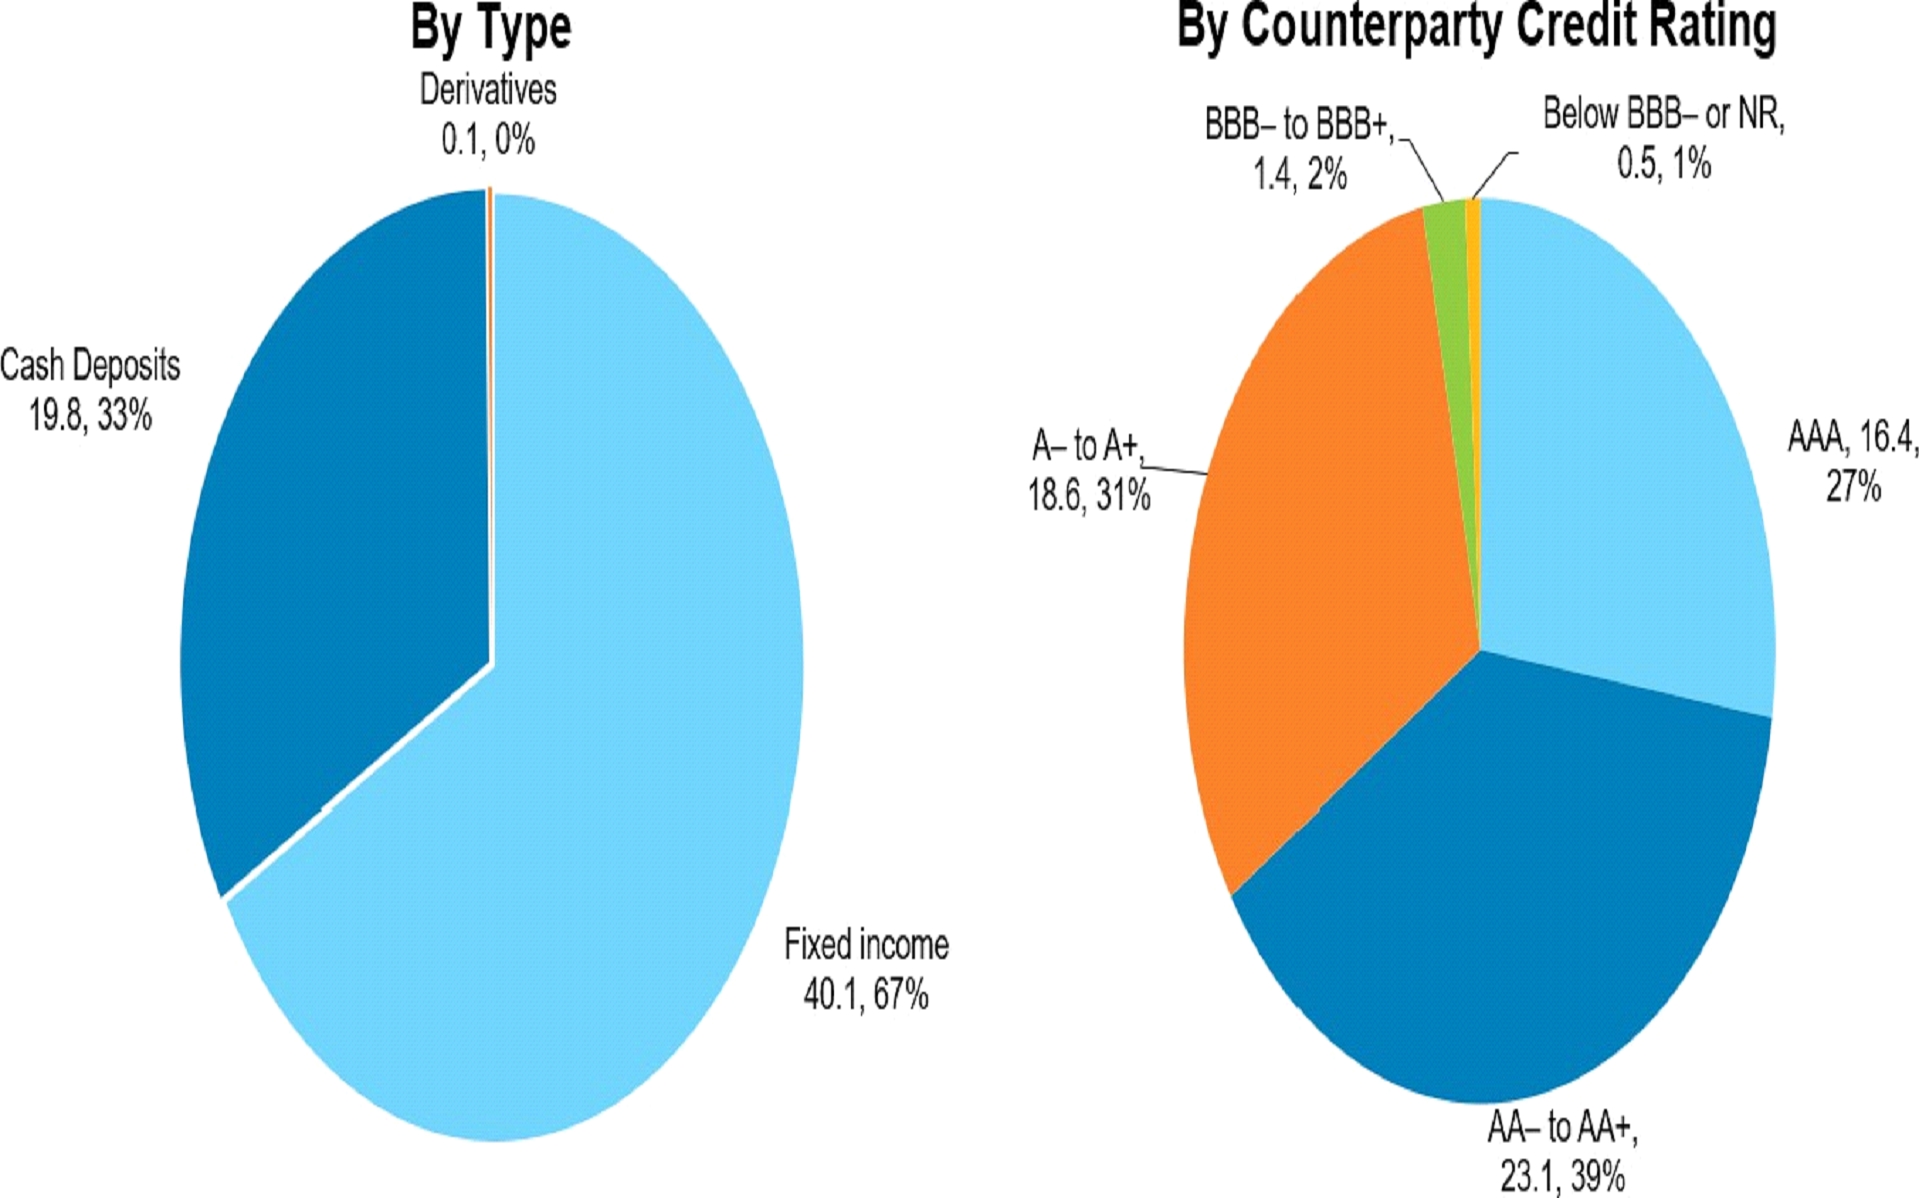
Notes: Numbers may not sum precisely because of rounding. Percentages may not total 100% because of rounding. 0% = percentage less than 0.5%.
|
|
Figure 12: Fixed Income Portfolio by Asset Class
as of 31 December 2025 and 2024
($ billion, unless otherwise stated)
|
||
 |
|
Figure 13: Treasury Country Exposure as
of 31 December 2025 and 2024
($ billion, unless otherwise stated)
|
||
Note: Numbers may not sum precisely because of rounding.
|
| 2. |
Market Risk
|
| 3. |
Liquidity Risk
|
| 4. |
Operational Risk
|
|
13
|
These changes in fair valuation would only be realized in case the investments are sold prior to maturity. ADB typically does not sell the bond
investments in the liquidity portfolio prior to maturity and thus the fluctuations in the fair value remain unrealized.
|
| 5. |
Capital Adequacy
|
| 6. |
Asset and Liability Management
|
| G. |
Internal Control over Financial Reporting
|
| H. |
Critical Accounting Policies and Estimates
|
| A. |
Asian Development Fund
|
|
14
|
US dollar equivalent based on the Board of Governors’ Resolution No. 427 exchange rates.
|
|
Item
|
Amount
|
|||
|
Carryover of ADF 13 Commitment Authority
|
415
|
|||
|
Other sources from previous ADF cyclesa
|
506
|
|||
|
ADF 14 contributions
|
445
|
|||
|
ADF 13 contributionsb
|
34
|
|||
|
Grant and guarantee savings and cancellations
|
3
|
|||
|
Income from liquidity investment
|
88
|
|||
|
OCR net income transfer
|
394
|
|||
|
Resources available for regular ADF
|
1,885
|
|||
|
ADF 14 Commitments
|
(1,310
|
)
|
||
|
Administrative expensesc
|
(98
|
)
|
||
|
ADF Commitment Authority Available for Future Commitments
|
476
|
|||
|
Notes: Numbers may not sum precisely because of rounding. Numbers are valued at exchange rates as of 31 December 2025. Commitments include grants and
guarantees under the private sector window, including the Wayfinder Program approved by the Board in June 2025.
a Resources earmarked for ADF 14
represent savings and cancellations from previous ADF cycles, as well as partial releases of ADF 13 funds allocated to the expanded disaster and pandemic response facility and debt
distress reserve (ADB. 2024. Thirteenth Replenishment of the Asian Development Fund and Eighth Regularized Replenishment of the Technical Assistance
Special Fund. Manila)
b
Represents payment from the United States.
c
Represents ADF’s share in the administrative expenses for 2025.
|
||||
|
15
|
ADF 14 encashment included encashment of promissory notes and cash payments. US dollar equivalent based on exchange rates as of 31 December 2025.
|
|
16
|
Includes securities purchased under resale arrangements.
|
ADB MANAGEMENT’S DISCUSSION AND ANALYSIS: 31 DECEMBER 2025
| B. |
Technical Assistance Special Fund
|
|
Item
|
2025
|
2024
|
||||||
|
Regularized Replenishment
|
||||||||
|
Contributions
|
2,642
|
2,128
|
||||||
|
Allocations from OCR Net Income
|
1,849
|
1,719
|
||||||
|
Direct Voluntary Contributions
|
91
|
91
|
||||||
|
Income from Investment and
|
||||||||
|
Other Sources
|
334
|
286
|
||||||
|
Transfers from the TASF to the ADF
|
(3
|
)
|
(3
|
)
|
||||
|
Total
|
4,913
|
4,222
|
||||||
|
( ) = negative, ADF = Asian Development Fund, OCR = ordinary capital resources,
TASF = Technical Assistance Special Fund.
Note: Numbers may not sum precisely because of rounding
|
||||||||
| C. |
Japan Special Fund
|
|
D.
|
Asian Development Bank Institute
|
|
17
|
In the event of a nonaccrual in the reference portfolio under the IF-CAP Guarantee Mechanism, the Government of Japan’s payment of its share of risk
participation will be channeled through the JSF IF-CAP Window.
|
| E. |
Regional Cooperation and Integration Fund
|
| F. |
Climate Change Fund
|
| G. |
Asia Pacific Disaster Response Fund
|
| H. |
Financial Sector Development Partnership Special Fund
|
|
18
|
B-loan is a tranche of a direct loan nominally advanced by ADB, subject to eligible financial institutions taking funded risk participation within such a tranche and without
recourse to ADB. It complements an A-loan financed by ADB.
|
| Item |
Amount |
Item | Amount | ||||||
|
Bilateral Partners
|
Multilateral Partners
|
||||||||
|
Australia
|
325.9
|
ADB Ventures Investment Fund 1
|
13.0
|
||||||
|
Austria
|
14.4
|
ADB Ventures Investment Fund 2
|
26.4
|
||||||
|
Canada
|
518.8
|
Clean Technology Fund
|
982.1
|
||||||
|
People’s Republic of China
|
90.0
|
Clean Technology Fund Parallel Fund
|
218.5
|
||||||
|
Finland
|
42.4
|
European Union
|
246.3
|
||||||
|
France
|
13.7
|
GEF/Least Developed Countries Fund
|
45.5
|
||||||
|
Germany
|
164.3
|
GEF/Special Climate Change Fund
|
12.2
|
||||||
|
Ireland
|
19.7
|
Global Agriculture and Food Security Program
|
87.1
|
||||||
|
Japan
|
3,293.3
|
Global Concessional Finance Facility
|
16.5
|
||||||
|
Korea, Republic of
|
271.7
|
Global Environment Facility
|
295.6
|
||||||
|
Luxembourg
|
11.1
|
Global Infrastructure Facility Partnership Program
|
1.4
|
||||||
|
Netherlands
|
37.8
|
Global Partnership for Education Fund
|
23.1
|
||||||
|
New Zealand
|
72.3
|
Green Climate Fund
|
1,451.1
|
||||||
|
Norway
|
162.6
|
International Finance Facility for Education Trust Fund
|
0.1
|
||||||
|
Spain
|
59.6
|
International Fund for Agricultural Development
|
0.1
|
||||||
|
Sweden
|
67.5
|
Nordic Development Fund
|
60.0
|
||||||
|
Switzerland
|
23.8
|
Pandemic Prevention, Preparedness and Response Trust Fund
|
19.8
|
||||||
|
Taipei,China
|
2.0
|
Strategic Climate Fund
|
466.1
|
||||||
|
United Kingdom
|
873.5
|
Women Entrepreneurs Finance Initiative Trust Fund
|
35.1
|
||||||
|
United States
|
461.1
|
World Bank
|
10.0
|
||||||
|
Subtotal
|
6,525.8
|
Subtotal
|
4,010.0
|
||||||
|
Private Partners
|
|||||||||
|
Gates Foundation
|
27.0
|
||||||||
|
Bloomberg Philanthropies
|
12.5
|
||||||||
|
Education Above All Foundation
|
24.5
|
||||||||
|
Global Energy Allicance for People and Planet LLC
|
25.8
|
||||||||
|
Goldman Sachs
|
12.5
|
||||||||
|
Korea Energy Agency
|
0.4
|
||||||||
|
Korea Venture Investment Corp.
|
10.0
|
||||||||
|
Ocean Risk and Resilience Action Alliance
|
0.3
|
||||||||
|
The OPEC Fund for International Development
|
5.4
|
||||||||
|
The Rockefeller Foundation
|
2.6
|
||||||||
|
Subtotal
|
120.8
|
||||||||
|
Grand Total
|
10,656.5
|
||||||||
| 2025 | 2024 |
|||||||||||||||
|
Item
|
Statutory
Reporting Basis
|
Adjustmentsa
|
Management
Reporting Basis
|
Management
Reporting Basis
|
||||||||||||
|
Due from banks
|
496
|
–
|
496
|
2,235
|
||||||||||||
|
Investments for liquidity purpose
|
57,725
|
–
|
57,725
|
46,695
|
||||||||||||
|
Securities transferred under repurchase agreements
|
872
|
–
|
872
|
–
|
||||||||||||
|
Securities purchased under resale arrangements
|
252
|
–
|
252
|
260
|
||||||||||||
|
Loans outstanding — operations
|
161,063
|
–
|
161,063
|
153,864
|
||||||||||||
|
Equity investments — operations
|
1,992
|
(413
|
)
|
1,579
|
1,329
|
|||||||||||
|
Other debt securities — operations
|
552
|
–
|
552
|
621
|
||||||||||||
| Derivative Assets |
||||||||||||||||
|
Borrowings
|
75,750
|
(32
|
)
|
75,718
|
62,476
|
|||||||||||
|
Investments for liquidity purpose
|
29,554
|
(299
|
)
|
29,255
|
25,669
|
|||||||||||
|
Loans — operations
|
17,391
|
(225
|
)
|
17,166
|
18,149
|
|||||||||||
|
Accrued interest receivable
|
1,684
|
–
|
1,684
|
1,697
|
||||||||||||
|
Other assets
|
1,719
|
5
|
1,724
|
2,010
|
||||||||||||
|
TOTAL
|
349,050
|
(964
|
)
|
348,086
|
315,005
|
|||||||||||
|
Borrowings and accrued interest
|
165,951
|
2,819
|
168,770
|
151,959
|
||||||||||||
| Derivative Liabilities | ||||||||||||||||
|
Borrowings
|
78,627
|
(3,249
|
)
|
75,378
|
66,906
|
|||||||||||
|
Investments for liquidity purpose
|
27,596
|
(86
|
)
|
27,510
|
23,058
|
|||||||||||
|
Loans — operations
|
15,501
|
392
|
15,893
|
15,675
|
||||||||||||
|
Payable under securities repurchase agreements
|
881
|
–
|
881
|
–
|
||||||||||||
|
Payable for swap related and other collateral
|
1,258
|
–
|
1,258
|
857
|
||||||||||||
|
Accounts payable and other liabilities
|
1,226
|
–
|
1,226
|
977
|
||||||||||||
|
Total Liabilities
|
291,040
|
(124
|
)
|
290,916
|
259,432
|
|||||||||||
|
Paid-in capital
|
7,289
|
5
|
7,294
|
6,940
|
||||||||||||
|
Net notional maintenance of value receivable
|
(1,651
|
)
|
–
|
(1,651
|
)
|
(1,481
|
)
|
|||||||||
|
Ordinary reserve
|
48,556
|
–
|
48,556
|
47,542
|
||||||||||||
|
Special reserve
|
578
|
–
|
578
|
558
|
||||||||||||
|
Surplus
|
1,065
|
–
|
1,065
|
1,065
|
||||||||||||
|
Cumulative revaluation adjustments account
|
525
|
(525
|
)
|
–
|
–
|
|||||||||||
|
Unallocated net incomeb
|
1,883
|
(423
|
)
|
1,460
|
1,539
|
|||||||||||
|
Accumulated other comprehensive loss
|
(235
|
)
|
103
|
(132
|
)
|
(590
|
)
|
|||||||||
|
Total Equity
|
58,010
|
(840
|
)
|
57,170
|
55,573
|
|||||||||||
|
TOTAL
|
349,050
|
(964
|
)
|
348,086
|
315,005
|
|||||||||||
|
a
|
Unrealized gains or losses from fair value adjustments associated with certain financial instruments, share of unrealized gain or loss from equity method investments, and nonnegotiable and noninterest-bearing
demand obligations on account of subscribed capital.
|
|
b
|
After appropriation of net guarantee fees to the Special Reserve.
|
 |
|
Masato Kanda
|
|
President
|
 |
| Roberta Casali |
| Vice-President (Finance and Risk Management) |
 |
|
Helen Hall
|
|
Controller
|
 |
Deloitte & Touche LLP Unique Entity No. T08LL0721A 6 Shenton Way OUE Downtown 2 #33-00 Singapore 068809 Tel: +65 6224 8288 Fax: +65 6538 6166 www.deloitte.com/sg |

| • |
Exercise professional judgment and maintain professional skepticism throughout the audit.
|
| • |
Obtain an understanding of internal control over financial reporting, assess the risks that a material weakness exists, and test and evaluate the design and operating effectiveness of
internal control over financial reporting based on the assessed risk.
|

|
|
Deloitte & Touche LLP
Unique Entity No. T08LL0721A 6 Shenton Way OUE Downtown 2 #33-00 Singapore 068809 Tel: +65 6224 8288 Fax: +65 6538 6166 www.deloitte.com/sg |
| • |
Exercise professional judgment and maintain professional skepticism throughout the audit.
|
| • |
Identify and assess the risks of material misstatement of the financial statements, whether due to fraud or error, and design and perform audit procedures
responsive to those risks. Such procedures include examining, on a test basis, evidence regarding the amounts and disclosures in the financial statements.
|
| • |
Obtain an understanding of internal control relevant to the audit in order to design audit procedures that are appropriate in the circumstances.
|
| • |
Evaluate the appropriateness of accounting policies used and the reasonableness of significant accounting estimates made by management, as well as evaluate the
overall presentation of the financial statements.
|
| • |
Conclude whether, in our judgment, there are conditions or events, considered in the aggregate, that raise substantial doubt about ADB – Ordinary Capital
Resources’ ability to continue as a going concern for a reasonable period of time.
|

|
A S S E T S
|
||||||||||||||||
|
|
2025
|
2024
|
||||||||||||||
|
DUE FROM BANKS (Notes C and R)
|
$
|
496
|
$
|
2,235
|
||||||||||||
|
INVESTMENTS FOR LIQUIDITY PURPOSE
|
||||||||||||||||
|
(Notes D, J, O, and R)
|
||||||||||||||||
|
Government or government-related obligations
|
$
|
39,988
|
$
|
31,057
|
||||||||||||
|
Time deposits
|
7,559
|
4,602
|
||||||||||||||
|
Other securities
|
10,178
|
57,725
|
11,036
|
46,695
|
||||||||||||
|
|
||||||||||||||||
|
SECURITIES TRANSFERRED UNDER REPURCHASE AGREEMENTS (Notes D, E, and R)
|
872 |
|
– | |||||||||||||
|
|
||||||||||||||||
|
SECURITIES PURCHASED UNDER RESALE ARRANGEMENTS (Notes D and R)
|
252
|
260 | ||||||||||||||
|
LOANS OUTSTANDING — OPERATIONS
|
||||||||||||||||
|
(OCR-6, Notes A, F, J, R, T, and U) (Including net unamortized loan origination costs of $260 – 2025 and $245 – 2024)
|
||||||||||||||||
|
Sovereign
|
||||||||||||||||
|
Regular
|
119,361
|
115,352
|
||||||||||||||
|
Concessional
|
35,626
|
33,332
|
||||||||||||||
|
|
154,987
|
148,684
|
||||||||||||||
|
Nonsovereign
|
6,644
|
5,720
|
||||||||||||||
|
|
161,631
|
154,404
|
||||||||||||||
|
Less—allowance for credit losses
|
568
|
161,063
|
540
|
153,864
|
||||||||||||
|
EQUITY INVESTMENTS — OPERATIONS
|
||||||||||||||||
|
(Notes A, H, R, T, and U)
|
1,992
|
1,627
|
||||||||||||||
|
OTHER DEBT SECURITIES — OPERATIONS (Notes I, R, and U)
|
573
|
635
|
||||||||||||||
|
Less—allowance for credit losses
|
21
|
552
|
14
|
621
|
||||||||||||
|
ACCRUED INTEREST RECEIVABLE
|
||||||||||||||||
|
Investments for liquidity purpose
|
352
|
258
|
||||||||||||||
|
Loans — Operations
|
1,321
|
1,427
|
||||||||||||||
|
Other debt securities — Operations
|
11
|
1,684
|
12
|
1,697
|
||||||||||||
|
DERIVATIVE ASSETS (Notes J, L, and R)
|
||||||||||||||||
|
Borrowings
|
75,750
|
61,872
|
||||||||||||||
|
Investments for liquidity purpose
|
29,554
|
26,062
|
||||||||||||||
|
Loans — Operations
|
17,391
|
122,695
|
17,671
|
105,605
|
||||||||||||
|
OTHER ASSETS
|
||||||||||||||||
|
Property, furniture, and equipment (Note K)
|
336
|
309
|
||||||||||||||
|
Swap related and other collateral (Notes J and R)
|
508
|
857
|
||||||||||||||
|
Net postretirement medical benefit plan asset (Note Q)
|
105
|
253
|
||||||||||||||
|
Miscellaneous (Notes D, G, P, and R)
|
770
|
1,719
|
579
|
1,998
|
||||||||||||
|
TOTAL
|
$
|
349,050
|
$
|
314,602
|
||||||||||||
|
LIABILITIES AND EQUITY
|
||||||||||||||||||||||||
|
2025
|
2024
|
|||||||||||||||||||||||
|
BORROWINGS (OCR-7, Notes J, L, and R)
|
$ | 165,951 | $ | 146,517 | ||||||||||||||||||||
|
|
||||||||||||||||||||||||
|
DERIVATIVE LIABILITIES (Notes J, L, and R)
|
||||||||||||||||||||||||
|
Borrowings
|
$
|
78,627
|
$
|
71,703
|
||||||||||||||||||||
|
Investments for liquidity purpose
|
27,596
|
23,292
|
||||||||||||||||||||||
|
Loans — Operations
|
15,501
|
121,724
|
14,821
|
109,816
|
||||||||||||||||||||
|
|
||||||||||||||||||||||||
|
PAYABLE UNDER SECURITIES REPURCHASE AGREEMENTS (Notes E and R)
|
881
|
–
|
||||||||||||||||||||||
|
|
||||||||||||||||||||||||
|
ACCOUNTS PAYABLE AND OTHER LIABILITIES
|
||||||||||||||||||||||||
|
Swap related and other collateral (Notes J and R)
|
1,258
|
857
|
||||||||||||||||||||||
|
Accrued pension benefit costs (Note Q)
|
227
|
165
|
||||||||||||||||||||||
|
Liability for credit losses on off-balance sheet exposures (Notes F, G, and I)
|
144
|
121
|
||||||||||||||||||||||
|
Miscellaneous (Notes D, G, K, P, and R)
|
855
|
2,484
|
691
|
1,834
|
||||||||||||||||||||
|
|
||||||||||||||||||||||||
|
TOTAL LIABILITIES
|
291,040
|
258,167
|
||||||||||||||||||||||
|
|
||||||||||||||||||||||||
|
EQUITY (OCR-4)
|
||||||||||||||||||||||||
|
Capital stock (OCR-8, Note M)
|
||||||||||||||||||||||||
|
Authorized and subscribed (SDR106,392 million)
|
145,833
|
138,749
|
||||||||||||||||||||||
|
Less—“callable” shares subscribed (SDR101,061 million)
|
138,525
|
131,796
|
||||||||||||||||||||||
|
“Paid-in” shares subscribed (SDR5,331 million)
|
7,308
|
6,953
|
||||||||||||||||||||||
|
Less—discount
|
14
|
13
|
||||||||||||||||||||||
|
|
7,294
|
6,940
|
||||||||||||||||||||||
|
Nonnegotiable, noninterest-bearing demand obligations on account of subscribed capital
|
(5
|
)
|
7,289
|
(12
|
)
|
6,928
|
||||||||||||||||||
|
|
||||||||||||||||||||||||
|
Net notional amounts required to maintain value of currency holdings (Note M)
|
(1,651
|
)
|
(1,481
|
)
|
||||||||||||||||||||
|
Ordinary reserve (Note N)
|
||||||||||||||||||||||||
|
From ADF assets transfer (Notes A and N)
|
$
|
30,748
|
$
|
30,748
|
||||||||||||||||||||
|
From retained earnings
|
17,808
|
48,556
|
16,792
|
47,540
|
||||||||||||||||||||
|
Special reserve (Note N)
|
578 | 558 | ||||||||||||||||||||||
|
Surplus (Note N)
|
1,065
|
1,065
|
||||||||||||||||||||||
|
Cumulative revaluation adjustments account (Note N)
|
525
|
462 | ||||||||||||||||||||||
|
Net income after appropriation (OCR-4, Note N)
|
1,883
|
1,602
|
||||||||||||||||||||||
|
Accumulated other comprehensive loss (Note N)
|
(235
|
)
|
50,721
|
(239
|
)
|
49,507
|
||||||||||||||||||
|
|
||||||||||||||||||||||||
|
TOTAL EQUITY
|
58,010
|
56,435
|
||||||||||||||||||||||
|
|
||||||||||||||||||||||||
|
TOTAL
|
$
|
349,050
|
$
|
314,602
|
||||||||||||||||||||
|
2025
|
2024
|
|||||||||||||||||||||||
|
REVENUE
|
||||||||||||||||||||||||
|
From loans — operations (Notes F, J, and O)
|
||||||||||||||||||||||||
|
Sovereign – Regular
|
$
|
5,927
|
$
|
6,841
|
||||||||||||||||||||
|
Sovereign – Concessional
|
721
|
717
|
||||||||||||||||||||||
|
Nonsovereign
|
454 |
$ |
7,102
|
480 |
$ |
8,038 |
||||||||||||||||||
|
From investments for liquidity purpose (Notes D, J, and O)
Interest
|
2,551
|
2,731
|
||||||||||||||||||||||
|
From equity investments — operations (Note O)
|
161
|
102
|
||||||||||||||||||||||
|
From guarantees — operations (Note N)
|
27
|
27
|
||||||||||||||||||||||
|
From other debt securities — operations (Note O)
|
45
|
47
|
||||||||||||||||||||||
|
From other sources—net (Notes O and S)
|
94
|
84
|
||||||||||||||||||||||
|
Total
|
$
|
9,980
|
$
|
11,029
|
||||||||||||||||||||
|
EXPENSES (Note O)
|
||||||||||||||||||||||||
|
Borrowings and related expenses (Notes J and L)
|
(7,521
|
)
|
(8,717
|
)
|
||||||||||||||||||||
|
Administrative expenses (Notes K, N, and Q)
|
(817
|
)
|
|
(729 |
) |
|||||||||||||||||||
|
(Provision) Release of provision for credit losses—net (Notes F, G, and I)
|
(24
|
)
|
45 |
|||||||||||||||||||||
|
Other expenses
|
(44
|
)
|
|
(30 |
) |
|||||||||||||||||||
|
Total
|
(8,406 |
) |
|
(9,431
|
)
|
|||||||||||||||||||
|
NET REALIZED GAINS (LOSSES) (Note O)
|
||||||||||||||||||||||||
|
From investments for liquidity purpose (Notes D, J, and N)
|
2
|
(18
|
)
|
|||||||||||||||||||||
|
From equity investments — operations (Note N)
|
8
|
13
|
||||||||||||||||||||||
|
From other debt securities — operations
|
2
|
–
|
||||||||||||||||||||||
|
From borrowings (Note J)
|
1
|
0
|
||||||||||||||||||||||
|
Total
|
13 |
(5
|
)
|
|||||||||||||||||||||
|
NET UNREALIZED GAINS (Notes H, J, L, and O)
|
316
|
36
|
||||||||||||||||||||||
|
NET INCOME
|
$
|
1,903
|
$
|
1,629
|
||||||||||||||||||||
|
2025
|
2024
|
|||||||||||||||||||||||
|
NET INCOME (OCR-2)
|
$
|
1,903
|
$
|
1,629
|
||||||||||||||||||||
|
Other comprehensive income (Note N)
|
||||||||||||||||||||||||
|
Unrealized holding gains (losses):
|
||||||||||||||||||||||||
|
From investments for liquidity purpose
|
$
|
556
|
$
|
209
|
||||||||||||||||||||
|
From equity investments — operations
|
1
|
12
|
||||||||||||||||||||||
|
From other debt securities — operations
|
6
|
2
|
||||||||||||||||||||||
|
From borrowings
|
(577
|
)
|
$
|
(14
|
)
|
(243
|
)
|
$ | (20 | ) | ||||||||||||||
|
Postretirement benefit asset/liability adjustments
|
(276
|
)
|
303 | |||||||||||||||||||||
|
Currency translation adjustments
|
294
|
4
|
(219 | ) |
64
|
|||||||||||||||||||
|
COMPREHENSIVE INCOME
|
$
|
1,907
|
$
|
1,693
|
||||||||||||||||||||
|
Capital
Stock
|
Nonnegotiable,
Noninterest-
bearing
Demand
Obligations
|
Net Notional
Maintenance
of Value
|
Ordinary
Reserve
|
Special
Reserve
|
Surplus |
Cumulative
Revaluation
Adjustments
Account
|
Net Income
After
Appro-
priations
|
Accumulated
Other
Compre-
hensive
Income (Loss)
|
Total | |||||||||||||||||||||||||||||||
|
Balance, 31 December 2023
|
$
|
7,139
|
$
|
(26
|
)
|
$
|
(1,532
|
)
|
$
|
46,535
|
$
|
531
|
$
|
1,065
|
$
|
975
|
|
$
|
910
|
$
|
(303
|
)
|
$
|
55,294
|
||||||||||||||||
|
Comprehensive income
(OCR-3, Note N)
|
1,629 |
64
|
|
1,693
|
||||||||||||||||||||||||||||||||||||
|
Appropriation of guarantee
fees (Note N)
|
27
|
(27
|
)
|
–
|
||||||||||||||||||||||||||||||||||||
|
Encashment of demand
obligations
|
13 |
13
|
||||||||||||||||||||||||||||||||||||||
|
Change in USD value
|
(199
|
)
|
0 |
51 |
|
(148
|
) |
|||||||||||||||||||||||||||||||||
|
Allocation of prior year
income (Note N)
|
1,005 |
(513 |
)
|
(492
|
)
|
–
|
||||||||||||||||||||||||||||||||||
|
Allocation of prior year
income to Special Funds
(Note N)
|
(418
|
)
|
(418
|
)
|
||||||||||||||||||||||||||||||||||||
|
Balance, 31 December 2024
|
6,940
|
(12
|
)
|
(1,481
|
)
|
47,540
|
558
|
1,065
|
462
|
|
1,602 |
(239
|
)
|
56,435
|
||||||||||||||||||||||||||
|
Comprehensive income
(OCR-3, Note N)
|
1,903 |
4
|
1,907
|
|||||||||||||||||||||||||||||||||||||
|
Appropriation of guarantee
fees (Note N)
|
20
|
(20
|
)
|
–
|
||||||||||||||||||||||||||||||||||||
|
Encashment of demand
obligations
|
7
|
7
|
||||||||||||||||||||||||||||||||||||||
|
Change in USD value
|
354 |
|
0 | (170 |
)
|
184
|
|
|||||||||||||||||||||||||||||||||
|
Allocation of prior year
income (Note N)
|
1,016 | 63 | |
(1,079
|
)
|
–
|
||||||||||||||||||||||||||||||||||
|
Allocation of prior year
income to Special Funds
(Note N)
|
(524
|
)
|
(524
|
)
|
||||||||||||||||||||||||||||||||||||
|
Balance, 31 December 2025
|
$
|
7,294
|
$
|
(5
|
)
|
$
|
(1,651
|
)
|
$
|
48,556
|
$
|
578
|
$
|
1,065
|
$
|
525 |
$
|
1,883 |
$
|
(235
|
)
|
$
|
58,010
|
|||||||||||||||||
|
2025
|
2024
|
|||||||
|
CASH FLOWS FROM OPERATING ACTIVITIES
|
||||||||
|
Interest and other charges received on loans — operations
|
$
|
7,104
|
$
|
7,981
|
||||
|
Interest received on investments for liquidity purpose
|
2,023
|
2,260
|
||||||
|
Interest received from securities purchased under resale/ repurchase agreement
|
11
|
22
|
||||||
|
Interest and other charges received on other debt securities — operations
|
49
|
45
|
||||||
|
Dividends received on equity investments — operations
|
110
|
90
|
||||||
|
Interest and other financial expenses paid
|
(7,539
|
)
|
(8,612
|
)
|
||||
|
Administrative expenses paid
|
(890
|
)
|
(781
|
)
|
||||
|
Others—net
|
85
|
88
|
||||||
|
Net Cash Provided by Operating Activities
|
953
|
1,093
|
||||||
|
CASH FLOWS FROM INVESTING ACTIVITIES
|
||||||||
|
Sales of investments for liquidity purpose
|
4,595
|
3,155
|
||||||
|
Maturities of investments for liquidity purpose
|
304,230
|
318,562
|
||||||
|
Purchases of investments for liquidity purpose
|
(319,334
|
)
|
(322,918
|
)
|
||||
|
Receipts from securities purchased under resale arrangements
|
69,946
|
109,776
|
||||||
|
Payments for securities purchased under resale arrangements
|
(69,938
|
)
|
(109,394
|
)
|
||||
|
Principal collected on loans — operations
|
13,028
|
12,891
|
||||||
|
Loans — operations disbursed
|
(17,579
|
)
|
(17,400
|
)
|
||||
|
Derivatives—net
|
1,305
|
1,382
|
||||||
|
Property, furniture, and equipment acquired
|
(69
|
)
|
(77
|
)
|
||||
|
Sales of equity investments — operations
|
22
|
79
|
||||||
|
Purchases of equity investments — operations
|
(319
|
)
|
(115
|
)
|
||||
|
Maturities of other debt securities — operations
|
206
|
66
|
||||||
|
Purchases of other debt securities — operations
|
(136
|
)
|
(186
|
)
|
||||
|
Net Cash Used in Investing Activities
|
(14,043
|
)
|
(4,179
|
)
|
||||
|
CASH FLOWS FROM FINANCING ACTIVITIES
|
||||||||
|
Proceeds from new borrowings
|
47,421
|
43,901
|
||||||
|
Borrowings redeemed
|
(35,337
|
)
|
(38,835
|
)
|
||||
|
Issuance expenses paid
|
(27
|
)
|
(22
|
)
|
||||
|
Demand obligations of members encashed
|
7
|
13
|
||||||
|
Derivatives—net
|
(404
|
)
|
(278
|
)
|
||||
|
Change in swap related collateral
|
400
|
466
|
||||||
|
Resources transferred to Special Funds
|
(524
|
)
|
(418
|
)
|
||||
|
Net Cash Provided by Financing Activities
|
11,536
|
4,827
|
||||||
|
Effect of Exchange Rate Changes on Due from Banks
|
(534
|
)
|
(40
|
)
|
||||
|
Net (Decrease) Increase in Due from Banks
|
(2,088
|
)
|
1,701
|
|||||
|
Cash at Beginning of Period
|
||||||||
|
Due from Banks
|
2,235
|
998
|
||||||
|
Swap Related and Other Collateral
|
857
|
393
|
||||||
|
Total
|
$
|
3,092
|
$
|
1,391
|
||||
|
Cash at End of Period
|
||||||||
|
Due from Banks
|
496
|
2,235
|
||||||
|
Swap Related and Other Collateral
|
508
|
857
|
||||||
|
Total
|
$
|
1,004
|
$
|
3,092
|
||||
|
RECONCILIATION OF NET INCOME TO NET CASH PROVIDED BY OPERATING ACTIVITIES:
|
||||||||
|
Net Income (OCR-2)
|
$ | 1,903 | $ | 1,629 | ||||
|
Adjustments to reconcile net income to net cash provided by operating activities:
|
|
|
|
|||||
|
Depreciation and amortization
|
30 | (189 | ) |
|||||
|
Provision (release of provision) for credit losses
|
24
|
(45
|
)
|
|||||
|
Net realized (gains) losses
|
(13
|
)
|
5
|
|||||
|
Gains on equity method investments
|
(152
|
)
|
(98
|
)
|
||||
|
Net unrealized gains
|
(316
|
)
|
(36
|
)
|
||||
|
Change in accrued revenue from loans — operations, investments for liquidity purpose, other debt securities — operations, and other swaps
|
(384 |
) |
(199 |
) |
||||
|
Change in accrued interest on borrowings and swaps, and other expenses
|
98
|
(387
|
)
|
|||||
|
Change in pension and postretirement benefit liability
|
(276
|
)
|
304
|
|||||
|
Others—net
|
39
|
109
|
||||||
|
Net Cash Provided by Operating Activities
|
$
|
953
|
$
|
1,093
|
||||
|
Undisbursed Committed Loans
|
Loans Approved
Not Yet
Committed
|
Percent
of Total
Loans
|
||||||||||||||||||||||
|
Borrowers/Guarantors
|
Loans
Outstanding
|
Effective1
|
Not Yet
Effective2
|
Total
Loans
|
||||||||||||||||||||
|
Afghanistan
|
$
|
514
|
$
|
–
|
$
|
–
|
$
|
–
|
$
|
514
|
0.23
|
|||||||||||||
|
Armenia
|
1,134
|
629
|
–
|
–
|
1,763
|
0.80
|
||||||||||||||||||
|
Azerbaijan
|
1,974
|
159
|
–
|
–
|
2,133
|
0.97
|
||||||||||||||||||
|
Bangladesh
|
17,630
|
4,158
|
788
|
–
|
22,576
|
10.22
|
||||||||||||||||||
|
Bhutan
|
557
|
132
|
–
|
–
|
689
|
0.31
|
||||||||||||||||||
|
Cambodia
|
2,824
|
1,060
|
173
|
10
|
4,067
|
1.84
|
||||||||||||||||||
|
China, People’s Republic of
|
17,751
|
6,458
|
594
|
310
|
25,113
|
11.36
|
||||||||||||||||||
|
Cook Islands
|
111
|
20
|
–
|
–
|
131
|
0.06
|
||||||||||||||||||
|
Fiji
|
622
|
269
|
–
|
–
|
891
|
0.40
|
||||||||||||||||||
|
Georgia
|
2,799
|
1,080
|
–
|
–
|
3,879
|
1.76
|
||||||||||||||||||
|
India
|
26,692
|
7,845
|
3,244
|
829
|
38,610
|
17.47
|
||||||||||||||||||
|
Indonesia
|
15,298
|
2,301
|
1,438
|
88
|
19,125
|
8.65
|
||||||||||||||||||
|
Kazakhstan
|
1,862
|
389
|
–
|
377
|
2,628
|
1.19
|
||||||||||||||||||
|
Kiribati
|
18
|
–
|
–
|
–
|
18
|
0.01
|
||||||||||||||||||
|
Kyrgyz Republic
|
874
|
335
|
35
|
–
|
1,244
|
0.56
|
||||||||||||||||||
|
Lao People’s Democratic Republic
|
991
|
330
|
65
|
–
|
1,386
|
0.63
|
||||||||||||||||||
|
Malaysia
|
–
|
61
|
–
|
–
|
61
|
0.03
|
||||||||||||||||||
|
Maldives
|
119
|
34
|
–
|
–
|
153
|
0.07
|
||||||||||||||||||
|
Marshall Islands
|
24
|
–
|
–
|
–
|
24
|
0.01
|
||||||||||||||||||
|
Micronesia, Federated States of
|
31
|
–
|
–
|
–
|
31
|
0.01
|
||||||||||||||||||
|
Mongolia
|
2,343
|
782
|
90
|
19
|
3,234
|
1.46
|
||||||||||||||||||
|
Myanmar
|
740
|
1,679
|
351
|
–
|
2,770
|
1.25
|
||||||||||||||||||
|
Nepal
|
3,486
|
1,945
|
100
|
–
|
5,531
|
2.50
|
||||||||||||||||||
|
Pakistan
|
16,945
|
3,898
|
902
|
220
|
21,965
|
9.94
|
||||||||||||||||||
|
Palau
|
148
|
21
|
–
|
–
|
169
|
0.08
|
||||||||||||||||||
|
Papua New Guinea
|
2,699
|
936
|
65
|
–
|
3,700
|
1.67
|
||||||||||||||||||
|
Philippines
|
17,630
|
6,896
|
1,250
|
21
|
25,797
|
11.67
|
||||||||||||||||||
|
Samoa
|
54
|
–
|
–
|
–
|
54
|
0.03
|
||||||||||||||||||
|
Solomon Islands
|
129
|
79
|
–
|
–
|
208
|
0.09
|
||||||||||||||||||
|
Sri Lanka
|
7,379
|
969
|
–
|
–
|
8,348
|
3.78
|
||||||||||||||||||
|
Tajikistan
|
279
|
10
|
–
|
–
|
289
|
0.13
|
||||||||||||||||||
|
Thailand
|
1,500
|
368
|
–
|
–
|
1,867
|
0.85
|
||||||||||||||||||
|
Timor-Leste
|
189
|
371
|
75
|
–
|
635
|
0.29
|
||||||||||||||||||
|
Tonga
|
18
|
–
|
–
|
–
|
18
|
0.01
|
||||||||||||||||||
|
Türkiye
|
–
|
100
|
1,090
|
–
|
1,190
|
0.54
|
||||||||||||||||||
|
Turkmenistan
|
500
|
76
|
–
|
–
|
576
|
0.26
|
||||||||||||||||||
|
Tuvalu
|
1
|
–
|
–
|
–
|
1
|
0.00
|
||||||||||||||||||
|
Uzbekistan
|
8,762
|
1,761
|
333
|
–
|
10,857
|
4.91
|
||||||||||||||||||
|
Vanuatu
|
50
|
41
|
–
|
–
|
91
|
0.04
|
||||||||||||||||||
|
Viet Nam
|
7,125
|
933
|
80
|
–
|
8,138
|
3.68
|
||||||||||||||||||
|
Regional
|
510
|
6
|
–
|
8
|
524
|
0.24
|
||||||||||||||||||
|
162,310
|
46,131
|
10,673
|
1,882
|
220,996
|
100.00
|
|||||||||||||||||||
|
Fair value adjustment on loans
|
(939
|
)
|
–
|
–
|
–
|
(939
|
)
|
|||||||||||||||||
|
Allowance for credit losses
|
(568
|
)
|
–
|
–
|
–
|
(568
|
)
|
|||||||||||||||||
|
Unamortized loan origination cost—net
|
260
|
–
|
–
|
–
|
260
|
|||||||||||||||||||
|
(1,247
|
)
|
–
|
–
|
–
|
(1,247
|
)
|
||||||||||||||||||
|
TOTAL – 31 December 2025
|
$
|
161,063
|
$
|
46,131
|
$
|
10,673
|
$
|
1,882
|
$
|
219,749
|
||||||||||||||
|
1
|
Refer to the unwithdrawn portions of effective loans as of 31 December 2025 and 2024. Of the undisbursed balances, ADB has made irrevocable
commitments to disburse regular and concessional sovereign amounts totaling $581 million ($572 million – 2024).
|
|
2
|
Refer to committed loans but conditions to effectiveness specified in loan regulations and loan agreements are not yet completed as of 31 December
2025 and 2024.
|
|
Undisbursed Committed Loans
|
Loans Approved
Not Yet
Committed
|
|||||||||||||||||||
|
Loans
Outstanding
|
Effective1
|
Not Yet
Effective2
|
Total
Loans
|
|||||||||||||||||
|
Sovereign Loans
|
||||||||||||||||||||
|
Regular
|
$
|
119,361
|
$
|
32,186
|
$
|
8,749
|
$
|
1,065
|
$
|
161,361
|
||||||||||
|
Concessional
|
35,626
|
11,419
|
1,924
|
–
|
48,969
|
|||||||||||||||
|
Nonsovereign Loans
|
6,644
|
2,526
|
–
|
817
|
9,987
|
|||||||||||||||
|
161,631
|
46,131
|
10,673
|
1,882
|
220,317
|
||||||||||||||||
|
Allowance for credit losses
|
(568
|
)
|
–
|
–
|
–
|
(568
|
)
|
|||||||||||||
|
TOTAL – 31 December 2025
|
$
|
161,063
|
$
|
46,131
|
$
|
10,673
|
$
|
1,882
|
$
|
219,749
|
||||||||||
|
Sovereign Loans
|
||||||||||||||||||||
|
Regular
|
$
|
115,352
|
$
|
29,025
|
$
|
6,338
|
$
|
1,020
|
$
|
151,735
|
||||||||||
|
Concessional
|
33,332
|
11,500
|
2,033
|
–
|
46,865
|
|||||||||||||||
|
Nonsovereign Loans
|
5,720
|
2,219
|
–
|
350
|
8,289
|
|||||||||||||||
|
154,404
|
42,744
|
8,371
|
1,370
|
206,889
|
||||||||||||||||
|
Allowance for credit losses
|
(540
|
)
|
–
|
–
|
–
|
(540
|
)
|
|||||||||||||
|
TOTAL – 31 December 2024
|
$
|
153,864
|
$
|
42,744
|
$
|
8,371
|
$
|
1,370
|
$
|
206,349
|
||||||||||
|
MATURITY OF LOANS OUTSTANDING AS OF 31 DECEMBER 20253
|
|||||||||||||
|
Twelve Months
Ending
31 December
|
Amount |
Five Years
Ending
31 December
|
Amount | ||||||||||
|
2026
|
$
|
11,962
|
2035
|
52,144
|
|||||||||
|
2027
|
12,314
|
2040
|
31,098
|
||||||||||
|
2028
|
12,975
|
2045
|
12,121
|
||||||||||
|
2029
|
12,783
|
2050
|
3,671
|
||||||||||
|
2030
|
12,440
|
over 2050
|
802
|
||||||||||
|
|
Total |
$
|
162,310
|
||||||||||
|
SUMMARY OF CURRENCIES RECEIVABLE ON LOANS OUTSTANDING — OPERATIONS3
|
|||||||||||||||||
|
Currency
|
2025
|
2024
|
Currency
|
2025
|
2024
|
||||||||||||
|
Australian dollar
|
$
|
11
|
$
|
9
|
Norwegian krone
|
–
|
17
|
||||||||||
|
Azerbaijan manat
|
13
|
20
|
Philippine peso
|
115
|
63
|
||||||||||||
|
Baht
|
640
|
654
|
Pound sterling
|
10
|
52
|
||||||||||||
|
Canadian dollar
|
23
|
24
|
Ringgit
|
17
|
1
|
||||||||||||
|
Chinese yuan
|
675
|
314
|
Som
|
5
|
5
|
||||||||||||
|
Danish krone
|
381
|
6
|
Somoni
|
32
|
–
|
||||||||||||
|
Euro
|
12,544
|
10,391
|
Special drawing rights
|
17,583
|
18,160
|
||||||||||||
|
Fiji dollar
|
2
|
–
|
Swedish krona
|
26
|
9
|
||||||||||||
|
Indian rupee
|
187
|
204
|
Swiss franc
|
–
|
25
|
||||||||||||
|
Indonesian rupiah
|
3,024
|
801
|
Togrog
|
48
|
14
|
||||||||||||
|
Kazakhstan tenge
|
445
|
288
|
US dollar
|
120,198
|
116,621
|
||||||||||||
|
Korean won
|
29
|
6
|
Uzbekistan sum
|
76
|
–
|
||||||||||||
|
Lari
|
196
|
231
|
Yen
|
5,919
|
6,560
|
||||||||||||
|
New Zealand dollar
|
111
|
95
|
Total
|
$
|
162,310
|
$
|
154,570
|
||||||||||
|
3
|
Excluding fair value adjustment on loans, allowance for credit losses, and net unamortized loan origination cost.
|
| Borrowings |
Swap Arrangements2
|
|||||||||||||||||||||||
|
Outstanding1
|
Net Payable (Receivable)
|
Net Currency Obligation
|
||||||||||||||||||||||
|
Currency
|
2025
|
2024
|
2025
|
2024
|
2025
|
2024
|
||||||||||||||||||
|
Australian dollar
|
$
|
8,943
|
$
|
8,422
|
$
|
(9,004
|
)
|
$
|
(8,544
|
)
|
$
|
(61
|
)
|
$
|
(122
|
)
|
||||||||
|
Azerbaijan manat
|
13
|
22
|
–
|
–
|
13
|
22
|
||||||||||||||||||
|
Brazilian real
|
147
|
105
|
(148
|
)
|
(106
|
)
|
(1
|
)
|
(1
|
)
|
||||||||||||||
|
Canadian dollar
|
4,897
|
5,143
|
(4,920
|
)
|
(5,187
|
)
|
(23
|
)
|
(45
|
)
|
||||||||||||||
|
Chilean peso
|
–
|
16
|
(0
|
)
|
(16
|
)
|
(0
|
)
|
(0
|
)
|
||||||||||||||
|
Chinese yuan
|
3,300
|
1,301
|
(2,055
|
)
|
(796
|
)
|
1,245
|
505
|
||||||||||||||||
|
Colombian peso
|
463
|
804
|
(457
|
)
|
(808
|
)
|
6
|
(4
|
)
|
|||||||||||||||
|
Egyptian pound
|
385
|
133
|
(385
|
)
|
(133
|
)
|
(0
|
)
|
0
|
|||||||||||||||
|
Euro
|
15,216
|
10,114
|
(4,235
|
)
|
(1,400
|
)
|
10,981
|
8,714
|
||||||||||||||||
|
Georgian lari
|
189
|
230
|
–
|
–
|
189
|
230
|
||||||||||||||||||
|
Ghana cedi
|
39
|
16
|
(39
|
)
|
(16
|
)
|
(0
|
)
|
(0
|
)
|
||||||||||||||
|
Hong Kong dollar
|
4,397
|
2,805
|
(4,371
|
)
|
(2,823
|
)
|
26
|
(18
|
)
|
|||||||||||||||
|
Hungarian forint
|
173
|
118
|
(178
|
)
|
(121
|
)
|
(5
|
)
|
(3
|
)
|
||||||||||||||
|
Indian rupee
|
640
|
661
|
(2
|
)
|
1
|
638
|
662
|
|||||||||||||||||
|
Indonesian rupiah
|
142
|
140
|
–
|
–
|
142
|
140
|
||||||||||||||||||
|
Japanese yen
|
397
|
406
|
3,176
|
1,636
|
3,573
|
2,042
|
||||||||||||||||||
|
Kazakhstan tenge
|
362
|
204
|
–
|
–
|
362
|
204
|
||||||||||||||||||
|
Kyrgyzstani som
|
5
|
5
|
–
|
–
|
5
|
5
|
||||||||||||||||||
|
Mexican peso
|
89
|
38
|
(92
|
)
|
(41
|
)
|
(3
|
)
|
(3
|
)
|
||||||||||||||
|
Mongolian togrog
|
48
|
14
|
–
|
–
|
48
|
14
|
||||||||||||||||||
|
New Zealand dollar
|
3,404
|
3,869
|
(3,370
|
)
|
(3,852
|
)
|
34
|
17
|
||||||||||||||||
|
Nigerian naira
|
157
|
34
|
(157
|
)
|
(34
|
)
|
(0
|
)
|
(0
|
)
|
||||||||||||||
|
Norwegian krone
|
726
|
538
|
(730
|
)
|
(542
|
)
|
(4
|
)
|
(4
|
)
|
||||||||||||||
|
Pakistan rupee
|
–
|
10
|
–
|
–
|
–
|
10
|
||||||||||||||||||
|
Peruvian sol
|
354
|
101
|
(357
|
)
|
(102
|
)
|
(3
|
)
|
(1
|
)
|
||||||||||||||
|
Philippine peso
|
91
|
–
|
–
|
–
|
91
|
–
|
||||||||||||||||||
|
Polish zloty
|
740
|
785
|
(743
|
)
|
(788
|
)
|
(3
|
)
|
(3
|
)
|
||||||||||||||
|
Pound sterling
|
15,075
|
13,688
|
(15,153
|
)
|
(13,767
|
)
|
(78
|
)
|
(79
|
)
|
||||||||||||||
|
Russian ruble
|
8
|
5
|
(8
|
)
|
(4
|
)
|
0
|
1
|
||||||||||||||||
|
South African rand
|
481
|
382
|
(489
|
)
|
(390
|
)
|
(8
|
)
|
(8
|
)
|
||||||||||||||
|
Swedish krona
|
1,442
|
1,025
|
(1,454
|
)
|
(1,039
|
)
|
(12
|
)
|
(14
|
)
|
||||||||||||||
|
Swiss franc
|
1,387
|
734
|
(1,414
|
)
|
(746
|
)
|
(27
|
)
|
(12
|
)
|
||||||||||||||
|
Turkish lira
|
433
|
162
|
(443
|
)
|
(163
|
)
|
(10
|
)
|
(1
|
)
|
||||||||||||||
|
Ukraine hryvnia
|
8
|
7
|
(8
|
)
|
(7
|
)
|
(0
|
)
|
(0
|
)
|
||||||||||||||
|
United States dollar
|
101,754
|
94,480
|
49,913
|
49,619
|
151,667
|
144,099
|
||||||||||||||||||
| Uzbekistani som | 46 |
– | – | – | 46 |
– | ||||||||||||||||||
|
Total
|
$
|
165,951
|
$
|
146,517
|
$
|
2,877
|
$
|
9,831
|
$
|
168,828
|
$
|
156,348
|
||||||||||||
|
1
|
Includes accrued interest and commission. Reported at fair value except for unswapped borrowings which are reported at
principal amount net of unamortized discount/premium.
|
|
2
|
Include currency and interest rate swaps. At 31 December 2025, the remaining maturity based on first call date of swap
agreements ranged from less than one year to 25 years (less than one year to 26 years – 2024). Approximately 70.46% (72.01% – 2024) of the swap receivables and 70.03% (72.26% –
2024) of the payables are due within the next five years.
|
|
Twelve Months
Ending
31 December
|
Amount
|
Five Years
Ending
31 December
|
Amount
|
||||||||||
|
2026
|
$
|
37,653
|
2035
|
$
|
25,552
|
||||||||
|
2027
|
32,555
|
2040
|
2,185
|
||||||||||
|
2028
|
33,327
|
2045
|
106
|
||||||||||
|
2029
|
17,451
|
over 2045
|
11 | ||||||||||
|
2030
|
17,111
|
|
Total |
$
|
165,951
|
||||||||
|
Average Rate (%)
|
||||||||||||
|
Notional
|
Pay
|
|||||||||||
|
Amount
|
Receive
|
Floating4
|
||||||||||
|
Receive Fixed Swaps:
|
||||||||||||
|
Australian dollar 5
|
$
|
32
|
2.64
|
0.16
|
||||||||
|
Chinese yuan
|
515
|
2.97
|
1.33
|
|||||||||
|
Euro 6
|
1,386
|
2.21
|
2.41
|
|||||||||
|
Indian rupee
|
233
|
6.12
|
6.03
|
|||||||||
|
United States dollar
|
93,353
|
3.13
|
4.66
|
|||||||||
|
United States dollar 7
|
13
|
2.45
|
0.16
|
|||||||||
|
Receive Floating Swaps:4
|
||||||||||||
|
Indian rupee
|
6
|
5.63
|
5.59
|
|||||||||
|
Japanese yen
|
6
|
4.00
|
0.14
|
|||||||||
|
United States dollar
|
7,534
|
4.51
|
4.52
|
|||||||||
|
Total
|
$
|
103,078
|
||||||||||
|
3
|
Bonds with put and call options were considered maturing on the first put or call date.
|
|
4
|
Represents average current floating rates, net of spread.
|
|
5
|
Consists of dual currency swaps with interest receivable in Australian dollar and interest payable in Japanese yen.
|
|
6
|
Accreted pay leg notional amounts to $1,078 million USD equivalent.
|
|
7
|
Consists of dual currency swaps with interest receivable in US dollar and interest payable in Japanese yen.
|
|
SUBSCRIBED CAPITAL
|
VOTING POWER
|
|||||||||||||||||||||||||||
|
Number of
|
Percent
|
Par Value Of Shares1
|
Number of
|
Percent | ||||||||||||||||||||||||
|
MEMBERS
|
Shares
|
of Total
|
Total
|
Callable
|
Paid-in
|
Votes
|
of Total
|
|||||||||||||||||||||
|
REGIONAL
|
||||||||||||||||||||||||||||
|
Afghanistan
|
3,585
|
0.034
|
49.1
|
42.6
|
6.6
|
42,132
|
0.317
|
|||||||||||||||||||||
|
Armenia
|
31,671
|
0.298
|
434.1
|
412.4
|
21.8
|
70,218
|
0.528
|
|||||||||||||||||||||
|
Australia
|
614,220
|
5.773
|
8,419.2
|
7,998.1
|
421.0
|
652,767
|
4.908
|
|||||||||||||||||||||
|
Azerbaijan
|
47,208
|
0.444
|
647.1
|
614.7
|
32.4
|
85,755
|
0.645
|
|||||||||||||||||||||
|
Bangladesh
|
108,384
|
1.019
|
1,485.6
|
1,411.3
|
74.3
|
146,931
|
1.105
|
|||||||||||||||||||||
|
Bhutan
|
660
|
0.006
|
9.0
|
8.5
|
0.6
|
39,207
|
0.295
|
|||||||||||||||||||||
|
Brunei Darussalam
|
37,386
|
0.351
|
512.5
|
486.8
|
25.7
|
75,933
|
0.571
|
|||||||||||||||||||||
|
Cambodia
|
5,250
|
0.049
|
72.0
|
66.0
|
6.0
|
43,797
|
0.329
|
|||||||||||||||||||||
|
China, People’s Republic of
|
684,000
|
6.429
|
9,375.7
|
8,906.7
|
468.9
|
722,547
|
5.433
|
|||||||||||||||||||||
|
Cook Islands
|
282
|
0.003
|
3.9
|
3.7
|
0.2
|
38,829
|
0.292
|
|||||||||||||||||||||
|
Fiji
|
7,218
|
0.068
|
98.9
|
94.0
|
4.9
|
45,765
|
0.344
|
|||||||||||||||||||||
|
Georgia
|
36,243
|
0.341
|
496.8
|
471.9
|
24.9
|
74,790
|
0.562
|
|||||||||||||||||||||
|
Hong Kong, China
|
57,810
|
0.543
|
792.4
|
752.8
|
39.6
|
96,357
|
0.725
|
|||||||||||||||||||||
|
India
|
672,030
|
6.317
|
9,211.6
|
8,750.9
|
460.7
|
710,577
|
5.343
|
|||||||||||||||||||||
|
Indonesia
|
578,100
|
5.434
|
7,924.1
|
7,527.8
|
396.3
|
616,647
|
4.637
|
|||||||||||||||||||||
|
Japan
|
1,656,630
|
15.571
|
22,707.6
|
21,572.0
|
1,135.6
|
1,695,177
|
12.747
|
|||||||||||||||||||||
|
Kazakhstan
|
85,608
|
0.805
|
1,173.4
|
1,114.7
|
58.7
|
124,155
|
0.934
|
|||||||||||||||||||||
|
Kiribati
|
426
|
0.004
|
5.8
|
5.6
|
0.3
|
38,973
|
0.293
|
|||||||||||||||||||||
|
Korea, Republic of
|
534,738
|
5.026
|
7,329.7
|
6,963.2
|
366.5
|
573,285
|
4.311
|
|||||||||||||||||||||
|
Kyrgyz Republic
|
31,746
|
0.298
|
435.1
|
413.4
|
21.8
|
70,293
|
0.529
|
|||||||||||||||||||||
|
Lao People’s Democratic Republic
|
1,476
|
0.014
|
20.2
|
19.0
|
1.3
|
40,023
|
0.301
|
|||||||||||||||||||||
|
Malaysia
|
289,050
|
2.717
|
3,962.0
|
3,763.9
|
198.1
|
327,597
|
2.463
|
|||||||||||||||||||||
|
Maldives
|
426
|
0.004
|
5.8
|
5.6
|
0.3
|
38,973
|
0.293
|
|||||||||||||||||||||
|
Marshall Islands
|
282
|
0.003
|
3.9
|
3.7
|
0.2
|
38,829
|
0.292
|
|||||||||||||||||||||
|
Micronesia, Federated States of
|
426
|
0.004
|
5.8
|
5.6
|
0.3
|
38,973
|
0.293
|
|||||||||||||||||||||
|
Mongolia
|
1,596
|
0.015
|
21.9
|
20.8
|
1.1
|
40,143
|
0.302
|
|||||||||||||||||||||
|
Myanmar
|
57,810
|
0.543
|
792.4
|
752.8
|
39.6
|
96,357
|
0.725
|
|||||||||||||||||||||
|
Nauru
|
426
|
0.004
|
5.8
|
5.6
|
0.3
|
38,973
|
0.293
|
|||||||||||||||||||||
|
Nepal
|
15,606
|
0.147
|
213.9
|
203.2
|
10.7
|
54,153
|
0.407
|
|||||||||||||||||||||
|
New Zealand
|
163,020
|
1.532
|
2,234.5
|
2,122.8
|
111.7
|
201,567
|
1.516
|
|||||||||||||||||||||
|
Niue
|
150
|
0.001
|
2.1
|
1.9
|
0.1
|
38,697
|
0.291
|
|||||||||||||||||||||
|
Pakistan
|
231,240
|
2.173
|
3,169.6
|
3,011.1
|
158.5
|
269,787
|
2.029
|
|||||||||||||||||||||
|
Palau
|
342
|
0.003
|
4.7
|
4.5
|
0.2
|
38,889
|
0.292
|
|||||||||||||||||||||
|
Papua New Guinea
|
9,960
|
0.094
|
136.5
|
129.7
|
6.8
|
48,507
|
0.365
|
|||||||||||||||||||||
|
Philippines
|
252,912
|
2.377
|
3,466.7
|
3,293.3
|
173.4
|
291,459
|
2.192
|
|||||||||||||||||||||
|
Samoa
|
348
|
0.003
|
4.8
|
4.5
|
0.3
|
38,895
|
0.292
|
|||||||||||||||||||||
|
Singapore
|
36,120
|
0.340
|
495.1
|
470.3
|
24.8
|
74,667
|
0.561
|
|||||||||||||||||||||
|
Solomon Islands
|
708
|
0.007
|
9.7
|
9.2
|
0.5
|
39,255
|
0.295
|
|||||||||||||||||||||
|
Sri Lanka
|
61,560
|
0.579
|
843.8
|
801.6
|
42.2
|
100,107
|
0.753
|
|||||||||||||||||||||
|
Taipei,China
|
115,620
|
1.087
|
1,584.8
|
1,505.6
|
79.2
|
154,167
|
1.159
|
|||||||||||||||||||||
|
Tajikistan
|
30,402
|
0.286
|
416.7
|
395.8
|
20.9
|
68,949
|
0.518
|
|||||||||||||||||||||
|
Thailand
|
144,522
|
1.358
|
1,981.0
|
1,881.9
|
99.1
|
183,069
|
1.377
|
|||||||||||||||||||||
|
Timor-Leste
|
1,050
|
0.010
|
14.4
|
13.7
|
0.7
|
39,597
|
0.298
|
|||||||||||||||||||||
|
Tonga
|
426
|
0.004
|
5.8
|
5.6
|
0.3
|
38,973
|
0.293
|
|||||||||||||||||||||
|
Turkmenistan
|
26,874
|
0.253
|
368.4
|
349.9
|
18.5
|
65,421
|
0.492
|
|||||||||||||||||||||
|
Tuvalu
|
150
|
0.001
|
2.1
|
1.9
|
0.1
|
38,697
|
0.291
|
|||||||||||||||||||||
|
Türkiye
|
36,120
|
0.340
|
495.1
|
470.3
|
24.8
|
74,667
|
0.561
|
|||||||||||||||||||||
|
Uzbekistan
|
71,502
|
0.672
|
980.1
|
931.1
|
49.0
|
110,049
|
0.828
|
|||||||||||||||||||||
|
Vanuatu
|
708
|
0.007
|
9.7
|
9.2
|
0.5
|
39,255
|
0.295
|
|||||||||||||||||||||
|
Viet Nam
|
36,228
|
0.341
|
496.6
|
464.4
|
32.2
|
74,775
|
0.562
|
|||||||||||||||||||||
|
Total Regional
|
6,780,255
|
63.729
|
$
|
92,937.6
|
$
|
88,275.2
|
$
|
4,662.4
|
8,707,605
|
65.476
|
||||||||||||||||||
| SUBSCRIBED CAPITAL | VOTING POWER | |||||||||||||||||||||||||||
| Number of | Percent | Par Value Of Shares1 | Number of | Percent | ||||||||||||||||||||||||
|
MEMBERS
|
Shares
|
of Total
|
Total
|
Callable
|
Paid-in
|
Votes
|
of Total
|
|||||||||||||||||||||
|
Total Regional (Forward)
|
6,780,255
|
63.729
|
$
|
92,937.6
|
$
|
88,275.2
|
$
|
4,662.4
|
8,707,605
|
65.476
|
||||||||||||||||||
|
NONREGIONAL
|
||||||||||||||||||||||||||||
|
Austria
|
36,120
|
0.340
|
495.1
|
470.3
|
24.8
|
74,667
|
0.561
|
|||||||||||||||||||||
|
Belgium
|
36,120
|
0.340
|
495.1
|
470.3
|
24.8
|
74,667
|
0.561
|
|||||||||||||||||||||
|
Canada
|
555,258
|
5.219
|
7,611.0
|
7,230.4
|
380.6
|
593,805
|
4.465
|
|||||||||||||||||||||
|
Denmark
|
36,120
|
0.340
|
495.1
|
470.3
|
24.8
|
74,667
|
0.561
|
|||||||||||||||||||||
|
Finland
|
36,120
|
0.340
|
495.1
|
470.3
|
24.8
|
74,667
|
0.561
|
|||||||||||||||||||||
|
France
|
247,068
|
2.322
|
3,386.6
|
3,217.2
|
169.4
|
285,615
|
2.148
|
|||||||||||||||||||||
|
Germany
|
459,204
|
4.316
|
6,294.4
|
5,979.6
|
314.8
|
497,751
|
3.743
|
|||||||||||||||||||||
|
Ireland
|
36,120
|
0.340
|
495.1
|
470.3
|
24.8
|
74,667
|
0.561
|
|||||||||||||||||||||
|
Israel
|
150
|
0.001
|
2.1
|
1.9
|
0.1
|
38,697
|
0.291
|
|||||||||||||||||||||
|
Italy
|
191,850
|
1.803
|
2,629.7
|
2,498.2
|
131.5
|
230,397
|
1.732
|
|||||||||||||||||||||
|
Luxembourg
|
36,120
|
0.340
|
495.1
|
470.3
|
24.8
|
74,667
|
0.561
|
|||||||||||||||||||||
|
Netherlands
|
108,882
|
1.023
|
1,492.5
|
1,417.8
|
74.6
|
147,429
|
1.109
|
|||||||||||||||||||||
|
Norway
|
36,120
|
0.340
|
495.1
|
470.3
|
24.8
|
74,667
|
0.561
|
|||||||||||||||||||||
|
Portugal
|
36,120
|
0.340
|
495.1
|
470.3
|
24.8
|
74,667
|
0.561
|
|||||||||||||||||||||
|
Spain
|
36,120
|
0.340
|
495.1
|
470.3
|
24.8
|
74,667
|
0.561
|
|||||||||||||||||||||
|
Sweden
|
36,120
|
0.340
|
495.1
|
470.3
|
24.8
|
74,667
|
0.561
|
|||||||||||||||||||||
|
Switzerland
|
61,950
|
0.582
|
849.2
|
806.7
|
42.5
|
100,497
|
0.756
|
|||||||||||||||||||||
|
United Kingdom
|
216,786
|
2.038
|
2,971.5
|
2,822.9
|
148.6
|
255,333
|
1.920
|
|||||||||||||||||||||
|
United States
|
1,656,630
|
15.571
|
22,707.6
|
21,572.0
|
1,135.6
|
1,695,177
|
12.747
|
|||||||||||||||||||||
|
Total Nonregional
|
3,858,978
|
36.271
|
52,895.4
|
50,250.0
|
2,645.4
|
4,591,371
|
34.524
|
|||||||||||||||||||||
|
TOTAL
|
10,639,233
|
100.000
|
$
|
145,833.0
|
$
|
138,525.2
|
$
|
7,307.9
|
13,298,976
|
100.000
|
||||||||||||||||||
|
1
|
The authorized capital stock of the ADB has a par value of $10,000 in terms of US dollars of the weight and fineness in
effect on 31 January 1966. Pending ADB’s selection of the appropriate successor to the 1966 dollar, the par value of each share is SDR 10,000 for financial reporting purposes.
Exchange rate at 31 December 2025 was $1.37071. (Notes B and M)
|
|
Source of Funds in ADF
|
$ million
|
%
|
Source of Funds in ADF
|
$ million
|
%
|
||||||||||||
|
Donor Contributions
|
|||||||||||||||||
|
Australia
|
$
|
2,213
|
7.18
|
Malaysia
|
24
|
0.08
|
|||||||||||
|
Austria
|
257
|
0.83
|
Nauru
|
0
|
0.00
|
||||||||||||
|
Belgium
|
231
|
0.75
|
Netherlands
|
716
|
2.32
|
||||||||||||
|
Brunei Darussalam
|
17
|
0.06
|
New Zealand
|
157
|
0.51
|
||||||||||||
|
Canada
|
1,889
|
6.13
|
Norway
|
266
|
0.86
|
||||||||||||
|
China, People’s Republic of
|
84
|
0.27
|
Portugal
|
79
|
0.26
|
||||||||||||
|
Denmark
|
242
|
0.79
|
Singapore
|
18
|
0.06
|
||||||||||||
|
Finland
|
180
|
0.58
|
Spain
|
432
|
1.40
|
||||||||||||
|
France
|
1,270
|
4.12
|
Sweden
|
436
|
1.42
|
||||||||||||
|
Germany
|
1,679
|
5.45
|
Switzerland
|
359
|
1.17
|
||||||||||||
|
Hong Kong, China
|
93
|
0.30
|
Taipei,China
|
90
|
0.29
|
||||||||||||
|
India
|
24
|
0.08
|
Thailand
|
15
|
0.05
|
||||||||||||
|
Indonesia
|
14
|
0.05
|
Türkiye
|
114
|
0.37
|
||||||||||||
|
Ireland
|
79
|
0.26
|
United Kingdom
|
1,440
|
4.67
|
||||||||||||
|
Italy
|
1,099
|
3.57
|
United States
|
4,060
|
13.18
|
||||||||||||
|
Japan
|
11,197
|
36.34
|
Subtotal
|
29,309
|
95.13
|
||||||||||||
|
Kazakhstan
|
4
|
0.01
|
OCR Net Income Transfers
|
1,439
|
4.67
|
||||||||||||
|
Korea, Republic of
|
484
|
1.57
|
Set-Aside Resources
|
64
|
0.20
|
||||||||||||
|
Luxembourg
|
47
|
0.15
|
Total
|
$
|
30,812
|
100.00
|
|||||||||||
|
1
|
ADB. 2025. Board of Governors’ Resolution No. 437 – Removal of the ADB Charter Lending Limitation.
|
|
($ million)
|
||||||||
|
Currency
|
2025
|
2024
|
||||||
|
US dollar
|
$
|
26,126
|
$
|
22,008
|
||||
|
Yen
|
14,283
|
10,026
|
||||||
|
Won
|
4,905
|
3,808
|
||||||
|
Singapore dollar
|
3,786
|
1,007
|
||||||
|
Yuan
|
3,039
|
4,557
|
||||||
|
Euro
|
2,634
|
2,434
|
||||||
|
Others
|
2,952
|
2,855
|
||||||
|
Total
|
$
|
57,725
|
$
|
46,695
|
||||
|
($ million)
|
||||||||||||||||
|
|
2025 |
2024
|
||||||||||||||
|
Fair Value
|
Amortized
Cost
|
Fair Value
|
Amortized
Cost
|
|||||||||||||
|
Due in one year or less
|
$
|
29,506
|
$
|
29,562
|
$
|
14,824
|
$
|
14,857
|
||||||||
|
Due after one year through five years
|
22,492
|
22,660
|
27,734
|
28,270
|
||||||||||||
|
Due after five years through ten years
|
2,535
|
2,529
|
2,459
|
2,599
|
||||||||||||
|
Due after ten years through fifteen years
|
2,391
|
2,389
|
949
|
987
|
||||||||||||
|
Due after fifteen years
|
801
|
868
|
729
|
830
|
||||||||||||
|
Total
|
$
|
57,725
|
$
|
58,008
|
$
|
46,695
|
$
|
47,543
|
||||||||
|
($ million)
|
||||||||||||||||
| Amortized | Gross Unrealized | |||||||||||||||
|
|
Cost
|
Gains
|
Losses
|
Fair Value
|
||||||||||||
|
31 December 2025
|
||||||||||||||||
|
Government or government-related obligations
|
$
|
40,273
|
$
|
100
|
$
|
(385
|
)
|
$
|
39,988
|
|||||||
| Other securities | ||||||||||||||||
|
Corporate obligations
|
8,828
|
88
|
(19
|
)
|
8,897
|
|||||||||||
|
Asset/Mortgage-backed securities
|
1,348
|
9
|
(76
|
)
|
1,281
|
|||||||||||
|
Total
|
$
|
50,449
|
$
|
197
|
$
|
(480
|
)
|
$
|
50,166
|
|||||||
|
31 December 2024
|
||||||||||||||||
|
Government or government-related obligations
|
$
|
31,759
|
$
|
59
|
$
|
(761
|
)
|
$
|
31,057
|
|||||||
|
Other securities
|
||||||||||||||||
|
Corporate obligations
|
9,359
|
48
|
(84
|
)
|
9,323
|
|||||||||||
|
Asset/Mortgage-backed securities
|
1,823
|
5
|
(115
|
)
|
1,713
|
|||||||||||
|
Total
|
$
|
42,941
|
$
|
112
|
$
|
(960
|
)
|
$
|
42,093
|
|||||||
|
For the year ended 31 December:
|
2025
|
2024
|
||||||
|
Change in net unrealized gains and losses from prior year
|
$
|
565
|
$
|
209
|
||||
|
Proceeds from sales
|
4,595
|
3,155
|
||||||
|
Gross gain on sales
|
18
|
8
|
||||||
|
Gross loss on sales
|
(14
|
)
|
(27
|
)
|
||||
| ($ million) | ||||||||||||||||||||||||
| One year or less |
Over one year | Total | ||||||||||||||||||||||
|
|
Fair
Value
|
Unrealized
Losses
|
Fair
Value
|
Unrealized
Losses
|
Fair
Value
|
Unrealized
Losses
|
||||||||||||||||||
|
2025
|
||||||||||||||||||||||||
|
Government or government-related obligations
|
$
|
11,757
|
$
|
77
|
$
|
12,904
|
$
|
308
|
$
|
24,661
|
$
|
385
|
||||||||||||
|
Other securities
|
||||||||||||||||||||||||
|
Corporate obligations
|
192 |
2
|
1,176
|
17
|
1,368
|
19
|
||||||||||||||||||
|
Asset/Mortgage-backed securities
|
19 |
0
|
546
|
76
|
565
|
76
|
||||||||||||||||||
|
Total
|
$ | 11,968 |
$
|
79
|
$
|
14,626
|
$
|
401
|
$
|
26,594
|
$
|
480
|
||||||||||||
|
|
||||||||||||||||||||||||
|
2024
|
||||||||||||||||||||||||
|
Government or government-related obligations
|
$
|
9,819
|
$
|
142
|
$
|
15,623
|
$
|
619
|
$
|
25,442
|
$
|
761
|
||||||||||||
|
Other securities
|
||||||||||||||||||||||||
|
Corporate obligations
|
1,954
|
14
|
1,766
|
70
|
3,720
|
84
|
||||||||||||||||||
|
Asset/Mortgage-backed securities
|
434
|
4
|
659
|
111
|
1,093
|
115
|
||||||||||||||||||
|
Total
|
$
|
12,207
|
$
|
160
|
$
|
18,048
|
$
|
800
|
$
|
30,255
|
$
|
960
|
||||||||||||
|
($ million)
|
||||||||||||||||
| Fair Value Measurements | ||||||||||||||||
| Total |
Level 1 | Level 2 | Level 3 | |||||||||||||
| 2025 | ||||||||||||||||
| Investments for liquidity purpose |
||||||||||||||||
|
Government or government-related obligations
|
$
|
39,988
|
$
|
36,968
|
$
|
3,020
|
$
|
–
|
||||||||
|
Time deposits
|
7,559
|
–
|
7,559
|
–
|
||||||||||||
|
Other securities
|
10,178
|
7,868
|
2,310
|
–
|
||||||||||||
|
Securities transferred under repurchase agreements
|
872
|
872
|
–
|
–
|
||||||||||||
|
Securities purchased under resale arrangements
|
252
|
–
|
252
|
–
|
||||||||||||
|
Total at fair value
|
$
|
58,849
|
$
|
45,708
|
$
|
13,141
|
$
|
–
|
||||||||
| 2024 | ||||||||||||||||
| Investments for liquidity purpose | ||||||||||||||||
|
Government or government-related obligations
|
$
|
31,057
|
$
|
28,474
|
$
|
2,583
|
$
|
–
|
||||||||
|
Time deposits
|
4,602
|
–
|
4,602
|
–
|
||||||||||||
|
Other securities
|
11,036
|
7,123
|
3,913
|
–
|
||||||||||||
|
Securities transferred under repurchase agreements
|
–
|
–
|
–
|
–
|
||||||||||||
|
Securities purchased under resale arrangements
|
260
|
–
|
260
|
–
|
||||||||||||
|
Total at fair value
|
$
|
46,955
|
$
|
35,597
|
$
|
11,358
|
$
|
–
|
||||||||
|
($ million)
|
||||||||||||||||
|
(a)
|
(b)
|
(c) = (a) – (b)
|
||||||||||||||
|
Gross amount
of liabilities
|
Gross amounts not offset in the
balance sheet
|
|||||||||||||||
|
presented in the
|
Financial
|
Collateral | ||||||||||||||
|
balance sheet
|
instruments
|
pledged |
Net amount
|
|||||||||||||
|
31 December 2025
|
||||||||||||||||
|
Payable under securities repurchase agreements
|
$
|
881
|
$
|
872
|
$ | – |
$
|
9
|
||||||||
|
31 December 2024
|
||||||||||||||||
|
Payable under securities repurchase agreements
|
$
|
–
|
$
|
–
|
$ | – |
$
|
–
|
||||||||
|
($ million)
|
||||||||||||||||
|
|
Remaining contractual maturity of the agreements
|
|||||||||||||||
|
31 December 2025
|
1-30 Days
|
31-90 Days
|
> 90 Days
|
Total
|
||||||||||||
| Payable under securities repurchase agreement | ||||||||||||||||
|
Government or government-related obligations
|
$
|
881
|
$
|
–
|
$
|
–
|
$
|
881
|
||||||||
|
|
||||||||||||||||
|
Gross amount of recognized liabilities for repurchase agreements disclosed above
|
881
|
|||||||||||||||
|
|
||||||||||||||||
|
Amounts related to agreements not included in offsetting disclosure
|
$
|
–
|
||||||||||||||
|
|
||||||||||||||||
|
31 December 2024
|
||||||||||||||||
| Payable under securities repurchase agreement | ||||||||||||||||
|
Government or government-related obligations
|
$
|
–
|
$
|
–
|
$
|
–
|
$
|
–
|
||||||||
|
|
||||||||||||||||
|
Gross amount of recognized liabilities for repurchase agreements disclosed above
|
–
|
|||||||||||||||
|
|
||||||||||||||||
|
Amounts related to agreements not included in offsetting disclosure
|
$
|
–
|
||||||||||||||
|
($ million)
|
||||||||||||
|
Sovereign
Loans
|
Nonsovereign
Loans
|
Total
|
||||||||||
| 2025 | ||||||||||||
|
Flexible loan product
|
$
|
116,460
|
$
|
4,591
|
$
|
121,051
|
||||||
|
Local currency loans
|
3,360
|
2,092
|
5,452
|
|||||||||
|
Pool-based single currency loans (US$)
|
93
|
–
|
93
|
|||||||||
|
Concessional loans
|
35,714
|
–
|
35,714
|
|||||||||
|
155,627
|
6,683
|
162,310
|
||||||||||
|
Fair value adjustment on loans
|
(939
|
)
|
–
|
(939
|
)
|
|||||||
|
Allowance for credit losses
|
(252
|
)
|
(316
|
)
|
(568
|
)
|
||||||
|
Unamortized direct loan origination cost (front-end fee)—net
|
299 |
(39
|
)
|
260
|
||||||||
| (892 | ) |
(355
|
)
|
(1,247
|
)
|
|||||||
|
Loans Outstanding
|
$
|
154,735
|
$
|
6,328
|
$
|
161,063
|
||||||
| 2024 | ||||||||||||
|
Flexible loan product
|
$
|
114,212
|
$
|
4,172
|
$
|
118,384
|
||||||
|
Local currency loans
|
1,013
|
1,582
|
2,595
|
|||||||||
|
Pool-based single currency loans (US$)
|
152
|
–
|
152
|
|||||||||
|
Concessional loans
|
33,439
|
–
|
33,439
|
|||||||||
|
148,816
|
5,754
|
154,570
|
||||||||||
|
Fair value adjustment on loans
|
(411
|
)
|
–
|
(411
|
)
|
|||||||
|
Allowance for credit losses
|
(254
|
)
|
(286
|
)
|
(540
|
)
|
||||||
|
Unamortized direct loan origination cost (front-end fee)—net
|
279
|
(34
|
)
|
245
|
||||||||
|
(386
|
)
|
(320
|
)
|
(706
|
)
|
|||||||
|
Loans Outstanding
|
$
|
148,430
|
$
|
5,434
|
$
|
153,864
|
||||||
|
($ million)
|
||||||||||||||||||||||||
|
Overdue Loan Service Payments
|
||||||||||||||||||||||||
|
1-90 Days
|
91-180 Days
|
> 180 Days
|
Total
Past Due
|
Current
|
Total
|
|||||||||||||||||||
|
2025
|
||||||||||||||||||||||||
|
Sovereign loans
|
||||||||||||||||||||||||
|
Regular
|
$
|
0
|
$
|
–
|
$
|
–
|
$
|
0
|
$
|
119,913
|
$
|
119,913
|
||||||||||||
|
Concessional
|
3
|
5
|
23
|
31
|
35,683
|
35,714
|
||||||||||||||||||
|
Subtotal
|
3
|
5
|
23
|
31
|
155,596
|
155,627
|
||||||||||||||||||
|
Nonsovereign loans
|
8
|
2
|
52
|
62
|
6,621
|
6,683
|
||||||||||||||||||
|
Total
|
$
|
11
|
$
|
7
|
$
|
75
|
$
|
93
|
$
|
162,217
|
162,310
|
|||||||||||||
|
Fair value adjustment on loans
|
(939
|
)
|
||||||||||||||||||||||
|
Allowance for credit losses
|
(568
|
)
|
||||||||||||||||||||||
|
Unamortized loan origination cost—net
|
260
|
|||||||||||||||||||||||
|
Loans Outstanding
|
$
|
161,063
|
||||||||||||||||||||||
|
0 = less than $0.5 million.
Notes: The amount of accrued interest excluded from the amortized cost basis in the above table is $1,321 million.
|
||||||||||||||||||||||||
|
($ million)
|
||||||||||||||||||||||||
|
Overdue Loan Service Payments
|
||||||||||||||||||||||||
|
1-90 Days
|
91-180 Days
|
> 180 Days
|
Total
Past Due
|
Current |
Total
|
|||||||||||||||||||
|
2024
|
||||||||||||||||||||||||
| Sovereign loans | ||||||||||||||||||||||||
|
Regular
|
$
|
–
|
$
|
–
|
$
|
–
|
$
|
–
|
$
|
115,377
|
$
|
115,377
|
||||||||||||
|
Concessional
|
2
|
4
|
10
|
16
|
33,423
|
33,439
|
||||||||||||||||||
|
Subtotal
|
2
|
4
|
10
|
16
|
148,800
|
148,816
|
||||||||||||||||||
|
Nonsovereign loans
|
3
|
2
|
44
|
49
|
5,705
|
5,754
|
||||||||||||||||||
|
Total
|
$
|
5
|
$
|
6
|
$
|
54
|
$
|
65
|
$
|
154,505
|
154,570
|
|||||||||||||
|
Fair value adjustment on loans
|
(411
|
)
|
||||||||||||||||||||||
|
Allowance for credit losses
|
(540
|
)
|
||||||||||||||||||||||
|
Unamortized loan origination cost—net
|
245
|
|||||||||||||||||||||||
|
Loans Outstanding
|
$
|
153,864
|
||||||||||||||||||||||
|
Note: The amount of accrued interest excluded from the amortized cost basis in the above table is $1,427 million.
|
||||||||||||||||||||||||
|
($ million)
|
||||||||
|
2025
|
2024
|
|||||||
|
As of 31 December:
|
||||||||
|
Amortized cost basis of loans in non-accrual statusa
|
||||||||
|
Sovereign
|
||||||||
|
Regular
|
$
|
–
|
$
|
–
|
||||
|
Concessional
|
509
|
486
|
||||||
|
Nonsovereign
|
92
|
98
|
||||||
|
Total
|
$
|
601
|
$
|
584
|
||||
|
Loans past due for more than 90 days not in non-accrual status
|
||||||||
|
Sovereign
|
||||||||
|
Regular
|
$ |
–
|
$ |
–
|
||||
|
Concessional
|
–
|
–
|
||||||
|
Nonsovereign
|
–
|
–
|
||||||
|
Total
|
$
|
–
|
$
|
–
|
||||
|
For the years ended 31 December:
|
||||||||
|
Interest income recognized on payments received for loans in non-accrual status
|
||||||||
|
Sovereign
|
|
|||||||
|
Regular
|
$ |
–
|
$ | – | ||||
|
Concessional
|
– | 6 |
||||||
|
Nonsovereign
|
2 |
– | ||||||
|
Total
|
$ | 2 |
$ | 6 |
||||
|
($ million)
|
|||||||||||||||||||||||||||||||||
|
31 December 2025
|
|||||||||||||||||||||||||||||||||
|
Origination Year
|
Private
sector
|
||||||||||||||||||||||||||||||||
|
Risk Class
|
Risk Rating
|
2025
|
2024
|
2023
|
2022
|
2021
|
Prior
|
programs
|
Total
|
||||||||||||||||||||||||
|
Sovereign Loans:
|
|||||||||||||||||||||||||||||||||
|
Low credit risk
|
1–5 (AAA to BBB–)
|
$
|
2,026
|
$
|
4,647
|
$
|
5,036
|
$
|
4,665
|
$
|
6,871
|
$
|
52,512
|
$
|
–
|
$
|
75,757
|
||||||||||||||||
|
Medium credit risk
|
6–8 (BB+ to BB–)
|
867
|
1,080
|
394
|
946
|
930
|
15,493
|
–
|
19,710
|
||||||||||||||||||||||||
|
Significant credit risk
|
9–10 (B+ to B)
|
1,314
|
1,466
|
2,214
|
1,603
|
2,256
|
19,448
|
–
|
28,301
|
||||||||||||||||||||||||
|
High credit risk and non-accrual
|
11–14 (B– to D)
|
1,167
|
1,958
|
1,357
|
2,454
|
2,430
|
21,853
|
–
|
31,219
|
||||||||||||||||||||||||
|
Total Sovereign Loans
|
5,374
|
9,151
|
9,001
|
9,668
|
12,487
|
109,306
|
–
|
154,987
|
|||||||||||||||||||||||||
|
Nonsovereign Loans:
|
|||||||||||||||||||||||||||||||||
|
Low credit risk
|
1–5 (AAA to BBB–)
|
25
|
483
|
105
|
97
|
–
|
1,085
|
50
|
1,845
|
||||||||||||||||||||||||
|
Medium credit risk
|
6–8 (BB+ to BB–)
|
179
|
716
|
608
|
196
|
136
|
586
|
97
|
2,518
|
||||||||||||||||||||||||
|
Significant credit risk
|
9–10 (B+ to B)
|
191
|
244
|
124
|
103
|
20
|
648
|
115
|
1,445
|
||||||||||||||||||||||||
|
High credit risk and non-accrual
|
11–14 (B– to D)
|
–
|
16
|
73
|
9
|
25
|
696
|
17
|
836
|
||||||||||||||||||||||||
|
Total Nonsovereign Loans
|
395
|
1,459
|
910
|
405
|
181
|
3,015
|
279
|
6,644
|
|||||||||||||||||||||||||
|
Total
|
$
|
5,769
|
$
|
10,610
|
$
|
9,911
|
$
|
10,073
|
$
|
12,668
|
$
|
112,321
|
$
|
279
|
$
|
161,631
|
|||||||||||||||||
|
($ million)
|
|||||||||||||||||||||||||||||||||
|
31 December 2024
|
|||||||||||||||||||||||||||||||||
|
Origination Year
|
Private
sector
|
||||||||||||||||||||||||||||||||
|
Risk Class
|
Risk Rating
|
2024
|
2023
|
2022
|
2021
|
2020
|
Prior
|
programs
|
Total
|
||||||||||||||||||||||||
|
Sovereign Loans:
|
|||||||||||||||||||||||||||||||||
|
Low credit risk
|
1–5 (AAA to BBB–)
|
$
|
1,721
|
$
|
4,464
|
$
|
3,982
|
$
|
6,594
|
$
|
9,902
|
$
|
46,925
|
$
|
–
|
$
|
73,588
|
||||||||||||||||
|
Medium credit risk
|
6–8 (BB+ to BB–)
|
33
|
16
|
104
|
430
|
408
|
10,413
|
–
|
11,404
|
||||||||||||||||||||||||
|
Significant credit risk
|
9–10 (B+ to B)
|
2,088
|
1,949
|
2,220
|
2,704
|
3,527
|
21,203
|
–
|
33,691
|
||||||||||||||||||||||||
|
High credit risk and non-accrual
|
11–14 (B– to D)
|
1,651
|
1,237
|
2,439
|
2,222
|
2,518
|
19,934
|
–
|
30,001
|
||||||||||||||||||||||||
|
Total Sovereign Loans
|
5,493
|
7,666
|
8,745
|
11,950
|
16,355
|
98,475
|
–
|
148,684
|
|||||||||||||||||||||||||
|
Gross write-offs
|
–
|
–
|
–
|
–
|
–
|
10
|
–
|
10
|
|||||||||||||||||||||||||
|
Nonsovereign Loans:
|
|||||||||||||||||||||||||||||||||
|
Low credit risk
|
1–5 (AAA to BBB–)
|
(1
|
)
|
122
|
232
|
–
|
47
|
973
|
82
|
1,455
|
|||||||||||||||||||||||
|
Medium credit risk
|
6–8 (BB+ to BB–)
|
248
|
303
|
322
|
202
|
157
|
870
|
47
|
2,149
|
||||||||||||||||||||||||
|
Significant credit risk
|
9–10 (B+ to B)
|
64
|
243
|
119
|
17
|
96
|
526
|
92
|
1,157
|
||||||||||||||||||||||||
|
High credit risk and non-accrual
|
11–14 (B– to D)
|
14
|
65
|
9
|
11
|
–
|
848
|
12
|
959
|
||||||||||||||||||||||||
|
Total Nonsovereign Loans
|
325
|
733
|
682
|
230
|
300
|
3,217
|
233
|
5,720
|
|||||||||||||||||||||||||
|
Gross write-offs
|
–
|
–
|
–
|
–
|
–
|
65
|
–
|
65
|
|||||||||||||||||||||||||
|
Total
|
$
|
5,818
|
$
|
8,399
|
$
|
9,427
|
$
|
12,180
|
$
|
16,655
|
$
|
101,692
|
$
|
233
|
$
|
154,404
|
|||||||||||||||||
|
($ million)
|
||||||||||||||||||||||||
|
2025
|
2024
|
|||||||||||||||||||||||
|
Sovereign
|
Nonsovereign
|
Sovereign
|
Nonsovereign
|
|||||||||||||||||||||
|
Loans
|
Loans
|
Total
|
Loans
|
Loans
|
Total
|
|||||||||||||||||||
|
Beginning balance
|
$
|
254
|
$
|
286
|
$
|
540
|
$
|
271
|
$
|
381
|
$
|
652
|
||||||||||||
|
(Release of provision)
|
||||||||||||||||||||||||
|
Provision
|
(2
|
)
|
30
|
28
|
(7
|
)
|
(30
|
)
|
(37
|
)
|
||||||||||||||
|
Write-off
|
–
|
–
|
–
|
(10
|
)a
|
(65
|
)
|
(75
|
) |
|||||||||||||||
|
Ending balance
|
$
|
252
|
$
|
316
|
$
|
568
|
$
|
254
|
$
|
286
|
$
|
540
|
||||||||||||
|
($ million)
|
||||||||||||||||
|
2025
|
2024
|
|||||||||||||||
|
Carrying
Value
|
Fair Value
|
Carrying
Value
|
Fair Value
|
|||||||||||||
|
Sovereign – Regular
|
$
|
119,277
|
$
|
119,937
|
$
|
115,261
|
$
|
115,799
|
||||||||
|
Sovereign – Concessional
|
35,458
|
35,458
|
33,169
|
33,169
|
||||||||||||
|
Nonsovereign
|
6,328
|
6,391
|
5,434
|
5,468
|
||||||||||||
|
Total
|
$
|
161,063
|
$
|
161,786
|
$
|
153,864
|
$
|
154,436
|
||||||||
|
($ million)
|
||||||||
|
2025
|
2024
|
|||||||
|
Level 1
|
$ |
–
|
$ |
–
|
||||
|
Level 2
|
–
|
–
|
||||||
|
Level 3
|
161,786
|
154,436
|
||||||
|
Total fair value
|
$
|
161,786
|
$
|
154,436 | ||||
|
($ million)
|
||||||||||||||||
|
2025
|
2024
|
|||||||||||||||
|
Amount
|
No. of
Loans
|
Amount
|
No. of
Loans
|
|||||||||||||
|
Sovereign loans
|
$
|
7,015
|
76 |
$
|
4,164
|
66 | ||||||||||
|
Nonsovereign loans
|
3,327
|
114 |
3,049
|
103 | ||||||||||||
|
Total
|
$
|
10,342
|
190 |
$
|
7,213
|
169 | ||||||||||
|
($ million)
|
||||||||||||||||
| 2025 | 2024 | |||||||||||||||
|
Maximum
Potential
Exposure
|
Outstanding
Amount
|
Maximum
Potential
Exposure
|
Outstanding
Amount
|
|||||||||||||
|
Project
|
||||||||||||||||
|
Sovereign
|
||||||||||||||||
|
with counterguarantee
|
$
|
533
|
$
|
519
|
$
|
33
|
$
|
–
|
||||||||
|
without counterguarantee
|
357
|
300
|
427
|
344
|
||||||||||||
|
890
|
819
|
460
|
344
|
|||||||||||||
|
Nonsovereign
|
||||||||||||||||
|
with counterguarantee
|
76
|
33
|
81
|
35
|
||||||||||||
|
without counterguarantee
|
100
|
44
|
99
|
46
|
||||||||||||
|
176
|
77
|
180
|
81
|
|||||||||||||
|
Subtotal
|
1,066
|
896
|
640
|
425
|
||||||||||||
|
Private Sector Programs
|
||||||||||||||||
|
Nonsovereign
|
||||||||||||||||
|
with counterguarantee
|
875
|
875
|
964
|
964
|
||||||||||||
|
without counterguarantee
|
1,290
|
1,290
|
989
|
989
|
||||||||||||
|
Subtotal
|
2,165
|
2,165
|
1,953
|
1,953
|
||||||||||||
|
Exposure Exchange Agreement
|
9,000
|
9,000
|
6,000
|
6,000
|
||||||||||||
|
Total
|
$
|
12,231
|
$
|
12,061
|
$
|
8,593
|
$
|
8,378
|
||||||||
|
2
|
ADB provides two primary guarantee products – a credit guarantee and a political risk guarantee. ADB’s credit guarantee is designed as credit enhancements for
eligible projects to cover risks that the project and its commercial cofinancing partners cannot easily absorb or manage on their own. ADB also provides political risk guarantees to cover
specifically defined political risks such as expropriation, currency inconvertibility or non-transfer. Reducing these risks can make a significant difference in mobilizing private sector financing
for projects.
|
| Unobservable | ||||||
|
Valuation Technique
|
Input
|
2025
|
2024
|
|||
|
Discounted cash flows
|
Discount rates
|
2.22%
|
2.22%
|
|||
|
($ million)
|
||||||||||||||||
| 2025 | 2024 |
|||||||||||||||
|
Receivable
|
Liability
|
Receivable
|
Liability
|
|||||||||||||
|
Balance, 1 January
|
$
|
331
|
$
|
331
|
$
|
207
|
$
|
207
|
||||||||
|
Issuances
|
193
|
203
|
172
|
172
|
||||||||||||
|
Amortization
|
(60
|
)
|
(62
|
)
|
(48
|
)
|
(48
|
)
|
||||||||
|
Balance, 31 December
|
$
|
464
|
$
|
472
|
$
|
331
|
$
|
331
|
||||||||
|
($ million)
|
||||||||
|
2025
|
2024
|
|||||||
|
Equity method
|
$
|
1,429
|
$
|
1,254 |
||||
|
Fair value method
|
563
|
373
|
||||||
|
Total
|
$
|
1,992
|
$
|
1,627
|
||||
|
($ million)
|
||||||||
|
2025
|
2024
|
|||||||
|
As of 31 December
|
||||||||
|
Cost
|
$
|
512
|
$
|
333
|
||||
|
Fair value
|
563
|
373
|
||||||
|
Gross unrealized gains
|
118
|
98
|
||||||
|
Gross unrealized losses
|
(67
|
)
|
(58
|
)
|
||||
|
For the years ended 31 December:
|
||||||||
|
Net unrealized gains (losses)
|
$
|
9
|
$ | (20 | ) | |||
|
Net realized gains
|
8
|
13
|
||||||
|
Net gains (losses)
|
$ | 17 | $ | (7 | ) | |||
|
($ million)
|
||||||||
|
2025
|
2024 | |||||||
|
Level 1
|
$
|
192 |
$
|
96 | ||||
|
Level 2
|
61 | 124 | ||||||
|
Level 3
|
310 | 153 | ||||||
|
Total equity investments at fair value
|
$
|
563 |
$
|
373 | ||||
|
Valuation Technique
|
Fair Value
($ million)
|
Unobservable Inputs
|
Range
(Weighted Average)a
|
|||||
|
2025
|
||||||||
|
Discounted cash flow
|
$
|
70 |
Discount rate
|
10.8% – 23.6% (16.20%)
|
||||
|
Comparable valuations
|
173 |
Price-to-book multiples
|
0.50x – 1.10x (0.92x)
|
|||||
|
EV/EBITDA
|
12.40x – 12.70x (12.44x) | |||||||
|
Net asset value
|
67 |
Discount
|
(40%)
|
|||||
|
$
|
310 | |||||||
|
2024
|
||||||||
|
Discounted cash flow
|
$
|
19 |
Discount rate
|
13.4% – 14.6% (14.24%)
|
||||
|
Comparable valuations
|
85 |
Price-to-book multiples
|
0.50x – 1.10x (0.92x)
|
|||||
|
EV/EBITDA
|
(17.50x)
|
|||||||
|
Net asset value
|
49 |
Discount
|
(40%)
|
|||||
|
$
|
153 | |||||||
|
($ million)
|
||||||||
|
|
Equity investments under FV Method
|
|||||||
|
|
2025
|
2024
|
||||||
|
Balance, beginning of year
|
$
|
153 |
$
|
240 | ||||
|
Transfer into Level 3
|
95 | 34 | ||||||
|
Disbursement
|
53 | 0 | ||||||
|
Divestment
|
(7
|
)
|
(48
|
)
|
||||
|
Reclassified out of Level 3
|
-
|
|
(24
|
)
|
||||
|
Total unrealized (losses) gains
|
||||||||
|
Included in earningsa
|
15 |
|
(44 |
) |
||||
|
Included in other comprehensive income (loss)b
|
1 |
(5 |
) |
|||||
|
Balance, end of year
|
$
|
310 |
$
|
153 | ||||
|
The amount of total (losses) gains for the year included in earnings attributable to the change in unrealized gains or losses relating to assets still
held at reporting datea
|
$ |
17
|
$ | (41 |
) |
|||
|
($ million)
|
||||||||
|
2025
|
2024
|
|||||||
|
Available for sale
|
$
|
116
|
$
|
120
|
||||
|
Held-to-maturity
|
457
|
515
|
||||||
|
573
|
635
|
|||||||
|
Allowance for credit losses
|
(21
|
)
|
(14
|
)
|
||||
|
Total
|
$
|
552
|
$
|
621
|
||||
|
($ million)
|
||||||||||||||||
|
|
2025 |
2024
|
||||||||||||||
|
Amortized
Cost
|
Fair Value
|
Amortized
Cost
|
Fair Value
|
|||||||||||||
|
Due in 1 year or less
|
$
|
62
|
$
|
82
|
$
|
179
|
$
|
202
|
||||||||
|
Due after 1 year through 5 years
|
419
|
415
|
411
|
407
|
||||||||||||
|
Due after 5 years through 10 years
|
89
|
73
|
48
|
35
|
||||||||||||
|
Due after 10 years through 15 years
|
–
|
–
|
–
|
–
|
||||||||||||
|
Due after 15 years through 20 years
|
–
|
1
|
–
|
1
|
||||||||||||
|
Total
|
$
|
570
|
$
|
571
|
$
|
638
|
$
|
645
|
||||||||
|
($ million)
|
|||||||||||||||||||||||||||||
|
31 December 2025
|
|||||||||||||||||||||||||||||
|
|
Origination Year
|
||||||||||||||||||||||||||||
|
Risk Class
|
Risk Rating
|
2025
|
2024
|
2023
|
2022
|
2021
|
Prior
|
Total
|
|||||||||||||||||||||
|
Low credit risk
|
1-5 (AAA to BBB–)
|
$
|
–
|
$
|
–
|
$
|
–
|
$
|
9
|
$
|
–
|
$
|
–
|
$
|
9
|
||||||||||||||
|
Medium credit risk
|
6-8 (BB+ to BB–)
|
99
|
32
|
75
|
19
|
31
|
65
|
321
|
|||||||||||||||||||||
|
Significant credit risk
|
9-10 (B+ to B)
|
23
|
12
|
–
|
–
|
–
|
–
|
35
|
|||||||||||||||||||||
|
High credit risk and
non-accrual
|
11-14 (B– to D)
|
–
|
–
|
–
|
–
|
–
|
92 | 92 | |||||||||||||||||||||
|
Total
|
$
|
122
|
$
|
44
|
$
|
75
|
$
|
28
|
$
|
31
|
$
|
157
|
$
|
457 | |||||||||||||||
|
($ million)
|
|||||||||||||||||||||||||||||
|
31 December 2024
|
|||||||||||||||||||||||||||||
|
|
Origination Year
|
||||||||||||||||||||||||||||
|
Risk Class
|
Risk Rating
|
2024
|
2023
|
2022
|
2021
|
2020
|
Prior
|
Total
|
|||||||||||||||||||||
|
Low credit risk
|
1-5 (AAA to BBB–)
|
$
|
–
|
$
|
–
|
$
|
10 |
$
|
–
|
$
|
–
|
$
|
–
|
$
|
10 | ||||||||||||||
|
Medium credit risk
|
6-8 (BB+ to BB–)
|
24
|
92 | 25 | 40 |
38
|
172 |
391
|
|||||||||||||||||||||
|
Significant credit risk
|
9-10 (B+ to B)
|
12
|
7
|
7 |
–
|
–
|
–
|
26 | |||||||||||||||||||||
|
High credit risk and
non-accrual
|
11-14 (B– to D)
|
–
|
–
|
–
|
–
|
–
|
88 | 88 | |||||||||||||||||||||
|
Total
|
$
|
36
|
$
|
99 |
$
|
42
|
$
|
40
|
$
|
38
|
$
|
260 |
$
|
515 | |||||||||||||||
|
($ million)
|
||||||||
|
2025
|
2024
|
|||||||
|
Balance, beginning of year
|
$
|
14
|
$
|
4
|
||||
|
Provision
|
7
|
10
|
||||||
|
Balance, end of year
|
$
|
21
|
$
|
14
|
||||
|
($ million)
|
||||||||
|
2025
|
2024
|
|||||||
|
Level 1
|
$
|
106
|
$
|
95
|
||||
|
Level 2
|
–
|
15
|
||||||
|
Level 3
|
465
|
535
|
||||||
|
Total at fair value
|
$
|
571
|
$
|
645
|
||||
|
Range (Average)a
|
||||||
|
Valuation Technique
|
Unobservable Inputs
|
2025
|
2024
|
|||
|
Discounted cash flows
|
Discount rate
|
20.45%
|
18.30
|
|||
|
Scenario-based financial model
|
Future cash flows
|
88.51%
|
79.00% to 96.00%
(80.00%)
|
|||
|
($ million)
|
||||||||
|
2025
|
2024
|
|||||||
|
Balance, beginning of year
|
$
|
10
|
$
|
–
|
||||
|
Transfer into Level 3
|
–
|
10
|
||||||
|
Total unrealized income (losses) included in accumulated other comprehensive income (loss)a
|
0
|
(0
|
)
|
|||||
|
Balance, end of year
|
$
|
10
|
$
|
10
|
||||
|
The amount of total income (losses) for the period included in other comprehensive income attributable to the change in net unrealized gains or lossesa relating to assets still held at the reporting date
|
$
|
0
|
$
|
(0
|
)
|
|||
|
($ million)
|
||||||||
|
2025
|
2024
|
|||||||
|
As of 31 December
|
||||||||
|
Amortized cost
|
$
|
113
|
$
|
123
|
||||
|
Fair value
|
116
|
120
|
||||||
|
Gross unrealized gains
|
5
|
1
|
||||||
|
Gross unrealized losses
|
(2
|
)
|
(4
|
)
|
||||
|
For the year ended 31 December
|
||||||||
|
Change in net unrealized gains or losses from prior year
|
6
|
2
|
||||||
|
($ million)
|
|||||||||||||||||
|
Balance Sheet
Location
|
Fair Value Measurements
|
||||||||||||||||
|
Total
|
Level 1
|
Level 2
|
Level 3
|
||||||||||||||
|
2025
|
|||||||||||||||||
|
Assets
|
|||||||||||||||||
|
Borrowings related derivatives
|
Derivative Assets
|
||||||||||||||||
|
Currency swaps
|
- Borrowings
|
$
|
75,151
|
$
|
–
|
$
|
71,762
|
$
|
3,389
|
||||||||
|
Interest rate swaps
|
599
|
–
|
597
|
2
|
|||||||||||||
|
Investments related derivatives
|
Derivative Assets
|
||||||||||||||||
|
Currency swaps
|
- Investments for
|
20,429
|
–
|
20,429
|
–
|
||||||||||||
|
Interest rate swaps
|
liquidity purpose
|
276
|
–
|
276
|
–
|
||||||||||||
|
Foreign exchange swaps
|
8,676
|
–
|
8,676
|
–
|
|||||||||||||
|
Foreign exchange forward
|
173
|
–
|
173
|
–
|
|||||||||||||
|
Loans related derivatives
|
Derivative Assets
|
||||||||||||||||
|
Currency swaps
|
- Loans — Operations
|
17,198
|
–
|
17,198
|
–
|
||||||||||||
|
Interest rate swaps
|
193
|
–
|
193
|
–
|
|||||||||||||
|
Total assets at fair value
|
$
|
122,695
|
$
|
–
|
$
|
119,304
|
$
|
3,391
|
|||||||||
| Liabilities | |||||||||||||||||
|
Borrowings related derivatives
|
Derivative Liabilities
|
||||||||||||||||
|
Currency swaps
|
- Borrowings
|
$
|
76,068
|
$
|
–
|
$ |
76,068
|
$
|
–
|
||||||||
|
Interest rate swaps
|
2,559
|
–
|
2,559
|
0
|
|||||||||||||
|
Investments related derivatives
|
Derivative Liabilities
|
||||||||||||||||
|
Currency swaps
|
- Investments for
|
19,070
|
–
|
19,070
|
–
|
||||||||||||
|
Interest rate swaps
|
liquidity purpose
|
80
|
–
|
80
|
–
|
||||||||||||
|
Foreign exchange swaps
|
8,271
|
–
|
8,271
|
–
|
|||||||||||||
|
Foreign exchange forward
|
175
|
–
|
175
|
–
|
|||||||||||||
|
Loans related derivatives
|
Derivative Liabilities
|
||||||||||||||||
|
Currency swaps
|
- Loans — Operations
|
15,444
|
–
|
11,918
|
3,526
|
||||||||||||
|
Interest rate swaps
|
57
|
–
|
57
|
–
|
|||||||||||||
|
Total liabilities at fair value
|
$
|
121,724
|
$ |
–
|
$
|
118,198
|
$
|
3,526
|
|||||||||
|
($ million)
|
|||||||||||||||||
| Balance Sheet
|
Fair Value
Measurements |
||||||||||||||||
|
|
Location
|
Total
|
Level 1
|
Level 2
|
Level 3
|
||||||||||||
|
2024
Assets
|
|||||||||||||||||
|
Borrowings related derivatives
|
Derivative Assets
|
||||||||||||||||
|
Currency swaps
|
- Borrowings |
$
|
61,141
|
$
|
–
|
$
|
58,608
|
$
|
2,533
|
||||||||
|
Interest rate swaps
|
143
|
–
|
143
|
0
|
|||||||||||||
|
Foreign exchange swaps
|
|
588
|
–
|
588
|
–
|
||||||||||||
|
Investments related derivatives
|
Derivative Assets |
||||||||||||||||
|
Currency swaps
|
- Investments for
|
16,485
|
–
|
16,485
|
–
|
||||||||||||
|
Interest rate swaps
|
liquidity purpose
|
299
|
–
|
299
|
–
|
||||||||||||
|
Foreign exchange swaps
|
9,077
|
–
|
9,077
|
–
|
|||||||||||||
|
Foreign exchange forward
|
201
|
–
|
201
|
–
|
|||||||||||||
| Loans related derivatives |
Derivative Assets
|
||||||||||||||||
|
Currency swaps
|
- Loans — Operations
|
17,415
|
–
|
17,415
|
–
|
||||||||||||
|
Interest rate swaps
|
256
|
–
|
256
|
–
|
|||||||||||||
|
Total assets at fair value
|
$
|
105,605
|
$
|
–
|
$
|
103,072
|
$
|
2,533
|
|||||||||
|
Liabilities
|
|||||||||||||||||
|
Borrowings related derivatives
|
Derivative Liabilities
|
||||||||||||||||
|
Currency swaps
|
- Borrowings
|
$
|
66,502
|
$
|
–
|
$
|
66,502
|
$
|
–
|
||||||||
|
Interest rate swaps
|
4,615
|
–
|
4,614
|
1
|
|||||||||||||
|
Foreign exchange swaps
|
586
|
–
|
586
|
–
|
|||||||||||||
| Investments related derivatives |
Derivative Liabilities
|
||||||||||||||||
|
Currency swaps
|
- Investments for
|
14,388
|
–
|
14,388
|
–
|
||||||||||||
|
Interest rate swaps
|
liquidity purpose
|
99
|
–
|
99
|
–
|
||||||||||||
|
Foreign exchange swaps
|
8,599
|
–
|
8,599
|
–
|
|||||||||||||
|
Foreign exchange forward
|
206
|
–
|
206
|
–
|
|||||||||||||
| Loans related derivatives | Derivative Liabilities | ||||||||||||||||
|
Currency swaps
|
- Loans — Operations
|
14,698
|
–
|
12,986
|
1,712
|
||||||||||||
|
Interest rate swaps
|
123
|
–
|
123
|
–
|
|||||||||||||
|
Total liabilities at fair value
|
$
|
109,816
|
$
|
–
|
$
|
108,103
|
$
|
1,713
|
|||||||||
|
Valuation
|
|
Unobservable
|
Range (Weighted Average)a
|
|||
|
Technique
|
Inputs
|
2025
|
2024
|
|||
|
Discounted
cash flows
|
Basis
swap spreads
|
|
-0.3% to 33.63% (-97.7%)
|
-0.47% to 38.83% (6.05%)
|
||
|
a
|
Unobservable inputs were weighted by the relative fair value of the instruments.
|
|
Borrowings related
derivatives
|
Loans related derivatives
|
|||||||||||||||
|
2025
|
Assets
|
Liabilities
|
Assets
|
Liabilities
|
||||||||||||
|
Balance, beginning of year
|
$
|
2,533
|
$
|
(1
|
) |
$
|
–
|
$
|
(1,712
|
) | ||||||
|
Total realized/unrealized (losses) gains
|
|
|||||||||||||||
|
Included in earnings
|
232 |
1
|
–
|
(304 |
) |
|||||||||||
|
Included in other comprehensive income (loss)b
|
145
|
0
|
–
|
(8
|
) | |||||||||||
|
Issuances
|
1,072
|
–
|
– |
(2,057
|
) | |||||||||||
|
Maturities/Redemptions
|
(591
|
) |
–
|
–
|
555 | |||||||||||
|
Balance, end of year
|
$ |
3,391
|
$ |
(0
|
) | $ |
–
|
$ |
(3,526
|
) | ||||||
|
The amount of total gains (losses) for the year included in earnings attributable to the change in net unrealized gains or lossesa relating to assets/liabilities still held at the reporting date
|
$
|
6
|
$ |
1 |
$ |
–
|
$ |
(222
|
) |
|||||||
|
2024
|
||||||||||||||||
|
Balance, beginning of year
|
$
|
2,083
|
$
|
(1
|
) |
$ |
0
|
$ |
(913
|
) | ||||||
|
Total realized/unrealized gains (losses)
|
||||||||||||||||
|
Included in earnings
|
(57
|
) |
(0
|
) |
(0
|
) |
(41
|
) |
||||||||
|
Included in other comprehensive income (loss)b
|
(112
|
) | 0 |
–
|
27
|
|||||||||||
|
Issuances
|
1,073
|
–
|
–
|
(910
|
) |
|||||||||||
|
Maturities/Redemptions
|
(454)
|
–
|
–
|
125
|
||||||||||||
|
Balance, end of year
|
$ |
2,533
|
$ |
(1
|
) | $ |
0
|
$ |
(1,712
|
) | ||||||
|
The amount of total (losses) gains for the year included in earnings attributable to the change in net unrealized gains or lossesa relating to assets/liabilities still held at the reporting date
|
$ |
(21)
|
$ |
(0
|
) | $ |
0
|
$
|
(39)
|
|||||||
|
a
|
Included in net unrealized gains (OCR-2).
|
|
b
|
Included in accumulated translation adjustments (Note N).
|
| Location of Gain (Loss) recognized in |
Amount of Gain (Loss)
recognized in Income
(Expenses) on Derivatives
|
||||||||
|
|
Income (Expenses) on Derivatives
|
2025
|
2024
|
||||||
|
Borrowings related derivatives
|
|||||||||
|
Currency swaps
|
Borrowing and related expenses
|
$
|
(621
|
)
|
$
|
(1,320
|
)
|
||
|
|
Net Realized Gains (Losses) |
(10
|
)
|
0
|
|||||
|
|
Net Unrealized Gains |
177
|
692
|
||||||
|
Interest rate swaps
|
Borrowing and related expenses
|
(1,481
|
)
|
(2,848
|
)
|
||||
|
|
Net Unrealized Gains |
2,092
|
328
|
||||||
|
Foreign exchange swaps
|
Borrowing and related expenses
|
1
|
–
|
||||||
|
$
|
158
|
$
|
(3,148
|
)
|
|||||
|
Investments related derivatives
|
|||||||||
|
Currency swaps
|
Revenue from investments for liquidity purpose
|
$
|
605
|
$
|
720
|
||||
| Net Unrealized Gains |
86
|
(18
|
)
|
||||||
|
Interest rate swaps
|
Revenue from investments for liquidity purpose
|
55
|
83
|
||||||
|
|
Net Unrealized Gains |
(26
|
)
|
(11
|
)
|
||||
|
|
Net Realized Gains (Losses) |
(2
|
)
|
1
|
|||||
|
Foreign exchange swaps
|
Revenue from investments for liquidity purpose
|
281
|
313
|
||||||
|
|
Net Unrealized Gains
|
(1
|
)
|
5
|
|||||
|
Foreign exchange forwards
|
Net Unrealized Gains
|
(0
|
)
|
(1
|
)
|
||||
|
$
|
998
|
$
|
1,092
|
||||||
|
Loans related derivatives
|
|||||||||
|
Currency swaps
|
Revenue from Loans ─ Operations
|
$
|
1,021
|
$
|
1,168
|
||||
|
|
Net Unrealized Gains |
138
|
(367
|
)
|
|||||
|
Interest rate swaps
|
Revenue from Loans ─ Operations
|
19
|
30
|
||||||
|
|
Net Unrealized Gains |
1
|
(34
|
)
|
|||||
|
$
|
1,179
|
$
|
797
|
||||||
| 2025 | 2024 | |||||||||||||||
|
Derivative
assets
|
Derivative
liabilities
|
Derivative
assets
|
Derivative
liabilities
|
|||||||||||||
|
Gross amount presented in the balance sheet
|
$
|
122,695
|
$
|
(121,724
|
)
|
$
|
105,605
|
$
|
(109,816
|
)
|
||||||
|
Gross amounts not offset in the balance sheet
|
||||||||||||||||
|
Financial instruments
|
(120,173
|
)
|
120,173
|
(104,561
|
)
|
104,561
|
||||||||||
|
Collateral receiveda
|
(2,371
|
)
|
–
|
(728
|
)
|
–
|
||||||||||
|
Net amountb
|
$
|
151
|
$
|
(1,551
|
)
|
$
|
316
|
$
|
(5,255
|
)
|
||||||
|
a
|
Includes cash and securities collateral used to cover positive marked-to-market exposures.
|
|
b
|
ADB is not required to post collateral to counterparties when it is in a net liability position.
|
|
($ million)
|
||||||||
|
2025
|
2024
|
|||||||
|
Land
|
$
|
10
|
$
|
10
|
||||
|
Buildings and improvements
|
114
|
121
|
||||||
|
Office furniture and equipment
|
156
|
127
|
||||||
|
Right-of-use asset
|
56
|
51
|
||||||
|
Total
|
$
|
336
|
$
|
309
|
||||
| 2025 |
2024 |
|||||||||||||||
|
Buildings
and
Improvements
|
Office
Furniture and
Equipment
|
Buildings
and
Improvements
|
Office
Furniture and
Equipment
|
|||||||||||||
|
Cost:
|
||||||||||||||||
|
Balance, 1 January
|
$
|
348
|
$
|
400
|
$
|
333
|
$
|
351
|
||||||||
|
Additions during the year
|
12
|
61
|
15
|
65
|
||||||||||||
|
Disposals during the year
|
(0
|
)
|
(7
|
)
|
(0
|
)
|
(16
|
)
|
||||||||
|
Balance, 31 December
|
360
|
454
|
348
|
400
|
||||||||||||
|
Accumulated Depreciation:
|
||||||||||||||||
|
Balance, 1 January
|
(227
|
)
|
(273
|
)
|
(211
|
)
|
(265
|
)
|
||||||||
|
Depreciation during the year
|
(19
|
)
|
(32
|
)
|
(16
|
)
|
(24
|
)
|
||||||||
|
Disposals during the year
|
0
|
7
|
0
|
16
|
||||||||||||
|
Balance, 31 December
|
(246
|
)
|
(298
|
)
|
(227
|
)
|
(273
|
)
|
||||||||
|
Net Book Value, 31 December
|
$
|
114
|
$
|
156
|
$
|
121
|
$
|
127
|
||||||||
|
Year ending 31 December
|
$ million
|
||||
|
2026
|
$
|
12
|
|||
|
2027
|
7
|
||||
|
2028
|
6
|
||||
|
2029
|
5
|
||||
|
2030
|
4
|
||||
|
Later years
|
25
|
||||
|
($ million)
|
||||||||
|
2025
|
2024
|
|||||||
|
At Amortized cost
|
$
|
2,755
|
$
|
2,394
|
||||
|
At Fair value
|
163,196
|
144,123
|
||||||
|
Total
|
$
|
165,951
|
$
|
146,517
|
||||
|
($ million)
|
||||||||
|
2025
|
2024
|
|||||||
|
At Amortized cost
|
||||||||
|
Level 1
|
$
|
–
|
$
|
–
|
||||
|
Level 2
|
2,180
|
2,040
|
||||||
|
Level 3
|
645
|
441
|
||||||
|
Sub-total
|
2,825
|
2,481
|
||||||
|
At Fair value
|
||||||||
|
Level 1
|
–
|
–
|
||||||
|
Level 2
|
151,393
|
136,948
|
||||||
|
Level 3
|
11,803
|
7,175
|
||||||
|
Sub-total
|
163,196
|
144,123
|
||||||
|
Total borrowings at fair value
|
$
|
166,021
|
$
|
146,604
|
||||
|
Unobservable
|
Range (Weighted Average)a
|
|||||
|
Valuation Technique
|
Inputs
|
2025
|
2024
|
|||
|
Discounted cash flows
|
Derived credit spreads
|
-2.11% to 4.66% (0.18%)
|
-1.54% to 6.11% (0.1%)
|
|||
|
($ million)
|
||||||||
|
|
2025
|
2024
|
||||||
|
Balance, beginning of year
|
$
|
7,175
|
$
|
7,033
|
||||
|
Total losses (gains) - (realized/unrealized)
|
||||||||
|
Included in earningsa
|
573
|
(27
|
)
|
|||||
|
Included in other comprehensive incomeb
|
256
|
(151
|
)
|
|||||
|
Issuances
|
5,111
|
3,540
|
||||||
|
Maturities/Redemptions
|
(1,312
|
)
|
(3,220
|
)
|
||||
|
Balance, end of year
|
$
|
11,803
|
$
|
7,175
|
||||
|
The amount of total losses (gains) for the year included in earnings attributable to the change in net unrealized gains or lossesa relating to liabilities still held at the reporting date
|
$
|
150
|
$
|
(29
|
)
|
|||
|
The amount of total (gains) losses for the year included in in other comprehensive income attributable to the change in net unrealized
gains or lossesc relating to liabilities still held at the reporting date
|
$
|
(88
|
)
|
$
|
54
|
|||
|
a
|
Included in net unrealized gains (OCR-2).
|
|
b
|
Included in unrealized holdings (losses) gains from borrowings and accumulated translation adjustments (Note N).
|
|
c
|
Included in unrealized holding gains (losses) from borrowings (Note N).
|
| ($ million) |
||||||||
|
2025
|
2024
|
|||||||
|
Notional MOV Receivables
|
$
|
1,738
|
$
|
1,566
|
||||
|
Notional MOV Payables
|
(87
|
)
|
(85
|
)
|
||||
|
Total
|
$
|
1,651
|
$
|
1,481
|
||||
| Unrealized Holding (Losses) Gains |
Postretirement
|
Accumulated | ||||||||||||||||||||||||||
|
Accumulated
Translation
Adjustments
|
Investments
for liquidity
purposea
|
Equity
investments —
Operations
|
Other Debt
Securities —
Operations
|
Borrowings
|
Benefit
Asset/Liability
Adjustments
|
Other
Comprehensive
Loss
|
||||||||||||||||||||||
|
Balance, 1 January 2025
|
$
|
(161
|
)
|
$
|
(848
|
)
|
$
|
(4
|
)
|
$
|
(3
|
)
|
$
|
253
|
$
|
524
|
$
|
(239
|
)
|
|||||||||
|
Other comprehensive income (loss) before reclassifications
|
294 |
540 |
1 |
6
|
(577
|
) | (252 |
) | 12 |
|||||||||||||||||||
|
Amounts reclassified from accumulated other comprehensive income (loss)
|
– |
16
|
–
|
–
|
– |
|
(24
|
)
|
(8
|
)
|
||||||||||||||||||
|
Net current-period other comprehensive income (loss)
|
294 |
556
|
1
|
6
|
(577
|
)
|
(276
|
)
|
4
|
|||||||||||||||||||
|
Balance, 31 December 2025
|
$ |
133 |
$
|
(292
|
)
|
$
|
(3
|
)
|
$
|
3
|
$
|
(324
|
)
|
$
|
248
|
$
|
(235
|
)
|
||||||||||
|
Balance, 1 January 2024
|
$
|
58
|
$
|
(1,057
|
)
|
$
|
(16
|
)
|
$
|
(5
|
)
|
$
|
496
|
$
|
221
|
$
|
(303
|
)
|
||||||||||
|
Other comprehensive (loss) income before reclassifications
|
(219 |
) |
182 |
12
|
2
|
(243
|
) |
329 |
63 |
|||||||||||||||||||
|
Amounts reclassified from accumulated other comprehensive income (loss)
|
– |
27
|
–
|
–
|
–
|
|
(26
|
)
|
1
|
|||||||||||||||||||
|
Net current-period other comprehensive (loss) income
|
(219 |
) |
209
|
12
|
2
|
(243
|
)
|
303
|
64
|
|||||||||||||||||||
|
Balance, 31 December 2024
|
$ | (161 |
) |
$
|
(848
|
)
|
$
|
(4
|
)
|
$
|
(3
|
)
|
$
|
253
|
$
|
524
|
$
|
(239
|
)
|
|||||||||
|
a
|
Includes securities transferred under repurchase agreements.
|
|
($ million)
|
||||||||||
|
Amounts Reclassified
from Accumulated Other
Comprehensive Lossa
|
||||||||||
|
Accumulated Other Comprehensive
Loss Components
|
Affected Line Item in the Statement
of Income and Expenses
|
|||||||||
|
2025
|
||||||||||
|
2024
|
||||||||||
|
Unrealized Holding (Losses) Gains
Investments for liquidity purpose
|
$
|
(16 |
) |
$ |
(27 |
) |
NET REALIZED GAINS (LOSSES)
|
|||
|
From investments for liquidity purpose
|
||||||||||
|
Pension/Postretirement Liability
Adjustments Actuarial losses
|
24 |
26 |
Administrative expenses
|
|||||||
|
Total reclassifications for the year
|
$ |
8 |
$ |
(1 |
) |
|||||
|
a
|
Amounts in parentheses indicate debits to net income.
|
| Commitment | ||||||||||||||||
|
Interest
|
charge
|
Other, neta
|
Total
|
|||||||||||||
| 2025 | ||||||||||||||||
|
Sovereign – Regular
|
$
|
5,898
|
$
|
49
|
$
|
(20
|
)
|
$
|
5,927
|
|||||||
|
Sovereign – Concessional
|
723
|
–
|
(2
|
)
|
721
|
|||||||||||
|
Nonsovereign
|
444
|
5
|
5
|
454
|
||||||||||||
|
Total
|
$
|
7,065
|
$
|
54
|
$
|
(17
|
)
|
$
|
7,102
|
|||||||
| 2024 | ||||||||||||||||
|
Sovereign – Regular
|
$
|
6,814
|
$
|
48
|
$
|
(21
|
)
|
$
|
6,841
|
|||||||
|
Sovereign – Concessional
|
719
|
–
|
(2
|
)
|
717
|
|||||||||||
|
Nonsovereign
|
471
|
5
|
4
|
480
|
||||||||||||
|
Total
|
$
|
8,004
|
$
|
53
|
$
|
(19
|
)
|
$
|
8,038
|
|||||||
|
a
|
Includes amortized front-end fees and loan origination costs, risk participation charges, and other loan-related income and/or expenses.
|
|
($ million)
|
||||||||
| 2025 | 2024 | |||||||
| Fair value changes from: | ||||||||
|
Borrowings and related derivatives
|
$
|
106
|
$
|
485
|
||||
|
Loans related derivatives
|
139
|
(401
|
)
|
|||||
|
Investments related derivatives
|
59
|
(25
|
)
|
|||||
|
Equity investments
|
9
|
(18
|
)
|
|||||
|
Reclassification of unrealized gains on divested equity investment
|
–
|
(2
|
)
|
|||||
|
Translation adjustments in non-functional currencies
|
3
|
(3
|
)
|
|||||
|
Total
|
$
|
316
|
$
|
36
|
||||
| ($ million) |
||||||||
| 2025 |
2024
|
|||||||
|
Amounts receivable from:
|
|
|||||||
|
Asian Development Fund
|
$
|
47
|
$
|
29
|
||||
|
Other Special Funds
|
1
|
1
|
||||||
|
Trust Funds and Others—net
|
0
|
5
|
||||||
|
Employee Benefit Plans
|
10
|
3
|
||||||
|
Total
|
$
|
58
|
$
|
38
|
||||
|
($ million)
|
||||||||||||||||
|
Pension Benefits
|
Postretirement Medical Benefits
|
|||||||||||||||
|
|
2025
|
2024
|
2025
|
2024
|
||||||||||||
|
Change in plan assets:
|
||||||||||||||||
|
Fair value of plan assets at beginning of year
|
$
|
4,524
|
$
|
4,258
|
$
|
617
|
$
|
543
|
||||||||
|
Actual return on plan assets
|
478
|
340
|
101
|
74
|
||||||||||||
|
Employer’s contribution
|
97
|
88
|
9
|
8
|
||||||||||||
|
Plan participants’ contributions
|
36
|
35
|
–
|
–
|
||||||||||||
|
Benefits paid
|
(219
|
)
|
(197
|
)
|
(9
|
)
|
(8
|
)
|
||||||||
|
Fair value of plan assets at end of year
|
$
|
4,916
|
$
|
4,524
|
$
|
718
|
$
|
617
|
||||||||
|
|
||||||||||||||||
|
Change in projected benefit obligation:
|
||||||||||||||||
|
Projected benefit obligation at beginning of year
|
$
|
4,689
|
$
|
4,730
|
$
|
364
|
$
|
347
|
||||||||
|
Service cost
|
73
|
78
|
13
|
14
|
||||||||||||
|
Interest cost
|
270
|
250
|
23
|
20
|
||||||||||||
|
Plan participants’ contributions
|
36
|
35
|
–
|
–
|
||||||||||||
|
Actuarial (gains) losses
|
294
|
(207
|
)
|
222
|
(9
|
)
|
||||||||||
|
Benefits paid
|
(219
|
)
|
(197
|
)
|
(9
|
)
|
(8
|
)
|
||||||||
|
Projected benefit obligation at end of year
|
$
|
5,143
|
$
|
4,689
|
$
|
613
|
$
|
364
|
||||||||
|
Funded status
|
$
|
(227
|
)
|
$
|
(165
|
)
|
$
|
105
|
$
|
253
|
||||||
|
|
||||||||||||||||
|
Amounts recognized in the Balance sheet as:
|
||||||||||||||||
|
Accrued pension benefit costs
|
$
|
(227
|
)
|
$
|
(165
|
)
|
||||||||||
|
Net postretirement medical benefit plan asset
|
$
|
105
|
$
|
253
|
||||||||||||
|
|
||||||||||||||||
|
Amounts recognized in the Accumulated other comprehensive loss as Pension/Postretirement liability adjustments (Note N)
|
$
|
(65
|
)
|
$
|
(165
|
)
|
$
|
(183
|
)
|
$
|
(359
|
)
|
||||
|
|
||||||||||||||||
|
Weighted-average assumptions as of 31 December (%)
|
||||||||||||||||
|
Discount rate
|
5.60
|
5.80
|
6.10
|
6.10
|
||||||||||||
|
Expected return on plan assets
|
6.00
|
6.25
|
6.25
|
6.25
|
||||||||||||
|
Rate of compensation increase varies with age and averages
|
5.75
|
4.75
|
N/A
|
N/A
|
||||||||||||
|
Interest crediting rate
|
5.30
|
5.30
|
N/A
|
N/A
|
||||||||||||
|
($ million)
|
||||||||||||||||
|
Pension Benefits
|
Postretirement
Medical Benefits
|
|||||||||||||||
|
|
2025
|
2024
|
2025
|
2024
|
||||||||||||
|
Components of net periodic benefit cost:
|
||||||||||||||||
|
Service cost
|
$
|
73
|
$
|
78
|
$
|
13
|
$
|
14
|
||||||||
|
Interest cost
|
270
|
250
|
23
|
20
|
||||||||||||
|
Expected return on plan assets
|
(279
|
)
|
(267
|
)
|
(36
|
)
|
(34
|
)
|
||||||||
|
Amortization of prior service credit (Note N)
|
(5
|
)
|
(5
|
)
|
–
|
–
|
||||||||||
|
Recognized actuarial loss (gain) (Note N)
|
0
|
0
|
(19
|
)
|
(20
|
)
|
||||||||||
|
Net periodic benefit cost
|
$
|
59
|
$
|
56
|
$
|
(19
|
)
|
$
|
(20
|
)
|
||||||
|
($ million)
|
||||||||
|
Postretirement
|
||||||||
|
Year
|
Pension
Benefits
|
Medical
Benefits
|
||||||
|
2026
|
$
|
265
|
$
|
11
|
||||
|
2027
|
278
|
13
|
||||||
|
2028
|
298
|
15
|
||||||
|
2029
|
308
|
17
|
||||||
|
2030
|
328
|
19
|
||||||
|
2031–2035
|
1,853
|
131
|
||||||
|
($ million)
|
||||||||||||||||
|
Fair Value Measurements
|
||||||||||||||||
|
2025
|
Total
|
Level 1
|
Level 2
|
Level 3
|
||||||||||||
|
Staff Retirement Plan
|
||||||||||||||||
|
Cash and cash equivalents
|
$
|
32
|
$
|
–
|
$
|
32
|
$
|
–
|
||||||||
|
Common/preferred stocks
|
1,001
|
1,000
|
1
|
–
|
||||||||||||
|
Investment funds
|
944
|
465
|
479
|
–
|
||||||||||||
|
Government or government-related securities
|
1,231
|
1,041
|
190
|
–
|
||||||||||||
|
Corporate debt securities
|
1,695
|
1,678
|
17
|
–
|
||||||||||||
|
Mortgage/Asset-backed securities:
|
||||||||||||||||
|
Mortgage-backed securities
|
17
|
–
|
17
|
–
|
||||||||||||
|
Collateralized mortgage obligations
|
29
|
1
|
28
|
–
|
||||||||||||
|
Asset-backed securities
|
8
|
8
|
–
|
–
|
||||||||||||
|
Short term investments
|
12
|
–
|
12
|
–
|
||||||||||||
|
Derivatives
|
2
|
(1
|
)
|
3
|
–
|
|||||||||||
|
Other asset/liabilitiesa—net
|
(55
|
)
|
–
|
(55
|
)
|
–
|
||||||||||
|
Total fair value of SRP assets
|
$
|
4,916
|
$
|
4,192
|
$
|
724
|
$
|
–
|
||||||||
|
|
||||||||||||||||
|
Retiree Medical Plan Fund
|
||||||||||||||||
|
Cash and cash equivalents
|
$
|
9
|
$
|
–
|
$
|
9
|
$
|
–
|
||||||||
|
Common/preferred stocks
|
497
|
497
|
0
|
–
|
||||||||||||
|
Investment funds
|
76
|
76
|
–
|
–
|
||||||||||||
|
Government or government-related securities
|
46
|
46
|
0
|
–
|
||||||||||||
|
Corporate debt securities
|
76
|
71
|
5
|
–
|
||||||||||||
|
Mortgage/Asset-backed securities:
|
||||||||||||||||
|
Mortgage-backed securities
|
8
|
2
|
6
|
–
|
||||||||||||
|
Collateralized mortgage obligations
|
1
|
–
|
1
|
–
|
||||||||||||
|
Asset-backed securities
|
1
|
0
|
1
|
–
|
||||||||||||
|
Short term investments
|
3
|
–
|
3
|
–
|
||||||||||||
|
Derivatives
|
(1
|
)
|
(0
|
)
|
(1
|
)
|
–
|
|||||||||
|
Other asset/liabilitiesa—net
|
2
|
–
|
2
|
–
|
||||||||||||
|
Total fair value of RMPF assets
|
$
|
718
|
$
|
692
|
$
|
26
|
$
|
–
|
||||||||
|
($ million)
|
||||||||||||||||
|
Fair Value Measurements
|
||||||||||||||||
|
2024
|
Total |
Level 1
|
Level 2
|
Level 3
|
||||||||||||
|
Staff Retirement Plan
|
||||||||||||||||
|
Cash and cash equivalents
|
$
|
32
|
$
|
–
|
$
|
32
|
$
|
–
|
||||||||
|
Common/preferred stocks
|
1,712
|
1,712
|
0
|
–
|
||||||||||||
|
Investment funds
|
1,050
|
787
|
263
|
–
|
||||||||||||
|
Government or government-related securities
|
690
|
478
|
212
|
–
|
||||||||||||
|
Corporate debt securities
|
1,008
|
976
|
32
|
–
|
||||||||||||
|
Mortgage/Asset-backed securities:
|
||||||||||||||||
|
Mortgage-backed securities
|
18
|
6
|
12
|
–
|
||||||||||||
|
Collateralized mortgage obligations
|
12
|
2
|
10
|
–
|
||||||||||||
|
Asset-backed securities
|
15
|
15
|
–
|
–
|
||||||||||||
|
Short term investments
|
17
|
–
|
17
|
–
|
||||||||||||
|
Derivatives
|
2
|
(1
|
)
|
3
|
–
|
|||||||||||
|
Other asset/liabilitiesa—net
|
(32
|
)
|
–
|
(32
|
)
|
–
|
||||||||||
|
Total fair value of SRP assets
|
$
|
4,524
|
$
|
3,975
|
$
|
549
|
$
|
–
|
||||||||
|
Retiree Medical Plan Fund
|
||||||||||||||||
|
Cash and cash equivalents
|
$
|
9
|
$
|
–
|
$
|
9
|
$
|
–
|
||||||||
|
Common/preferred stocks
|
433
|
433
|
0
|
–
|
||||||||||||
|
Investment funds
|
58
|
58
|
–
|
– | ||||||||||||
|
Government or government-related securities
|
32 | 31 |
1
|
–
|
||||||||||||
|
Corporate debt securities
|
72
|
67
|
5
|
–
|
||||||||||||
|
Mortgage/Asset-backed securities:
|
||||||||||||||||
|
Mortgage-backed securities
|
8
|
2
|
6
|
–
|
||||||||||||
|
Collateralized mortgage obligations
|
2
|
–
|
2
|
– | ||||||||||||
|
Short term investments
|
3
|
–
|
3
|
–
|
||||||||||||
|
Derivatives
|
1
|
(0
|
)
|
1
|
–
|
|||||||||||
|
Other asset/liabilitiesa—net
|
(1
|
)
|
–
|
(1
|
)
|
–
|
||||||||||
|
Total fair value of RMPF assets
|
$
|
617
|
$
|
591
|
$
|
26
|
$
|
–
|
||||||||
|
($ million)
|
||||||||
|
Corporate debt securities
|
||||||||
|
2024
|
||||||||
|
SRP
|
RMPF
|
|||||||
|
Balance, beginning of the year
|
$
|
2
|
$
|
0
|
||||
|
Transfer out of Level 3
|
(2
|
)
|
(0
|
)
|
||||
|
Balance, end of the year
|
$
|
–
|
$
|
–
|
||||
| ($ million) | ||||||||||||||||
| 2025 | 2024 |
|||||||||||||||
| Carrying | Carrying | |||||||||||||||
|
On-balance sheet financial instruments:
|
Amount
|
Fair Value
|
Amount
|
Fair Value
|
||||||||||||
|
ASSETS:
|
||||||||||||||||
|
Due from banks
|
$
|
496
|
$
|
496
|
$
|
2,235
|
$
|
2,235
|
||||||||
|
Investments for liquidity purpose (Note D)
|
57,725
|
57,725
|
46,695
|
46,695
|
||||||||||||
|
Securities transferred under repurchase agreements (Note E)
|
872
|
872
|
–
|
–
|
||||||||||||
|
Securities purchased under resale arrangements (Note D)
|
252
|
252
|
260
|
260
|
||||||||||||
|
Loans outstanding — operations (Note F)
|
161,063
|
161,786
|
153,864
|
154,436
|
||||||||||||
|
Equity investments — operations carried at fair value (Note H)
|
563
|
563
|
373
|
373
|
||||||||||||
|
Other debt securities — operations (Note I)
|
552
|
572
|
621
|
645
|
||||||||||||
|
Derivative assets - borrowings (Note J)
|
75,750
|
75,750
|
61,872
|
61,872
|
||||||||||||
|
Derivative assets - investments for liquidity purpose (Note J)
|
29,554
|
29,554
|
26,062
|
26,062
|
||||||||||||
|
Derivative assets - loans — operations (Note J)
|
17,391
|
17,391
|
17,671
|
17,671
|
||||||||||||
|
Swap related and other collateral (Note J)
|
508
|
508
|
857
|
857
|
||||||||||||
|
Future guarantee receivable (Note G)
|
464
|
464
|
331
|
331
|
||||||||||||
|
|
||||||||||||||||
|
LIABILITIES:
|
||||||||||||||||
|
Borrowings (Note L)
|
165,951
|
166,021
|
146,517
|
146,604
|
||||||||||||
|
Derivative liabilities - borrowings (Note J)
|
78,627
|
78,627
|
71,703
|
71,703
|
||||||||||||
|
Derivative liabilities - investments for liquidity purpose (Note J)
|
27,596
|
27,596
|
23,292
|
23,292
|
||||||||||||
|
Derivative liabilities - loans — operations (Note J)
|
15,501
|
15,501
|
14,821
|
14,821
|
||||||||||||
|
Payable under securities repurchase agreements (Note E)
|
881
|
881
|
–
|
–
|
||||||||||||
|
Swap related and other collateral (Note J)
|
1,258
|
1,258
|
857
|
857
|
||||||||||||
|
Guarantee liability (Note G)
|
472
|
472
|
331
|
331
|
||||||||||||
| ($ million) | ||||||||||||||||
| 2025 | 2024 | |||||||||||||||
| Total Net | Total Net | |||||||||||||||
| Assets | No. | Assets | No. | |||||||||||||
|
Special Funds
|
||||||||||||||||
|
Asian Development Fund
|
$
|
1,684
|
1
|
$
|
1,968
|
1
|
||||||||||
|
Technical Assistance Special Fund
|
518
|
1
|
94
|
1
|
||||||||||||
|
Japan Special Fund
|
107
|
1
|
111
|
1
|
||||||||||||
|
Asian Development Bank Institute
|
20
|
1
|
22
|
1
|
||||||||||||
|
Regional Cooperation and Integration Fund
|
0
|
1
|
2
|
1
|
||||||||||||
|
Climate Change Fund
|
12
|
1
|
12
|
1
|
||||||||||||
|
Asia Pacific Disaster Response Fund
|
22
|
1
|
34
|
1
|
||||||||||||
|
Financial Sector Development Partnership Special Fund
|
2
|
1
|
1
|
1
|
||||||||||||
|
Subtotal
|
2,365
|
8
|
2,244
|
8
|
||||||||||||
|
Trust funds and project specific cofinancing
|
4,976
|
171
|
4,155
|
184
|
||||||||||||
|
Total
|
$
|
7,341
|
179
|
$
|
6,399
|
192
|
||||||||||
|
($ million)
|
||||||||||||
|
Carrying Value
of ADB’s Variable
|
Committed but
|
Maximum
Exposure to
|
||||||||||
|
Interests
|
Undisbursed
|
Loss
|
||||||||||
|
2025
|
||||||||||||
|
Loans — Operations
|
$
|
–
|
$
|
–
|
$
|
–
|
||||||
|
Equity Investments — Operations
|
857
|
707
|
1,564
|
|||||||||
|
Guarantees — Operations
|
–
|
–
|
–
|
|||||||||
|
Total
|
$
|
857
|
$
|
707
|
$
|
1,564
|
||||||
|
2024
|
||||||||||||
|
Loans — Operations
|
$
|
–
|
$
|
–
|
$
|
–
|
||||||
|
Equity Investments — Operations
|
713
|
591
|
1,304
|
|||||||||
|
Guarantees — Operations
|
–
|
–
|
–
|
|||||||||
|
Total
|
$
|
713
|
$
|
591
|
$
|
1,304
|
||||||
| ($ million) | ||||||||||||||||
| 2025 |
2024 |
|||||||||||||||
| Outstanding | Outstanding | |||||||||||||||
|
Country
|
Balance
|
Revenue
|
Balance
|
Revenue
|
||||||||||||
|
India
|
$
|
27,329
|
$
|
1,453
|
$
|
26,705
|
$
|
1,609
|
||||||||
|
Bangladesh
|
17,996
|
573
|
16,835
|
627
|
||||||||||||
|
People’s Republic of China
|
17,838
|
880
|
18,163
|
1,125
|
||||||||||||
|
Philippines
|
17,822
|
874
|
15,797
|
947
|
||||||||||||
|
Pakistan
|
17,412
|
656
|
16,028
|
693
|
||||||||||||
|
Indonesia
|
14,600
|
719
|
13,742
|
839
|
||||||||||||
|
Uzbekistan
|
9,076
|
376
|
8,237
|
375
|
||||||||||||
|
Others
|
53,595
|
1,804
|
48,983
|
1,999
|
||||||||||||
|
Total
|
$
|
175,668
|
$
|
7,335
|
$
|
164,490
|
$
|
8,214
|
||||||||
119
ASIAN DEVELOPMENT FUND
MANAGEMENT’S REPORT ON INTERNAL CONTROL OVER FINANCIAL REPORTING
The management of Asian Development Bank (“ADB”) is responsible for designing, implementing, and maintaining effective internal control over financial reporting. ADB’s internal control over financial reporting is a process designed to provide reasonable assurance regarding the preparation of reliable financial statements in accordance with generally accepted accounting principles in the United States of America.
ADB’s internal control over financial reporting includes those policies and procedures that (i) pertain to the maintenance of records that, in reasonable detail, accurately and fairly reflect the transactions and dispositions of the assets of ADB; (ii) provide reasonable assurance that transactions are recorded as necessary to permit preparation of financial statements in accordance with generally accepted accounting principles in the United States of America, and that receipts and expenditures of ADB are being made only in accordance with authorizations of management and directors of ADB; and (iii) provide reasonable assurance regarding prevention, or timely detection and correction, of unauthorized acquisition, use, or disposition of ADB’s assets that could have a material effect on the financial statements.
Because of its inherent limitations, internal control over financial reporting may not prevent, or detect and correct, misstatements. Also, projections of any assessment of effectiveness to future periods are subject to the risk that controls may become inadequate because of changes in conditions, or that the degree of compliance with the policies or procedures may deteriorate.
ADB’s management assessed the effectiveness of ADB’s internal control over financial reporting as of 31 December 2025, based on the criteria established in Internal Control – Integrated Framework (2013) issued by the Committee of Sponsoring Organizations of the Treadway Commission. Based on that assessment, management concluded that ADB’s internal control over financial reporting is effective as of 31 December 2025.

Masato Kanda
President

Roberta Casali
Vice-President (Finance and Risk Management)

Helen Hall
Controller
9 March 2026
120
 |
Deloitte & Touche LLP Unique Entity No. T08LL0721A 6 Shenton Way OUE Downtown 2 #33-00 Singapore 068809
Tel: +65 6224 8288 Fax: +65 6538 6166 www.deloitte.com/sg |
INDEPENDENT AUDITOR’S REPORT
To the Board of Directors and the Board of Governors of
Asian Development Bank
Opinion on Internal Control Over Financial Reporting
We have audited the internal control over financial reporting of Asian Development Bank (“ADB”) as of 31 December 2025, based on the criteria established in Internal Control — Integrated Framework (2013) issued by the Committee of Sponsoring Organizations of the Treadway Commission (COSO). In our opinion, ADB maintained, in all material respects, effective internal control over financial reporting as of 31 December 2025, based on the criteria established in Internal Control — Integrated Framework (2013) issued by COSO.
We also have audited, in accordance with auditing standards generally accepted in the United States of America (GAAS), the financial statements as of and for the years ended 31 December 2025 and 2024 of ADB – Asian Development Fund, and our report dated 9 March 2026 expressed an unmodified opinion on those financial statements.
Basis for Opinion
We conducted our audit in accordance with GAAS. Our responsibilities under those standards are further described in the Auditor’s Responsibilities for the Audit of Internal Control over Financial Reporting section of our report. We are required to be independent of ADB and to meet our other ethical responsibilities, in accordance with the relevant ethical requirements relating to our audit. We believe that the audit evidence we have obtained is sufficient and appropriate to provide basis for our audit opinion.
Responsibilities of Management for Internal Control over Financial Reporting
Management is responsible for designing, implementing, and maintaining effective internal control over financial reporting, and for its assessment about the effectiveness of internal control over financial reporting, included in the accompanying Management’s Report on Internal Control over Financial Reporting.
Deloitte & Touche LLP (Unique Entity No. T08LL0721A) is an accounting limited liability partnership registered in Singapore under the Limited Liability Partnerships Act (Chapter 163A).
121
|
Auditor’s Responsibilities for the Audit of Internal Control over Financial Reporting
Our objectives are to obtain reasonable assurance about whether effective internal control over financial reporting was maintained in all material respects and to issue an auditor’s report that includes our opinion on internal control over financial reporting. Reasonable assurance is a high level of assurance but is not absolute assurance and therefore is not a guarantee that an audit of internal control over financial reporting conducted in accordance with GAAS will always detect a material weakness when it exists.
In performing an audit of internal control over financial reporting in accordance with GAAS, we:
| ● | Exercise professional judgment and maintain professional skepticism throughout the audit. |
| ● | Obtain an understanding of internal control over financial reporting, assess the risks that a material weakness exists, and test and evaluate the design and operating effectiveness of internal control over financial reporting based on the assessed risk. |
Definition and Inherent Limitations of Internal Control over Financial Reporting
ADB’s internal control over financial reporting is a process effected by management and directors of ADB, designed to provide reasonable assurance regarding the preparation of reliable financial statements in accordance with accounting principles generally accepted in the United States of America. ADB’s internal control over financial reporting includes those policies and procedures that (1) pertain to the maintenance of records that, in reasonable detail, accurately and fairly reflect the transactions and dispositions of the assets of ADB; (2) provide reasonable assurance that transactions are recorded as necessary to permit preparation of financial statements in accordance with accounting principles generally accepted in the United States of America, and that receipts and expenditures of ADB are being made only in accordance with authorizations of management and directors of ADB; and (3) provide reasonable assurance regarding prevention, or timely detection and correction of unauthorized acquisition, use, or disposition of ADB’s assets that could have a material effect on the financial statements.
Because of its inherent limitations, internal control over financial reporting may not prevent, or detect and correct, misstatements. Also, projections of any assessment of effectiveness to future periods are subject to the risk that the controls may become inadequate because of changes in conditions, or that the degree of compliance with the policies or procedures may deteriorate.

Public Accountants and
Chartered Accountants
Singapore
9 March 2026
122
|
Deloitte & Touche LLP Unique Entity No. T08LL0721A 6 Shenton Way OUE Downtown 2 #33-00 Singapore 068809
Tel: +65 6224 8288 Fax: +65 6538 6166 www.deloitte.com/sg |
INDEPENDENT AUDITOR’S REPORT
To the Board of Directors and the Board of Governors of
Asian Development Bank
Opinion
We have audited the financial statements of Asian Development Bank (“ADB”) – Asian Development Fund, which comprise the balance sheets as of 31 December 2025 and 2024, and the related statements of income and expenses, comprehensive loss, changes in fund balances, and cash flows for the years then ended, and the related notes to the financial statements.
In our opinion, the accompanying financial statements present fairly, in all material respects, the financial position of ADB - Asian Development Fund as of 31 December 2025 and 2024, and the results of its operations and its cash flows for the years then ended in accordance with accounting principles generally accepted in the United States of America.
We have also audited, in accordance with auditing standards generally accepted in the United States of America (GAAS), ADB’s internal control over financial reporting as of 31 December 2025, based on the criteria established in Internal Control — Integrated Framework (2013) issued by the Committee of Sponsoring Organizations of the Treadway Commission and our report dated 9 March 2026 expressed an unmodified opinion on ADB’s internal control over financial reporting.
Basis for Opinion
We conducted our audits in accordance with GAAS. Our responsibilities under those standards are further described in the Auditor’s Responsibilities for the Audit of the Financial Statements section of our report. We are required to be independent of ADB – Asian Development Fund and to meet our other ethical responsibilities, in accordance with the relevant ethical requirements relating to our audits. We believe that the audit evidence we have obtained is sufficient and appropriate to provide a basis for our audit opinion.
Responsibilities of Management for the Financial Statements
Management is responsible for the preparation and fair presentation of these financial statements in accordance with accounting principles generally accepted in the United States of America, and for the design, implementation, and maintenance of internal control relevant to the preparation and fair presentation of financial statements that are free from material misstatement, whether due to fraud or error.
In preparing the financial statements, management is required to evaluate whether there are conditions or events, considered in the aggregate, that raise substantial doubt about ADB – Asian Development Fund’s ability to continue as a going concern for one year after the date that the financial statements are available to be issued.
Deloitte & Touche LLP (Unique Entity No. T08LL0721A) is an accounting limited liability partnership registered in Singapore under the Limited Liability Partnerships Act (Chapter 163A).
123
Auditor’s Responsibility for the Audit of the Financial Statements
Our objectives are to obtain reasonable assurance about whether the financial statements as a whole are free from material misstatement, whether due to fraud or error, and to issue an auditor’s report that includes our opinion. Reasonable assurance is a high level of assurance but is not absolute assurance and therefore is not a guarantee that an audit conducted in accordance with GAAS will always detect a material misstatement when it exists. The risk of not detecting a material misstatement resulting from fraud is higher than for one resulting from error, as fraud may involve collusion, forgery, intentional omissions, misrepresentations, or the override of internal control. Misstatements are considered material if there is a substantial likelihood that, individually or in the aggregate, they would influence the judgment made by a reasonable user based on the financial statements.
In performing an audit in accordance with GAAS, we:
| ● | Exercise professional judgment and maintain professional skepticism throughout the audit. |
| ● | Identify and assess the risks of material misstatement of the financial statements, whether due to fraud or error, and design and perform audit procedures responsive to those risks. Such procedures include examining, on a test basis, evidence regarding the amounts and disclosures in the financial statements. |
| ● | Obtain an understanding of internal control relevant to the audit in order to design audit procedures that are appropriate in the circumstances. |
| ● | Evaluate the appropriateness of accounting policies used and the reasonableness of significant accounting estimates made by management, as well as evaluate the overall presentation of the financial statements. |
| ● | Conclude whether, in our judgment, there are conditions or events, considered in the aggregate, that raise substantial doubt about ADB – Asian Development Fund’s ability to continue as a going concern for a reasonable period of time. |
We are required to communicate with those charged with governance regarding, among other matters, the planned scope and timing of the audit, significant audit findings, and certain internal control–related matters that we identified during the audit.
Report on Supplemental Schedules
Our audits were conducted for the purpose of forming an opinion on the financial statements as a whole. The supplemental schedule, which comprises the statement of resources as of 31 December 2025 is presented for the purpose of additional analysis and is not a required part of the financial statements. This schedule is the responsibility of ADB’s management and was derived from and relate directly to the underlying accounting and other records used to prepare the financial statements. Such schedule has been subjected to the auditing procedures applied in our audits of the financial statements and certain additional procedures, including comparing and reconciling such schedule directly to the underlying accounting and other records used to prepare the financial statements or to the financial statements themselves, and other additional procedures in accordance with GAAS. In our opinion, such schedule is fairly stated in all material respects in relation to the financial statements as a whole.
124
Other Information Included in the Annual Report
Management is responsible for the other information included in the annual report. The other information comprises the information included in the annual report but does not include the financial statements and our auditor’s report thereon. Our opinion on the financial statements does not cover the other information, and we do not express an opinion or any form of assurance thereon.
In connection with our audits of the financial statements, our responsibility is to read the other information and consider whether a material inconsistency exists between the other information and the financial statements, or the other information otherwise appears to be materially misstated. If, based on the work performed, we conclude that an uncorrected material misstatement of the other information exists, we are required to describe it in our report.
Public Accountants and
Chartered Accountants
Singapore
9 March 2026
125
ADF-1
ASIAN DEVELOPMENT BANK—ASIAN DEVELOPMENT FUND
BALANCE SHEET
31 December 2025 and 2024
Expressed in Millions of US Dollars
| 2025 | 2024 | |||||||||||||||
| ASSETS | ||||||||||||||||
| DUE FROM BANKS | $ | 2 | $ | 16 | ||||||||||||
| INVESTMENTS FOR LIQUIDITY | ||||||||||||||||
| PURPOSE (Notes C and J) | ||||||||||||||||
| Government or government-related obligations | $ | 3,872 | $ | 3,641 | ||||||||||||
| Time deposits | 374 | 289 | ||||||||||||||
| Corporate obligations | 723 | 4,969 | 707 | 4,637 | ||||||||||||
| SECURITIES PURCHASED UNDER RESALE ARRANGEMENTS | 18 | 24 | ||||||||||||||
| ACCRUED REVENUE | 39 | 29 | ||||||||||||||
| ADVANCES FOR GRANTS (Note I) | 562 | 385 | ||||||||||||||
| OTHER ASSETS (Note F) | 80 | 53 | ||||||||||||||
| TOTAL | $ | 5,670 | $ | 5,144 | ||||||||||||
| LIABILITIES AND FUND BALANCES | ||||||||||||||||
| ACCOUNTS PAYABLE AND OTHER LIABILITIES | ||||||||||||||||
| Payable to related funds and other liabilities (Note E) | $ | 57 | $ | 29 | ||||||||||||
| Advance payments on contributions (Note F) | 142 | 103 | ||||||||||||||
| Undisbursed grants (Notes I and J) | 3,787 | 3,044 | ||||||||||||||
| Total Liabilities | 3,986 | 3,176 | ||||||||||||||
| FUND BALANCES (ADF-4) | ||||||||||||||||
| Contributions received | ||||||||||||||||
| Contributed resources (Note F) | $ | 37,279 | $ | 36,694 | ||||||||||||
| Unamortized discount | (113 | ) | 37,166 | (37 | ) | 36,657 | ||||||||||
| Transfers from Ordinary Capital Resources and Technical Assistance Special Fund | 4,304 | 3,910 | ||||||||||||||
| 41,470 | 40,567 | |||||||||||||||
| Nonnegotiable, noninterest-bearing demand obligations on account of contributions | (369 | ) | (419 | ) | ||||||||||||
| Accumulated deficit | ||||||||||||||||
| From assets transfer to OCR (Note A) | (31,029 | ) | (31,029 | ) | ||||||||||||
| From others | (6,858 | ) | (37,887 | ) | (5,497 | ) | (36,526 | ) | ||||||||
| Accumulated other comprehensive loss (Note G) | (1,530 | ) | (1,654 | ) | ||||||||||||
| Total Fund Balance | 1,684 | 1,968 | ||||||||||||||
| TOTAL | $ | 5,670 | $ | 5,144 | ||||||||||||
The accompanying Notes are an integral part of these financial statements (ADF-7).
126
ADF-2
ASIAN DEVELOPMENT BANK—ASIAN DEVELOPMENT FUND
STATEMENT OF INCOME AND EXPENSES
For the Years Ended 31 December 2025 and 2024
Expressed in Millions of US Dollars
| 2025 | 2024 | |||||||
| REVENUE | ||||||||
| From investments for liquidity purpose—net (Note C) | $ | 162 | $ | 138 | ||||
| From other sources | 2 | 0 | ||||||
| TOTAL REVENUE | 164 | 138 | ||||||
| EXPENSES | ||||||||
| Grants (Note I) | (1,419 | ) | (833 | ) | ||||
| Administrative expenses (Notes E and H) | (98 | ) | (91 | ) | ||||
| Amortization of discounts on contributions | (7 | ) | (5 | ) | ||||
| Other expenses | 0 | 0 | ||||||
| TOTAL EXPENSES | (1,524 | ) | (929 | ) | ||||
| NET UNREALIZED LOSSES | (1 | ) | (1 | ) | ||||
| NET LOSS | $ | (1,361 | ) | $ | (792 | ) | ||
| Note: 0 = less than $0.5 million. | ||||||||
| The accompanying Notes are an integral part of these financial statements (ADF-7). | ||||||||
127
ADF-3
ASIAN DEVELOPMENT BANK—ASIAN DEVELOPMENT FUND
STATEMENT OF COMPREHENSIVE INCOME (LOSS)
For the Years Ended 31 December 2025 and 2024
Expressed in Millions of US Dollars
| 2025 | 2024 | |||||||
| NET LOSS (ADF-2) | $ | (1,361 | ) | $ | (792 | ) | ||
| Other comprehensive income (Note G) | ||||||||
| Unrealized investment holding gains on investments for liquidity purpose | 124 | 31 | ||||||
| COMPREHENSIVE LOSS | $ | (1,237 | ) | $ | (761 | ) | ||
| The accompanying Notes are an integral part of these financial statements (ADF-7). | ||||||||
ADF-4
STATEMENT OF CHANGES IN FUND BALANCES
For the Years Ended 31 December 2025 and 2024
Expressed in Millions of US Dollars
| 2025 | 2024 | |||||||
| Balance, 1 January | $ | 1,968 | $ | 1,947 | ||||
| Comprehensive loss (ADF-3, Note G) | (1,237 | ) | (761 | ) | ||||
| Contributions made available for operational commitment | 585 | 408 | ||||||
| Net amortization of discount on donor’s contribution | (76 | ) | 5 | |||||
| Demand obligations received | (356 | ) | (295 | ) | ||||
| Encashment of demand obligations | 406 | 371 | ||||||
| Transfers from ordinary capital resources | 394 | 293 | ||||||
| Balance, 31 December | $ | 1,684 | $ | 1,968 | ||||
| The accompanying Notes are an integral part of these financial statements (ADF-7). | ||||||||
128
ADF-5
ASIAN DEVELOPMENT BANK—ASIAN DEVELOPMENT FUND
STATEMENT OF CASH FLOWS
For the Years Ended 31 December 2025 and 2024
Expressed in Millions of US Dollars
| 2025 | 2024 | |||||||
| CASH FLOWS FROM OPERATING ACTIVITIES | ||||||||
| Interest received from investments for liquidity purpose | $ | 144 | $ | 127 | ||||
| Interest received from securities purchased under resale arrangement | 1 | 1 | ||||||
| Administrative expenses paid | (72 | ) | (88 | ) | ||||
| Grants disbursed | (852 | ) | (659 | ) | ||||
| Others—net | (8 | ) | 0 | |||||
| Net Cash Used in Operating Activities | (787 | ) | (619 | ) | ||||
| CASH FLOWS FROM INVESTING ACTIVITIES | ||||||||
| Maturities of investments for liquidity purpose | 27,360 | 24,838 | ||||||
| Purchases of investments for liquidity purpose | (27,561 | ) | (24,990 | ) | ||||
| Receipts from securities purchased under resale arrangements | 5,625 | 6,299 | ||||||
| Payments for securities purchased under resale arrangements | (5,619 | ) | (6,297 | ) | ||||
| Net Cash Used in Investing Activities | (195 | ) | (150 | ) | ||||
| CASH FLOWS FROM FINANCING ACTIVITIES | ||||||||
| Contributions received and encashed | 574 | 491 | ||||||
| Cash received from ordinary capital resources | 394 | 293 | ||||||
| Cash Provided by Financing Activities | 968 | 784 | ||||||
| Effect of Exchange Rate Changes on Due from Banks | (0 | ) | (1 | ) | ||||
| Net (Decrease) Increase in Due from Banks | (14 | ) | 14 | |||||
| Due from Banks at Beginning of Year | 16 | 2 | ||||||
| Due from Banks at End of Year | $ | 2 | $ | 16 | ||||
| RECONCILIATION OF NET LOSS TO NET CASH USED IN OPERATING ACTIVITIES: | ||||||||
| Net Loss (ADF-2) | $ | (1,361 | ) | $ | (792 | ) | ||
| Adjustments to reconcile net loss to to net cash used in operating activities: | ||||||||
| Amortization of discounts/premiums on investments for liquidity purpose | (7 | ) | (6 | ) | ||||
| Amortization of discount on donor’s contribution | 7 | 5 | ||||||
| Grants that became effective | 1,419 | 833 | ||||||
| Change in accrued revenue on investments for liquidity purpose | (10 | ) | (3 | ) | ||||
| Change in other assets | (178 | ) | 13 | |||||
| Change in undisbursed grants | (676 | ) | (672 | ) | ||||
| Others | 19 | 3 | ||||||
| Net Cash Used in Operating Activities | $ | (787 | ) | $ | (619 | ) | ||
Note: 0 = less than $0.5 million.
The accompanying Notes are an integral part of these financial statements (ADF-7).
129
ADF-6
ASIAN DEVELOPMENT BANK—ASIAN DEVELOPMENT FUND
STATEMENT OF RESOURCES
31 December 2025
Expressed in Millions of US Dollars
|
Effective Amounts Committed1 |
Contributions Received |
|||||||
| CONTRIBUTED RESOURCES | ||||||||
| Armenia | $ | 1 | $ | 0 | ||||
| Australia | 3,148 | 2,629 | ||||||
| Austria | 310 | 299 | ||||||
| Azerbaijan | 3 | 2 | ||||||
| Belgium | 244 | 223 | ||||||
| Brunei Darussalam | 21 | 21 | ||||||
| Canada | 2,183 | 2,156 | ||||||
| China, People’s Republic of | 384 | 305 | ||||||
| Denmark | 276 | 320 | ||||||
| Finland | 213 | 172 | ||||||
| France | 1,481 | 1,318 | ||||||
| Georgia | 2 | 0 | ||||||
| Germany | 2,070 | 1,929 | ||||||
| Hong Kong, China | 150 | 139 | ||||||
| India | 153 | 110 | ||||||
| Indonesia | 45 | 36 | ||||||
| Ireland | 132 | 103 | ||||||
| Israel | 7 | 2 | ||||||
| Italy | 1,263 | 948 | ||||||
| Japan | 14,540 | 16,604 | ||||||
| Kazakhstan | 8 | 8 | ||||||
| Korea, Republic of | 779 | 662 | ||||||
| Luxembourg | 70 | 61 | ||||||
| Malaysia | 36 | 32 | ||||||
| Nauru | 0 | 0 | ||||||
| Netherlands | 801 | 759 | ||||||
| New Zealand | 200 | 188 | ||||||
| Norway | 347 | 297 | ||||||
| Philippines | 5 | 3 | ||||||
| Portugal | 92 | 89 | ||||||
| Singapore | 32 | 30 | ||||||
| Spain | 506 | 440 | ||||||
| Sweden | 527 | 435 | ||||||
| Switzerland | 434 | 593 | ||||||
| Taipei,China | 133 | 124 | ||||||
| Thailand | 23 | 22 | ||||||
| Türkiye | 127 | 119 | ||||||
| United Kingdom | 1,929 | 1,383 | ||||||
| United States | 4,813 | 4,604 | ||||||
| Total | 37,489 | 37,166 | ||||||
| TRANSFERS FROM ORDINARY CAPITAL RESOURCES | 4,301 | |||||||
| TRANSFERS FROM TECHNICAL ASSISTANCE SPECIAL FUND | 3 | |||||||
| TOTAL | $ | 37,489 | $ | 41,470 | ||||
| Notes: Numbers may not sum precisely because of rounding. 0 = less than $0.5 million. | ||||||||
| 1 Valued at exchange rates per respective Board of Governors’ Resolutions. | ||||||||
| The accompanying Notes are an integral part of these financial statements (ADF-7). | ||||||||
130
ADF-7
ASIAN DEVELOPMENT BANK—ASIAN DEVELOPMENT FUND
NOTES TO FINANCIAL STATEMENTS
31 December 2025 and 2024
NOTE A—NATURE OF OPERATIONS
The Asian Development Bank (ADB), a multilateral development bank, was established in 1966 with its headquarters in Manila, Philippines. ADB and its operations are governed by the Agreement Establishing the Asian Development Bank (the Charter). Its purpose is to foster economic development and co-operation in Asia and the Pacific region and to contribute to the acceleration of the process of economic development of the developing member countries (DMCs) in the region, collectively and individually. Since 1999, ADB’s corporate vision and mission has been to help DMCs reduce poverty in the region. This was reaffirmed under the long-term corporate strategy to 2030—Strategy 2030. Under Strategy 2030, ADB’s vision is to achieve a prosperous, inclusive, resilient, and sustainable Asia and the Pacific, while sustaining its efforts to eradicate extreme poverty. ADB will continue to prioritize the region’s poorest and most vulnerable countries. ADB provides financial and technical assistance for projects and programs, which will contribute to achieve this purpose. These are financed through ordinary capital resources (OCR) and Special Funds.1
The Asian Development Fund (ADF) was established in 1974 to more effectively carry out the special operations of the ADB by providing resources on concessional terms for economic and social development of the less developed member countries.
ADB is immune from taxation pursuant to Chapter VIII, Article 56, Exemption from Taxation, of the Charter.
Termination of Lending Operations and Transfer of ADF Loans and Other Assets to OCR
The lending operations of the ADF were terminated on 1 January 2017, pursuant to Board of Governors’ Resolution No. 372, and ADF became a grant-only operation. Accordingly, the ADF loans and certain assets totaling $30,812 million were transferred to OCR.
The transferred ADF assets comprised loans including accrued interest totaling $27,088 million and liquid assets totaling $3,724 million. Except for the $64 million return of set-aside resources, the rest of the transferred assets was treated as a contribution from ADF to OCR and recognized as a one-time income of $30,748 million in OCR, which has been allocated to ordinary reserves effective 1 January 2017, following the adoption of the Board of Governors’ Resolution No. 387 dated 15 March 2017. The contribution part amounting to $30,748 million and the fair value adjustment on the loans amounting to $281 million were recognized as one-time loss of $31,029 million in ADF.
The proportionate share of ADF donors in the transferred assets as of 1 January 2017, taking into account the value of paid-in donor contributions that have been made available for operational commitments which are deemed by ADB to be applied for the transferred assets, was determined in accordance with Article V of the Regulations of the Asian Development Fund. Under Board of Governors’ Resolution No. 372, the proportionate share of an ADF donor will be taken into account in the event of the withdrawal of that donor from ADB and ADB’s repurchase of its shares, and in the theoretical termination of ADB operations and liquidation of its assets. The value of each donor’s paid-in contributions was fixed in US dollars based on the special drawing right value of each donor contribution as of 1 January 2017. This was then used to determine the sources of funds in the transferred assets as summarized in the following table:
| 1 | Special Funds refer to the Asian Development Fund (ADF), the Technical Assistance Special Fund (TASF), the Japan Special Fund (JSF), the Asian Development Bank Institute (ADBI), the Regional Cooperation and Integration Fund (RCIF), the Climate Change Fund (CCF), the Asia Pacific Disaster Response Fund (APDRF), and the Financial Sector Development Partnership Special Fund (FSDPSF). |
131
ADF-7
continued
| Source of Funds in ADF | $ million | % | Source of Funds in ADF | $ million | % | |||||||||||||
| Donor Contributions | ||||||||||||||||||
| Australia | $ | 2,213 | 7.18 | Malaysia | 24 | 0.08 | ||||||||||||
| Austria | 257 | 0.83 | Nauru | 0 | 0.00 | |||||||||||||
| Belgium | 231 | 0.75 | Netherlands | 716 | 2.32 | |||||||||||||
| Brunei Darussalam | 17 | 0.06 | New Zealand | 157 | 0.51 | |||||||||||||
| Canada | 1,889 | 6.13 | Norway | 266 | 0.86 | |||||||||||||
| China, People’s Republic of | 84 | 0.27 | Portugal | 79 | 0.26 | |||||||||||||
| Denmark | 242 | 0.79 | Singapore | 18 | 0.06 | |||||||||||||
| Finland | 180 | 0.58 | Spain | 432 | 1.40 | |||||||||||||
| France | 1,270 | 4.12 | Sweden | 436 | 1.42 | |||||||||||||
| Germany | 1,679 | 5.45 | Switzerland | 359 | 1.17 | |||||||||||||
| Hong Kong, China | 93 | 0.30 | Taipei,China | 90 | 0.29 | |||||||||||||
| India | 24 | 0.08 | Thailand | 15 | 0.05 | |||||||||||||
| Indonesia | 14 | 0.05 | Türkiye | 114 | 0.37 | |||||||||||||
| Ireland | 79 | 0.26 | United Kingdom | 1,440 | 4.67 | |||||||||||||
| Italy | 1,099 | 3.57 | United States | 4,060 | 13.18 | |||||||||||||
| Japan | 11,197 | 36.34 | Subtotal | 29,309 | 95.13 | |||||||||||||
| Kazakhstan | 4 | 0.01 | OCR Net Income Transfers | 1,439 | 4.67 | |||||||||||||
| Korea, Republic of | 484 | 1.57 | Set-Aside Resources | 64 | 0.20 | |||||||||||||
| Luxembourg | 47 | 0.15 | Total | $ | 30,812 | 100.00 | ||||||||||||
0 = about $0.3 million, 0.00 = 0.001%.
Replenishments
In September 2024, the Board of Governors adopted a resolution providing for the 13th replenishment of the Asian Development Fund (ADF 14) and the eighth regularized replenishment of the Technical Assistance Special Fund (TASF).2 The replenishment which became effective on 23 April 2025 provides resources to finance the ADF grant program and the TASF operations from 2025-2028. As of 31 December 2025, ADB received instruments of contributions from 33 donors totaling $2,395 million, which represent 93.1% of the total ADF and TASF donor contribution commitment amounting to $2,573 million. Donors agreed to allocate $560 million to TASF out of the total replenishment.3
NOTE B—SUMMARY OF SIGNIFICANT ACCOUNTING POLICIES
Presentation of the Financial Statements
The financial statements of ADF are prepared in accordance with the accounting principles generally accepted in the United States of America (US GAAP).
Functional and Reporting Currency
The US dollar is the functional and reporting currency, representing the currency of the primary economic operating environment of the ADF.
Translation of Currencies
ADB adopts the use of daily exchange rates for accounting and financial reporting purposes. This allows transactions in currencies other than US dollars to be translated to the reporting currency using exchange rates applicable at the time of the transactions. Assets and liabilities are translated using the applicable exchange rates at the end of each reporting period. Translation adjustments relating to revaluation of assets and liabilities are reported as NET UNREALIZED LOSSES in the Statement of Income and Expenses.
| 2 | ADB. 2024. Board of Governors’ Resolution No. 427: Thirteenth Replenishment of the Asian Development Fund and Eighth Regularized Replenishment of the Technical Assistance Special Fund. Manila. |
| 3 | US dollar equivalent based on exchange rates in Board of Governors’ Resolution No. 427. |
132
ADF-7
continued
Investments for Liquidity Purpose
Investment securities and time deposits are classified as available for sale and are reported at fair value (FV). Unrealized gains and losses are reported in FUND BALANCES as part of Accumulated other comprehensive loss. Realized gains and losses are measured by the difference between amortized cost and the net proceeds of sales.
Interest income on investment securities and time deposits is recognized as earned, and reported net of amortizations of premiums and discounts.
Securities Purchased Under Resale Arrangements
ADF accounts for transfers of financial assets in accordance with Financial Accounting Standards Board (FASB) Accounting Standards Codification (ASC) 860, “Transfers and Servicing.” Transfers are accounted for as sales when control over the transferred assets has been relinquished. Otherwise the transfers are accounted for as resale agreements and collateralized financing arrangements. Under resale arrangements, securities purchased are recorded as assets and are not re-pledged.
Contributions and Contributed Resources
Upon effectivity of replenishment, contributions committed are recorded as Contributed Resources when the Instruments of Contribution are acknowledged and are made available for operational commitment. Contributions are generally paid in the currency of the contributor either in cash or promissory notes, based on agreed payment and encashment schedules.
Donors have the option to pay their contributions under the accelerated note encashment (ANE) program and receive a discount. ADF invests the cash generated from this program and the investment income is used to finance operations. The related contributions are recorded at the full undiscounted amount, and the discount is amortized over the standard encashment period of 10 years for ADF IX and ADF 12, 9 years for ADF X and ADF XI, and 11 years for ADF 13 and ADF 14.
Advanced Payments on Contributions
Payments received in advance or as qualified contributions that are not made available for operational commitment are recorded as advance payments on contributions and included under ACCOUNTS PAYABLE AND OTHER LIABILITIES.
Allowance for Credit Losses
When an available-for-sale (AFS) debt security’s fair value is lower than amortized cost, ADB recognizes impairment losses in earnings if ADB has the intent to sell the debt securities or if it is more likely than not that ADB will be required to sell the debt securities before recovery of the amortized cost. When ADB intends to hold or is not required to sell the debt securities, ADB will evaluate to determine if a credit loss exists. A portion of the decline in fair value below amortized cost basis due to credit-related factors will be recognized as an allowance for credit losses with a related charge to provision for credit losses. For certain financial assets, such as Due from Banks and Securities Purchased under Resale Arrangements, no expected loss is determined based on the credit quality.
A liability is recorded for off-balance sheet credit exposures for financial guarantees over the contractual period. ADB estimates the expected credit losses based on relevant information about past events, current conditions, and reasonable and supportable forecasts. The expected credit losses are measured as the product of exposure at default (EAD), probability of default (PD), and loss given default (LGD).
133
ADF-7
continued
Grants and Undisbursed Grants
Grants are recognized as expense in the financial statements when they become effective. Upon completion of a project or cancellation of a grant, the corresponding undisbursed grant, if any, is reversed into Grants expenses.
Advances are provided from grants to the executing agency or co-operating institution, for the purpose of making payments for eligible expenses. The advances are subject to liquidation and charged against undisbursed commitments. Any unutilized portion is required to be returned to the fund. These are reported in ADVANCES FOR GRANTS.
Fair Value of Financial Instruments
ASC 820, “Fair Value Measurement” defines FV as the price that would be received to sell an asset or paid to transfer a liability at measurement date in an orderly transaction among willing participants with an assumption that the transaction takes place in the entity’s principal market, or in the absence of principal market, in the most advantageous market for the asset or liability. The most advantageous market is the market where the sale of the asset or transfer of liability would maximize the amount received for the asset or minimize the amount paid to transfer the liability. The FV measurement is not adjusted for transaction cost.
Fair Value Hierarchy
ASC 820 establishes a FV hierarchy that gives the highest priority to quoted prices in active markets for identical assets or liabilities (Level 1), next priority to observable market inputs or market corroborated data (Level 2), and the lowest priority to unobservable inputs without market corroborated data (Level 3).
The FVs of ADB’s financial assets and liabilities are categorized as follows:
Level 1: FVs are based on unadjusted quoted prices for identical assets or liabilities in active markets.
Level 2: FVs are based on quoted prices for similar assets or liabilities in active markets or markets that are not active; or valuation models for which significant inputs are obtained from market-based data that are observable.
Level 3: FVs are based on prices or valuation models for which significant inputs to the model are unobservable.
Accounting Estimates
The preparation of financial statements in accordance with US GAAP requires Management to make reasonable estimates and assumptions that affect the reported amounts of assets and liabilities as of the end of the year and the reported amounts of revenue and expenses during the year. The actual results could differ from those estimates. Judgements have been used in the valuation of certain financial instruments.
Statement of Cash Flows
For the purposes of the Statement of Cash Flows, ADF considers that its cash and cash equivalents are limited to DUE FROM BANKS, which consists of cash on hand and current accounts in banks used for (i) operational disbursements, (ii) receipt of funds from encashment of contributors’ promissory notes, and (iii) clearing accounts.
134
ADF-7
continued
Accounting and Reporting Developments
In December 2025, the Financial Accounting Standards Board (FASB) issued Accounting Standard Update (ASU) 2025-11, “Interim Reporting (Topic 270): Narrow-Scope Improvements”—aimed at enhancing the structure and clarity of interim reporting guidance. The amendments reorganize existing disclosure requirements, define what constitutes interim financial statements and notes under GAAP (including SEC considerations where relevant), and introduce a new disclosure principle requiring entities to report material events occurring after the preceding annual reporting period. While the Update improves consistency and usability, it does not expand or reduce current disclosure requirements. The amendments are effective for public business entities for interim periods within annual reporting periods beginning after 15 December 2027, and one year later for all other entities, with early adoption permitted. Entities may apply the amendments prospectively or retrospectively. This Update is not expected to have a significant impact on ADF’s interim financial statements.
Additionally, the FASB issued ASU 2025-12, “Codification Improvements”, introducing clarifications, corrections, and other minor amendments across a wide range of Topics. These updates are designed to make the Codification easier to navigate and apply, particularly in areas where the original language may have caused confusion. The amendments take effect for all entities for annual reporting periods beginning after 15 December 2026, including the related interim periods. This Update is not expected to have a significant impact on ADF’s financial statements.
NOTE C—INVESTMENTS FOR LIQUIDITY PURPOSE
The main investment management objective is to maintain security and liquidity of funds invested. Subject to these parameters, ADB seeks the highest possible return on its investments. Investments are governed by the Investment Authority approved by the Board of Directors.
ADB records time deposits on the settlement dates and all other investment securities on the trade date.
The currency of the investment for liquidity purpose portfolio as of 31 December 2025 and 2024 is US dollar currency only.
The FV and amortized cost of investments for liquidity purpose as of 31 December 2025 and 2024 are as follows:
| ($ million) | ||||||||||||||||
| 2025 | 2024 | |||||||||||||||
|
Fair Value |
Amortized Cost |
Fair Value |
Amortized Cost |
|||||||||||||
| Due in one year or less | $ | 1,271 | $ | 1,277 | $ | 1,455 | $ | 1,469 | ||||||||
| Due after one year through five years | 2,333 | 2,356 | 2,490 | 2,586 | ||||||||||||
| Due after five years through ten years | 1,322 | 1,325 | 686 | 731 | ||||||||||||
| Due after ten years through fifteen years | 43 | 42 | 6 | 6 | ||||||||||||
| Total | $ | 4,969 | $ | 5,000 | $ | 4,637 | $ | 4,792 | ||||||||
135
ADF-7
continued
Additional information relating to investments in government or government-related obligations and corporate obligations classified as available for sale are as follows:
| ($ million) | ||||||||
| 2025 | 2024 | |||||||
| As of 31 December: | ||||||||
| Amortized cost | $ | 4,626 | $ | 4,503 | ||||
| Fair value | 4,595 | 4,348 | ||||||
| Gross unrealized gains | 29 | 4 | ||||||
| Gross unrealized losses | (60 | ) | (159 | ) | ||||
| For the years ended 31 December: | ||||||||
| Change in net unrealized gains and losses from prior year | 124 | 31 | ||||||
The rate of return on the average investments for liquidity purpose held during the year ended 31 December 2025, including securities purchased under resale arrangements, was 3.2% (3.0% – 2024) excluding unrealized gains and losses on investment securities, and 5.7% (3.6% – 2024) including unrealized gains and losses on investment securities.
The table below provides a listing of investments that sustained unrealized losses as of 31 December 2025 and 2024. There were 116 government or government-related obligations (159 – 2024) and 6 corporate obligations (10 – 2024) that have been in continuous losses for over one year.
| ($ million) | ||||||||||||||||||||||||
| One year or less | Over one year | Total | ||||||||||||||||||||||
| Fair | Unrealized | Fair | Unrealized | Fair | Unrealized | |||||||||||||||||||
| Value | Losses | Value | Losses | Value | Losses | |||||||||||||||||||
| As of 31 December 2025 | ||||||||||||||||||||||||
| Government or government-related obligations | $ | 516 | $ | 2 | $ | 1,944 | $ | 56 | $ | 2,460 | $ | 58 | ||||||||||||
| Corporate Obligations | – | – | 114 | 2 | 114 | 2 | ||||||||||||||||||
| Total | $ | 516 | $ | 2 | $ | 2,058 | $ | 58 | $ | 2,574 | $ | 60 | ||||||||||||
| As of 31 December 2024 | ||||||||||||||||||||||||
| Government or government-related obligations | $ | 718 | $ | 17 | $ | 2,777 | $ | 135 | $ | 3,495 | $ | 153 | ||||||||||||
| Corporate Obligations | 76 | 0 | 170 | 6 | 246 | 6 | ||||||||||||||||||
| Total | $ | 794 | $ | 17 | $ | 2,947 | $ | 141 | $ | 3,741 | $ | 159 | ||||||||||||
0 = less than $0.5 million.
Note: Numbers may not sum precisely because of rounding.
As of 31 December 2025, ADB had the intent and ability to hold the AFS debt securities of which the fair value is lower than amortized cost. ADB also assessed and determined that the decline of fair value below the amortized cost basis of the AFS securities was not due to credit-related factors.
136
ADF-7
continued
Fair Value Disclosure
The FV of INVESTMENTS FOR LIQUIDITY PURPOSE and related financial assets as of 31 December 2025 and 2024 are as follows:
| ($ million) | ||||||||||||||||||
| Fair Value Measurements | ||||||||||||||||||
| Total | Level 1 | Level 2 | Level 3 | |||||||||||||||
| 31 December 2025 | ||||||||||||||||||
| Investments for liquidity purpose | ||||||||||||||||||
| Government or government-related obligations | $ | 3,872 | $ | 3,789 | $ | 83 | $ | – | ||||||||||
| Time deposits | 374 | – | 374 | – | ||||||||||||||
| Corporate obligations | 723 | 723 | – | – | ||||||||||||||
| Securities purchased under resale arrangements | 18 | – | 18 | – | ||||||||||||||
| Total at fair value | $ | 4,987 | $ | 4,512 | $ | 475 | $ | – | ||||||||||
| 31 December 2024 | ||||||||||||||||||
| Investments for liquidity purpose | ||||||||||||||||||
| Government or government-related obligations | $ | 3,641 | $ | 3,470 | $ | 171 | $ | – | ||||||||||
| Time deposits | 289 | – | 289 | – | ||||||||||||||
| Corporate obligations | 707 | 707 | – | – | ||||||||||||||
| Securities purchased under resale arrangements | 24 | – | 24 | – | ||||||||||||||
| Total at fair value | $ | 4,661 | $ | 4,177 | $ | 484 | $ | – | ||||||||||
If available, active market quotes are used to measure fair values of investment securities and related financial assets. Otherwise, they are categorized as Level 2 or Level 3, and valuation is provided by independent valuation services, custodians, and asset managers, or based on discounted cash flow model using market observable inputs, such as interest rates, foreign exchange rates, basis spreads, cross currency rates, and volatilities. Time deposits are reported at cost, which approximates FV.
NOTE D—GUARANTEES
ADB provides guarantees under the Private Sector Window (PSW) of the ADF. Such guarantees include credit guarantees where certain principal is covered. As of 31 December 2025, the guarantees have a maximum potential exposure of $9 million ($6 million – 2024) and an outstanding amount of $4 million ($5 million – 2024). The maximum potential exposure represents the undiscounted future payments that ADB could be required to make, inclusive of standby portion for which ADB is committed but not currently at risk. The outstanding amount represents the guaranteed amount utilized under the related loans, which have been disbursed as of the end of a reporting period, exclusive of the standby portion.
137
ADF-7
continued
NOTE E—RELATED PARTY TRANSACTIONS AND OTHER LIABILITIES
The OCR and special funds resources are at all times used, committed, and invested entirely separate from each other.
Included in Payable to related funds and other liabilities as of 31 December 2025 is the net amount of $47 million ($29 million – 2024) payable to OCR and $10 million (nil – 2024) payable to TASF.
The payable to OCR represents the amount of administrative and operational expenses allocated to the ADF pending settlement (see Note H) while the payable to TASF represents specific portion of installment payments received from donors for ADF 14 that were allocated to the TASF.
As of 31 December 2025, ADF guarantees to OCR under the PSW had a maximum potential exposure of $9 million ($6 million – 2024).
NOTE F—CONTRIBUTED RESOURCES AND ADVANCED CONTRIBUTIONS
In May 2025, the Board of Governors approved the transfer of $394 million ($293 million – 2024) to the ADF as part of OCR’s 2024 net income allocation.
ADF receives cash or nonnegotiable, noninterest-bearing demand obligations as payment for the contributions. Subject to certain restrictions imposed by applicable Board of Governors’ resolutions, demand obligations are encashable by ADB at par upon demand. The unencashed balance as of 31 December 2025 is reported as a reduction in the Fund Balances, which ADB currently expects to be encashed in varying amounts over the standard encashment period ending 31 December 2026 for ADF 12, 31 December 2031 for ADF 13 and 31 December 2035 for ADF 14.
As of 31 December 2025, a total of $1,917 million was committed and acknowledged for ADF 13, of which $1,635 million was made available for operational commitment, and a total of $1,851 million was committed and acknowledged for ADF 14, of which $445 million was made available for operational commitment, and recorded in Contributed Resources.
Advance payments on contributions received from donors as of 31 December 2025 totaled $142 million ($103 million – 2024) and are presented under ACCOUNTS PAYABLE AND OTHER LIABILITIES. Of this amount, $73 million ($50 million – 2024) were received in cash, while the remaining $69 million ($53 million – 2024) were received in demand obligations and were also reported under OTHER ASSETS.
138
ADF-7
continued
NOTE G—ACCUMULATED OTHER COMPREHENSIVE LOSS
Comprehensive (Loss) Income has two major components: net loss (ADF-2) and other comprehensive income (ADF-3). Other comprehensive income (loss) includes unrealized gains and losses on available for sale securities.
The following table presents the changes in Accumulated Other Comprehensive Loss balances for the years ended 31 December 2025 and 2024:
| ($ million) | ||||||||
| Accumulated Other | ||||||||
| Comprehensive Loss | ||||||||
| 2025 | 2024 | |||||||
| Balance, 1 January | $ | (1,654 | ) | $ | (1,685 | ) | ||
| Unrealized Holding Gains on Investments for Liquidity Purpose | ||||||||
| Other comprehensive income (loss) before reclassification | 124 | 31 | ||||||
| Balance, 31 December | $ | (1,530 | ) | $ | (1,654 | ) | ||
The were no reclassifications of Accumulated Other Comprehensive Loss to Income and Expenses for the years ended 31 December 2025 and 2024.
NOTE H—ADMINISTRATIVE EXPENSES
Administrative expenses represent administration charges allocated to ADF, which is an apportionment of all administrative expenses of ADB in the proportion of the relative volume of operational activities.
NOTE I—GRANTS AND UNDISBURSED GRANTS
Undisbursed grants are denominated in US dollars and represent effective grants not yet disbursed and unliquidated. During 2025, 57 grants (48 grants – 2024) became effective resulting in a total Grants expense of $1,419 million ($833 million – 2024), net of $1 million ($80 million – 2024) undisbursed grants that were reversed as reduction in grant expenses. The undisbursed grants of $3,787 million as of 31 December 2025 ($3,044 million – 2024) includes $562 million ($385 million – 2024) advances under grants.
The FV of undisbursed commitments approximates the amount outstanding, because ADB expects that disbursements will substantially be made for all the projects/programs covered by the commitments.
NOTE J—OTHER FAIR VALUE DISCLOSURES
As of 31 December 2025 and 2024, ADF has no assets or liabilities measured at FV on a non-recurring basis. See Notes C and I for discussions relating to investments for liquidity purpose and undisbursed grants, respectively. In all other cases, the carrying amounts of ADF’s assets and liabilities are considered to approximate FVs.
NOTE K—SUBSEQUENT EVENTS
ADB has evaluated subsequent events after 31 December 2025 through 9 March 2026, the date these financial statements are available for issuance. As a result of this evaluation, there are no subsequent events that require recognition or disclosure in the ADF’s financial statements as of 31 December 2025.
139
TECHNICAL ASSISTANCE SPECIAL FUND
MANAGEMENT’S REPORT ON INTERNAL CONTROL OVER FINANCIAL REPORTING
The management of Asian Development Bank (“ADB”) is responsible for designing, implementing, and maintaining effective internal control over financial reporting. ADB’s internal control over financial reporting is a process designed to provide reasonable assurance regarding the preparation of reliable financial statements in accordance with generally accepted accounting principles in the United States of America.
ADB’s internal control over financial reporting includes those policies and procedures that (i) pertain to the maintenance of records that, in reasonable detail, accurately and fairly reflect the transactions and dispositions of the assets of ADB; (ii) provide reasonable assurance that transactions are recorded as necessary to permit preparation of financial statements in accordance with generally accepted accounting principles in the United States of America, and that receipts and expenditures of ADB are being made only in accordance with authorizations of management and directors of ADB; and (iii) provide reasonable assurance regarding prevention, or timely detection and correction, of unauthorized acquisition, use, or disposition of ADB’s assets that could have a material effect on the financial statements.
Because of its inherent limitations, internal control over financial reporting may not prevent, or detect and correct, misstatements. Also, projections of any assessment of effectiveness to future periods are subject to the risk that controls may become inadequate because of changes in conditions, or that the degree of compliance with the policies or procedures may deteriorate.
ADB’s management assessed the effectiveness of ADB’s internal control over financial reporting as of 31 December 2025, based on the criteria established in Internal Control – Integrated Framework (2013) issued by the Committee of Sponsoring Organizations of the Treadway Commission. Based on that assessment, management concluded that ADB’s internal control over financial reporting is effective as of 31 December 2025.
Masato Kanda
President
Roberta Casali
Vice-President (Finance and Risk Management)
Helen Hall
Controller
9 March 2026
140
| |
Deloitte & Touche LLP Tel: +65 6224 8288 |
INDEPENDENT AUDITOR’S REPORT
To the Board of Directors and the Board of Governors of
Asian Development Bank
Opinion on Internal Control Over Financial Reporting
We have audited the internal control over financial reporting of Asian Development Bank (“ADB”) as of 31 December 2025, based on the criteria established in Internal Control — Integrated Framework (2013) issued by the Committee of Sponsoring Organizations of the Treadway Commission (COSO). In our opinion, ADB maintained, in all material respects, effective internal control over financial reporting as of 31 December 2025, based on the criteria established in Internal Control — Integrated Framework (2013) issued by COSO.
We also have audited, in accordance with auditing standards generally accepted in the United States of America (GAAS), the financial statements as of and for the years ended 31 December 2025 and 2024 of ADB – Technical Assistance Special Fund, and our report dated 9 March 2026 expressed an unmodified opinion on those financial statements.
Basis for Opinion
We conducted our audit in accordance with GAAS. Our responsibilities under those standards are further described in the Auditor’s Responsibilities for the Audit of Internal Control over Financial Reporting section of our report. We are required to be independent of ADB and to meet our other ethical responsibilities, in accordance with the relevant ethical requirements relating to our audit. We believe that the audit evidence we have obtained is sufficient and appropriate to provide basis for our audit opinion.
Responsibilities of Management for Internal Control over Financial Reporting
Management is responsible for designing, implementing, and maintaining effective internal control over financial reporting, and for its assessment about the effectiveness of internal control over financial reporting, included in the accompanying Management’s Report on Internal Control over Financial Reporting.
Deloitte & Touche LLP (Unique Entity No. T08LL0721A) is an accounting limited liability partnership registered in Singapore under the Limited Liability Partnerships Act (Chapter 163A).
141
Auditor’s Responsibilities for the Audit of Internal Control over Financial Reporting
Our objectives are to obtain reasonable assurance about whether effective internal control over financial reporting was maintained in all material respects and to issue an auditor’s report that includes our opinion on internal control over financial reporting. Reasonable assurance is a high level of assurance but is not absolute assurance and therefore is not a guarantee that an audit of internal control over financial reporting conducted in accordance with GAAS will always detect a material weakness when it exists.
In performing an audit of internal control over financial reporting in accordance with GAAS, we:
| ● | Exercise professional judgment and maintain professional skepticism throughout the audit. |
| ● | Obtain an understanding of internal control over financial reporting, assess the risks that a material weakness exists, and test and evaluate the design and operating effectiveness of internal control over financial reporting based on the assessed risk. |
Definition and Inherent Limitations of Internal Control over Financial Reporting
ADB’s internal control over financial reporting is a process effected by management and directors of ADB, designed to provide reasonable assurance regarding the preparation of reliable financial statements in accordance with accounting principles generally accepted in the United States of America. ADB’s internal control over financial reporting includes those policies and procedures that (1) pertain to the maintenance of records that, in reasonable detail, accurately and fairly reflect the transactions and dispositions of the assets of ADB; (2) provide reasonable assurance that transactions are recorded as necessary to permit preparation of financial statements in accordance with accounting principles generally accepted in the United States of America, and that receipts and expenditures of ADB are being made only in accordance with authorizations of management and directors of ADB; and (3) provide reasonable assurance regarding prevention, or timely detection and correction of unauthorized acquisition, use, or disposition of ADB’s assets that could have a material effect on the financial statements.
Because of its inherent limitations, internal control over financial reporting may not prevent, or detect and correct, misstatements. Also, projections of any assessment of effectiveness to future periods are subject to the risk that the controls may become inadequate because of changes in conditions, or that the degree of compliance with the policies or procedures may deteriorate.
Public Accountants and
Chartered Accountants
Singapore
9 March 2026
142
| |
Deloitte & Touche LLP Tel: +65 6224 8288 |
INDEPENDENT AUDITOR’S REPORT
To the Board of Directors and the Board of Governors of
Asian Development Bank
Opinion
We have audited the financial statements of Asian Development Bank (“ADB”) – Technical Assistance Special Fund, which comprise the statement of financial position as of 31 December 2025 and 2024, and the related statements of activities and changes in net assets, and cash flows for the years then ended, and the related notes to the financial statements.
In our opinion, the accompanying financial statements present fairly, in all material respects, the financial position of ADB - Technical Assistance Special Fund as of 31 December 2025 and 2024, and the changes in its net assets and its cash flows for the years then ended in accordance with accounting principles generally accepted in the United States of America.
We have also audited, in accordance with auditing standards generally accepted in the United States of America (GAAS), ADB’s internal control over financial reporting as of 31 December 2025, based on the criteria established in Internal Control — Integrated Framework (2013) issued by the Committee of Sponsoring Organizations of the Treadway Commission and our report dated 9 March 2026 expressed an unmodified opinion on ADB’s internal control over financial reporting.
Basis for Opinion
We conducted our audits in accordance with GAAS. Our responsibilities under those standards are further described in the Auditor’s Responsibilities for the Audit of the Financial Statements section of our report. We are required to be independent of ADB - Technical Assistance Special Fund and to meet our other ethical responsibilities, in accordance with the relevant ethical requirements relating to our audits. We believe that the audit evidence we have obtained is sufficient and appropriate to provide a basis for our audit opinion.
Responsibilities of Management for the Financial Statements
Management is responsible for the preparation and fair presentation of these financial statements in accordance with accounting principles generally accepted in the United States of America, and for the design, implementation, and maintenance of internal control relevant to the preparation and fair presentation of financial statements that are free from material misstatement, whether due to fraud or error.
In preparing the financial statements, management is required to evaluate whether there are conditions or events, considered in the aggregate, that raise substantial doubt about ADB – Technical Assistance Special Fund’s ability to continue as a going concern for one year after the date that the financial statements are available to be issued.
Deloitte & Touche LLP (Unique Entity No. T08LL0721A) is an accounting limited liability partnership registered in Singapore under the Limited Liability Partnerships Act (Chapter 163A).
143
Auditor’s Responsibility for the Audit of the Financial Statements
Our objectives are to obtain reasonable assurance about whether the financial statements as a whole are free from material misstatement, whether due to fraud or error, and to issue an auditor’s report that includes our opinion. Reasonable assurance is a high level of assurance but is not absolute assurance and therefore is not a guarantee that an audit conducted in accordance with GAAS will always detect a material misstatement when it exists. The risk of not detecting a material misstatement resulting from fraud is higher than for one resulting from error, as fraud may involve collusion, forgery, intentional omissions, misrepresentations, or the override of internal control. Misstatements are considered material if there is a substantial likelihood that, individually or in the aggregate, they would influence the judgment made by a reasonable user based on the financial statements.
In performing an audit in accordance with GAAS, we:
| ● | Exercise professional judgment and maintain professional skepticism throughout the audit. |
| ● | Identify and assess the risks of material misstatement of the financial statements, whether due to fraud or error, and design and perform audit procedures responsive to those risks. Such procedures include examining, on a test basis, evidence regarding the amounts and disclosures in the financial statements. |
| ● | Obtain an understanding of internal control relevant to the audit in order to design audit procedures that are appropriate in the circumstances. |
| ● | Evaluate the appropriateness of accounting policies used and the reasonableness of significant accounting estimates made by management, as well as evaluate the overall presentation of the financial statements. |
| ● | Conclude whether, in our judgment, there are conditions or events, considered in the aggregate, that raise substantial doubt about ADB – Technical Assistance Special Fund’s ability to continue as a going concern for a reasonable period of time. |
We are required to communicate with those charged with governance regarding, among other matters, the planned scope and timing of the audit, significant audit findings, and certain internal control–related matters that we identified during the audit.
Report on Supplemental Schedules
Our audits were conducted for the purpose of forming an opinion on the financial statements as a whole. The supplemental schedule, which comprises the statement of resources as of 31 December 2025, is presented for the purpose of additional analysis and is not a required part of the financial statements. This schedule is the responsibility of ADB’s management and was derived from and relates directly to the underlying accounting and other records used to prepare the financial statements.
Such schedule has been subjected to the auditing procedures applied in our audits of the financial statements and certain additional procedures, including comparing and reconciling such schedule directly to the underlying accounting and other records used to prepare the financial statements or to the financial statements themselves, and other additional procedures in accordance with GAAS. In our opinion, such schedule is fairly stated in all material respects in relation to the financial statements as a whole.
144
Other Information Included in the Annual Report
Management is responsible for the other information included in the annual report. The other information comprises the information included in the annual report but does not include the financial statements and our auditor’s report thereon. Our opinion on the financial statements does not cover the other information, and we do not express an opinion or any form of assurance thereon.
In connection with our audits of the financial statements, our responsibility is to read the other information and consider whether a material inconsistency exists between the other information and the financial statements, or the other information otherwise appears to be materially misstated. If, based on the work performed, we conclude that an uncorrected material misstatement of the other information exists, we are required to describe it in our report.
Public Accountants and
Chartered Accountants
Singapore
9 March 2026
145
TASF-1
ASIAN DEVELOPMENT BANK—TECHNICAL ASSISTANCE SPECIAL FUND
STATEMENT OF FINANCIAL POSITION
31 December 2025 and 2024
Expressed in Thousands of US Dollars
| 2025 | 2024 | |||||||||||||||
| ASSETS | ||||||||||||||||
| DUE FROM BANKS (Note H) | $ |
7,776 |
$ | 7,553 | ||||||||||||
| INVESTMENTS FOR LIQUIDITY PURPOSE | ||||||||||||||||
| (Notes C, H and I) | ||||||||||||||||
| Government or government-related obligations | $ | 410,824 | $ | 352,280 | ||||||||||||
| Time deposits | 344,704 | 317,496 | ||||||||||||||
| Corporate obligations | 142,254 | 897,782 | 150,122 | 819,898 | ||||||||||||
| ACCRUED REVENUE | 4,760 | 3,512 | ||||||||||||||
| DUE FROM CONTRIBUTORS (Note F) | 406,734 | 39,217 | ||||||||||||||
| ADVANCES FOR TECHNICAL ASSISTANCE (Note E) | 3,375 | 4,579 | ||||||||||||||
| OTHER ASSETS (Note D) | 12,004 | 2,227 | ||||||||||||||
| TOTAL | $ | 1,332,431 | $ | 876,986 | ||||||||||||
| LIABILITIES AND UNCOMMITTED BALANCES | ||||||||||||||||
| ACCOUNTS PAYABLE AND OTHER LIABILITIES | ||||||||||||||||
| Payable to related funds (Note D) | $ | 175 | $ | 464 | ||||||||||||
| Advance payment on contributions | 774 | – | ||||||||||||||
| Deferred credits (Note E) | 1,071 | $ | 2,020 | – | $ | 464 | ||||||||||
| UNDISBURSED TECHNICAL ASSISTANCE (Notes E and I) | 812,625 | 782,952 | ||||||||||||||
| TOTAL LIABILITIES | 814,645 | 783,416 | ||||||||||||||
| UNCOMMITTED BALANCES (TASF-2, Note F), represented by: | ||||||||||||||||
| Net assets without donor restrictions | 517,786 | 93,570 | ||||||||||||||
| TOTAL | $ | 1,332,431 | $ | 876,986 | ||||||||||||
The accompanying Notes are an integral part of these financial statements (TASF-5).
146
TASF-2
ASIAN DEVELOPMENT BANK—TECHNICAL ASSISTANCE SPECIAL FUND
STATEMENT OF ACTIVITIES AND CHANGES IN NET ASSETS
For the Years Ended 31 December 2025 and 2024
Expressed in Thousands of US Dollars
| 2025 | 2024 | |||||||
| CHANGES IN NET ASSETS WITHOUT DONOR RESTRICTIONS | ||||||||
| CONTRIBUTIONS (TASF-4, Note F) | $ | 643,630 | $ | 110,000 | ||||
| REVENUE | ||||||||
| From investments for liquidity purpose—net (Note C) | 44,008 | 37,901 | ||||||
| From other sources (Notes D and E) | 15,206 | 13,724 | ||||||
| Total | 702,844 | 161,625 | ||||||
| EXPENSES | ||||||||
| Technical assistance— net (Notes E and G) | (259,549 | ) | (263,211 | ) | ||||
| Administrative expenses (Note D) | (11,495 | ) | (11,347 | ) | ||||
| Financial expenses | (65 | ) | (61 | ) | ||||
| Other expenses | (5 | ) | – | |||||
| Total | (271,114 | ) | (274,619 | ) | ||||
| CONTRIBUTIONS AND REVENUE IN EXCESS (LESS THAN) EXPENSES | 431,730 | (112,994 | ) | |||||
| EXCHANGE LOSSES—net | (7,514 | ) | (6,735 | ) | ||||
| INCREASE (DECREASE) IN NET ASSETS | 424,216 | (119,729 | ) | |||||
| NET ASSETS AT BEGINNING OF YEAR | 93,570 | 213,299 | ||||||
| NET ASSETS AT END OF YEAR | $ | 517,786 | $ | 93,570 | ||||
The accompanying Notes are an integral part of these financial statements (TASF-5).
147
TASF-3
ASIAN DEVELOPMENT BANK—TECHNICAL ASSISTANCE SPECIAL FUND
STATEMENT OF CASH FLOWS
For the Years Ended 31 December 2025 and 2024
Expressed in Thousands of US Dollars
| 2025 | 2024 | |||||||
| CASH FLOWS FROM OPERATING ACTIVITIES | ||||||||
| Contributions received | $ | 259,174 | $ | 242,669 | ||||
| Interest received on investments for liquidity purpose | 29,125 | 31,713 | ||||||
| Technical assistance disbursed | (228,541 | ) | (227,184 | ) | ||||
| Financial expenses paid | (65 | ) | (61 | ) | ||||
| Others—net | 4,778 | 2,377 | ||||||
| Net Cash Provided by Operating Activities | 64,471 | 49,514 | ||||||
| CASH FLOWS FROM INVESTING ACTIVITIES | ||||||||
| Maturities of investments for liquidity purpose | 9,913,512 | 9,373,904 | ||||||
| Purchases of investments for liquidity purpose | (9,977,762 | ) | (9,423,811 | ) | ||||
| Net Cash Used in Investing Activities | (64,250 | ) | (49,907 | ) | ||||
| Effect of Exchange Rate Changes on Due from Banks | 2 | (1 | ) | |||||
| Net Increase (Decrease) in Due from Banks | 223 | (394 | ) | |||||
| Due from Banks at Beginning of Year | 7,553 | 7,947 | ||||||
| Due from Banks at End of Year | $ | 7,776 | $ | 7,553 | ||||
The accompanying Notes are an integral part of these financial statements (TASF-5).
148
TASF-4
ASIAN DEVELOPMENT BANK - TECHNICAL ASSISTANCE SPECIAL FUND
STATEMENT OF RESOURCES
31 December 2025
Expressed in Thousands of US Dollars
| C O N T R I B U T I O N S | ||||||||||||||||
| CUMULATIVE BALANCES | ||||||||||||||||
| Committed | Direct | Regularized | ||||||||||||||
| Contributor | during 2025 | Voluntary | Replenishmenta | TOTALS | ||||||||||||
| Armenia | $ | 225 | $ | – | $ | 225 | $ | 225 | ||||||||
| Australia | 73,918 | 2,484 | 303,964 | 306,448 | ||||||||||||
| Austria | – | 159 | 19,417 | 19,576 | ||||||||||||
| Azerbaijan | 421 | – | 850 | 850 | ||||||||||||
| Bangladesh | – | 47 | – | 47 | ||||||||||||
| Belgium | – | 1,394 | 8,535 | 9,929 | ||||||||||||
| Brunei Darussalam | 47 | – | 1,098 | 1,098 | ||||||||||||
| Canada | 20,231 | 3,346 | 116,510 | 119,856 | ||||||||||||
| China, People’s Republic of | 31,063 | 1,600 | 84,428 | 86,028 | ||||||||||||
| Denmark | 2,903 | 1,963 | 12,822 | 14,784 | ||||||||||||
| Finland | 1,474 | 237 | 12,570 | 12,807 | ||||||||||||
| France | 8,278 | 1,697 | 73,307 | 75,005 | ||||||||||||
| Georgia | 427 | – | 427 | 427 | ||||||||||||
| Germany | 19,654 | 3,315 | 115,029 | 118,344 | ||||||||||||
| Hong Kong, China | 4,097 | 100 | 16,991 | 17,091 | ||||||||||||
| India | 13,094 | 4,494 | 31,542 | 36,036 | ||||||||||||
| Indonesia | 2,563 | 250 | 7,706 | 7,956 | ||||||||||||
| Ireland | 3,840 | – | 15,657 | 15,657 | ||||||||||||
| Israel | 2,161 | – | 2,161 | 2,161 | ||||||||||||
| Italy | 9,556 | 774 | 64,147 | 64,921 | ||||||||||||
| Japan | 238,651 | 47,710 | 1,096,334 | 1,144,045 | ||||||||||||
| Kazakhstan | – | – | 940 | 940 | ||||||||||||
| Korea, Republic of | 19,695 | 1,900 | 86,198 | 88,098 | ||||||||||||
| Luxembourg | 1,402 | – | 5,734 | 5,734 | ||||||||||||
| Malaysia | – | 909 | 3,275 | 4,184 | ||||||||||||
| Nauru | – | – | 67 | 67 | ||||||||||||
| Netherlands | 3,685 | 1,337 | 37,222 | 38,560 | ||||||||||||
| New Zealand | – | 1,096 | 13,837 | 14,932 | ||||||||||||
| Norway | 5,351 | 3,279 | 26,555 | 29,834 | ||||||||||||
| Pakistan | – | 2,646 | – | 2,646 | ||||||||||||
| Philippines | 675 | – | 1,343 | 1,343 | ||||||||||||
| Portugal | – | – | 3,712 | 3,712 | ||||||||||||
| Singapore | 977 | 1,100 | 4,059 | 5,159 | ||||||||||||
| Spain | 3,242 | 190 | 29,109 | 29,299 | ||||||||||||
| Sri Lanka | – | 6 | – | 6 | ||||||||||||
| Sweden | 5,351 | 861 | 32,631 | 33,493 | ||||||||||||
| Switzerland | 2,555 | 1,035 | 26,753 | 27,788 | ||||||||||||
| Taipei,China | 2,702 | 200 | 12,467 | 12,667 | ||||||||||||
| Thailand | 585 | – | 2,453 | 2,453 | ||||||||||||
| Türkiye | 541 | – | 5,128 | 5,128 | ||||||||||||
| United Kingdom | 34,266 | 5,617 | 162,879 | 168,496 | ||||||||||||
| United States | – | 1,500 | 203,966 | 205,466 | ||||||||||||
| Total | 513,630 | 91,248 | 2,642,050 | 2,733,298 | ||||||||||||
| Transfer to Asian Development Fund | (3,472 | ) | ||||||||||||||
| Allocation from OCR Net Income | 130,000 | 1,849,000 | ||||||||||||||
| Other Resourcesb | 334,040 | |||||||||||||||
| TOTAL | $ | 643,630 | $ | 4,912,867 | ||||||||||||
Note: Numbers may not sum precisely because of rounding.
| a | Represents TASF portion of contributions to the replenishment of the Asian Development Fund and the Technical Assistance Special Fund authorized by Governors’ Resolution Nos. 182, 214, 300, 333, 357, 382, 408, and 427, valued at Resolutions’ rate. |
| b | Represents income and reimbursements, including net unrealized holding gains/losses. |
149
TASF-5
ASIAN DEVELOPMENT BANK—TECHNICAL ASSISTANCE SPECIAL FUND
NOTES TO FINANCIAL STATEMENTS
31 December 2025 and 2024
NOTE A—NATURE OF OPERATIONS
The Asian Development Bank (ADB), a multilateral development bank, was established in 1966 with its headquarters in Manila, Philippines. ADB and its operations are governed by the Agreement Establishing the Asian Development Bank (the Charter). Its purpose is to foster economic development and co-operation in Asia and the Pacific region and to contribute to the acceleration of the process of economic development of the developing member countries (DMCs) in the region, collectively and individually. Since 1999, ADB’s corporate vision and mission has been to help DMCs reduce poverty in the region. This was reaffirmed under the long-term corporate strategy to 2030—Strategy 2030. Under Strategy 2030, ADB’s vision is to achieve a prosperous, inclusive, resilient, and sustainable Asia and the Pacific, while sustaining its efforts to eradicate extreme poverty. ADB will continue to prioritize the region’s poorest and most vulnerable countries. ADB provides financial and technical assistance for projects and programs, which will contribute to achieve this purpose. These are financed through ordinary capital resources (OCR) and special funds.1
The Technical Assistance Special Fund (TASF) was established to provide technical assistance on a grant basis to DMCs of the ADB and for regional technical assistance. TASF resources consist of regularized replenishments and direct voluntary contributions by members, allocations from the net income of OCR, and revenue from investments and other sources.
ADB is immune from taxation pursuant to Chapter VIII, Article 56, Exemption from Taxation, of the Charter.
Replenishments
In September 2024, the Board of Governors adopted a resolution for the 13th replenishment of the ADF and the eighth regularized replenishment of the TASF (ADF 14).2 The replenishment will provide grant financing to eligible recipients from 2025 to 2028. Donors agreed to allocate $560 million to TASF out of the total replenishment. As of 31 December 2025, TASF received contribution commitments from 31 donors totaling $514 million, or 92% of the total commitment.
NOTE B—SUMMARY OF SIGNIFICANT ACCOUNTING POLICIES
Presentation of Financial Statements
The financial statements of the TASF are prepared in accordance with accounting principles generally accepted in the United States of America (US GAAP), and are presented on the basis of those for not-for-profit organizations.
TASF reports donors’ contributions of cash and other assets as assets without donor restrictions as these are made available to TASF without conditions other than for the purpose of pursuing its objectives.
Functional and Reporting Currency
The US dollar is the functional and reporting currency, representing the currency of the primary economic operating environment of the TASF.
| 1 | Special funds refer to Asian Development Fund (ADF), Technical Assistance Special Fund (TASF), Japan Special Fund (JSF), Asian Development Bank Institute (ADBI), Regional Cooperation and Integration Fund (RCIF), Climate Change Fund (CCF), Asia Pacific Disaster Response Fund (APDRF), and Financial Sector Development Partnership Special Fund (FSDPSF). |
| 2 | ADB. 2024. Board of Governors’ Resolution No. 427 – Thirteenth Replenishment of the Asian Development Fund and Eighth Regularized Replenishment of the Technical Assistance Special Fund. |
150
TASF-5
continued
Translation of Currencies
ADB adopts the use of daily exchange rates for accounting and financial reporting purposes. This allows transactions denominated in non-US dollar currencies to be translated to the reporting currency using exchange rates applicable at the time of the transactions. Contributions included in the financial statements during the year are recognized at applicable exchange rates as of the respective dates of commitment. At the end of each accounting month, translations of assets and liabilities which are denominated in non-US dollar currencies are adjusted using the applicable exchange rates at the end of the reporting period. These translation adjustments are accounted for as exchange gains or losses and are credited or charged to operations.
Investments for Liquidity Purpose
All investments held by TASF are reported at fair value (FV). Interest income earned, realized and unrealized gains and losses are included in REVENUE From investments for liquidity purpose.
Contributions
The contributions from donors and the allocations from OCR net income are included in the financial statements from the date of the acknowledgement by the President or effectiveness of the regularized replenishment, whichever comes later and the Board of Governors’ approval, respectively.
Technical Assistance and Related Undisbursed Balance
Technical assistance (TA) is recognized as expense in the financial statements when the project becomes effective. Upon completion or cancellation of a TA project, any undisbursed commitment balance is reversed. TA expenses are also reversed accordingly.
Advances are provided from TA to the executing agency or co-operating institution, for the purpose of making payments for eligible expenses. The advances are subject to liquidation and charged against undisbursed commitments. Any unutilized portion is required to be returned to the fund. These are included in ADVANCES FOR TECHNICAL ASSISTANCE.
Fair Value of Financial Instruments
Accounting Standards Codification (ASC) 820, “Fair Value Measurement” defines FV as the price that would be received to sell an asset or paid to transfer a liability at measurement date in an orderly transaction among willing participants with an assumption that the transaction takes place in the entity’s principal market, or in the absence of principal market, in the most advantageous market for the asset or liability. The most advantageous market is the market where the sale of the asset or transfer of liability would maximize the amount received for the asset or minimize the amount paid to transfer the liability. The FV measurement is not adjusted for transaction costs.
Fair Value Hierarchy
ASC 820 establishes a FV hierarchy that gives the highest priority to quoted prices in active markets for identical assets or liabilities (Level 1), next priority to observable market inputs or market corroborated data (Level 2), and the lowest priority to unobservable inputs without market corroborated data (Level 3).
The FVs of ADB’s financial assets and liabilities are categorized as follows:
Level 1: FVs are based on unadjusted quoted prices for identical assets or liabilities in active markets.
151
TASF-5
continued
Level 2: FVs are based on quoted prices for similar assets or liabilities in active markets or markets that are not active; or valuation models for which significant inputs are obtained from market-based data that are observable.
Level 3: FVs are based on prices or valuation models for which significant inputs to the model are unobservable.
Accounting Estimates
The preparation of financial statements in accordance with US GAAP requires Management to make reasonable estimates and assumptions that affect the reported amounts of assets, liabilities, and uncommitted balances as of the end of the year and the reported amounts of revenue and expenses during the year. The actual results could differ from those estimates.
Statement of Cash Flows
For the purposes of the Statement of Cash Flows, the TASF considers that its cash and cash equivalents are limited to DUE FROM BANKS, which consists of cash on hand and current accounts in banks used for (i) operational disbursements, (ii) receipt of funds from encashment of contributors’ promissory notes, and (iii) clearing accounts.
Accounting and Reporting Developments
In March 2024, the Financial Accounting Standards Board (FASB) issued Accounting Standard Update (ASU) 2024-02, “Codification Improvements – Amendments to Remove References to the Concepts Statements”. This Update contains amendments to the Codification that remove references to various FASB Concepts Statements. The amendments in this Update are effective for public business entities for fiscal years beginning after 15 December 2024. For all other entities, the amendments are effective for fiscal years beginning after 15 December 2025. Early adoption is permitted for all entities. ADB does not expect the adoption of this Update to have a material impact on the financial statements.
In December 2025, the FASB issued ASU 2025-11, “Interim Reporting (Topic 270): Narrow-Scope Improvements”—aimed at enhancing the structure and clarity of interim reporting guidance. The amendments reorganize existing disclosure requirements, define what constitutes interim financial statements and notes under GAAP (including SEC considerations where relevant), and introduce a new disclosure principle requiring entities to report material events occurring after the preceding annual reporting period. While the Update improves consistency and usability, it does not expand or reduce current disclosure requirements. The amendments are effective for public business entities for interim periods within annual reporting periods beginning after 15 December 2027, and one year later for all other entities, with early adoption permitted. Entities may apply the amendments prospectively or retrospectively. This Update is not expected to have a significant impact on TASF’s interim financial statements.
Additionally, the FASB issued ASU 2025-12, “Codification Improvements”, introducing clarifications, corrections, and other minor amendments across a wide range of Topics. These updates are designed to make the Codification easier to navigate and apply, particularly in areas where the original language may have caused confusion. The amendments take effect for all entities for annual reporting periods beginning after 15 December 2026, including the related interim periods. This Update is not expected to have a significant impact on TASF’s financial statements.
152
TASF-5
continued
NOTE C—INVESTMENTS FOR LIQUIDITY PURPOSE
The main investment management objective is to maintain security and liquidity. Subject to these parameters, ADB seeks the highest possible return on its investments. Investments are governed by the Investment Authority approved by the Board of Directors.
All investments for liquidity purpose held by TASF are reported at FV. Interest income earned, realized and unrealized gains and losses are included in REVENUE From investments for liquidity purpose. During 2025, REVENUE From investments for liquidity purpose of $44,008,000 ($37,901,000 – 2024) included income from securities, time deposits and corporate obligations of $30,406,000 ($31,955,000 – 2024) and unrealized investment holding gains of $13,602,000 ($5,946,000 – 2024).
The currency composition of the investment for liquidity purpose portfolio as of 31 December 2025 and 2024 is US dollar currency only.
The rate of return on the average investments for liquidity purpose held during the year ended 31 December 2025 was 5.1% (4.7% – 2024).
The FV of INVESTMENTS FOR LIQUIDITY PURPOSE and related financial assets by contractual maturity as of 31 December 2025 and 2024 are as follows:
($ thousand)
| 2025 | 2024 | |||||||||||||||||||||||
| Investments for liquidity purpose | 0-1 year | > 1 year | Total | 0-1 year | > 1 year | Total | ||||||||||||||||||
| Government or government-related obligations | $ | 107,846 | $ | 302,978 | $ | 410,824 | $ | 64,658 | $ | 287,622 | $ | 352,280 | ||||||||||||
| Time deposits | 344,704 | – | 344,704 | 317,496 | – | 317,496 | ||||||||||||||||||
| Corporate obligations | 63,241 | 79,013 | 142,254 | 49,773 | 100,349 | 150,122 | ||||||||||||||||||
| Total at fair value | $ | 515,791 | $ | 381,991 | $ | 897,782 | $ | 431,927 | $ | 387,971 | $ | 819,898 | ||||||||||||
153
TASF-5
continued
Fair Value Disclosure
The FV of INVESTMENTS FOR LIQUIDITY PURPOSE and related financial assets as of 31 December 2025 and 2024 are as follows:
| ($ thousand) | ||||||||||||||||
| Fair Value Measurements | ||||||||||||||||
| Total | Level 1 | Level 2 | Level 3 | |||||||||||||
| 2025 | ||||||||||||||||
| Investments for liquidity purpose | ||||||||||||||||
| Government or government-related obligations | $ | 410,824 | $ | 382,940 | $ | 27,884 | $ | – | ||||||||
| Time deposits | 344,704 | – | 344,704 | – | ||||||||||||
| Corporate obligations | 142,254 | 142,254 | – | – | ||||||||||||
| Total at fair value | $ | 897,782 | $ | 525,194 | $ | 372,588 | $ | – | ||||||||
| 2024 | ||||||||||||||||
| Investments for liquidity purpose | ||||||||||||||||
| Government or government-related obligations | $ | 352,280 | $ | 299,736 | $ | 52,544 | $ | – | ||||||||
| Time deposits | 317,496 | – | 317,496 | – | ||||||||||||
| Corporate obligations | 150,122 | 150,122 | – | – | ||||||||||||
| Total at fair value | $ | 819,898 | $ | 449,858 | $ | 370,040 | $ | – | ||||||||
If available, investments are fair valued based on active market quotes. These include government or government-related obligations. Time deposits are reported at cost, which approximates FV.
NOTE D—RELATED PARTY TRANSACTIONS
The OCR and Special Funds resources are at all times used, committed, and invested entirely separately from each other. Under the five most recent replenishments, a specific portion of the total contributions is allocated to the TASF as regularized replenishments. ADF receives the contributions from members and subsequently transfers the specified portion to the TASF. Regional technical assistance projects and program activities may be cofinanced by ADB’s other special funds and trust funds administered by ADB. Interfund accounts are settled regularly between the TASF and the other funds.
ADB does not allocate any service fees to TASF for administering TA which involves a range of personnel services. The TASF has estimated the FV of personnel services involved in administering TA projects to be 5% of amounts disbursed for TA projects. For the year ended 31 December 2025, the calculated service fee was $11,495,000 ($11,347,000 – 2024) recorded as Administrative expenses under EXPENSES, and REVENUE From other sources. The transaction has no impact on the net assets of TASF.
154
TASF-5
continued
The interfund account balances included in OTHER ASSETS and ACCOUNTS PAYABLE AND OTHER LIABILITIES as of 31 December 2025 and 2024 are as follows:
($ thousand)
| 2025 | 2024 | |||||||
| Receivable from: | ||||||||
| Asian Development Fund | $ | 10,161 | $ | – | ||||
| Financial Sector Development Partnership Special Fund | 65 | 7 | ||||||
| Regional Cooperation and Integration Fund—net | 52 | 154 | ||||||
| Climate Change Fund—net | 29 | 265 | ||||||
| Japan Special Fund—net | 26 | 68 | ||||||
| Trust Funds—net | 1,665 | 1,722 | ||||||
| Total | $ | 11,998 | $ | 2,216 | ||||
| Payable to: | ||||||||
| Ordinary capital resources—net | $ | 171 | $ | 463 | ||||
NOTE E—TECHNICAL ASSISTANCE AND UNDISBURSED TECHNICAL ASSISTANCE
Undisbursed TAs are denominated in US dollars and represent effective TAs not yet disbursed and unliquidated. During 2025, 188 TA projects and 157 supplementary TA (199 TA projects and 167 supplementary TA – 2024) became effective resulting in a total TA expense of $259,549,000 ($263,211,000 – 2024), net of $13,056,000 ($21,495,000 – 2024) undisbursed TA that were reversed as a reduction in TA expenses.
The FV undisbursed commitments approximates the amounts outstanding, because ADB expects that disbursements will substantially be made for all the projects/programs covered by the commitments.
ADB normally finances all TA on a grant basis. However, some TA operations are subject to the recovery of the full cost of the TA or provided on a reimbursable basis. During 2025, there were $3,583,000 TA reimbursements ($2,232,000 – 2024) that were included in REVENUE From other sources.
As of 31 December 2025, reimbursable TA amounting to $1,071,000 was received in advance of the TA effectiveness (nil – 2024) that were included in ACCOUNTS PAYABLE AND OTHER LIABILITIES – Deferred credits.
155
TASF-5
continued
NOTE F—CONTRIBUTIONS AND UNCOMMITTED BALANCES
During the year ended 31 December 2025, TASF received total contributions of $643,630,000 ($110,000,000 – 2024) comprising of $513,630,000 in additional contributions from ADF 14 and $130,000,000 from OCR’s 2024 net income allocation. During the year, TASF received cash and promissory notes from ADF replenishments and direct voluntary, comprising of the following:
| ($ thousand) | ||||||||
| 2025 | 2024 | |||||||
| Direct Voluntary | $ | – | $ | 70 | ||||
| Regularized Replenishments | ||||||||
| ADF 14 | $ | 127,662 | $ | – | ||||
| ADF 13 | 9,712 | 152,854 | ||||||
| 137,374 | 152,854 | |||||||
| Total | $ | 137,374 | $ | 152,924 | ||||
Total contributions not yet received and reported as DUE FROM CONTRIBUTORS are as follows:
| ($ thousand) | ||||||||
| 2025 | 2024 | |||||||
| Direct Voluntary | $ | – | $ | – | ||||
| Regularized Replenishments | ||||||||
| ADF 14 | $ | 376,757 | $ | – | ||||
| ADF 13 | 6,067 | 15,779 | ||||||
| ADF X | 19,748 | 19,342 | ||||||
| ADF IX | 4,162 | 4,096 | ||||||
| 406,734 | 39,217 | |||||||
| Total | $ | 406,734 | $ | 39,217 | ||||
Some of the direct contributions received can be subject to restricted procurement sources, while some are given on condition that the technical assistance be made on a reimbursable basis. The total contributions received for the years ended 31 December 2025 and 2024 were without any restrictions.
Uncommitted balances comprise amounts which have not been committed by ADB as of 31 December 2025 and 2024. These balances include approved TA projects/programs that are not yet effective.
156
TASF-5
continued
NOTE G—TECHNICAL ASSISTANCE EXPENSES
TA expenses are classified according to their nature using the budget allocation specified in the relevant TA agreement for the TAs that became effective during the year. The details of TA expenses for the years ended 31 December 2025 and 2024 are as follows:
| ($ thousand) | ||||||||
| 2025 | 2024 | |||||||
| Consultants | $ | 201,781 | $ | 221,577 | ||||
| Trainings and seminars | 42,075 | 40,090 | ||||||
| Studies | 5,865 | 6,105 | ||||||
| Equipment | 2,846 | 1,615 | ||||||
| Other expenses—net a | 6,982 | (6,176 | ) | |||||
| Total | $ | 259,549 | $ | 263,211 | ||||
a Net of undisbursed commitment balances that were reversed as a reduction in TA expenses. (See Note E).
NOTE H—LIQUIDITY AND AVAILABILITY OF RESOURCES
Liquidity risk refers to the risk that the fund has difficulties in meeting its short-term obligations. As part of TASF’s liquidity management, it has a policy to structure its financial assets to be available as its general expenditures, liabilities, and other obligations come due. In addition, TASF invests cash in excess of daily requirements in short-term investments.
As of 31 December 2025, TASF has liquidity of $523,567,000 ($439,480,000 – 2024) consisting of DUE FROM BANKS of $7,776,000 ($7,553,000 – 2024), INVESTMENTS FOR LIQUIDITY PURPOSE in Time deposits of $344,704,000 ($317,496,000 – 2024), Government or government-related obligations of $107,846,000 ($64,658,000 – 2024), and Corporate obligations of $63,241,000 ($49,773,000 – 2024), available within one year from the balance sheet date to meet cash needs for general expenditure.
NOTE I—OTHER FAIR VALUE DISCLOSURES
As of 31 December 2025 and 2024, TASF has no assets or liabilities measured at FV on a non-recurring basis. See Notes C and E for discussions relating to investments for liquidity purpose and undisbursed technical assistance, respectively. In all other cases, the carrying amount of TASF’s assets and liabilities is considered to approximate FV.
NOTE J—SUBSEQUENT EVENTS
ADB has evaluated subsequent events after 31 December 2025 through 9 March 2026, the date these financial statements are available for issuance. As a result of this evaluation, there are no subsequent events that require recognition or disclosure in the TASF’s financial statements as of 31 December 2025.
157
JAPAN SPECIAL FUND
MANAGEMENT’S REPORT ON INTERNAL CONTROL OVER FINANCIAL REPORTING
The management of Asian Development Bank (“ADB”) is responsible for designing, implementing, and maintaining effective internal control over financial reporting. ADB’s internal control over financial reporting is a process designed to provide reasonable assurance regarding the preparation of reliable financial statements in accordance with generally accepted accounting principles in the United States of America.
ADB’s internal control over financial reporting includes those policies and procedures that (i) pertain to the maintenance of records that, in reasonable detail, accurately and fairly reflect the transactions and dispositions of the assets of ADB; (ii) provide reasonable assurance that transactions are recorded as necessary to permit preparation of financial statements in accordance with generally accepted accounting principles in the United States of America, and that receipts and expenditures of ADB are being made only in accordance with authorizations of management and directors of ADB; and (iii) provide reasonable assurance regarding prevention, or timely detection and correction, of unauthorized acquisition, use, or disposition of ADB’s assets that could have a material effect on the financial statements.
Because of its inherent limitations, internal control over financial reporting may not prevent, or detect and correct, misstatements. Also, projections of any assessment of effectiveness to future periods are subject to the risk that controls may become inadequate because of changes in conditions, or that the degree of compliance with the policies or procedures may deteriorate.
ADB’s management assessed the effectiveness of ADB’s internal control over financial reporting as of 31 December 2025, based on the criteria established in Internal Control – Integrated Framework (2013) issued by the Committee of Sponsoring Organizations of the Treadway Commission. Based on that assessment, management concluded that ADB’s internal control over financial reporting is effective as of 31 December 2025.
Masato Kanda
President
Roberta Casali
Vice-President (Finance and Risk Management)
Helen Hall
Controller
9 March 2026
158
| |
Deloitte & Touche LLP Tel: +65 6224 8288 |
INDEPENDENT AUDITOR’S REPORT
To the Board of Directors and the Board of Governors of
Asian Development Bank
Opinion on Internal Control Over Financial Reporting
We have audited the internal control over financial reporting of Asian Development Bank (“ADB”) as of 31 December 2025, based on the criteria established in Internal Control — Integrated Framework (2013) issued by the Committee of Sponsoring Organizations of the Treadway Commission (COSO). In our opinion, ADB maintained, in all material respects, effective internal control over financial reporting as of 31 December 2025, based on the criteria established in Internal Control — Integrated Framework (2013) issued by COSO.
We also have audited, in accordance with auditing standards generally accepted in the United States of America (GAAS), the financial statements as of and for the years ended 31 December 2025 and 2024 of ADB – Japan Special Fund, and our report dated 9 March 2026 expressed an unmodified opinion on those financial statements.
Basis for Opinion
We conducted our audit in accordance with GAAS. Our responsibilities under those standards are further described in the Auditor’s Responsibilities for the Audit of Internal Control over Financial Reporting section of our report. We are required to be independent of ADB and to meet our other ethical responsibilities, in accordance with the relevant ethical requirements relating to our audit. We believe that the audit evidence we have obtained is sufficient and appropriate to provide basis for our audit opinion.
Responsibilities of Management for Internal Control over Financial Reporting
Management is responsible for designing, implementing, and maintaining effective internal control over financial reporting, and for its assessment about the effectiveness of internal control over financial reporting, included in the accompanying Management’s Report on Internal Control over Financial Reporting.
Deloitte & Touche LLP (Unique Entity No. T08LL0721A) is an accounting limited liability partnership registered in Singapore under the Limited Liability Partnerships Act (Chapter 163A).
159
Auditor’s Responsibilities for the Audit of Internal Control over Financial Reporting
Our objectives are to obtain reasonable assurance about whether effective internal control over financial reporting was maintained in all material respects and to issue an auditor’s report that includes our opinion on internal control over financial reporting. Reasonable assurance is a high level of assurance but is not absolute assurance and therefore is not a guarantee that an audit of internal control over financial reporting conducted in accordance with GAAS will always detect a material weakness when it exists.
In performing an audit of internal control over financial reporting in accordance with GAAS, we:
| ● | Exercise professional judgment and maintain professional skepticism throughout the audit. |
| ● | Obtain an understanding of internal control over financial reporting, assess the risks that a material weakness exists, and test and evaluate the design and operating effectiveness of internal control over financial reporting based on the assessed risk. |
Definition and Inherent Limitations of Internal Control over Financial Reporting
ADB’s internal control over financial reporting is a process effected by management and directors of ADB, designed to provide reasonable assurance regarding the preparation of reliable financial statements in accordance with accounting principles generally accepted in the United States of America. ADB’s internal control over financial reporting includes those policies and procedures that (1) pertain to the maintenance of records that, in reasonable detail, accurately and fairly reflect the transactions and dispositions of the assets of ADB; (2) provide reasonable assurance that transactions are recorded as necessary to permit preparation of financial statements in accordance with accounting principles generally accepted in the United States of America, and that receipts and expenditures of ADB are being made only in accordance with authorizations of management and directors of ADB; and (3) provide reasonable assurance regarding prevention, or timely detection and correction of unauthorized acquisition, use, or disposition of ADB’s assets that could have a material effect on the financial statements.
Because of its inherent limitations, internal control over financial reporting may not prevent, or detect and correct, misstatements. Also, projections of any assessment of effectiveness to future periods are subject to the risk that the controls may become inadequate because of changes in conditions, or that the degree of compliance with the policies or procedures may deteriorate.
Public Accountants and
Chartered Accountants
Singapore
9 March 2026
160
| |
Deloitte & Touche LLP Tel: +65 6224 8288 |
INDEPENDENT AUDITOR’S REPORT
To the Board of Directors and the Board of Governors of
Asian Development Bank
Opinion
We have audited the financial statements of Asian Development Bank (“ADB”) – Japan Special Fund, which comprise the statements of financial position as of 31 December 2025 and 2024, and the related statements of activities and changes in net assets, and cash flows for the years then ended, and the related notes to the financial statements.
In our opinion, the accompanying financial statements present fairly, in all material respects, the financial position of ADB - Japan Special Fund as of 31 December 2025 and 2024, and the changes in its net assets and its cash flows for the years then ended in accordance with accounting principles generally accepted in the United States of America.
We have also audited, in accordance with auditing standards generally accepted in the United States of America (GAAS), ADB’s internal control over financial reporting as of 31 December 2025, based on the criteria established in Internal Control — Integrated Framework (2013) issued by the Committee of Sponsoring Organizations of the Treadway Commission and our report dated 9 March 2026 expressed an unmodified opinion on ADB’s internal control over financial reporting.
Basis for Opinion
We conducted our audits in accordance with GAAS. Our responsibilities under those standards are further described in the Auditor’s Responsibilities for the Audit of the Financial Statements section of our report. We are required to be independent of ADB - Japan Special Fund and to meet our other ethical responsibilities, in accordance with the relevant ethical requirements relating to our audits. We believe that the audit evidence we have obtained is sufficient and appropriate to provide a basis for our audit opinion.
Deloitte & Touche LLP (Unique Entity No. T08LL0721A) is an accounting limited liability partnership registered in Singapore under the Limited Liability Partnerships Act (Chapter 163A).
161
Responsibilities of Management for the Financial Statements
Management is responsible for the preparation and fair presentation of these financial statements in accordance with accounting principles generally accepted in the United States of America, and for the design, implementation, and maintenance of internal control relevant to the preparation and fair presentation of financial statements that are free from material misstatement, whether due to fraud or error.
In preparing the financial statements, management is required to evaluate whether there are conditions or events, considered in the aggregate, that raise substantial doubt about ADB – Japan Special Fund’s ability to continue as a going concern for one year after the date that the financial statements are available to be issued.
Auditor’s Responsibility for the Audit of the Financial Statements
Our objectives are to obtain reasonable assurance about whether the financial statements as a whole are free from material misstatement, whether due to fraud or error, and to issue an auditor’s report that includes our opinion. Reasonable assurance is a high level of assurance but is not absolute assurance and therefore is not a guarantee that an audit conducted in accordance with GAAS will always detect a material misstatement when it exists. The risk of not detecting a material misstatement resulting from fraud is higher than for one resulting from error, as fraud may involve collusion, forgery, intentional omissions, misrepresentations, or the override of internal control. Misstatements are considered material if there is a substantial likelihood that, individually or in the aggregate, they would influence the judgment made by a reasonable user based on the financial statements.
In performing an audit in accordance with GAAS, we:
| ● | Exercise professional judgment and maintain professional skepticism throughout the audit. |
| ● | Identify and assess the risks of material misstatement of the financial statements, whether due to fraud or error, and design and perform audit procedures responsive to those risks. Such procedures include examining, on a test basis, evidence regarding the amounts and disclosures in the financial statements. |
| ● | Obtain an understanding of internal control relevant to the audit in order to design audit procedures that are appropriate in the circumstances. |
| ● | Evaluate the appropriateness of accounting policies used and the reasonableness of significant accounting estimates made by management, as well as evaluate the overall presentation of the financial statements. |
| ● | Conclude whether, in our judgment, there are conditions or events, considered in the aggregate, that raise substantial doubt about ADB – Japan Special Fund’s ability to continue as a going concern for a reasonable period of time. |
We are required to communicate with those charged with governance regarding, among other matters, the planned scope and timing of the audit, significant audit findings, and certain internal control–related matters that we identified during the audit.
162
Other Information Included in the Annual Report
Management is responsible for the other information included in the annual report. The other information comprises the information included in the annual report but does not include the financial statements and our auditor’s report thereon. Our opinion on the financial statements does not cover the other information, and we do not express an opinion or any form of assurance thereon.
In connection with our audits of the financial statements, our responsibility is to read the other information and consider whether a material inconsistency exists between the other information and the financial statements, or the other information otherwise appears to be materially misstated. If, based on the work performed, we conclude that an uncorrected material misstatement of the other information exists, we are required to describe it in our report.
Public Accountants and
Chartered Accountants
Singapore
9 March 2026
163
JSF-1
ASIAN DEVELOPMENT BANK—JAPAN SPECIAL FUND
STATEMENT OF FINANCIAL POSITION
31 December 2025 and 2024
Expressed in Thousands of US Dollars
|
2025 |
2024 |
|||||||||||||||
| ASSETS | ||||||||||||||||
| DUE FROM BANKS (Note I) | $ | 994 | $ | 1,046 | ||||||||||||
| INVESTMENTS FOR LIQUIDITY PURPOSE (Notes D and J) | ||||||||||||||||
| Time deposits | 126,033 | 123,205 | ||||||||||||||
| ACCRUED REVENUE | 638 | 929 | ||||||||||||||
| ADVANCES FOR TECHNICAL ASSISTANCE (Note F) | 64 | 2 | ||||||||||||||
| OTHER ASSETS (Note C and E) | 6 | – | ||||||||||||||
| TOTAL | $ | 127,735 | $ | 125,182 | ||||||||||||
| LIABILITIES AND NET ASSETS | ||||||||||||||||
| ACCOUNTS PAYABLE AND OTHER LIABILITIES | ||||||||||||||||
| Payable to related funds (Note E) | $ | 31 | $ | 92 | ||||||||||||
| Accrued expenses and other liabilities (Note C) | 27 | $ | 58 | 20 | $ | 112 | ||||||||||
| UNDISBURSED TECHNICAL ASSISTANCE (Note F) | 20,410 | 14,192 | ||||||||||||||
| TOTAL LIABILITIES | 20,468 | 14,304 | ||||||||||||||
| UNCOMMITTED BALANCES (JSF-2, Note G), represented by: | ||||||||||||||||
| Net assets without donor restrictions | 107,267 | 110,878 | ||||||||||||||
| TOTAL | $ | 127,735 | $ | 125,182 | ||||||||||||
The accompanying Notes are an integral part of these financial statements (JSF-4).
164
JSF-2
ASIAN DEVELOPMENT BANK—JAPAN SPECIAL FUND
STATEMENT OF ACTIVITIES AND CHANGES IN NET ASSETS
For the Years Ended 31 December 2025 and 2024
Expressed in Thousands of US Dollars
| 2025 | 2024 | |||||||
| CHANGES IN NET ASSETS WITHOUT DONOR RESTRICTIONS | ||||||||
| REVENUE | ||||||||
| From investments for liquidity purpose (Note D) | $ | 5,537 | $ | 6,512 | ||||
| From other sources | 39 | 72 | ||||||
| Total | 5,576 | 6,584 | ||||||
| EXPENSES | ||||||||
| Technical assistance (Notes F and H) | (9,100 | ) | (7,750 | ) | ||||
| Administrative and financial expenses (Note H) | (87 | ) | (79 | ) | ||||
| Total | (9,187 | ) | (7,829 | ) | ||||
| DECREASE IN NET ASSETS | (3,611 | ) | (1,245 | ) | ||||
| NET ASSETS AT BEGINNING OF YEAR | 110,878 | 112,123 | ||||||
| NET ASSETS AT END OF YEAR | $ | 107,267 | $ | 110,878 | ||||
The accompanying Notes are an integral part of these financial statements (JSF-4).
165
JSF-3
ASIAN DEVELOPMENT BANK—JAPAN SPECIAL FUND
STATEMENT OF CASH FLOWS
For the Years Ended 31 December 2025 and 2024
Expressed in Thousands of US Dollars
|
2025 |
2024 |
|||||||
| CASH FLOWS FROM OPERATING ACTIVITIES | ||||||||
| Interest received on investments for liquidity purpose | $ | 5,828 | $ | 5,740 | ||||
| Cash received from other sources | 39 | 72 | ||||||
| Technical assistance disbursed | (3,005 | ) | (1,103 | ) | ||||
| Administrative and financial expenses paid | (86 | ) | (81 | ) | ||||
| Net Cash Provided by Operating Activities | 2,776 | 4,628 | ||||||
| CASH FLOWS FROM INVESTING ACTIVITIES | ||||||||
| Maturities of investments for liquidity purpose | 1,071,518 | 1,813,102 | ||||||
| Purchases of investments for liquidity purpose | (1,074,346 | ) | (1,821,643 | ) | ||||
| Net Cash Used in Investing Activities | (2,828 | ) | (8,541 | ) | ||||
| Decrease in Due From Banks | (52 | ) | (3,913 | ) | ||||
| Due from Banks at Beginning of Year | 1,046 | 4,959 | ||||||
| Due from Banks at End of Year | $ | 994 | $ | 1,046 | ||||
The accompanying Notes are an integral part of these financial statements (JSF-4).
166
JSF-4
ASIAN DEVELOPMENT BANK—JAPAN SPECIAL FUND
NOTES TO FINANCIAL STATEMENTS
31 December 2025 and 2024
NOTE A—NATURE OF OPERATIONS
The Asian Development Bank (ADB), a multilateral development bank, was established in 1966 with its headquarters in Manila, Philippines. ADB and its operations are governed by the Agreement Establishing the Asian Development Bank (the Charter). Its purpose is to foster economic development and co-operation in Asia and the Pacific region and to contribute to the acceleration of the process of economic development of the developing member countries (DMCs) in the region, collectively and individually. Since 1999, ADB’s corporate vision and mission has been to help DMCs reduce poverty in the region. This was reaffirmed under the long-term corporate strategy to 2030—Strategy 2030. Under Strategy 2030, ADB’s vision is to achieve a prosperous, inclusive, resilient, and sustainable Asia and the Pacific, while sustaining its efforts to eradicate extreme poverty. ADB will continue to prioritize the region’s poorest and most vulnerable countries. ADB provides financial and technical assistance for projects and programs, which will contribute to achieve this purpose. These are financed through ordinary capital resources (OCR) and Special Funds.1
The Japan Special Fund (JSF) was established in March 1988 when the Government of Japan and ADB entered into a financial arrangement whereby the Government of Japan agreed to make an initial contribution and ADB became the administrator. The purpose of JSF is to help developing member countries (DMCs) of ADB restructure their economies in the light of changing global environment and to broaden their investment opportunities.
In 2009, due to the global conditions and to align the assistance provided by the Government of Japan through other multilateral development banks, JSF’s role and function was transferred to the Japan Fund for Poverty Reduction to cover support for ADB’s technical assistance (TA) operations.
In January 2022, JSF operations resumed to maximize its benefits in supporting the needs of ADB’s DMCs through TA operations.
The Asian Currency Crisis Support Facility (ACCSF), funded by the Government of Japan, was established in March 1999 for a three-year period as a separate special-purpose component to JSF to complement ADB’s assistance in the economic recovery of crisis-affected member countries. With the general fulfillment of the purpose of the facility, the Government of Japan and ADB agreed to terminate the ACCSF in March 2002 and all projects were financially completed in 2011. In November 2021, the ACCSF account was closed after transferring its residual balance of $39,447,000 to JSF’s account, with this residual balance forming part of JSF and being used for JSF’s general objectives.
In October 2024, the Board of Directors approved the establishment of the Japan Special Fund Innovative Finance Facility for Climate in Asia and the Pacific Financing Partnership Facility (IF-CAP) Window (JSF IF-CAP Window) as a separate, special-purpose component of the JSF to channel the contribution of the Government of Japan to IF-CAP.2
ADB is immune from taxation pursuant to Chapter VIII, Article 56, Exemption from Taxation, of the Charter.
| 1 | Asian Development Fund (ADF), Technical Assistance Special Fund (TASF), Japan Special Fund (JSF), Asian Development Bank Institute (ADBI), Regional Cooperation and Integration Fund (RCIF), Climate Change Fund (CCF), Asia Pacific Disaster Response Fund (APDRF), and Financial Sector Development Partnership Special Fund (FSDPSF). |
| 2 | In the event of a nonaccrual in the reference portfolio under the IF-CAP Guarantee Mechanism, the Government of Japan’s payment of its share of risk participation will be channeled through the JSF IF-CAP Window. |
167
JSF-4
continued
NOTE B—SUMMARY OF SIGNIFICANT ACCOUNTING POLICIES
Presentation of the Financial Statements
The financial statements of the JSF are prepared in accordance with accounting principles generally accepted in the United States of America (US GAAP), and are presented on the basis of those for not-for-profit organizations and as net assets with and without donor restrictions.
The JSF reports donor’s contributed cash and other assets as support without donor restrictions as these are made available to the JSF without conditions other than for the purposes of pursuing the objectives of the JSF.
Functional and Reporting Currency
The US dollar is the functional and reporting currency, representing the currency of the primary economic operating environment of the JSF.
Translation of Currencies
ADB adopts the use of daily exchange rates for accounting and financial reporting purposes. This allows transactions denominated in non-US dollar currencies to be translated to the reporting currency using exchange rates applicable at the time of the transactions. Contributions included in the financial statements during the year are recognized at applicable exchange rates as of the respective dates of commitment. At the end of each accounting month, translations of assets and liabilities which are denominated in non-US dollar currencies are adjusted using the applicable exchange rates at the end of the reporting period. These translation adjustments are accounted for as exchange gains or losses and are credited or charged to operations.
Investments for Liquidity Purpose
All investments held by JSF are reported at fair value (FV). Interest income on time deposits is recognized as earned and reported in REVENUE FROM INVESTMENTS FOR LIQUIDITY PURPOSE.
Technical Assistance and Related Undisbursed Balance
TA is recognized as expense in the financial statements when the project becomes effective. Upon completion or cancellation of a TA project, any undisbursed committed balance is reversed. TA expenses are also reversed accordingly.
Fair Value of Financial Instruments
Accounting Standards Codification (ASC) 820, “Fair Value Measurement” defines FV as the price that would be received to sell an asset or paid to transfer a liability at measurement date in an orderly transaction among willing participants with an assumption that the transaction takes place in the entity’s principal market, or in the absence of principal market, in the most advantageous market for the asset or liability. The most advantageous market is the market where the sale of the asset or transfer of liability would maximize the amount received for the asset or minimize the amount paid to transfer the liability. The FV measurement is not adjusted for transaction costs.
Fair Value Hierarchy
ASC 820 establishes a FV hierarchy that gives the highest priority to quoted prices in active markets for identical assets or liabilities (Level 1), next priority to observable market inputs or market corroborated data (Level 2), and the lowest priority to unobservable inputs without market corroborated data (Level 3). The FVs of ADB’s financial assets and liabilities are categorized as follows:
168
JSF-4
continued
Level 1: FVs are based on unadjusted quoted prices for identical assets or liabilities in active markets.
Level 2: FVs are based on quoted prices for similar assets or liabilities in active markets or markets that are not active; or valuation models for which significant inputs are obtained from market-based data that are observable.
Level 3: FVs are based on prices or valuation models for which significant inputs to the model are unobservable.
Accounting Estimates
The preparation of financial statements in accordance with US GAAP requires Management to make reasonable estimates and assumptions that affect the reported amounts of assets and liabilities as of the end of the year and the reported amounts of revenue and expenses during the year. The actual results could differ from those estimates.
Accounting and Reporting Developments
In March 2024, the Financial Accounting Standards Board (FASB) issued Accounting Standard Update (ASU) 2024-02, “Codification Improvements – Amendments to Remove References to the Concepts Statements”. This Update contains amendments to the Codification that remove references to various FASB Concepts Statements. The amendments in this Update are effective for public business entities for fiscal years beginning after 15 December 2024. For all other entities, the amendments are effective for fiscal years beginning after 15 December 2025. Early adoption is permitted for all entities. ADB does not expect the adoption of this Update to have a material impact on the financial statements.
In December 2025, the FASB issued ASU 2025-11, “Interim Reporting (Topic 270): Narrow-Scope Improvements”—aimed at enhancing the structure and clarity of interim reporting guidance. The amendments reorganize existing disclosure requirements, define what constitutes interim financial statements and notes under GAAP (including SEC considerations where relevant), and introduce a new disclosure principle requiring entities to report material events occurring after the preceding annual reporting period. While the Update improves consistency and usability, it does not expand or reduce current disclosure requirements. The amendments are effective for public business entities for interim periods within annual reporting periods beginning after 15 December 2027, and one year later for all other entities, with early adoption permitted. Entities may apply the amendments prospectively or retrospectively. This Update is not expected to have a significant impact on JSF’s interim financial statements.
Additionally, the FASB issued ASU 2025-12, “Codification Improvements”, introducing clarifications, corrections, and other minor amendments across a wide range of Topics. These updates are designed to make the Codification easier to navigate and apply, particularly in areas where the original language may have caused confusion. The amendments take effect for all entities for annual reporting periods beginning after 15 December 2026, including the related interim periods. This Update is not expected to have a significant impact on JSF’s financial statements.
Statement of Cash Flows
For the purposes of the Statement of Cash Flows, the JSF considers that its cash and cash equivalents are limited to DUE FROM BANKS, which pertain to current accounts in banks used for operational disbursements.
169
JSF-4
continued
NOTE C—JSF IF-CAP WINDOW
In October 2024, the Board of Directors approved the establishment of the JSF IF-CAP Window as a separate, special-purpose component of the JSF to channel the contribution of the Government of Japan to the IF-CAP Guarantee Mechanism3. The Government of Japan elected to have guarantee premiums payable to them by ADB deposited into the JSF IF-CAP Window for future obligations under the IF-CAP Guarantee Mechanism. These premiums are settled by OCR and recorded as Other Liabilities upon receipt. As of 31 December 2025, total guarantee premiums received amounted to $6 thousand (nil—31 December 2024).
The following table provides a summary of financial information related to the JSF IF-CAP Window included in OTHER ASSETS and ACCOUNTS PAYABLE AND OTHER LIABILITIES as of 31 December 2025 and 31 December 2024:
| ($ thousand) | ||||||||
| 31 December 2025 | 31 December 2024 | |||||||
| Other Assets | $ | 6 | $ | – | ||||
| Other Liabilities | $ | 1 | $ | – | ||||
The JSF IF-CAP Window is administered by ADB under the governance structure of the JSF.
NOTE D—INVESTMENTS FOR LIQUIDITY PURPOSE
The main investment management objective is to maintain security and liquidity of funds invested. Subject to these parameters, ADB seeks the highest possible return on its investments. Investments are governed by the Investment Authority approved by the Board of Directors.
All investments for liquidity purpose held as of 31 December 2025 and 2024 were in US dollar time deposits.
The rate of return on the average investments for liquidity purpose held during the year ended 31 December 2025, based on the portfolio held at the beginning and end of each month, was 4.4% (5.4% – 2024).
Fair Value Disclosure
The FV of INVESTMENTS FOR LIQUIDITY PURPOSE as of 31 December 2025 and 2024 is as follows:
| ($ thousand) | ||||||||||||||||
| Fair Value Measurements | ||||||||||||||||
| Total | Level 1 | Level 2 | Level 3 | |||||||||||||
| 2025 | ||||||||||||||||
| Investments for liquidity purpose | ||||||||||||||||
| Time deposits | $ | 126,033 | $ | – | $ | 126,033 | $ | – | ||||||||
| 2024 | ||||||||||||||||
| Investments for liquidity purpose | ||||||||||||||||
| Time deposits | $ | 123,205 | $ | – | $ | 123,205 | $ | – | ||||||||
| 3 | In the event of a nonaccrual in the reference portfolio under the IF-CAP Guarantee Mechanism, the Government of Japan’s payment of its share of risk participation will be channeled through the JSF IF-CAP Window. |
170
JSF-4
continued
Time deposits are reported at cost, which approximates FV.
NOTE E—RELATED PARTY TRANSACTIONS
The OCR and Special Funds resources are at all times used, committed, and invested entirely separately from each other. The administrative and operational expenses pertaining to JSF are settled regularly with OCR and other funds. Regional technical assistance projects and programs may be combined activities financed by Special Funds and trust funds.
The interfund account balances included in ACCOUNTS PAYABLE AND OTHER LIABILITIES as of 31 December 2025 and 2024 are as follows:
| ($ thousand) | ||||||||
| 2025 | 2024 | |||||||
| Payable to: | ||||||||
| Ordinary capital resources—net | $ | 5 | $ | 9 | ||||
| Technical Assistance Special Fund—net | 26 | 68 | ||||||
| Trust Fund | – | 15 | ||||||
| Total | $ | 31 | $ | 92 | ||||
NOTE F—TECHNICAL ASSISTANCE AND UNDISBURSED TECHNICAL ASSISTANCE
For the year ended 31 December 2025, five TA projects and one supplementary TA (two TA projects and three supplementary TAs– 2024) became effective resulting in a total TA expense of $9,100,000 ($7,750,000 – 2024).
Undisbursed TA are denominated in US dollars and represent effective TA projects not yet disbursed and unliquidated. The undisbursed TA of $20,410,000 as of 31 December 2025 ($14,192,000 – 31 December 2024) includes $64,000 (2,000 – 31 December 2024) advances for TA.
NOTE G—UNCOMITTED BALANCES
Uncommitted balances comprise amounts which have not been committed by ADB as of 31 December 2025 and 2024.
NOTE H—EXPENSES
Technical assistance
TA expenses are classified according to its nature using the budget allocation specified in the relevant TA agreement for the TA projects that became effective during the year. The details of TA expenses for the years ended 31 December 2025 and 2024 are as follows:
| ($ thousand) | ||||||||
| 2025 | 2024 | |||||||
| Consultants | $ | 7,061 | $ | 5,355 | ||||
| Training and seminars | 1,076 | 1,189 | ||||||
| Studies | 240 | 445 | ||||||
| Other expenses | 723 | 761 | ||||||
| Total | $ | 9,100 | $ | 7,750 | ||||
171
JSF-4
continued
Administrative and financial expenses
Administrative expenses include salaries and benefits, and audit fees, which are incurred for management and general supporting activities. The following table summarizes administrative and financial expenses for the years ended 31 December 2025 and 2024:
| ($ thousand) | ||||||||
| 2025 | 2024 | |||||||
| Salaries and benefits | $ | 63 | $ | 59 | ||||
| Audit fees | 21 | 20 | ||||||
| Financial expenses | 3 | – | ||||||
| Total | $ | 87 | $ | 79 | ||||
NOTE I—LIQUIDITY AND AVAILABILITY OF RESOURCES
Liquidity risk refers to the risk that the fund has difficulties in meeting its short-term obligations. As part of JSF’s liquidity management, it has a policy to structure its financial assets to be available as its general expenditures, liabilities, and other obligations come due. In addition, JSF invests cash in excess of daily requirements in short-term investments.
As of 31 December 2025, the JSF has liquidity of $127,027,000 ($124,251,000 – 2024) consisting of DUE FROM BANKS of $994,000 ($1,046,000 – 2024) and INVESTMENTS FOR LIQUIDITY PURPOSE in time deposits of $126,033,000 ($123,205,000 – 2024), available within one year of the balance sheet date to meet cash needs for general expenditure.
NOTE J—OTHER FAIR VALUE DISCLOSURES
As of 31 December 2025 and 2024, JSF has no assets or liabilities measured at FV on a non-recurring basis. See Note C and E for discussions relating to investments for liquidity purpose and undisbursed technical assistance, respectively. In all other cases, the carrying amount of JSF’s assets and liabilities is considered to approximate FV.
NOTE K—SUBSEQUENT EVENTS
ADB has evaluated subsequent events after 31 December 2025 through 9 March 2026, the date these financial statements are available for issuance. As a result of this evaluation, there are no subsequent events that require recognition or disclosure in the JSF’s financial statements as of 31 December 2025.
172
| |
Deloitte & Touche LLP Tel: +65 6224 8288 |
INDEPENDENT AUDITOR’S REPORT
To the Board of Directors and the Board of Governors of
Asian Development Bank
Opinion
We have audited the financial statements of Asian Development Bank (“ADB”) – Asian Development Bank Institute, which comprise the statements of financial position as of 31 December 2025 and 2024, and the related statements of activities and changes in net assets, and cash flows for the years then ended, and the related notes to the financial statements.
In our opinion, the accompanying financial statements present fairly, in all material respects, the financial position of ADB - Asian Development Bank Institute as of 31 December 2025 and 2024, and the changes in its net assets and its cash flows for the years then ended in accordance with accounting principles generally accepted in the United States of America.
Basis for Opinion
We conducted our audits in accordance with auditing standards generally accepted in the United States of America (GAAS). Our responsibilities under those standards are further described in the Auditor’s Responsibilities for the Audit of the Financial Statements section of our report. We are required to be independent of ADB - Asian Development Bank Institute and to meet our other ethical responsibilities, in accordance with the relevant ethical requirements relating to our audits. We believe that the audit evidence we have obtained is sufficient and appropriate to provide a basis for our audit opinion.
Responsibilities of Management for the Financial Statements
Management is responsible for the preparation and fair presentation of these financial statements in accordance with accounting principles generally accepted in the United States of America, and for the design, implementation, and maintenance of internal control relevant to the preparation and fair presentation of financial statements that are free from material misstatement, whether due to fraud or error.
In preparing the financial statements, management is required to evaluate whether there are conditions or events, considered in the aggregate, that raise substantial doubt about ADB – Asian Development Bank Institute’s ability to continue as a going concern for one year after the date that the financial statements are available to be issued.
Deloitte & Touche LLP (Unique Entity No. T08LL0721A) is an accounting limited liability partnership registered in Singapore under the Limited Liability Partnerships Act (Chapter 163A).
173
Auditor’s Responsibility for the Audit of the Financial Statements
Our objectives are to obtain reasonable assurance about whether the financial statements as a whole are free from material misstatement, whether due to fraud or error, and to issue an auditor’s report that includes our opinion. Reasonable assurance is a high level of assurance but is not absolute assurance and therefore is not a guarantee that an audit conducted in accordance with GAAS will always detect a material misstatement when it exists. The risk of not detecting a material misstatement resulting from fraud is higher than for one resulting from error, as fraud may involve collusion, forgery, intentional omissions, misrepresentations, or the override of internal control. Misstatements are considered material if there is a substantial likelihood that, individually or in the aggregate, they would influence the judgment made by a reasonable user based on the financial statements.
In performing an audit in accordance with GAAS, we:
| ● | Exercise professional judgment and maintain professional skepticism throughout the audit. |
| ● | Identify and assess the risks of material misstatement of the financial statements, whether due to fraud or error, and design and perform audit procedures responsive to those risks. Such procedures include examining, on a test basis, evidence regarding the amounts and disclosures in the financial statements. |
| ● | Obtain an understanding of internal control relevant to the audit in order to design audit procedures that are appropriate in the circumstances. |
| ● | Evaluate the appropriateness of accounting policies used and the reasonableness of significant accounting estimates made by management, as well as evaluate the overall presentation of the financial statements. |
| ● | Conclude whether, in our judgment, there are conditions or events, considered in the aggregate, that raise substantial doubt about ADB – Asian Development Bank Institute’s ability to continue as a going concern for a reasonable period of time. |
We are required to communicate with those charged with governance regarding, among other matters, the planned scope and timing of the audit, significant audit findings, and certain internal control–related matters that we identified during the audit.
174
Other Information Included in the Annual Report
Management is responsible for the other information included in the annual report. The other information comprises the information included in the annual report but does not include the financial statements and our auditor’s report thereon. Our opinion on the financial statements does not cover the other information, and we do not express an opinion or any form of assurance thereon.
In connection with our audits of the financial statements, our responsibility is to read the other information and consider whether a material inconsistency exists between the other information and the financial statements, or the other information otherwise appears to be materially misstated. If, based on the work performed, we conclude that an uncorrected material misstatement of the other information exists, we are required to describe it in our report.
Public Accountants and
Chartered Accountants
Singapore
9 March 2026
175
ADBI-1
ASIAN DEVELOPMENT BANK—ASIAN DEVELOPMENT BANK INSTITUTE
STATEMENT OF FINANCIAL POSITION
31 December 2025 and 2024
Expressed in Thousands of US Dollars
| 2025 | 2024 | |||||||||||||||
| ASSETS | ||||||||||||||||
| DUE FROM BANKS (Note J) | $ | 9,491 | $ | 10,259 | ||||||||||||
| INVESTMENTS FOR LIQUIDITY PURPOSE (Notes C and J) | ||||||||||||||||
| Time deposits | 11,214 | 11,640 | ||||||||||||||
| PROPERTY, FURNITURE, AND EQUIPMENT (Notes D and E) | ||||||||||||||||
| Property, Furniture, and Equipment | $ | 2,807 | $ | 4,677 | ||||||||||||
| Less—allowance for depreciation | 2,094 | 713 | 2,003 | 2,674 | ||||||||||||
| DUE FROM CONTRIBUTORS (Note F) | 3,227 | 4,452 | ||||||||||||||
| LONG-TERM GUARANTEE DEPOSITS (Note E) | 910 | 908 | ||||||||||||||
| OTHER ASSETS | 233 | 470 | ||||||||||||||
| TOTAL | $ | 25,788 | $ | 30,403 | ||||||||||||
| LIABILITIES AND UNCOMMITTED BALANCES | ||||||||||||||||
| ACCOUNTS PAYABLE AND OTHER LIABILITIES | ||||||||||||||||
| Accrued pension and postretirement medical benefit costs (Note I) | $ | 3,733 | $ | 3,621 | ||||||||||||
| Asset reinstatement obligations (Note E) | 1,279 | 1,275 | ||||||||||||||
| Lease liability (Note E) | 313 | 2,190 | ||||||||||||||
| Others | 946 | $ | 6,271 | 1,463 | $ | 8,549 | ||||||||||
| UNCOMMITTED BALANCES (ADBI-2), represented by: | ||||||||||||||||
| Net assets without donor restrictions | 18,672 | 20,631 | ||||||||||||||
| Net assets with donor restrictions (Note G) | 845 | 19,517 | 1,223 | 21,854 | ||||||||||||
| TOTAL | $ | 25,788 | $ | 30,403 | ||||||||||||
The accompanying Notes are an integral part of these financial statements (ADBI-4).
176
ADBI-2
ASIAN DEVELOPMENT BANK—ASIAN DEVELOPMENT BANK INSTITUTE
STATEMENT OF ACTIVITIES AND CHANGES IN NET ASSETS
For the Years Ended 31 December 2025 and 2024
Expressed in Thousands of US Dollar
| 2025 | 2024 | |||||||
| CHANGES IN NET ASSETS WITHOUT DONOR RESTRICTIONS | ||||||||
| CONTRIBUTIONS (Note F) | $ | 8,748 | $ | 10,571 | ||||
| REVENUE | ||||||||
| From rental (Notes E and G) | 236 | 234 | ||||||
| From investments for liquidity purpose (Note C) | 474 | 600 | ||||||
| From other sources—net (Notes G and H) | 450 | 591 | ||||||
| NET ASSETS RELEASED FROM | ||||||||
| ASSETS WITH DONOR RESTRICTIONS (Note G) | 651 | 336 | ||||||
| Total | 10,559 | 12,332 | ||||||
| EXPENSES | ||||||||
| Administrative expenses (Notes G and H) | (7,713 | ) | (9,149 | ) | ||||
| Program expenses (Note G) | (4,717 | ) | (6,451 | ) | ||||
| Total | (12,430 | ) | (15,600 | ) | ||||
| CONTRIBUTIONS AND REVENUE LESS THAN EXPENSES | (1,871 | ) | (3,268 | ) | ||||
| EXCHANGE LOSSES—net | (70 | ) | (1,523 | ) | ||||
| TRANSLATION ADJUSTMENTS | 191 | 322 | ||||||
| POST RETIREMENT BENEFIT LIABILITY ADJUSTMENTS | (209 | ) | 135 | |||||
| DECREASE IN NET ASSETS WITHOUT DONOR RESTRICTIONS | (1,959 | ) | (4,334 | ) | ||||
| CHANGES IN NET ASSETS WITH DONOR RESTRICTIONS | ||||||||
| REVENUE FROM OTHER SOURCES (Note G) | 273 | 359 | ||||||
| NET ASSETS RELEASED TO ASSETS WITHOUT DONOR RESTRICTIONS (Note G) | (651 | ) | (336 | ) | ||||
| (DECREASE) INCREASE IN NET ASSETS WITH DONOR RESTRICTIONS | (378 | ) | 23 | |||||
| DECREASE IN NET ASSETS | (2,337 | ) | (4,311 | ) | ||||
| NET ASSETS AT BEGINNING OF YEAR | 21,854 | 26,165 | ||||||
| NET ASSETS AT END OF YEAR | $ | 19,517 | $ | 21,854 | ||||
The accompanying Notes are an integral part of these financial statements (ADBI-4).
177
ADBI-3
ASIAN DEVELOPMENT BANK—ASIAN DEVELOPMENT BANK INSTITUTE
STATEMENT OF CASH FLOWS
For the Years Ended 31 December 2025 and 2024
Expressed in Thousands of US Dollars
| 2025 | 2024 | |||||||
| CASH FLOWS FROM OPERATING ACTIVITIES | ||||||||
| Contributions received | $ | 9,932 | $ | 11,463 | ||||
| Interest received on investments for liquidity purpose | 474 | 607 | ||||||
| Expenses paid | (12,901 | ) | (15,054 | ) | ||||
| Others—net | 1,143 | 118 | ||||||
| Net Cash Used in Operating Activities | (1,352 | ) | (2,866 | ) | ||||
| CASH FLOWS FROM INVESTING ACTIVITIES | ||||||||
| Maturities of investments for liquidity purpose | 280,411 | 325,894 | ||||||
| Purchases of investments for liquidity purpose | (279,985 | ) | (326,801 | ) | ||||
| Property, furniture, and equipment acquired | – | (109 | ) | |||||
| Net Cash Provided by (Used in) Investing Activities | 426 | (1,016 | ) | |||||
| Effect of Exchange Rate Changes on Due from Banks | 158 | 627 | ||||||
| Net Decrease in Due From Banks | (768 | ) | (3,255 | ) | ||||
| Due From Banks at Beginning of Year | 10,259 | 13,514 | ||||||
| Due From Banks at End of Year | $ | 9,491 | $ | 10,259 | ||||
The accompanying Notes are an integral part of these financial statements (ADBI-4).
178
ADBI-4
ASIAN DEVELOPMENT BANK—ASIAN DEVELOPMENT BANK INSTITUTE
NOTES TO FINANCIAL STATEMENTS
31 December 2025 and 2024
NOTE A—NATURE OF OPERATIONS
The Asian Development Bank (ADB), a multilateral development bank, was established in 1966 with its headquarters in Manila, Philippines. ADB and its operations are governed by the Agreement Establishing the Asian Development Bank (the Charter). Its purpose is to foster economic development and co-operation in Asia and the Pacific region and to contribute to the acceleration of the process of economic development of the developing member countries (DMCs) in the region, collectively and individually. Since 1999, ADB’s corporate vision and mission has been to help DMCs reduce poverty in the region. This was reaffirmed under the long-term corporate strategy to 2030—Strategy 2030. Under Strategy 2030, ADB’s vision is to achieve a prosperous, inclusive, resilient, and sustainable Asia and the Pacific, while sustaining its efforts to eradicate extreme poverty. ADB will continue to prioritize the region’s poorest and most vulnerable countries. ADB provides financial and technical assistance for projects and programs, which will contribute to achieve this purpose. These are financed through ordinary capital resources (OCR) and Special Funds.1
In 1996, ADB approved the establishment of the Asian Development Bank Institute (the Institute) in Tokyo, Japan as a subsidiary body of ADB. The Institute commenced its operations upon the receipt of the first funds from Japan on 24 March 1997, and it was inaugurated on 10 December 1997. The Institute’s funds may consist of voluntary contributions, donations, and grants from ADB members, non-government organizations, and foundations. The special fund for the Institute is administered by ADB. The objectives of the Institute, as defined under its Statute, are to identify effective development strategies and capacity improvement for sound development management in developing member countries.
ADB is immune from taxation pursuant to Chapter VIII, Article 56, Exemption from Taxation, of the Charter.
NOTE B—SUMMARY OF SIGNIFICANT ACCOUNTING POLICIES
Presentation of the Financial Statements
The financial statements of the Institute are prepared in accordance with accounting principles generally accepted in the United States of America (US GAAP), and are presented on the basis of those for not-for-profit organizations.
The Institute reports donor’s contributed cash and other assets as support without donor restrictions as these are made available to the Institute without conditions other than for the purposes of pursuing the objectives of the Institute.
The Institute reports donor’s contributed cash and other assets as support with donor restrictions if they are received with donor stipulations that limit the use of the donated assets. When the donor restriction expires, that is, when a stipulated time or purpose restriction is accomplished, net assets with donor restrictions are reclassified to net assets without donor restrictions and reported in the Statement of Activities and Changes in Net Assets as NET ASSETS RELEASED TO ASSETS WITHOUT DONOR RESTRICTIONS.
Functional Currency and Reporting Currency
The functional currency of the Institute is yen, representing the currency of primary economic operating environment of the Institute. The reporting currency is the US dollar and the financial statements are expressed in US dollars.
| 1 | Asian Development Fund (ADF), Technical Assistance Special Fund (TASF), Japan Special Fund (JSF), Asian Development Bank Institute (ADBI), Regional Cooperation and Integration Fund (RCIF), Climate Change Fund (CCF), Asia Pacific Disaster Response Fund (APDRF), and Financial Sector Development Partnership Special Fund (FSDPSF). |
179
ADBI-4
continued
Translation of Currencies
Assets and liabilities are translated from the functional currency to the reporting currency at the applicable exchange rates at the end of a reporting period. Commitments included in the financial statements during the year are recognized at the applicable exchange rates as of the end of the month of commitment. Revenue and expense amounts are translated at the applicable exchange rates at the end of each month; such practice approximates the application of average rates in effect during the period. Translation adjustments are recorded as TRANSLATION ADJUSTMENTS and included in CHANGES IN NET ASSETS WITHOUT DONOR RESTRICTIONS.
Monetary assets and liabilities denominated in currency other than yen are translated into yen at year-end exchange rates. Exchange gains and losses are recorded as EXCHANGE LOSSES—net and included in the CHANGES IN NET ASSETS WITHOUT DONOR RESTRICTIONS.
Investments for Liquidity Purpose
All investments held by the Institute are reported at fair value (FV). Interest income on time deposits is recognized as earned and reported in REVENUE From investments for liquidity purpose.
Property, Furniture, and Equipment
Property, furniture, and equipment, except right-of-use asset, are stated at cost and depreciated over their estimated useful lives using the straight-line method. Maintenance, repairs and minor betterments are charged to expense. Expenditures amounting to more than $30,000 for a single asset or a combination of assets forming an integral part of a separate asset are capitalized.
Operating Lease
Right-of-use asset mainly pertains to lease of office space, classified as operating lease. The Institute does not have any finance lease. Right-of-use asset is derived from the lease liability, which is the present value of future lease payments using the applicable discount rate, adjusted by prepaid rent and deferred rent. Operating lease expenses are recognized on a straight-line basis.
The Institute determines whether a contract contains a lease if the contract conveys the right to control the use of identified property, plant or equipment for a period of time in exchange for a consideration. The Institute has included renewal options in determining the lease term when it is reasonably certain that the renewal option will be exercised. The Institute elects to use risk-free rate as the discount rate in determining the present value of future lease payments.
Contributions
Contributions from donors are included in the financial statements from the date committed.
Fair Value of Financial Instruments
Accounting Standards Codification (ASC) 820, “Fair Value Measurement” defines FV as the price that would be received to sell an asset or paid to transfer a liability at measurement date in an orderly transaction among willing participants with an assumption that the transaction takes place in the entity’s principal market, or in the absence of principal market, in the most advantageous market for the asset or liability. The most advantageous market is the market where the sale of the asset or transfer of liability would maximize the amount received for the asset or minimize the amount paid to transfer the liability. The FV measurement is not adjusted for transaction cost.
180
ADBI-4
continued
Fair Value Hierarchy
ASC 820 establishes a FV hierarchy that gives the highest priority to quoted prices in active markets for identical assets or liabilities (Level 1), next priority to observable market inputs or market corroborated data (Level 2), and the lowest priority to unobservable inputs without market corroborated data (Level 3).
The FVs of ADB’s financial assets and liabilities are categorized as follows:
Level 1: FVs are based on unadjusted quoted prices for identical assets or liabilities in active markets.
Level 2: FVs are based on quoted prices for similar assets or liabilities in active markets or markets that are not active; or valuation models for which significant inputs are obtained from market-based data that are observable.
Level 3: FVs are based on prices or valuation models for which significant inputs to the model are unobservable.
Accounting Estimates
The preparation of financial statements in accordance with US GAAP requires Management to make reasonable estimates and assumptions that affect the reported amounts of assets and liabilities as of the end of the year and the reported amounts of revenue and expenses during the year. The actual results could differ from those estimates.
Accounting and Reporting Developments
In March 2024, the Financial Accounting Standards Board (FASB) issued Accounting Standard Update (ASU) 2024-02, “Codification Improvements – Amendments to Remove References to the Concepts Statements”. This Update contains amendments to the Codification that remove references to various FASB Concepts Statements. The amendments in this Update are effective for public business entities for fiscal years beginning after 15 December 2024. For all other entities, the amendments are effective for fiscal years beginning after 15 December 2025. Early adoption is permitted for all entities. ADB does not expect the adoption of this Update to have a material impact on the financial statements.
In December 2025, the FASB issued ASU 2025-11, “Interim Reporting (Topic 270): Narrow-Scope Improvements”—aimed at enhancing the structure and clarity of interim reporting guidance. The amendments reorganize existing disclosure requirements, define what constitutes interim financial statements and notes under GAAP (including SEC considerations where relevant), and introduce a new disclosure principle requiring entities to report material events occurring after the preceding annual reporting period. While the Update improves consistency and usability, it does not expand or reduce current disclosure requirements. The amendments are effective for public business entities for interim periods within annual reporting periods beginning after 15 December 2027, and one year later for all other entities, with early adoption permitted. Entities may apply the amendments prospectively or retrospectively. This Update is not expected to have a significant impact on the Institute’s interim financial statements.
Additionally, the FASB issued ASU 2025-12, “Codification Improvements”, introducing clarifications, corrections, and other minor amendments across a wide range of Topics. These updates are designed to make the Codification easier to navigate and apply, particularly in areas where the original language may have caused confusion. The amendments take effect for all entities for annual reporting periods beginning after 15 December 2026, including the related interim periods. This Update is not expected to have a significant impact on the Institute’s financial statements.
Statement of Cash Flows
For the purposes of the Statement of Cash Flows, the Institute considers that its cash and cash equivalents are limited to DUE FROM BANKS, which consists of cash on hand and current accounts in banks used for operational disbursements.
181
ADBI-4
continued
NOTE C—INVESTMENTS FOR LIQUIDITY PURPOSE
The main investment management objective is to maintain security and liquidity of funds invested. Subject to these parameters, ADB seeks the highest possible return on the Institute’s investments. Investments are governed by the Investment Authority approved by the ADB Board of Directors.
All investments for liquidity purpose held as of 31 December 2025 and 2024 were in US dollar time deposits. ADB records time deposits on the settlement dates and all other investment securities on the trade date.
The rates of return on the average investments for liquidity purpose held during the year ended 31 December 2025 was 4.4% (5.4% – 2024).
Fair Value Disclosure
The FV of INVESTMENTS FOR LIQUIDITY PURPOSE as of 31 December 2025 and 2024 is as follows:
| ($ thousand) | ||||||||||||||||
| Fair Value Measurements | ||||||||||||||||
| Total | Level 1 | Level 2 | Level 3 | |||||||||||||
| 2025 | ||||||||||||||||
| Investments for liquidity purpose | ||||||||||||||||
| Time deposits | $ | 11,214 | $ | – | $ | 11,214 | $ | – | ||||||||
| 2024 | ||||||||||||||||
| Investments for liquidity purpose | ||||||||||||||||
| Time deposits | $ | 11,640 | $ | – | $ | 11,640 | $ | – | ||||||||
Time deposits are reported at cost, which approximates FV.
NOTE D—PROPERTY, FURNITURE, AND EQUIPMENT
As of 31 December 2025, property, furniture and equipment was $713,000 ($2,674,000 – 2024), which consists of $27,000 for office furniture ($42,000 – 2024), $ 73,000 for office equipment ($94,000 – 2024), $143,000 for information system and software ($192,000 – 2024), and $470,000 for right-of-use asset relating to the Institute’s office lease ($2,346,000 – 2024). Additional information on right-of-use asset is provided in Note E.
182
ADBI-4
continued
The changes in office furniture, fixtures, equipment, and information system and software during 2025 and 2024, as well as information pertaining to accumulated depreciation, are as follows:
| ($ thousand) | ||||||||||||||||||||||||||||||||
| 2025 | 2024 | |||||||||||||||||||||||||||||||
| Information | Information | |||||||||||||||||||||||||||||||
| system and | system and | |||||||||||||||||||||||||||||||
| OTEC | Furniture | Equipment | software | OTEC | Furniture | Equipment | software | |||||||||||||||||||||||||
| Cost: | ||||||||||||||||||||||||||||||||
| Balance, 1 January | $ | 1,715 | $ | 115 | $ | 256 | $ | 245 | $ | 1,907 | $ | 128 | $ | 164 | $ | 272 | ||||||||||||||||
| Additions during the year | – | – | – | – | – | – | 109 | – | ||||||||||||||||||||||||
| Disposals during the year | – | – | – | – | – | – | – | – | ||||||||||||||||||||||||
| Translation adjustments | 5 | 0 | 1 | 0 | (192 | ) | (13 | ) | (17 | ) | (27 | ) | ||||||||||||||||||||
| Balance, 31 December | 1,720 | 115 | 257 | 245 | 1,715 | 115 | 256 | 245 | ||||||||||||||||||||||||
| Accumulated Depreciation: | ||||||||||||||||||||||||||||||||
| Balance, 1 January | (1,715 | ) | (73 | ) | (162 | ) | (53 | ) | (1,907 | ) | (64 | ) | (164 | ) | (5 | ) | ||||||||||||||||
| Depreciation during the year | – | (16 | ) | (23 | ) | (51 | ) | – | (16 | ) | (15 | ) | (51 | ) | ||||||||||||||||||
| Disposals during the year | – | – | – | – | – | – | – | – | ||||||||||||||||||||||||
| Translation adjustments | (5 | ) | 1 | 1 | 2 | 192 | 7 | 17 | 3 | |||||||||||||||||||||||
| Balance, 31 December | (1,720 | ) | (88 | ) | (184 | ) | (102 | ) | (1,715 | ) | (73 | ) | (162 | ) | (53 | ) | ||||||||||||||||
| Net Book Value, 31 December | $ | – | $ | 27 | $ | 73 | $ | 143 | $ | – | $ | 42 | $ | 94 | $ | 192 | ||||||||||||||||
0 = less than $500. OTEC = one-time establishment cost.
NOTE E—LEASE
Right-of-use asset and Lease liability
The Institute’s right-of-use asset and lease liability pertain to its leased office space, classified as an operating lease. Rental expenses under operating lease for the year ended 31 December 2025 amounted to $1,964,000 ($1,960,000 – 2024). As of 31 December 2025, the right-of-use asset of $470,000 ($2,346,000 – 2024), which included prepaid rent of $157,000 ($156,000 – 2024), was presented as part of PROPERTY, FURNITURE, AND EQUIPMENT. The lease liability of $313,000 as of 31 December 2025 ($2,190,000 – 2024) was presented as part of ACCOUNTS PAYABLE AND OTHER LIABILITIES in the Institute’s Statement of Financial Position.
The Institute’s lease agreement for its office space was renewed until 31 March 2026. The Institute’s sublease agreement for a part of its office space was also renewed accordingly. The sublease has been classified as an operating lease. Additional information on the sublease is provided in Note G.
Additional information on the Institute’s operating lease are as follows:
| ($ thousand) | ||||||||
| 2025 | 2024 | |||||||
| Operating lease expensea | $ | 1,964 | $ | 1,960 | ||||
| Revenue from rental (Note G) | (236 | ) | (234 | ) | ||||
| Net lease expense | $ | 1,728 | $ | 1,726 | ||||
| Cash paid for operating lease included in cash flows from operating activities | $ | 1,964 | $ | 1,960 | ||||
| Remaining lease term | 0.25 years | 1.25 years | ||||||
| Discount rate—risk-free rate | 0 | % | 0 | % | ||||
a Included in Administrative expenses (Note G).
183
ADBI-4
continued
The Institute’s operating lease liability will mature within one year.
Long-term guarantee deposits
The Institute leases office space and deposits the equivalent of six months of office rent to the lessor, as stipulated in the contract of lease signed in 1997. The amount is updated every contract renewal. The last renewal date was 1 April 2023. As of 31 December 2025, the LONG-TERM GUARANTEE DEPOSITS presented in the Institute’s Statement of Financial Position amounted to $910,000 ($908,000 – 2024).
Asset reinstatement obligations
The Institute has recorded estimated asset reinstatement obligations for restoration costs to be incurred upon termination of its office space lease. As of 31 December 2025, asset reinstatement obligations amounted to $1,279,000 ($1,275,000 – 2024) and presented as part of ACCOUNTS PAYABLE AND OTHER LIABILITIES in the Institute’s Statement of Financial Position.
NOTE F—CONTRIBUTIONS
Contributions pertain to donations from governments of ADB members and are approved by the ADB Board of Directors. Contributions are recognized in the Statement of Activities and Changes in Net Assets at date of commitment.
Contributions committed and received during the years ended 31 December 2025 and 2024 are as follows:
| (in thousands) | |||||||||||||||
| Amount of commitment | Commitment | ||||||||||||||
| Donor | LC | USD | date | Receipt date | |||||||||||
| Government of Japan | |||||||||||||||
| 47th contribution | ¥ | 504,777 | $ | 3,241 | December 2025 | January 2026 | |||||||||
| 46th contribution | ¥ | 504,777 | $ | 3,507 | June 2025 | June 2025 | |||||||||
| 45th contribution | ¥ | 672,069 | $ | 4,285 | December 2024 | January 2025 | |||||||||
| 44th contribution | ¥ | 672,070 | $ | 4,286 | May 2024 | June 2024 | |||||||||
| 43rd contribution | ¥ | 743,069 | $ | 5,268 | December 2023 | January 2024 | |||||||||
| Government of Republic of Korea | |||||||||||||||
| 4th installment of 6th contribution | $ | 1,000 | September 2025 | October 2025 | |||||||||||
| 3rd installment of 6th contribution | $ | 1,000 | May 2025 | May 2025 | |||||||||||
| 2nd installment of 6th contribution | $ | 1,000 | October 2024 | October 2024 | |||||||||||
| 1st installment of 6th contribution | $ | 1,000 | May 2024 | May 2024 | |||||||||||
| Government of Malaysia | |||||||||||||||
| 3rd installment of 1st contribution | $ | 166 | July 2023 | October 2025 | |||||||||||
| 2nd installment of 1st contribution | $ | 167 | July 2023 | October 2024 | |||||||||||
LC = local currency, USD = US dollar.
NOTE G—REVENUE AND EXPENSES
Revenue from rental
Revenue from rental consists of sublease rental income totaling $236,000 for the year ended 31 December 2025 ($234,000 – 2024) received according to a space- sharing agreement with the Japanese Representative Office of ADB. The transactions with ADB were made in the ordinary course of business and negotiated at arm’s length. See Note H.
Revenue from other sources
Revenue from other sources include service fees to OCR (See Note H), fees from honorariums, publication royalties, and grants from private donors and other government agencies.
184
ADBI-4
continued
Grants received from private donors and other government agencies for a specific purpose or program are classified as support with donor restrictions. During the year ended 31 December 2025, grants totaling $250,000 were committed ($333,000 – 2024) and are included in REVENUE FROM OTHER SOURCES.
As of 31 December 2025, receivable from private donors totaled $100,000 ($ 292,000 – 2024) and is included under OTHER ASSETS. The net assets with donor restrictions including net accumulated interest income totaled $845,000 as of 31 December 2025 ($1,223,000 – 2024) and are restricted for (i) programs on inclusive sanitation, climate-resilient agriculture, and food security in the Asia-Pacific region, and (ii) research and initiatives that expand investment in climate adaptation and resilience projects benefitting the most vulnerable populations in Asia.
For the year ended 31 December 2025, net assets totaling $651,000 were released from assets with donor restrictions and reclassified to net assets without donor restrictions, upon satisfaction of the conditions specified by the donors ($336,000 – 2024).
Administrative expenses
Administrative expenses include salaries and benefits, office and occupancy, external services, travel, and other expenses, which are incurred for management and general supporting activities. The following table summarizes administrative expenses for the years ended 31 December 2025 and 2024:
| ($ thousand) | ||||||||
| 2025 | 2024 | |||||||
| Salaries and benefits | $ | 3,940 | $ | 4,608 | ||||
| Office and occupancya | 2,377 | 3,057 | ||||||
| External services | 886 | 871 | ||||||
| Travel | 398 | 514 | ||||||
| Other expenses | 112 | 99 | ||||||
| Total Administrative Expenses | $ | 7,713 | $ | 9,149 | ||||
a Includes operating lease expense (Note E).
Program expenses
Program expenses generally represent trainings and seminars and consultant expenses related to research and capacity building projects of the Institute. The following table summarizes program expenses for the years ended 31 December 2025 and 2024:
| ($ thousand) | ||||||||
| 2025 | 2024 | |||||||
| Trainings and seminars | $ | 3,421 | $ | 5,248 | ||||
| Consultants | 1,296 | 1,203 | ||||||
| Total Program Expenses | $ | 4,717 | $ | 6,451 | ||||
NOTE H—RELATED PARTY TRANSACTIONS
ADB has not allocated service fees to the Institute for a range of administrative and financial services such as managing the investments or administering the Staff Retirement Plan (SRP) and Health Benefit Plan for Retirees (HBPR). The fair value of those personnel services has been estimated to be 10 basis points of the average balance of the Institute’s liquid assets. For the year ended 31 December 2025, the calculated service fee was $19,000 ($22,000 – 2024) and recorded as Administrative expenses and REVENUE From other sources—net. The transaction has no impact on the net assets of the Institute.
185
ADBI-4
continued
The Institute is a lessor in a sublease agreement with the Japan Representative Office of ADB. For the year ended 31 December 2025, the revenue from the sublease rental amounted to $236,000 ($234,000 – 2024). See Note G.
Included in ACCOUNTS PAYABLE AND OTHER LIABILITIES were the amounts net payable to OCR of $297,000 at 31 December 2025 ($715,000 – 2024). The payable resulted from transactions in the normal course of business.
NOTE I—STAFF PENSION AND POSTRETIREMENT MEDICAL BENEFITS
Eligible employees of the Institute are entitled by its Statute to be participants of ADB’s defined benefit SRP. An eligible employee, as defined under SRP, shall, as a condition of service, become a participant from the first day of service, provided the employee has not reached the normal retirement age at that time, which is 60 for staff on board before 1 October 2017; 62 for staff who joined on or after 1 October 2017 and before 1 October 2021; and 65 for staff who joined on or after 1 October 2021. Retirement benefits are based on an annual accrual rate, length of service and the highest average remuneration observed over 2 consecutive years during eligible service for staff on board before 1 October 2017. For staff hired on or after 1 October 2017, the salary basis for a pension is the highest average three years remuneration, capped at $121,036 as of 31 December 2025 ($115,492 – 2024), adjusted each year in line with the structural increase in US dollar salary scales of International Staff based at headquarters. The SRP assets are segregated in a separate fund. The costs of administering the SRP are absorbed by ADB, except for fees paid to the investment managers and related charges, including custodian fees, which are borne by the SRP.
Participants hired prior to 1 October 2006 are required to contribute 9 1/3% of their salary to the SRP while those hired on or after 1 October 2006 are not required to contribute. The annual pension accrual rate is 2.95% for staff hired prior to 1 October 2006 and 1.5% for those hired on or after 1 October 2006. The Institute’s contribution is determined at a rate sufficient to cover that part of the costs of the SRP not covered by the participants’ contributions.
Participants hired before 1 October 2017 may make Discretionary Benefit (XB) contributions. Such contributions earn a prescribed interest crediting rate and benefits are payable to the Participants who reach retirement age or upon termination of employment.
In October 2017, ADB introduced a defined contribution (DC) Plan. Participants hired on or after 1 October 2017 may contribute up to 40% of salary into the DC Plan. The Institute will make additional contributions to a participant’s DC account equal to 20% of the participant’s salary above the predefined threshold. The Institute will match participant’s contributions at a ratio of $1 to each $8 (1:8), capped at 12% of salary. For the year ended 31 December 2025, the Institute contributed $143,000 to the DC Plan ($152,000 – 2024).
Expected Contributions
The Institute’s contribution to the SRP varies from year to year, as determined by the Pension Committee, which bases its judgment on the results of annual actuarial valuations of the assets and liabilities of the plan. The Institute is expected to contribute $269,000 to the SRP for 2026 based on the budgeted contribution of 25% of salary of Institute participants.
The Institute’s staff members are not expected to contribute to the SRP in 2026.
Investment Strategy
Contributions in excess of current benefits payments are invested in international financial markets and in a variety of investment vehicles. The SRP employs 11 external asset managers and 1 global custodian who are required to operate within the guidelines established by the SRP’s Investment Committee. The investment of these assets, over the long term, is expected to produce returns higher than short- term investments. The investment policy incorporates the SRP’s package of desired investment return and tolerance for risk, taking into account the nature and duration of its liabilities. The SRP’s assets are diversified among different markets and different asset classes. The use of derivatives for speculation, leverage or taking risks is avoided. Selected derivatives are used for hedging and transactional efficiency purposes.
186
ADBI-4
continued
The SRP’s investment policy is periodically reviewed and revised. The SRP’s long-term target asset-mix implemented in 2025 is 22% global equity, 8.5% global real assets, and 69.5% global fixed income, global credit and inflation-linked bonds.
For the year ended 31 December 2025, the net return on the SRP assets was 10.63% (8.08% – 2024). The Institute expects the long-term rate of return on the assets to be 6.00% (6.25% – 2024).
Assumptions
The assumed overall rate of return takes into account long-term return expectations of the underlying asset classes within the investment portfolio mix. Return expectations are forward looking and, in general, not much weight is given to short- term experience. Unless there is a drastic change in investment policy or market environment, as well as in the liability/benefit policy side, the assumed average long term investment return on the SRP’s assets is expected to remain on average broadly the same, year to year. The discount rate used in determining the benefit obligation is selected in reference to the rates of return on high-quality bonds.
Health Benefit Plan for Retirees
The Health Benefit Plan for Retirees (HBPR) is a self-insured plan. The Institute participates in ADB’s cost-sharing arrangement for this plan. Under this plan, the Institute subsidizes 75% of healthcare costs below the stop loss limit incurred by retirees. Retirees include retired staff, as well as their eligible dependents who elected to participate in the plan.
The Retiree Medical Plan Fund (RMPF) holds the assets in trust that will fund the accumulated obligations of the HBPR. As of 31 December 2025 and 2024, the Institute does not have assets in the RMPF.
The costs of administering the RMPF are absorbed by ADB, while investment management and custodian fees are paid from the RMPF.
Expected Contributions
The Institute’s expected contribution to the RMPF is determined based on the recommendation of the SRP Pension Committee. The Institute has not been required to make contributions and is not expected to contribute to the RMPF in 2026.
187
ADBI-4
continued
The following table sets forth the Institute’s participants’ pension and postretirement medical benefits at 31 December 2025 and 2024:
| ($ thousand) | ||||||||||||||||
| Pension Benefits | Postretirement Medical Benefits |
|||||||||||||||
| 2025 | 2024 | 2025 | 2024 | |||||||||||||
| Change in plan assets: | ||||||||||||||||
| Fair value of plan assets at beginning of year | $ | 7,787 | $ | 7,502 | $ | – | $ | – | ||||||||
| Actual return on plan assets | 808 | 592 | – | – | ||||||||||||
| Employer’s contribution | 291 | 318 | – | – | ||||||||||||
| Benefits paid | (710 | ) | (625 | ) | – | – | ||||||||||
| Fair value of plan assets at end of year | $ | 8,176 | $ | 7,787 | $ | – | $ | – | ||||||||
| Change in benefit obligation: | ||||||||||||||||
| Benefit obligation at beginning of year | $ | 11,193 | $ | 11,120 | $ | 215 | $ | 232 | ||||||||
| Service cost | 168 | 197 | 56 | 54 | ||||||||||||
| Interest cost | 638 | 583 | 16 | 16 | ||||||||||||
| Actuarial loss (gain) | 276 | (82 | ) | 57 | (87 | ) | ||||||||||
| Benefits paid | (710 | ) | (625 | ) | – | – | ||||||||||
| Benefit obligation at end of year | $ | 11,565 | $ | 11,193 | $ | 344 | $ | 215 | ||||||||
| Funded Status | $ | (3,389 | ) | $ | (3,406 | ) | $ | (344 | ) | $ | (215 | ) | ||||
| Amounts recognized in the Statement of Financial Position consist of: | ||||||||||||||||
| Accrued pension and postretirement medical benefit costs | $ | (3,389 | ) | $ | (3,406 | ) | $ | (344 | ) | $ | (215 | ) | ||||
| Amounts recognized in the Unrestricted net assets as Pension/Postretirement liability adjustments | $ | (2,383 | ) | $ | (2,475 | ) | $ | (823 | ) | $ | (940 | ) | ||||
| Weighted-average assumptions as of 31 December (%) | ||||||||||||||||
| Discount rate | 5.60 | 5.80 | 6.10 | 6.10 | ||||||||||||
| Expected return on plan assets | 6.00 | 6.25 | N/A | N/A | ||||||||||||
| Rate of compensation increase varies with age and averages | 2.50 | 2.50 | N/A | N/A | ||||||||||||
| Interest crediting rate | 5.00 | 5.00 | N/A | N/A | ||||||||||||
The Institute’s accumulated benefit obligation of the pension plan as of 31 December 2025 was $11,539,000 ($11,167,000 – 2024). The actuarial losses of $276,000 for pension benefit obligation and $57,000 for postretirement medical benefit obligation were mainly due to the change in discount rate assumption and salary scales and medical cost trend increases.
For measurement purposes, a 10.0% annual medical cost trend rate of increase in the per capita cost of covered postretirement medical benefits was assumed for the valuation as of 31 December 2025 (6.5% – 2024). The rate was assumed to decrease gradually to 6.0% by 2034 and remain at that level thereafter.
188
ADBI-4
continued
The following table summarizes the benefit costs associated with pension and postretirement medical benefits for the years ended 31 December 2025 and 2024:
($ thousand)
| Pension Benefits | Postretirement Medical Benefits |
|||||||||||||||
| 2025 | 2024 | 2025 | 2024 | |||||||||||||
| Components of net periodic benefit cost: Service cost | $ | 168 | $ | 197 | $ | 56 | $ | 54 | ||||||||
| Interest cost | 638 | 583 | 16 | 16 | ||||||||||||
| Expected return on plan assets | (479 | ) | (444 | ) | – | – | ||||||||||
| Amortization of prior service credit | (11 | ) | (11 | ) | – | – | ||||||||||
| Recognized actuarial gain | (134 | ) | (111 | ) | (60 | ) | (60 | ) | ||||||||
| Net periodic benefit cost | $ | 182 | $ | 214 | $ | 12 | $ | 10 | ||||||||
All components of the net periodic benefit cost are included in Administrative expenses in the Statement of Activities and Changes in Net Assets.
Estimated Future Benefits Payments
The following table shows the benefit payments expected to be paid in each of the next five years and subsequent five years. The expected benefit payments are based on the same assumptions used to measure the benefit obligation at 31 December 2025.
| ($ thousand) | ||||||||||
| Pension | Postretirement | |||||||||
| Benefits | Medical Benefits | |||||||||
| 2026 | $ | 739 | $ | 4 | ||||||
| 2027 | 748 | 5 | ||||||||
| 2028 | 775 | 5 | ||||||||
| 2029 | 784 | 6 | ||||||||
| 2030 | 778 | 6 | ||||||||
| 2031-2035 | 4,323 | 69 | ||||||||
189
ADBI-4
continued
Fair Value Disclosure
The following table shows the FV of the Institute’s SRP assets measured on a recurring basis as of 31 December 2025 and 2024:
| ($ thousand) | ||||||||||||||||
| Fair Value Measurements | ||||||||||||||||
| Total | Level 1 | Level 2 | Level 3 | |||||||||||||
| 31 December 2025 | ||||||||||||||||
| Cash and cash equivalents | $ | 53 | $ | – | $ | 53 | $ | – | ||||||||
| Common/preferred stocks | 1,665 | 1,664 | 1 | – | ||||||||||||
| Investment funds | 1,570 | 772 | 798 | – | ||||||||||||
| Government or government-related securities | 2,046 | 1,731 | 315 | – | ||||||||||||
| Corporate debt securities | 2,819 | 2,791 | 28 | – | ||||||||||||
| Mortgage/asset-backed securities: | ||||||||||||||||
| Mortgage-backed securities | 29 | – | 29 | – | ||||||||||||
| Collateralized mortgage obligations | 49 | 2 | 47 | – | ||||||||||||
| Asset-backed securities | 13 | 13 | – | – | ||||||||||||
| Short-term investments | 19 | – | 19 | – | ||||||||||||
| Derivatives | 3 | (1 | ) | 4 | – | |||||||||||
| Other asset/liabilitiesa—net | (90 | ) | – | (90 | ) | – | ||||||||||
| Total fair value of SRP assets | $ | 8,176 | $ | 6,972 | $ | 1,204 | $ | – | ||||||||
| 31 December 2024 | ||||||||||||||||
| Cash and cash equivalents | $ | 55 | $ | – | $ | 55 | $ | – | ||||||||
| Common/preferred stocks | 2,946 | 2,946 | – | – | ||||||||||||
| Investment funds | 1,807 | 1,354 | 453 | – | ||||||||||||
| Government or government-related securities | 1,188 | 823 | 365 | – | ||||||||||||
| Corporate debt securities | 1,736 | 1,680 | 56 | – | ||||||||||||
| Mortgage/asset-backed securities: | ||||||||||||||||
| Mortgage-backed securities | 31 | 11 | 20 | – | ||||||||||||
| Collateralized mortgage obligations | 20 | 3 | 17 | – | ||||||||||||
| Asset-backed securities | 27 | 27 | – | – | ||||||||||||
| Short-term investments | 30 | – | 30 | – | ||||||||||||
| Derivatives | 3 | (2 | ) | 5 | – | |||||||||||
| Other asset/liabilitiesa—net | (56 | ) | – | (56 | ) | – | ||||||||||
| Total fair value of SRP assets | $ | 7,787 | $ | 6,842 | $ | 945 | $ | – | ||||||||
a Incudes receivables and liabilities carried at amounts that approximate fair value.
The FV of the SRP investments including equity securities, fixed income securities and derivatives are provided by independent pricing providers. Equity securities include common and preferred stocks and mutual funds. Fixed income securities include government or government-related securities, corporate obligations, asset and mortgage-backed securities, and short-term investments. Derivatives include futures, swaps and currency forward contracts.
The following table presents the changes in the carrying amounts of the Institute’s SRP Level 3 investments for the year ended 31 December 2024. There were no SRP Level 3 investments during 2025.
| ($ thousand) | ||||
| Corporate debt | ||||
| securities | ||||
| 2024 | ||||
| Balance, beginning of the year | $ | 4 | ||
| Transfer out of Level 3 | (4 | ) | ||
| Balance, end of the year | $ | – | ||
190
ADBI-4
continued
NOTE J—LIQUIDITY AND AVAILABILITY OF RESOURCES
Liquidity risk refers to the risk that the fund has difficulties in meeting its short-term obligations. As part of the Institute’s liquidity management, it has a policy to structure its financial assets to be available as its general expenditures, liabilities, and other obligations come due. In addition, the Institute invests cash in excess of daily requirements in short-term investments.
As of 31 December 2025, the Institute has liquidity of $20,705,000 ($21,899,000 – 2024) consisting of DUE FROM BANKS of $9,491,000 ($10,259,000 – 2024) and INVESTMENTS FOR LIQUIDITY PURPOSE in time deposits of $11,214,000 ($11,640,000 – 2024), available within one year of the balance sheet date to meet cash needs for general expenditure. See Note G for discussions relating to donor restrictions on the Institute’s uncommitted balance.
NOTE K—OTHER FAIR VALUE DISCLOSURES
As of 31 December 2025 and 2024, the Institute has no assets or liabilities measured at FV on a non-recurring basis. See Note C for discussions relating to investments for liquidity purpose. In all other cases, the carrying amounts of the Institute’s assets and liabilities are considered to approximate FVs.
NOTE L—SUBSEQUENT EVENTS
The Institute has evaluated subsequent events after 31 December 2025 through 9 March 2026, the date these financial statements are available for issuance. As a result of this evaluation, there are no subsequent events that require recognition or disclosure in the Institute’s financial statements as of 31 December 2025.
191
REGIONAL COOPERATION AND INTEGRATION FUND
MANAGEMENT’S REPORT ON INTERNAL CONTROL OVER FINANCIAL REPORTING
The management of Asian Development Bank (“ADB”) is responsible for designing, implementing, and maintaining effective internal control over financial reporting. ADB’s internal control over financial reporting is a process designed to provide reasonable assurance regarding the preparation of reliable financial statements in accordance with generally accepted accounting principles in the United States of America.
ADB’s internal control over financial reporting includes those policies and procedures that (i) pertain to the maintenance of records that, in reasonable detail, accurately and fairly reflect the transactions and dispositions of the assets of ADB; (ii) provide reasonable assurance that transactions are recorded as necessary to permit preparation of financial statements in accordance with generally accepted accounting principles in the United States of America, and that receipts and expenditures of ADB are being made only in accordance with authorizations of management and directors of ADB; and (iii) provide reasonable assurance regarding prevention, or timely detection and correction, of unauthorized acquisition, use, or disposition of ADB’s assets that could have a material effect on the financial statements.
Because of its inherent limitations, internal control over financial reporting may not prevent, or detect and correct, misstatements. Also, projections of any assessment of effectiveness to future periods are subject to the risk that controls may become inadequate because of changes in conditions, or that the degree of compliance with the policies or procedures may deteriorate.
ADB’s management assessed the effectiveness of ADB’s internal control over financial reporting as of 31 December 2025, based on the criteria established in Internal Control – Integrated Framework (2013) issued by the Committee of Sponsoring Organizations of the Treadway Commission. Based on that assessment, management concluded that ADB’s internal control over financial reporting is effective as of 31 December 2025.
Masato Kanda
President
Roberta Casali
Vice-President (Finance and Risk Management)
Helen Hall
Controller
9 March 2026
192
|
Deloitte & Touche LLP Unique Entity No. T08LL0721A 6 Shenton Way OUE Downtown 2 #33-00 Singapore 068809
Tel: +65 6224 8288 Fax: +65 6538 6166 www.deloitte.com/sg |
INDEPENDENT AUDITOR’S REPORT
To the Board of Directors and the Board of Governors of
Asian Development Bank
Opinion on Internal Control Over Financial Reporting
We have audited the internal control over financial reporting of Asian Development Bank (“ADB”) as of 31 December 2025, based on the criteria established in Internal Control — Integrated Framework (2013) issued by the Committee of Sponsoring Organizations of the Treadway Commission (COSO). In our opinion, ADB maintained, in all material respects, effective internal control over financial reporting as of 31 December 2025, based on the criteria established in Internal Control — Integrated Framework (2013) issued by COSO.
We also have audited, in accordance with auditing standards generally accepted in the United States of America (GAAS), the financial statements as of and for the years ended 31 December 2025 and 2024 of ADB – Regional Cooperation and Integration Fund, and our report dated 9 March 2026 expressed an unmodified opinion on those financial statements.
Basis for Opinion
We conducted our audit in accordance with GAAS. Our responsibilities under those standards are further described in the Auditor’s Responsibilities for the Audit of Internal Control over Financial Reporting section of our report. We are required to be independent of ADB and to meet our other ethical responsibilities, in accordance with the relevant ethical requirements relating to our audit. We believe that the audit evidence we have obtained is sufficient and appropriate to provide basis for our audit opinion.
Responsibilities of Management for Internal Control over Financial Reporting
Management is responsible for designing, implementing, and maintaining effective internal control over financial reporting, and for its assessment about the effectiveness of internal control over financial reporting, included in the accompanying Management’s Report on Internal Control over Financial Reporting.
Deloitte & Touche LLP (Unique Entity No. T08LL0721A) is an accounting limited liability partnership registered in Singapore under the Limited Liability Partnerships Act (Chapter 163A).
193
Auditor’s Responsibilities for the Audit of Internal Control over Financial Reporting
Our objectives are to obtain reasonable assurance about whether effective internal control over financial reporting was maintained in all material respects and to issue an auditor’s report that includes our opinion on internal control over financial reporting. Reasonable assurance is a high level of assurance but is not absolute assurance and therefore is not a guarantee that an audit of internal control over financial reporting conducted in accordance with GAAS will always detect a material weakness when it exists.
In performing an audit of internal control over financial reporting in accordance with GAAS, we:
| ● | Exercise professional judgment and maintain professional skepticism throughout the audit. |
| ● | Obtain an understanding of internal control over financial reporting, assess the risks that a material weakness exists, and test and evaluate the design and operating effectiveness of internal control over financial reporting based on the assessed risk. |
Definition and Inherent Limitations of Internal Control over Financial Reporting
ADB’s internal control over financial reporting is a process effected by management and directors of ADB, designed to provide reasonable assurance regarding the preparation of reliable financial statements in accordance with accounting principles generally accepted in the United States of America. ADB’s internal control over financial reporting includes those policies and procedures that (1) pertain to the maintenance of records that, in reasonable detail, accurately and fairly reflect the transactions and dispositions of the assets of ADB; (2) provide reasonable assurance that transactions are recorded as necessary to permit preparation of financial statements in accordance with accounting principles generally accepted in the United States of America, and that receipts and expenditures of ADB are being made only in accordance with authorizations of management and directors of ADB; and (3) provide reasonable assurance regarding prevention, or timely detection and correction of unauthorized acquisition, use, or disposition of ADB’s assets that could have a material effect on the financial statements.
Because of its inherent limitations, internal control over financial reporting may not prevent, or detect and correct, misstatements. Also, projections of any assessment of effectiveness to future periods are subject to the risk that the controls may become inadequate because of changes in conditions, or that the degree of compliaence wit with the policies or procedures may deteriorate.
Public Accountants and
Chartered Accountants
Singapore
9 March 2026
194
|
Deloitte & Touche LLP Unique Entity No. T08LL0721A 6 Shenton Way OUE Downtown 2 #33-00 Singapore 068809
Tel: +65 6224 8288 Fax: +65 6538 6166 www.deloitte.com/sg |
INDEPENDENT AUDITOR’S REPORT
To the Board of Directors and the Board of Governors of
Asian Development Bank
Opinion
We have audited the financial statements of Asian Development Bank (“ADB”) – Regional Cooperation and Integration Fund, which comprise the statements of financial position as of 31 December 2025, and 2024, and the related statements of activities and changes in net assets, and cash flows for the years then ended, and the related notes to the financial statements.
In our opinion, the accompanying financial statements present fairly, in all material respects, the financial position of ADB - Regional Cooperation and Integration Fund as of 31 December 2025 and 2024, and the changes in its net assets and its cash flows for the years then ended in accordance with accounting principles generally accepted in the United States of America.
We have also audited, in accordance with auditing standards generally accepted in the United States of America (GAAS), ADB’s internal control over financial reporting as of 31 December 2025, based on the criteria established in Internal Control — Integrated Framework (2013) issued by the Committee of Sponsoring Organizations of the Treadway Commission and our report dated 9 March 2026 expressed an unmodified opinion on ADB’s internal control over financial reporting.
Basis for Opinion
We conducted our audits in accordance with GAAS. Our responsibilities under those standards are further described in the Auditor’s Responsibilities for the Audit of the Financial Statements section of our report. We are required to be independent of ADB - Regional Cooperation and Integration Fund and to meet our other ethical responsibilities, in accordance with the relevant ethical requirements relating to our audits. We believe that the audit evidence we have obtained is sufficient and appropriate to provide a basis for our audit opinion.
Deloitte & Touche LLP (Unique Entity No. T08LL0721A) is an accounting limited liability partnership registered in Singapore under the Limited Liability Partnerships Act (Chapter 163A).
195
Responsibilities of Management for the Financial Statements
Management is responsible for the preparation and fair presentation of these financial statements in accordance with accounting principles generally accepted in the United States of America, and for the design, implementation, and maintenance of internal control relevant to the preparation and fair presentation of financial statements that are free from material misstatement, whether due to fraud or error.
In preparing the financial statements, management is required to evaluate whether there are conditions or events, considered in the aggregate, that raise substantial doubt about ADB – Regional Cooperation and Integration Fund’s ability to continue as a going concern for one year after the date that the financial statements are available to be issued.
Auditor’s Responsibility for the Audit of the Financial Statements
Our objectives are to obtain reasonable assurance about whether the financial statements as a whole are free from material misstatement, whether due to fraud or error, and to issue an auditor’s report that includes our opinion. Reasonable assurance is a high level of assurance but is not absolute assurance and therefore is not a guarantee that an audit conducted in accordance with GAAS will always detect a material misstatement when it exists. The risk of not detecting a material misstatement resulting from fraud is higher than for one resulting from error, as fraud may involve collusion, forgery, intentional omissions, misrepresentations, or the override of internal control. Misstatements are considered material if there is a substantial likelihood that, individually or in the aggregate, they would influence the judgment made by a reasonable user based on the financial statements.
In performing an audit in accordance with GAAS, we:
| ● | Exercise professional judgment and maintain professional skepticism throughout the audit. |
| ● | Identify and assess the risks of material misstatement of the financial statements, whether due to fraud or error, and design and perform audit procedures responsive to those risks. Such procedures include examining, on a test basis, evidence regarding the amounts and disclosures in the financial statements. |
| ● | Obtain an understanding of internal control relevant to the audit in order to design audit procedures that are appropriate in the circumstances. |
| ● | Evaluate the appropriateness of accounting policies used and the reasonableness of significant accounting estimates made by management, as well as evaluate the overall presentation of the financial statements. |
| ● | Conclude whether, in our judgment, there are conditions or events, considered in the aggregate, that raise substantial doubt about ADB – Regional Cooperation and Integration Fund’s ability to continue as a going concern for a reasonable period of time. |
We are required to communicate with those charged with governance regarding, among other matters, the planned scope and timing of the audit, significant audit findings, and certain internal control–related matters that we identified during the audit.
196
Other Information Included in the Annual Report
Management is responsible for the other information included in the annual report. The other information comprises the information included in the annual report but does not include the financial statements and our auditor’s report thereon. Our opinion on the financial statements does not cover the other information, and we do not express an opinion or any form of assurance thereon.
In connection with our audits of the financial statements, our responsibility is to read the other information and consider whether a material inconsistency exists between the other information and the financial statements, or the other information otherwise appears to be materially misstated. If, based on the work performed, we conclude that an uncorrected material misstatement of the other information exists, we are required to describe it in our report.
Public Accountants and
Chartered Accountants
Singapore
9 March 2026
197
RCIF-1
ASIAN DEVELOPMENT BANK—REGIONAL COOPERATION AND INTEGRATION FUND
STATEMENT OF FINANCIAL POSITION
31 December 2025 and 2024
Expressed in Thousands of US Dollars
| 2025 | 2024 | |||||||||||||||
| ASSETS | ||||||||||||||||
| DUE FROM BANKS (Note H) | $ | 810 | $ | 1,019 | ||||||||||||
| INVESTMENTS FOR LIQUIDITY PURPOSE (Notes C, H and I) Time deposits | 9,830 | 14,461 | ||||||||||||||
| ACCRUED REVENUE | 37 | 79 | ||||||||||||||
| ADVANCES FOR TECHNICAL ASSISTANCE (Note E) | 65 | 107 | ||||||||||||||
| OTHER ASSETS (Note D) | – | 1 | ||||||||||||||
| TOTAL | $ | 10,742 | $ | 15,667 | ||||||||||||
| LIABILITIES AND UNCOMMITTED BALANCES | ||||||||||||||||
| ACCOUNTS PAYABLE AND OTHER LIABILITIES | ||||||||||||||||
| Payable to related funds (Note D) | $ | 92 | $ | 234 | ||||||||||||
| Accrued Expenses | 21 | $ | 113 | 20 | $ | 254 | ||||||||||
| UNDISBURSED TECHNICAL ASSISTANCE (Notes E and I) | 10,496 | 13,857 | ||||||||||||||
| TOTAL LIABILITIES | 10,609 | 14,111 | ||||||||||||||
| UNCOMMITTED BALANCES (RCIF-2, Note F), represented by: | ||||||||||||||||
| Net assets without donor restrictions | 133 | 1,556 | ||||||||||||||
| TOTAL | $ | 10,742 | $ | 15,667 | ||||||||||||
The accompanying Notes are an integral part of these financial statements (RCIF-4).
198
RCIF-2
ASIAN DEVELOPMENT BANK—REGIONAL COOPERATION AND INTEGRATION FUND
STATEMENT OF ACTIVITIES AND CHANGES IN NET ASSETS
For the Years Ended 31 December 2025 and 2024
Expressed in Thousands of US Dollars
| 2025 | 2024 | |||||||
| CHANGES IN NET ASSETS WITHOUT DONOR RESTRICTIONS | ||||||||
| REVENUE | ||||||||
| From investments for liquidity purpose (Note C) | $ | 526 | $ | 961 | ||||
| From other sources | 0 | 6 | ||||||
| Total | 526 | 967 | ||||||
| EXPENSES | ||||||||
| Technical assistance—net (Notes E and G) | (1,678 | ) | 353 | |||||
| Administrative and financial expenses (Notes D and G) | (274 | ) | (397 | ) | ||||
| Total | (1,952 | ) | (44 | ) | ||||
| REVENUE (LESS THAN) IN EXCESS OF EXPENSES | (1,426 | ) | 923 | |||||
| EXCHANGE GAINS (LOSSES)—net | 3 | (6 | ) | |||||
| (DECREASE) INCREASE IN NET ASSETS | (1,423 | ) | 917 | |||||
| NET ASSETS AT THE BEGINNING OF YEAR | 1,556 | 639 | ||||||
| NET ASSETS AT END OF YEAR | $ | 133 | $ | 1,556 | ||||
| 0 = Less than $500. The accompanying Notes are an integral part of these financial statements (RCIF-4). |
||||||||
199
RCIF-3
ASIAN DEVELOPMENT BANK—REGIONAL COOPERATION AND INTEGRATION FUND
STATEMENT OF CASH FLOWS
For the Years Ended 31 December 2025 and 2024
Expressed in Thousands of US Dollars
| 2025 | 2024 | |||||||
| CASH FLOWS FROM OPERATING ACTIVITIES | ||||||||
| Interest received on investments for liquidity purpose | $ | 568 | $ | 908 | ||||
| Cash received from other sources | 0 | 6 | ||||||
| Technical assistance disbursed | (5,121 | ) | (7,175 | ) | ||||
| Administrative and financial expenses paid | (287 | ) | (421 | ) | ||||
| Net Cash Used in Operating Activities | (4,840 | ) | (6,682 | ) | ||||
| CASH FLOWS FROM INVESTING ACTIVITIES | ||||||||
| Maturities of investments for liquidity purpose | 216,315 | 407,660 | ||||||
| Purchases of investments for liquidity purpose | (211,684 | ) | (402,268 | ) | ||||
| Net Cash Provided by Investing Activities | 4,631 | 5,392 | ||||||
| Net Decrease in Due From Banks | (209 | ) | (1,290 | ) | ||||
| Due from Banks at Beginning of Year | 1,019 | 2,309 | ||||||
| Due from Banks at End of Year | $ | 810 | $ | 1,019 | ||||
| 0 = Less than $500. | ||||||||
| The accompanying Notes are an integral part of these financial statements (RCIF-4). | ||||||||
200
RCIF-4
ASIAN DEVELOPMENT BANK—REGIONAL COOPERATION AND INTEGRATION FUND
NOTES TO FINANCIAL STATEMENTS
31 December 2025 and 2024
NOTE A—NATURE OF OPERATIONS
The Asian Development Bank (ADB), a multilateral development bank, was established in 1966 with its headquarters in Manila, Philippines. ADB and its operations are governed by the Agreement Establishing the Asian Development Bank (the Charter). Its purpose is to foster economic development and co-operation in Asia and the Pacific region and to contribute to the acceleration of the process of economic development of the developing member countries (DMCs) in the region, collectively and individually. Since 1999, ADB’s corporate vision and mission has been to help DMCs reduce poverty in the region. This was reaffirmed under the long-term corporate strategy to 2030—Strategy 2030. Under Strategy 2030, ADB’s vision is to achieve a prosperous, inclusive, resilient, and sustainable Asia and the Pacific, while sustaining its efforts to eradicate extreme poverty. ADB will continue to prioritize the region’s poorest and most vulnerable countries. ADB provides financial and technical assistance for projects and programs, which will contribute to achieve this purpose. These are financed through ordinary capital resources (OCR) and Special Funds.1
The Regional Cooperation and Integration Fund (RCIF), together with the Regional Cooperation and Integration (RCI) Trust Funds, was established on 26 February 2007 under the umbrella of the Regional Cooperation and Integration Financing Partnership Facility (RCIFPF), in response to the increasing demand for regional cooperation and integration activities among ADB’s members in Asia and the Pacific. Its main objective is to enhance regional cooperation and integration in Asia and the Pacific by facilitating the pooling and provision of additional financial and knowledge resources to support RCI activities.
Financial assistance will be provided in the form of untied grants for technical assistance (TA), including advisory, project preparatory, capacity development, and regional TA.
RCIF’s resources may consist of contributions from ADB and other bilateral, multilateral, and individual sources, including companies and foundations.
ADB is immune from taxation pursuant to Chapter VIII, Article 56, Exemption from Taxation, of the Charter.
NOTE B—SUMMARY OF SIGNIFICANT ACCOUNTING POLICIES
Presentation of the Financial Statements
The financial statements of the RCIF are prepared in accordance with accounting principles generally accepted in the United States of America (US GAAP), and are presented on the basis of those for not-for-profit organizations.
RCIF reports donors’ contributions of cash and other assets as assets without donor restrictions as these are made available to RCIF without conditions other than for the purpose of pursuing its objectives.
Functional and Reporting Currency
The US dollar is the functional and reporting currency, representing the currency of the primary economic operating environment of the RCIF.
Translation of Currencies
ADB adopts the use of daily exchange rates for accounting and financial reporting purposes. This allows transactions denominated in non-US dollar currencies to be translated to the reporting currency using exchange rates applicable at the time of the transactions. Contributions included in the financial statements during the year are recognized at applicable exchange rates as of the respective dates of commitment. At the end of each accounting month, translations of assets and liabilities which are denominated in non-US dollar currencies are adjusted using the applicable exchange rates at the end of the reporting period. These translation adjustments are accounted for as exchange gains or losses and are credited or charged to operations.
| 1 | Asian Development Fund (ADF), Technical Assistance Special Fund (TASF), Japan Special Fund (JSF), Asian Development Bank Institute (ADBI), Regional Cooperation and Integration Fund (RCIF), Climate Change Fund (CCF), Asia Pacific Disaster Response Fund (APDRF), and Financial Sector Development Partnership Special Fund (FSDPSF). |
201
RCIF-4
continued
Investments for Liquidity Purpose
All investments held by RCIF are reported at fair value (FV). Interest income on time deposits is recognized as earned and reported in REVENUE From investments for liquidity purpose.
Contributions
The contributions from donors and the allocations from net income of OCR are included in the financial statements, from the date of effectivity of the contributions agreement, and the Board of Governors’ approval, respectively.
Technical Assistance and Related Undisbursed Balance
TA are recognized as expense in the financial statements when the project becomes effective. Upon completion or cancellation of a TA project, any undisbursed committed balance is reversed. TA expenses are also reversed accordingly.
Advances are provided from TA to the executing agency or co-operating institution, for the purpose of making payments for eligible expenses. The advances are subject to liquidation and charged against undisbursed commitments. Any unutilized portion is required to be returned to the fund. These are included in ADVANCES FOR TECHNICAL ASSISTANCE.
Fair Value of Financial Instruments
Accounting Standards Codification (ASC) 820, “Fair Value Measurement” defines FV as the price that would be received to sell an asset or paid to transfer a liability at measurement date in an orderly transaction among willing participants with an assumption that the transaction takes place in the entity’s principal market, or in the absence of principal market, in the most advantageous market for the asset or liability. The most advantageous market is the market where the sale of the asset or transfer of liability would maximize the amount received for the asset or minimize the amount paid to transfer the liability. The FV measurement is not adjusted for transaction costs.
Fair Value Hierarchy
ASC 820 establishes a FV hierarchy that gives the highest priority to quoted prices in active markets for identical assets or liabilities (Level 1), next priority to observable market inputs or market corroborated data (Level 2), and the lowest priority to unobservable inputs without market corroborated data (Level 3).
The FVs of ADB’s financial assets and liabilities are categorized as follows:
Level 1: FVs are based on unadjusted quoted prices for identical assets or liabilities in active markets.
Level 2: FVs are based on quoted prices for similar assets or liabilities in active markets or markets that are not active; or valuation models for which significant inputs are obtained from market-based data that are observable.
Level 3: FVs are based on prices or valuation models for which significant inputs to the model are unobservable.
202
RCIF-4
continued
Accounting Estimates
The preparation of financial statements in accordance with US GAAP requires Management to make reasonable estimates and assumptions that affect the reported amounts of assets and liabilities as of the end of the year and the reported amounts of revenue and expenses during the year. The actual results could differ from those estimates.
Accounting and Reporting Developments
In March 2024, the Financial Accounting Standards Board (FASB) issued Accounting Standard Update (ASU) 2024-02, “Codification Improvements – Amendments to Remove References to the Concepts Statements”. This Update contains amendments to the Codification that remove references to various FASB Concepts Statements. The amendments in this Update are effective for public business entities for fiscal years beginning after 15 December 2024. For all other entities, the amendments are effective for fiscal years beginning after 15 December 2025. Early adoption is permitted for all entities. ADB does not expect the adoption of this Update to have a material impact on the financial statements.
In December 2025, the FASB issued ASU 2025-11, “Interim Reporting (Topic 270): Narrow-Scope Improvements”—aimed at enhancing the structure and clarity of interim reporting guidance. The amendments reorganize existing disclosure requirements, define what constitutes interim financial statements and notes under GAAP (including SEC considerations where relevant), and introduce a new disclosure principle requiring entities to report material events occurring after the preceding annual reporting period. While the Update improves consistency and usability, it does not expand or reduce current disclosure requirements. The amendments are effective for public business entities for interim periods within annual reporting periods beginning after 15 December 2027, and one year later for all other entities, with early adoption permitted. Entities may apply the amendments prospectively or retrospectively. This Update is not expected to have a significant impact on RCIF’s interim financial statements.
Additionally, the FASB issued ASU 2025-12, “Codification Improvements”, introducing clarifications, corrections, and other minor amendments across a wide range of Topics. These updates are designed to make the Codification easier to navigate and apply, particularly in areas where the original language may have caused confusion. The amendments take effect for all entities for annual reporting periods beginning after 15 December 2026, including the related interim periods. This Update is not expected to have a significant impact on RCIF’s financial statements.
Statement of Cash Flows
For the purposes of the Statement of Cash Flows, RCIF considers that its cash and cash equivalents are limited to DUE FROM BANKS, which pertain to current accounts in banks used for operational disbursements.
NOTE C—INVESTMENTS FOR LIQUIDITY PURPOSE
The main investment management objective is to maintain security and liquidity of funds invested. Subject to these parameters, ADB seeks the highest possible return on its investments. Investments are governed by the Investment Authority approved by the Board of Directors.
All investments for liquidity purpose held as of 31 December 2025 and 2024 were in US dollar time deposits.
The rate of return on the average investments for liquidity purpose held during the year ended 31 December 2025 was 4.4% (5.4% – 2024).
203
RCIF-4
continued
Fair Value Disclosure
The FV of INVESTMENTS FOR LIQUIDITY PURPOSE as of 31 December 2025 and 2024 is as follows:
| ($ thousand) | ||||||||||||||||
| Fair Value Measurements | ||||||||||||||||
| Total | Level 1 | Level 2 | Level 3 | |||||||||||||
| 2025 | ||||||||||||||||
| Investments for liquidity purpose | ||||||||||||||||
| Time deposits | $ | 9,830 | $ | – | $ | 9,830 | $ | – | ||||||||
| 2024 | ||||||||||||||||
| Investments for liquidity purpose | ||||||||||||||||
| Time deposits | $ | 14,461 | $ | – | $ | 14,461 | $ | – | ||||||||
Time deposits are reported at cost, which approximates FV.
NOTE D—RELATED PARTY TRANSACTIONS
The OCR and Special Funds resources are at all times used, committed, and invested entirely separately from each other. The administrative and operational expenses pertaining to the RCIF are settled regularly with OCR and the other funds. Regional technical assistance projects and programs may be combined activities financed by Special Funds and trust funds. ADB charges a service fee to cover ADB’s incremental cost for the administration, management, supervision, and operation of the RCIF and RCI Trust Fund, a trust fund administered by ADB. The service fee is currently 5% of the amount disbursed for technical assistance and 2% of the amount disbursed for grant components of investment projects. As of 31 December 2025, all service fees pertain to the administration of TA projects. See Note G for service fees during the years ended 31 December 2025 and 2024.
The interfund account balances included in OTHER ASSETS and ACCOUNTS PAYABLE AND OTHER LIABILITIES as of 31 December 2025 and 2024 are as follows:
| ($ thousand) | ||||||||
| 2025 | 2024 | |||||||
| Receivable from: | ||||||||
| Trust Funds | $ | – | $ | 1 | ||||
| Total | $ | – | $ | 1 | ||||
|
Payable to: |
||||||||
| Ordinary capital resources—net | $ | 40 | $ | 75 | ||||
| Technical Assistance Special Fund—net | 52 | 154 | ||||||
| Trust Funds | – | 4 | ||||||
| Total | $ | 92 | $ | 234 | ||||
Note: Numbers may not sum precisely because of rounding.
204
RCIF-4
continued
NOTE E—TECHNICAL ASSISTANCE AND UNDISBURSED TECHNICAL ASSISTANCE
Undisbursed TA are denominated in US dollars and represent effective TA projects not yet disbursed and unliquidated. For the year ended 31 December 2025, one TA project and two supplementary TA totaling $1,900,000 (three TA projects and one supplementary TA totaling $1,275,000 – 2024) became effective. Undisbursed TA reversed as reduction in TA expenses totaled $222,000 ($1,628,000 – 2024) during the period, resulting in total TA expense of $1,678,000 (-$353,000 – 2024). As of 31 December 2025, undisbursed TA of $10,496,000 ($13,857,000 – 2024), includes $65,000 ($107,000 – 2024) advances for TA.
The FV of undisbursed commitments approximates the amounts outstanding, because ADB expects that disbursements will substantially be made for all the projects/programs covered by the commitments.
NOTE F—UNCOMMITTED BALANCES
Uncommitted balances comprise amounts which have not been committed by RCIF as of 31 December 2025 and 2024.
NOTE G—EXPENSES
Technical assistance—net
TA expenses are classified according to its nature using the budget allocation specified in the relevant TA agreement for the TAs that became effective during the year.
The details of TA expenses for the years ended 31 December 2025 and 2024 are as follows:
| ($ thousand) | ||||||||
| 2025 | 2024 | |||||||
| Consultants | $ | 1,138 | $ | 712 | ||||
| Trainings and seminars | 652 | 459 | ||||||
| Studies | – | 7 | ||||||
| Other expenses—neta | (112 | ) | (1,531 | ) | ||||
| Total | $ | 1,678 | $ | (353 | ) | |||
a Net of amounts reversed as reduction in TA expenses (See Note E).
Administrative and financial expenses
Administrative expenses include service fees to OCR and audit fees, which are incurred for management and general supporting activities. The following table summarizes administrative and financial expenses for the years ended 31 December 2025 and 2024:
| ($ thousand) | ||||||||
| 2025 | 2024 | |||||||
| Service fees to OCR (Note D) | $ | 252 | $ | 375 | ||||
| Audit fees | 21 | 20 | ||||||
| Financial expenses | 1 | 2 | ||||||
| Total | $ | 274 | $ | 397 | ||||
205
RCIF-4
continued
NOTE H—LIQUIDITY AND AVAILABILITY OF RESOURCES
Liquidity risk refers to the risk that the fund has difficulties in meeting its short-term obligations. As part of RCIF’s liquidity management, it has a policy to structure its financial assets to be available as its general expenditures, liabilities, and other obligations come due. In addition, RCIF invests cash in excess of daily requirements in short-term investments.
As of 31 December 2025, the RCIF has liquidity of $10,640,000 ($15,480,000 – 2024) consisting of DUE FROM BANKS of $810,000 ($1,019,000 – 2024) and INVESTMENTS FOR LIQUIDITY PURPOSE in time deposits of $9,830,000 ($14,461,000 – 2024), available within one year of the balance sheet date to meet cash needs for general expenditure. None of the financial assets are subject to donor or other contractual restrictions that make them unavailable for general expenditure within one year of the balance sheet date.
NOTE I—OTHER FAIR VALUE DISCLOSURES
As of 31 December 2025 and 2024, RCIF has no assets or liabilities measured at FV on a non-recurring basis. See Notes C and E for discussions relating to investments for liquidity purpose and undisbursed technical assistance, respectively. In all other cases, the carrying amount of RCIF’s assets and liabilities is considered to approximate FV.
NOTE J—SUBSEQUENT EVENTS
ADB has evaluated subsequent events after 31 December 2025 through 9 March 2026, the date these financial statements are available for issuance. As a result of this evaluation, there are no subsequent events that require recognition or disclosure in the RCIF’s financial statements as of 31 December 2025.
206
CLIMATE CHANGE FUND
MANAGEMENT’S REPORT ON INTERNAL CONTROL OVER FINANCIAL REPORTING
The management of Asian Development Bank (“ADB”) is responsible for designing, implementing, and maintaining effective internal control over financial reporting. ADB’s internal control over financial reporting is a process designed to provide reasonable assurance regarding the preparation of reliable financial statements in accordance with generally accepted accounting principles in the United States of America.
ADB’s internal control over financial reporting includes those policies and procedures that (i) pertain to the maintenance of records that, in reasonable detail, accurately and fairly reflect the transactions and dispositions of the assets of ADB; (ii) provide reasonable assurance that transactions are recorded as necessary to permit preparation of financial statements in accordance with generally accepted accounting principles in the United States of America, and that receipts and expenditures of ADB are being made only in accordance with authorizations of management and directors of ADB; and (iii) provide reasonable assurance regarding prevention, or timely detection and correction, of unauthorized acquisition, use, or disposition of ADB’s assets that could have a material effect on the financial statements.
Because of its inherent limitations, internal control over financial reporting may not prevent, or detect and correct, misstatements. Also, projections of any assessment of effectiveness to future periods are subject to the risk that controls may become inadequate because of changes in conditions, or that the degree of compliance with the policies or procedures may deteriorate.
ADB’s management assessed the effectiveness of ADB’s internal control over financial reporting as of 31 December 2025, based on the criteria established in Internal Control – Integrated Framework (2013) issued by the Committee of Sponsoring Organizations of the Treadway Commission. Based on that assessment, management concluded that ADB’s internal control over financial reporting is effective as of 31 December 2025.
Masato Kanda
President
Roberta Casali
Vice-President (Finance and Risk Management)
Helen Hall
Controller
9 March 2026
207
| |
Deloitte & Touche LLP Tel: +65 6224 8288 |
INDEPENDENT AUDITOR’S REPORT
To the Board of Directors and the Board of Governors of
Asian Development Bank
Opinion on Internal Control Over Financial Reporting
We have audited the internal control over financial reporting of Asian Development Bank (“ADB”) as of 31 December 2025, based on the criteria established in Internal Control — Integrated Framework (2013) issued by the Committee of Sponsoring Organizations of the Treadway Commission (COSO). In our opinion, ADB maintained, in all material respects, effective internal control over financial reporting as of 31 December 2025, based on the criteria established in Internal Control — Integrated Framework (2013) issued by COSO.
We also have audited, in accordance with auditing standards generally accepted in the United States of America (GAAS), the financial statements as of and for the years ended 31 December 2025 and 2024 of ADB – Climate Change Fund, and our report dated 9 March 2026 expressed an unmodified opinion on those financial statements.
Basis for Opinion
We conducted our audit in accordance with GAAS. Our responsibilities under those standards are further described in the Auditor’s Responsibilities for the Audit of Internal Control over Financial Reporting section of our report. We are required to be independent of ADB and to meet our other ethical responsibilities, in accordance with the relevant ethical requirements relating to our audit. We believe that the audit evidence we have obtained is sufficient and appropriate to provide basis for our audit opinion.
Responsibilities of Management for Internal Control over Financial Reporting
Management is responsible for designing, implementing, and maintaining effective internal control over financial reporting, and for its assessment about the effectiveness of internal control over financial reporting, included in the accompanying Management’s Report on Internal Control over Financial Reporting.
Deloitte & Touche LLP (Unique Entity No. T08LL0721A) is an accounting limited liability partnership registered in Singapore under the Limited Liability Partnerships Act (Chapter 163A).
208
Auditor’s Responsibilities for the Audit of Internal Control over Financial Reporting
Our objectives are to obtain reasonable assurance about whether effective internal control over financial reporting was maintained in all material respects and to issue an auditor’s report that includes our opinion on internal control over financial reporting. Reasonable assurance is a high level of assurance but is not absolute assurance and therefore is not a guarantee that an audit of internal control over financial reporting conducted in accordance with GAAS will always detect a material weakness when it exists.
In performing an audit of internal control over financial reporting in accordance with GAAS, we:
| ● | Exercise professional judgment and maintain professional skepticism throughout the audit. |
| ● | Obtain an understanding of internal control over financial reporting, assess the risks that a material weakness exists, and test and evaluate the design and operating effectiveness of internal control over financial reporting based on the assessed risk. |
Definition and Inherent Limitations of Internal Control over Financial Reporting
ADB’s internal control over financial reporting is a process effected by management and directors of ADB, designed to provide reasonable assurance regarding the preparation of reliable financial statements in accordance with accounting principles generally accepted in the United States of America. ADB’s internal control over financial reporting includes those policies and procedures that (1) pertain to the maintenance of records that, in reasonable detail, accurately and fairly reflect the transactions and dispositions of the assets of ADB; (2) provide reasonable assurance that transactions are recorded as necessary to permit preparation of financial statements in accordance with accounting principles generally accepted in the United States of America, and that receipts and expenditures of ADB are being made only in accordance with authorizations of management and directors of ADB; and (3) provide reasonable assurance regarding prevention, or timely detection and correction of unauthorized acquisition, use, or disposition of ADB’s assets that could have a material effect on the financial statements.
Because of its inherent limitations, internal control over financial reporting may not prevent, or detect and correct, misstatements. Also, projections of any assessment of effectiveness to future periods are subject to the risk that the controls may become inadequate because of changes in conditions, or that the degree of compliance with the policies or procedures may deteriorate.
Public Accountants and
Chartered Accountants
Singapore
9 March 2026
209
| |
Deloitte & Touche LLP Tel: +65 6224 8288 |
INDEPENDENT AUDITOR’S REPORT
To the Board of Directors and the Board of Governors of
Asian Development Bank
Opinion
We have audited the financial statements of Asian Development Bank (“ADB”) – Climate Change Fund, which comprise the statements of financial position as of 31 December 2025 and 2024, and the related statements of activities and changes in net assets, and cash flows for the years then ended, and the related notes to the financial statements.
In our opinion, the accompanying financial statements present fairly, in all material respects, the financial position of ADB - Climate Change Fund as of 31 December 2025 and 2024, and the changes in its net assets and its cash flows for the years then ended in accordance with accounting principles generally accepted in the United States of America.
We have also audited, in accordance with auditing standards generally accepted in the United States of America (GAAS), ADB’s internal control over financial reporting as of 31 December 2025, based on the criteria established in Internal Control — Integrated Framework (2013) issued by the Committee of Sponsoring Organizations of the Treadway Commission and our report dated 9 March 2026 expressed an unmodified opinion on ADB’s internal control over financial reporting.
Basis for Opinion
We conducted our audits in accordance with GAAS. Our responsibilities under those standards are further described in the Auditor’s Responsibilities for the Audit of the Financial Statements section of our report. We are required to be independent of ADB - Climate Change Fund and to meet our other ethical responsibilities, in accordance with the relevant ethical requirements relating to our audits. We believe that the audit evidence we have obtained is sufficient and appropriate to provide a basis for our audit opinion.
Deloitte & Touche LLP (Unique Entity No. T08LL0721A) is an accounting limited liability partnership registered in Singapore under the Limited Liability Partnerships Act (Chapter 163A).
210
Responsibilities of Management for the Financial Statements
Management is responsible for the preparation and fair presentation of these financial statements in accordance with accounting principles generally accepted in the United States of America, and for the design, implementation, and maintenance of internal control relevant to the preparation and fair presentation of financial statements that are free from material misstatement, whether due to fraud or error.
In preparing the financial statements, management is required to evaluate whether there are conditions or events, considered in the aggregate, that raise substantial doubt about ADB – Climate Change Fund’s ability to continue as a going concern for one year after the date that the financial statements are available to be issued.
Auditor’s Responsibility for the Audit of the Financial Statements
Our objectives are to obtain reasonable assurance about whether the financial statements as a whole are free from material misstatement, whether due to fraud or error, and to issue an auditor’s report that includes our opinion. Reasonable assurance is a high level of assurance but is not absolute assurance and therefore is not a guarantee that an audit conducted in accordance with GAAS will always detect a material misstatement when it exists. The risk of not detecting a material misstatement resulting from fraud is higher than for one resulting from error, as fraud may involve collusion, forgery, intentional omissions, misrepresentations, or the override of internal control. Misstatements are considered material if there is a substantial likelihood that, individually or in the aggregate, they would influence the judgment made by a reasonable user based on the financial statements.
In performing an audit in accordance with GAAS, we:
| ● | Exercise professional judgment and maintain professional skepticism throughout the audit. |
| ● | Identify and assess the risks of material misstatement of the financial statements, whether due to fraud or error, and design and perform audit procedures responsive to those risks. Such procedures include examining, on a test basis, evidence regarding the amounts and disclosures in the financial statements. |
| ● | Obtain an understanding of internal control relevant to the audit in order to design audit procedures that are appropriate in the circumstances. |
| ● | Evaluate the appropriateness of accounting policies used and the reasonableness of significant accounting estimates made by management, as well as evaluate the overall presentation of the financial statements. |
| ● | Conclude whether, in our judgment, there are conditions or events, considered in the aggregate, that raise substantial doubt about ADB – Climate Change Fund’s ability to continue as a going concern for a reasonable period of time. |
We are required to communicate with those charged with governance regarding, among other matters, the planned scope and timing of the audit, significant audit findings, and certain internal control–related matters that we identified during the audit.
211
Other Information Included in the Annual Report
Management is responsible for the other information included in the annual report. The other information comprises the information included in the annual report but does not include the financial statements and our auditor’s report thereon. Our opinion on the financial statements does not cover the other information, and we do not express an opinion or any form of assurance thereon.
In connection with our audits of the financial statements, our responsibility is to read the other information and consider whether a material inconsistency exists between the other information and the financial statements, or the other information otherwise appears to be materially misstated. If, based on the work performed, we conclude that an uncorrected material misstatement of the other information exists, we are required to describe it in our report.
Public Accountants and
Chartered Accountants
Singapore
9 March 2026
212
CCF-1
ASIAN DEVELOPMENT BANK—CLIMATE CHANGE FUND
STATEMENT OF FINANCIAL POSITION
31 December 2025 and 2024
Expressed in Thousands of US Dollars
| 2025 |
|
2024 |
|||||||||||
| ASSETS | |||||||||||||
| DUE FROM BANKS (Note H) | $ | 884 | $ | 1,059 | |||||||||
| INVESTMENTS FOR LIQUIDITY PURPOSE (Notes C, H, and I) | |||||||||||||
| Time deposits | 20,767 | 24,790 | |||||||||||
| ACCRUED REVENUE | 92 | 158 | |||||||||||
| ADVANCES FOR TECHNICAL ASSISTANCE AND GRANTS (Note E) | 611 | 278 | |||||||||||
| OTHER ASSETS | – | 3 | |||||||||||
| TOTAL | $ | 22,354 | $ | 26,288 | |||||||||
| LIABILITIES AND UNCOMMITTED BALANCES | ||||||||||||||||
| ACCOUNTS PAYABLE AND OTHER LIABILITIES | ||||||||||||||||
| Payable to related funds (Note D) | $ | 44 | $ | 344 | ||||||||||||
| Accrued expenses | 78 | $ | 122 | 312 | $ | 656 | ||||||||||
| UNDISBURSED TECHNICAL ASSISTANCE AND GRANTS (Notes E and I) | 9,868 | 13,274 | ||||||||||||||
| TOTAL LIABILITIES | 9,990 | 13,930 | ||||||||||||||
| UNCOMMITTED BALANCES (CCF-2, Note F), represented by: | ||||||||||||||||
| Net assets without donor restrictions | 12,364 | 12,358 | ||||||||||||||
| TOTAL | $ | 22,354 | $ | 26,288 |
The accompanying Notes are an integral part of these financial statements (CCF-4).
213
CCF-2
ASIAN DEVELOPMENT BANK—CLIMATE CHANGE FUND
STATEMENT OF ACTIVITIES AND CHANGES IN NET ASSETS
For the Years Ended 31 December 2025 and 2024
Expressed in Thousands of US Dollars
| 2025 | 2024 | |||||||
| CHANGES IN NET ASSETS WITHOUT DONOR RESTRICTIONS | ||||||||
| REVENUE | ||||||||
| From investments for liquidity purpose (Note C) | 1,011 | 1,513 | ||||||
| From other sources | 39 | 55 | ||||||
| Total | 1,050 | 1,568 | ||||||
| EXPENSES | ||||||||
| Technical assistance (Notes E and G) | 145 | (294 | ) | |||||
| Grants (Note E) | (900 | ) | (2,000 | ) | ||||
| Administrative and other expenses (Notes D and G) | (289 | ) | (1,466 | ) | ||||
| Total | (1,044 | ) | (3,760 | ) | ||||
| REVENUE IN EXCESS OF (LESS THAN) EXPENSES | 6 | (2,192 | ) | |||||
| EXCHANGE GAINS —net | 0 | 0 | ||||||
| INCREASE (DECREASE) IN NET ASSETS | 6 | (2,192 | ) | |||||
| NET ASSETS AT BEGINNING OF YEAR | 12,358 | 14,550 | ||||||
| NET ASSETS AT END OF YEAR | $ | 12,364 | $ | 12,358 | ||||
0 = less than $500.
The accompanying Notes are an integral part of these financial statements (CCF-4).
214
CCF-3
ASIAN DEVELOPMENT BANK—CLIMATE CHANGE FUND
STATEMENT OF CASH FLOWS
For the Years Ended 31 December 2025 and 2024
Expressed in Thousands of US Dollars
| 2025 | 2024 | |||||||
| CASH FLOWS FROM OPERATING ACTIVITIES | ||||||||
| Interest received on investments for liquidity purpose | 1,077 | 1,396 | ||||||
| Cash received from other activities | 39 | 55 | ||||||
| Technical assistance and grants disbursed | (4,739 | ) | (6,093 | ) | ||||
| Administrative and other expenses paid | (575 | ) | (1,302 | ) | ||||
| Net Cash Used in Operating Activities | (4,198 | ) | (5,944 | ) | ||||
| CASH FLOWS FROM INVESTING ACTIVITIES | ||||||||
| Maturities of investments for liquidity purpose | 301,071 | 554,960 | ||||||
| Purchases of investments for liquidity purpose | (297,048 | ) | (550,055 | ) | ||||
| Net Cash Provided by Investing Activities | 4,023 | 4,905 | ||||||
| Net Decrease in Due From Banks | (175 | ) | (1,039 | ) | ||||
| Due from Banks at Beginning of Year | 1,059 | 2,098 | ||||||
| Due from Banks at End of Year | $ | 884 | $ | 1,059 | ||||
The accompanying Notes are an integral part of these financial statements (CCF-4).
215
CCF-4
ASIAN DEVELOPMENT BANK—CLIMATE CHANGE FUND
NOTES TO FINANCIAL STATEMENTS
31 December 2025 and 2024
NOTE A—NATURE OF OPERATIONS
The Asian Development Bank (ADB), a multilateral development bank, was established in 1966 with its headquarters in Manila, Philippines. ADB and its operations are governed by the Agreement Establishing the Asian Development Bank (the Charter). Its purpose is to foster economic development and co-operation in Asia and the Pacific region and to contribute to the acceleration of the process of economic development of the developing member countries (DMCs) in the region, collectively and individually. Since 1999, ADB’s corporate vision and mission has been to help DMCs reduce poverty in the region. This was reaffirmed under the long-term corporate strategy to 2030—Strategy 2030. Under Strategy 2030, ADB’s vision is to achieve a prosperous, inclusive, resilient, and sustainable Asia and the Pacific, while sustaining its efforts to eradicate extreme poverty. ADB will continue to prioritize the region’s poorest and most vulnerable countries. ADB provides financial and technical assistance for projects and programs, which will contribute to achieve this purpose. These are financed through ordinary capital resources (OCR) and Special Funds.1
The Climate Change Fund (CCF) was established on 7 April 2008 to facilitate greater investments in DMCs to address the causes and consequences of climate change alongside ADB’s own assistance in various related sectors. The CCF is a key mechanism to pool resources within ADB to address climate change through (i) technical assistance (TA), (ii) investment components for both private and public sector projects, and (iii) any other form of cooperation that ADB and its partners may agree upon for a defined program of activities.
Financial assistance is provided in the form of untied grants for components of investment projects, for advisory, project preparatory, and regional TA; as well as for any other activities that may be agreed between external contributors and ADB.
CCF’s resources may consist of contributions from ADB and other bilateral, multilateral, and individual sources, including companies and foundations.
ADB is immune from taxation pursuant to Chapter VIII, Article 56, Exemption from Taxation, of the Charter.
NOTE B—SUMMARY OF SIGNIFICANT ACCOUNTING POLICIES
Presentation of the Financial Statements
The financial statements of the CCF are prepared in accordance with accounting principles generally accepted in the United States of America (US GAAP), and are presented on the basis of those for not-for-profit organizations.
CCF reports donors’ contributions of cash and other assets as assets without donor restrictions as these are made available to CCF without conditions other than for the purpose of pursuing its objectives.
Functional and Reporting Currency
The US dollar is the functional and reporting currency, representing the currency of the primary economic operating environment of the CCF.
| 1 | Asian Development Fund (ADF), Technical Assistance Special Fund (TASF), Japan Special Fund (JSF), Asian Development Bank Institute (ADBI), Regional Cooperation and Integration Fund (RCIF), the Climate Change Fund (CCF), Asia Pacific Disaster Response Fund (APDRF), and Financial Sector Development Partnership Special Fund (FSDPSF). |
216
CCF-4
continued
Translation of Currencies
ADB adopts the use of daily exchange rates for accounting and financial reporting purposes. This allows transactions denominated in non-US dollar currencies to be translated to the reporting currency using exchange rates applicable at the time of the transactions. Contributions included in the financial statements during the year are recognized at applicable exchange rates as of the respective dates of commitment. At the end of each accounting month, translations of assets and liabilities which are denominated in non-US dollar currencies are adjusted using the applicable exchange rates at the end of the reporting period. These translation adjustments are accounted for as exchange gains or losses and are credited or charged to operations.
Investments for Liquidity Purpose
All investments held by CCF are reported at fair value (FV). Interest income on time deposits is recognized as earned and reported in REVENUE From investments for liquidity purpose.
Contributions
The contributions from donors and the allocations from net income of OCR are included in the financial statements, from the date of effectivity of the contributions agreement, and the Board of Governors’ approval, respectively.
Technical Assistance, Grants and Related Undisbursed Balance
TA and grants are recognized as expense in the financial statements when the project becomes effective. Upon completion or cancellation of a TA project or grant, any undisbursed committed balance is reversed. TA or grant expenses are also reversed accordingly.
Advances are provided from TA or grants to the executing agency or co-operating institution, for the purpose of making payments for eligible expenses. The advances are subject to liquidation and charged against undisbursed commitments. Any unutilized portion is required to be returned to the fund. These are included in ADVANCES FOR TECHNICAL ASSISTANCE AND GRANTS.
Fair Value of Financial Instruments
Accounting Standards Codification (ASC) 820, “Fair Value Measurement” defines FV as the price that would be received to sell an asset or paid to transfer a liability at measurement date in an orderly transaction among willing participants with an assumption that the transaction takes place in the entity’s principal market, or in the absence of principal market, in the most advantageous market for the asset or liability. The most advantageous market is the market where the sale of the asset or transfer of liability would maximize the amount received for the asset or minimize the amount paid to transfer the liability. The FV measurement is not adjusted for transaction costs.
Fair Value Hierarchy
ASC 820 establishes a FV hierarchy that gives the highest priority to quoted prices in active markets for identical assets or liabilities (Level 1), next priority to observable market inputs or market corroborated data (Level 2), and the lowest priority to unobservable inputs without market corroborated data (Level 3).
The FVs of ADB’s financial assets and liabilities are categorized as follows:
Level 1: FVs are based on unadjusted quoted prices for identical assets or liabilities in active markets.
217
CCF-4
continued
Level 2: FVs are based on quoted prices for similar assets or liabilities in active markets or markets that are not active; or valuation models for which significant inputs are obtained from market-based data that are observable.
Level 3: FVs are based on prices or valuation models for which significant inputs to the model are unobservable.
Accounting Estimates
The preparation of financial statements in accordance with US GAAP requires Management to make reasonable estimates and assumptions that affect the reported amounts of assets and liabilities as of the end of the year and the reported amounts of revenue and expenses during the year. The actual results could differ from those estimates.
Accounting and Reporting Developments
In March 2024, the Financial Accounting Standards Board (FASB) issued Accounting Standard Update (ASU) 2024-02, “Codification Improvements – Amendments to Remove References to the Concepts Statements”. This Update contains amendments to the Codification that remove references to various FASB Concepts Statements. The amendments in this Update are effective for public business entities for fiscal years beginning after 15 December 2024. For all other entities, the amendments are effective for fiscal years beginning after 15 December 2025. Early adoption is permitted for all entities. ADB does not expect the adoption of this Update to have a material impact on the financial statements.
In December 2025, the FASB issued ASU 2025-11, “Interim Reporting (Topic 270): Narrow-Scope Improvements”—aimed at enhancing the structure and clarity of interim reporting guidance. The amendments reorganize existing disclosure requirements, define what constitutes interim financial statements and notes under GAAP (including SEC considerations where relevant), and introduce a new disclosure principle requiring entities to report material events occurring after the preceding annual reporting period. While the Update improves consistency and usability, it does not expand or reduce current disclosure requirements. The amendments are effective for public business entities for interim periods within annual reporting periods beginning after 15 December 2027, and one year later for all other entities, with early adoption permitted. Entities may apply the amendments prospectively or retrospectively. This Update is not expected to have a significant impact on CCF’s interim financial statements.
Additionally, the FASB issued ASU 2025-12, “Codification Improvements”, introducing clarifications, corrections, and other minor amendments across a wide range of Topics. These updates are designed to make the Codification easier to navigate and apply, particularly in areas where the original language may have caused confusion. The amendments take effect for all entities for annual reporting periods beginning after 15 December 2026, including the related interim periods. This Update is not expected to have a significant impact on CCF’s financial statements
Statement of Cash Flows
For the purposes of the Statement of Cash Flows, CCF considers that its cash and cash equivalents are limited to DUE FROM BANKS, which pertain to current accounts in banks used for operational disbursements.
218
CCF-4
continued
NOTE C—INVESTMENTS FOR LIQUIDITY PURPOSE
The main investment management objective is to maintain security and liquidity of funds invested. Subject to these parameters, ADB seeks the highest possible return on its investments. Investments are governed by the Investment Authority approved by the Board of Directors.
All investments for liquidity purpose held as of 31 December 2025 and 2024 were in US dollar time deposits.
The rate of return on the average investments for liquidity purpose held during the year ended 31 December 2025 was 4.4% (5.4% – 2024).
Fair Value Disclosure
The FV of INVESTMENTS FOR LIQUIDITY PURPOSE as of 31 December 2025 and 2024 is as follows:
| ($ thousand) | ||||||||||||||||
| Fair Value Measurements | ||||||||||||||||
| Total | Level 1 | Level 2 | Level 3 | |||||||||||||
| 2025 | ||||||||||||||||
| Investments for liquidity purpose | ||||||||||||||||
| Time deposits | $ | 20,767 | $ | – | $ | 20,767 | $ | – | ||||||||
| 2024 | ||||||||||||||||
| Investments for liquidity purpose | ||||||||||||||||
| Time deposits | $ | 24,790 | $ | – | $ | 24,790 | $ | – | ||||||||
Time deposits are reported at cost, which approximates FV.
NOTE D—RELATED PARTY TRANSACTIONS
The OCR and Special Funds resources are at all times used, committed, and invested entirely separately from each other. The administrative and operational expenses pertaining to the CCF are settled regularly with OCR and the other funds. Regional technical assistance projects and programs may be combined activities financed by Special Funds and trust funds. ADB charges a service fee to cover ADB’s incremental cost for the administration, management, supervision and operation of the CCF. The service fee is set at 5% of the amount disbursed for technical assistance and 2% of the amount disbursed for grant components of investment projects. As of 31 December 2025, all service fees pertain to the administration of TA projects. See Note G for service fees for the years ended 31 December 2025 and 2024.
The interfund account balances included in ACCOUNTS PAYABLE AND OTHER LIABILITIES as of 31 December 2025 and 2024 are as follows:
| ($ thousand) | ||||||||
| 2025 | 2024 | |||||||
| Payable to: | ||||||||
| Technical Assistance Special Fund—net | $ | 29 | $ | 265 | ||||
| Ordinary capital resources—net | 14 | 62 | ||||||
| Trust Funds | 1 | 17 | ||||||
| Total | $ | 44 | $ | 344 | ||||
219
CCF-4
continued
NOTE E—TECHNICAL ASSISTANCE, GRANTS, AND UNDISBURSED TECHNICAL ASSISTANCE AND GRANTS
Undisbursed TA or grants are denominated in US dollars and represent effective TA projects or grants not yet disbursed and unliquidated.
During 2025, no TA project (one TA project amounting to $400,000 – 2024) became effective. Undisbursed TA reversed as reduction in TA expenses totaled $145,000 ($106,000 – 2024). In addition, one grant (three grants – 2024) became effective, resulting in total grant expense of $900,000 ($2,000,000 – 2024).
As of 31 December 2025, undisbursed TA totaled $7,403,000 ($10,974,000 – 2024), which included $225,000 ($6,000 – 2024) of advances for TA, while undisbursed grants totaled $2,465,000 ($2,300,000 – 31 December 2024), including $386,000 ($272,000 – 2024) of advances for grants.
The FV of undisbursed TA or grant commitments approximates the amounts outstanding, because ADB expects that disbursements will substantially be made for all the projects/programs covered by the commitments.
NOTE F—UNCOMMITTED BALANCES
Uncommitted balances comprise amounts which have not been committed by CCF as of 31 December 2025 and 2024.
NOTE G—EXPENSES
Technical assistance—net
TA expenses are classified according to their nature using the budget allocation specified in the relevant TA agreement for the TA projects that became effective during the year. The details of TA expenses for the years ended 31 December 2025 and 2024 is as follows:
| ($ thousand) | ||||||||
| 2025 | 2024 | |||||||
| Consultants | $ | – | $ | 369 | ||||
| Training and seminars | – | 8 | ||||||
| Other expenses—neta | (145 | ) | (83 | ) | ||||
| Total | $ | (145 | ) | $ | 294 | |||
a Net of amounts reversed as reduction of TA expenses (See Note E).
220
CCF-4
continued
Administrative and other expenses
Administrative expenses include service fees which are incurred for management and general supporting activities. Other expenses include direct charges for project-related and operational-related expenses that are not part of a TA and/or part of an investment project.
The following table summarizes administrative and other expenses for the years ended 31 December 2025 and 2024:
| ($ thousand) | ||||||||
| 2025 | 2024 | |||||||
| Administrative expenses | ||||||||
| Service fees to OCR (Note D) | $ | 186 | $ | 305 | ||||
| Audit fees | 21 | 20 | ||||||
| Subtotal | 207 | 325 | ||||||
| Other expenses | ||||||||
| Direct charges | ||||||||
| Consultants | (4 | ) | 1,125 | |||||
| Workshops | 85 | 15 | ||||||
| 81 | 1,140 | |||||||
| Financial expenses | 1 | 1 | ||||||
| Subtotal | 82 | 1,141 | ||||||
| Total | $ | 289 | $ | 1,466 | ||||
NOTE H—LIQUIDITY AND AVAILABILITY OF RESOURCES
Liquidity risk refers to the risk that the fund has difficulties in meeting its short-term obligations. As part of CCF’s liquidity management, it has a policy to structure its financial assets to be available as its general expenditures, liabilities, and other obligations come due. In addition, CCF invests cash in excess of daily requirements in short-term investments.
As of 31 December 2025, the CCF has liquidity of $21,651,000 ($25,849,000 – 2024) consisting of DUE FROM BANKS of $884,000 ($1,059,000 – 2024) and INVESTMENTS FOR LIQUIDITY PURPOSE in time deposits of $20,767,000 ($24,790,000 – 2024), available within one year of the balance sheet date to meet cash needs for general expenditure. None of the financial assets are subject to donor or other contractual restrictions that make them unavailable for general expenditure within one year of the balance sheet date.
NOTE I—OTHER FAIR VALUE DISCLOSURES
As of 31 December 2025 and 2024, CCF has no assets or liabilities measured at FV on a non-recurring basis. See Notes C and E for discussions relating to investments for liquidity purpose and undisbursed TA and grants, respectively. In all other cases, the carrying amount of CCF’s assets and liabilities is considered to approximate FV.
NOTE J—SUBSEQUENT EVENTS
ADB has evaluated subsequent events after 31 December 2025 through 9 March 2026, the date these financial statements are available for issuance. As a result of this evaluation, there are no subsequent events that require recognition or disclosure in the CCF’s financial statements as of 31 December 2025.
221
ASIA PACIFIC DISASTER RESPONSE FUND
MANAGEMENT’S REPORT ON INTERNAL CONTROL OVER FINANCIAL REPORTING
The management of Asian Development Bank (“ADB”) is responsible for designing, implementing, and maintaining effective internal control over financial reporting. ADB’s internal control over financial reporting is a process designed to provide reasonable assurance regarding the preparation of reliable financial statements in accordance with generally accepted accounting principles in the United States of America.
ADB’s internal control over financial reporting includes those policies and procedures that (i) pertain to the maintenance of records that, in reasonable detail, accurately and fairly reflect the transactions and dispositions of the assets of ADB; (ii) provide reasonable assurance that transactions are recorded as necessary to permit preparation of financial statements in accordance with generally accepted accounting principles in the United States of America, and that receipts and expenditures of ADB are being made only in accordance with authorizations of management and directors of ADB; and (iii) provide reasonable assurance regarding prevention, or timely detection and correction, of unauthorized acquisition, use, or disposition of ADB’s assets that could have a material effect on the financial statements.
Because of its inherent limitations, internal control over financial reporting may not prevent, or detect and correct, misstatements. Also, projections of any assessment of effectiveness to future periods are subject to the risk that controls may become inadequate because of changes in conditions, or that the degree of compliance with the policies or procedures may deteriorate.
ADB’s management assessed the effectiveness of ADB’s internal control over financial reporting as of 31 December 2025, based on the criteria established in Internal Control – Integrated Framework (2013) issued by the Committee of Sponsoring Organizations of the Treadway Commission. Based on that assessment, management concluded that ADB’s internal control over financial reporting is effective as of 31 December 2025.
Masato Kanda
President
Roberta Casali
Vice-President (Finance and Risk Management)
Helen Hall
Controller
9 March 2026
222
| |
Deloitte & Touche LLP Tel: +65 6224 8288 |
INDEPENDENT AUDITOR’S REPORT
To the Board of Directors and the Board of Governors of
Asian Development Bank
Opinion on Internal Control Over Financial Reporting
We have audited the internal control over financial reporting of Asian Development Bank (“ADB”) as of 31 December 2025, based on the criteria established in Internal Control — Integrated Framework (2013) issued by the Committee of Sponsoring Organizations of the Treadway Commission (COSO). In our opinion, ADB maintained, in all material respects, effective internal control over financial reporting as of 31 December 2025, based on the criteria established in Internal Control — Integrated Framework (2013) issued by COSO.
We also have audited, in accordance with auditing standards generally accepted in the United States of America (GAAS), the financial statements as of and for the years ended 31 December 2025 and 2024 of ADB – Asia Pacific Disaster Response Fund, and our report dated 9 March 2026 expressed an unmodified opinion on those financial statements.
Basis for Opinion
We conducted our audit in accordance with GAAS. Our responsibilities under those standards are further described in the Auditor’s Responsibilities for the Audit of Internal Control over Financial Reporting section of our report. We are required to be independent of ADB and to meet our other ethical responsibilities, in accordance with the relevant ethical requirements relating to our audit. We believe that the audit evidence we have obtained is sufficient and appropriate to provide basis for our audit opinion.
Responsibilities of Management for Internal Control over Financial Reporting
Management is responsible for designing, implementing, and maintaining effective internal control over financial reporting, and for its assessment about the effectiveness of internal control over financial reporting, included in the accompanying Management’s Report on Internal Control over Financial Reporting.
Deloitte & Touche LLP (Unique Entity No. T08LL0721A) is an accounting limited liability partnership registered in Singapore under the Limited Liability Partnerships Act (Chapter 163A).
223
Auditor’s Responsibilities for the Audit of Internal Control over Financial Reporting
Our objectives are to obtain reasonable assurance about whether effective internal control over financial reporting was maintained in all material respects and to issue an auditor’s report that includes our opinion on internal control over financial reporting. Reasonable assurance is a high level of assurance but is not absolute assurance and therefore is not a guarantee that an audit of internal control over financial reporting conducted in accordance with GAAS will always detect a material weakness when it exists.
In performing an audit of internal control over financial reporting in accordance with GAAS, we:
| ● | Exercise professional judgment and maintain professional skepticism throughout the audit. |
| ● | Obtain an understanding of internal control over financial reporting, assess the risks that a material weakness exists, and test and evaluate the design and operating effectiveness of internal control over financial reporting based on the assessed risk. |
Definition and Inherent Limitations of Internal Control over Financial Reporting
ADB’s internal control over financial reporting is a process effected by management and directors of ADB, designed to provide reasonable assurance regarding the preparation of reliable financial statements in accordance with accounting principles generally accepted in the United States of America. ADB’s internal control over financial reporting includes those policies and procedures that (1) pertain to the maintenance of records that, in reasonable detail, accurately and fairly reflect the transactions and dispositions of the assets of ADB; (2) provide reasonable assurance that transactions are recorded as necessary to permit preparation of financial statements in accordance with accounting principles generally accepted in the United States of America, and that receipts and expenditures of ADB are being made only in accordance with authorizations of management and directors of ADB; and (3) provide reasonable assurance regarding prevention, or timely detection and correction of unauthorized acquisition, use, or disposition of ADB’s assets that could have a material effect on the financial statements.
Because of its inherent limitations, internal control over financial reporting may not prevent, or detect and correct, misstatements. Also, projections of any assessment of effectiveness to future periods are subject to the risk that the controls may become inadequate because of changes in conditions, or that the degree of compliance with the policies or procedures may deteriorate.
Public Accountants and
Chartered Accountants
Singapore
9 March 2026
224
| |
Deloitte & Touche LLP Tel: +65 6224 8288 |
INDEPENDENT AUDITOR’S REPORT
To the Board of Directors and the Board of Governors of
Asian Development Bank
Opinion
We have audited the financial statements of Asian Development Bank (“ADB”) – Asia Pacific Disaster Response Fund, which comprise the statements of financial position as of 31 December 2025 and 2024, and the related statements of activities and changes in net assets, and cash flows for the years then ended, and the related notes to the financial statements.
In our opinion, the accompanying financial statements present fairly, in all material respects, the financial position of ADB - Asia Pacific Disaster Response Fund as of 31 December 2025 and 2024, and the changes in its net assets and its cash flows for the years then ended in accordance with accounting principles generally accepted in the United States of America.
We have also audited, in accordance with auditing standards generally accepted in the United States of America (GAAS), ADB’s internal control over financial reporting as of 31 December 2025, based on the criteria established in Internal Control — Integrated Framework (2013) issued by the Committee of Sponsoring Organizations of the Treadway Commission and our report dated 9 March 2026 expressed an unmodified opinion on ADB’s internal control over financial reporting.
Basis for Opinion
We conducted our audits in accordance with GAAS. Our responsibilities under those standards are further described in the Auditor’s Responsibilities for the Audit of the Financial Statements section of our report. We are required to be independent of ADB - Asia Pacific Disaster Response Fund and to meet our other ethical responsibilities, in accordance with the relevant ethical requirements relating to our audits. We believe that the audit evidence we have obtained is sufficient and appropriate to provide a basis for our audit opinion.
Deloitte & Touche LLP (Unique Entity No. T08LL0721A) is an accounting limited liability partnership registered in Singapore under the Limited Liability Partnerships Act (Chapter 163A).
225
Responsibilities of Management for the Financial Statements
Management is responsible for the preparation and fair presentation of these financial statements in accordance with accounting principles generally accepted in the United States of America, and for the design, implementation, and maintenance of internal control relevant to the preparation and fair presentation of financial statements that are free from material misstatement, whether due to fraud or error.
In preparing the financial statements, management is required to evaluate whether there are conditions or events, considered in the aggregate, that raise substantial doubt about ADB – Asia Pacific Disaster Response Fund’s ability to continue as a going concern for one year after the date that the financial statements are available to be issued.
Auditor’s Responsibility for the Audit of the Financial Statements
Our objectives are to obtain reasonable assurance about whether the financial statements as a whole are free from material misstatement, whether due to fraud or error, and to issue an auditor’s report that includes our opinion. Reasonable assurance is a high level of assurance but is not absolute assurance and therefore is not a guarantee that an audit conducted in accordance with GAAS will always detect a material misstatement when it exists. The risk of not detecting a material misstatement resulting from fraud is higher than for one resulting from error, as fraud may involve collusion, forgery, intentional omissions, misrepresentations, or the override of internal control. Misstatements are considered material if there is a substantial likelihood that, individually or in the aggregate, they would influence the judgment made by a reasonable user based on the financial statements.
In performing an audit in accordance with GAAS, we:
| ● | Exercise professional judgment and maintain professional skepticism throughout the audit. |
| ● | Identify and assess the risks of material misstatement of the financial statements, whether due to fraud or error, and design and perform audit procedures responsive to those risks. Such procedures include examining, on a test basis, evidence regarding the amounts and disclosures in the financial statements. |
| ● | Obtain an understanding of internal control relevant to the audit in order to design audit procedures that are appropriate in the circumstances. |
| ● | Evaluate the appropriateness of accounting policies used and the reasonableness of significant accounting estimates made by management, as well as evaluate the overall presentation of the financial statements. |
| ● | Conclude whether, in our judgment, there are conditions or events, considered in the aggregate, that raise substantial doubt about ADB – Asia Pacific Disaster Response Fund’s ability to continue as a going concern for a reasonable period of time. |
We are required to communicate with those charged with governance regarding, among other matters, the planned scope and timing of the audit, significant audit findings, and certain internal control–related matters that we identified during the audit.
226
Other Information Included in the Annual Report
Management is responsible for the other information included in the annual report. The other information comprises the information included in the annual report but does not include the financial statements and our auditor’s report thereon. Our opinion on the financial statements does not cover the other information, and we do not express an opinion or any form of assurance thereon.
In connection with our audits of the financial statements, our responsibility is to read the other information and consider whether a material inconsistency exists between the other information and the financial statements, or the other information otherwise appears to be materially misstated. If, based on the work performed, we conclude that an uncorrected material misstatement of the other information exists, we are required to describe it in our report.
Public Accountants and
Chartered Accountants
Singapore
9 March 2026
227
APDRF-1
ASIAN DEVELOPMENT BANK—ASIA PACIFIC DISASTER RESPONSE FUND
STATEMENT OF FINANCIAL POSITION
31 December 2025 and 2024
Expressed in Thousands of US Dollars
| 2025 | 2024 | ||||||||||||
| ASSETS | |||||||||||||
| DUE FROM BANKS (Note H) | $ | 316 | $ | 2,840 | |||||||||
| INVESTMENTS FOR LIQUIDITY PURPOSE (Notes C, H and I) | |||||||||||||
| Time deposits | 21,371 | 31,643 | |||||||||||
| ACCRUED REVENUE | 93 | 174 | |||||||||||
| ADVANCES FOR GRANTS (Note E) | 6,500 | 2,800 | |||||||||||
| TOTAL | $ | 28,280 | $ | 37,457 | |||||||||
| LIABILITIES AND UNCOMMITTED BALANCES | ||||||||||||||||
| ACCOUNTS PAYABLE AND OTHER LIABILITIES | ||||||||||||||||
| Payable to related funds (Note D) | $ | 100 | $ | 266 | ||||||||||||
| Accrued expenses | 21 | $ | 121 | 20 | $ | 286 | ||||||||||
| UNDISBURSED GRANTS (Notes E and I) | 6,502 | 2,800 | ||||||||||||||
| TOTAL LIABILITIES | 6,623 | 3,086 | ||||||||||||||
| UNCOMMITTED BALANCES (APDRF-2, Note F), represented by: | ||||||||||||||||
| Net assets without donor restrictions | 21,657 | 34,371 | ||||||||||||||
| TOTAL | $ | 28,280 | $ | 37,457 |
The accompanying Notes are an integral part of these financial statements (APDRF-4).
228
APDRF-2
|
ASIAN DEVELOPMENT BANK—ASIA PACIFIC DISASTER RESPONSE FUND Expressed in Thousands of US Dollars
|
||||||||
|
2025 |
2024 |
|||||||
| CHANGES IN NET ASSETS WITHOUT DONOR RESTRICTIONS | ||||||||
| CONTRIBUTIONS (Note F) | $ | – | $ | 15,000 | ||||
| REVENUE | ||||||||
| From investments for liquidity purpose (Note C) | 1,146 | 2,271 | ||||||
| From other sources | 17 | 42 | ||||||
| NET ASSETS RELEASED FROM | ||||||||
| ASSETS WITH DONOR RESTRICTIONS | – | (16 | ) | |||||
| Total | 1,163 | 17,297 | ||||||
| EXPENSES | ||||||||
| Grants—net (Note E) | (13,500 | ) | (2,579 | ) | ||||
| Administrative and other expenses (Notes D and G) | (377 | ) | (110 | ) | ||||
| Total | (13,877 | ) | (2,689 | ) | ||||
| (DECREASE) INCREASE IN NET ASSETS WITHOUT DONOR RESTRICTIONS | (12,714 | ) | 14,608 | |||||
| CHANGES IN NET ASSETS WITH DONOR RESTRICTIONS | ||||||||
| NET ASSETS RELEASED TO ASSETS WITHOUT DONOR RESTRICTIONS | – | 16 | ||||||
| TRANSFER OF RESIDUAL FUNDS TO JFPR (Notes D and F) | – | (27,266 | ) | |||||
| DECREASE IN NET ASSETS WITH DONOR RESTRICTIONS | – | (27,250 | ) | |||||
| DECREASE IN NET ASSETS | (12,714 | ) | (12,642 | ) | ||||
| NET ASSETS AT BEGINNING OF YEAR | 34,371 | 47,013 | ||||||
| NET ASSETS AT END OF YEAR | $ | 21,657 | $ | 34,371 | ||||
The accompanying Notes are an integral part of these financial statements (APDRF-4).
229
APDRF-3
ASIAN DEVELOPMENT BANK—ASIA PACIFIC DISASTER RESPONSE FUND
STATEMENT OF CASH FLOWS
For the Years Ended 31 December 2025 and 2024
Expressed in Thousands of US Dollars
| 2025 | 2024 | |||||||
| CASH FLOWS FROM OPERATING ACTIVITIES | ||||||||
| Transfer of residual funds to JFPR | $ | (267 | ) | $ | (27,000 | ) | ||
| Contributions received | – | 15,000 | ||||||
| Interest received on investments for liquidity purpose | 1,227 | 2,149 | ||||||
| Cash received from other sources | 17 | 42 | ||||||
| Grants disbursed | (13,498 | ) | (3,278 | ) | ||||
| Administrative and other expenses paid | (275 | ) | (114 | ) | ||||
| Net Cash Used in Operating Activities | (12,796 | ) | (13,201 | ) | ||||
| CASH FLOWS FROM INVESTING ACTIVITIES | ||||||||
| Maturities of investments for liquidity purpose | 595,428 | 1,378,075 | ||||||
| Purchases of investments for liquidity purpose | (585,156 | ) | (1,371,756 | ) | ||||
| Net Cash Provided by Investing Activities | 10,272 | 6,319 | ||||||
| Net Decrease in Due From Banks | (2,524 | ) | (6,882 | ) | ||||
| Due from Banks at Beginning of Year | 2,840 | 9,722 | ||||||
| Due from Banks at End of Year | $ | 316 | $ | 2,840 | ||||
The accompanying Notes are an integral part of these financial statements (APDRF-4).
230
APDRF-4
ASIAN DEVELOPMENT BANK—ASIA PACIFIC DISASTER RESPONSE FUND
NOTES TO FINANCIAL STATEMENTS
31 December 2025 and 2024
NOTE A—NATURE OF OPERATIONS
The Asian Development Bank (ADB), a multilateral development bank, was established in 1966 with its headquarters in Manila, Philippines. ADB and its operations are governed by the Agreement Establishing the Asian Development Bank (the Charter). Its purpose is to foster economic development and co-operation in Asia and the Pacific region and to contribute to the acceleration of the process of economic development of the developing member countries (DMCs) in the region, collectively and individually. Since 1999, ADB’s corporate vision and mission has been to help DMCs reduce poverty in the region. This was reaffirmed under the long-term corporate strategy to 2030—Strategy 2030. Under Strategy 2030, ADB’s vision is to achieve a prosperous, inclusive, resilient, and sustainable Asia and the Pacific, while sustaining its efforts to eradicate extreme poverty. ADB will continue to prioritize the region’s poorest and most vulnerable countries. ADB provides financial and technical assistance for projects and programs, which will contribute to achieve this purpose. These are financed through ordinary capital resources (OCR) and Special Funds.1
The Asia Pacific Disaster Response Fund (APDRF) was established on 1 April 2009, to provide timely incremental grant resources to DMCs affected by disasters triggered by natural hazards. The APDRF will help bridge the gap between existing ADB arrangements that assist DMCs to reduce disaster risk through hazard mitigation loans and grants, and longer-term post-disaster reconstruction lending. The APDRF will provide quick-disbursing grants to assist DMCs in meeting immediate expenses to restore life-saving services to affected populations following a declared disaster and to augment aid provided by other donors in times of national crisis.
Financial assistance will be provided in the form of grants in an amount totaling up to $3,000,000 per event.
APDRF’s resources may consist of contributions from ADB and other bilateral, multilateral, and individual sources, including companies and foundations.
In September 2021, a second window under the APDRF was established to finance experts to provide speedy post-disaster technical support for the preparation of post-disaster needs assessments, recovery plans, and post-disaster projects, including emergency assistance loan. The second window will not finance any technical support needs arising during post-disaster project implementation and will not be available should the fund’s balance fall below $6,000,000.
ADB is immune from taxation pursuant to Chapter VIII, Article 56, Exemption from Taxation, of the Charter.
NOTE B—SUMMARY OF SIGNIFICANT ACCOUNTING POLICIES
Presentation of Financial Statements
The financial statements of the APDRF are prepared in accordance with accounting principles generally accepted in the United States of America (US GAAP), and are presented on the basis of those for not-for-profit organizations.
| 1 | Asian Development Fund (ADF), Technical Assistance Special Fund (TASF), Japan Special Fund (JSF), Asian Development Bank Institute (ADBI), Regional Cooperation and Integration Fund (RCIF), Climate Change Fund (CCF), Asia Pacific Disaster Response Fund (APDRF), and Financial Sector Development Partnership Special Fund (FSDPSF). |
231
APDRF-4
continued
The APDRF reports donor’s contributed cash and other assets as support without donor restrictions as these are made available to the APDRF without conditions other than for the purposes of pursuing the objectives of the APDRF.
The APDRF reports donor’s contributed cash and other assets as support with donor restrictions if they are received with donor stipulations that limit the use of the donated assets. When the donor restriction expires, that is, when a stipulated time or purpose restriction is accomplished, net assets with donor restrictions are reclassified to net assets without donor restrictions and reported in the Statement of Activities and Changes in Net Assets as NET ASSETS RELEASED TO ASSETS WITHOUT DONOR RESTRICTIONS.
Functional and Reporting Currency
The US dollar is the functional and reporting currency, representing the currency of the primary economic operating environment of the APDRF.
Translation of Currencies
ADB adopts the use of daily exchange rates for accounting and financial reporting purposes. This allows transactions denominated in non-US dollar currencies to be translated to the reporting currency using exchange rates applicable at the time of the transactions. Contributions included in the financial statements during the year are recognized at applicable exchange rates as of the respective dates of commitment. At the end of each accounting month, translations of assets and liabilities which are denominated in non-US dollar currencies are adjusted using the applicable exchange rates at the end of the reporting period. These translation adjustments are accounted for as exchange gains or losses and are credited or charged to operations.
Investments for Liquidity Purpose
All investments held by APDRF are reported at fair value (FV). Interest income on time deposits is recognized as earned and reported in REVENUE From investments for liquidity purpose.
Contributions
The contributions from donors and the allocations from net income of OCR are included in the financial statements, from the date of effectivity of the contributions agreement, and the Board of Governors’ approval, respectively.
Grants and Related Undisbursed Grants
Grants are recognized as expenses in the financial statements when the project becomes effective. Upon completion or cancellation of a grant, any undisbursed committed balance is reversed. Grant expenses are also reversed accordingly.
Advances are provided from grants to the executing agency or co-operating institution, for the purpose of making payments for eligible expenses. The advances are subject to liquidation and charged against undisbursed commitments. Any unutilized portion is required to be returned to the fund. These are included in ADVANCES FOR GRANTS.
232
APDRF-4
continued
Fair Value of Financial Instruments
Accounting Standards Codification (ASC) 820, “Fair Value Measurement” defines FV as the price that would be received to sell an asset or paid to transfer a liability at measurement date in an orderly transaction among willing participants with an assumption that the transaction takes place in the entity’s principal market, or in the absence of principal market, in the most advantageous market for the asset or liability. The most advantageous market is the market where the sale of the asset or transfer of liability would maximize the amount received for the asset or minimize the amount paid to transfer the liability. The FV measurement is not adjusted for transaction costs.
Fair Value Hierarchy
ASC 820 establishes a FV hierarchy that gives the highest priority to quoted prices in active markets for identical assets or liabilities (Level 1), next priority to observable market inputs or market corroborated data (Level 2), and the lowest priority to unobservable inputs without market corroborated data (Level 3).
The FVs of ADB’s financial assets and liabilities are categorized as follows:
Level 1: FVs are based on unadjusted quoted prices for identical assets or liabilities in active markets.
Level 2: FVs are based on quoted prices for similar assets or liabilities in active markets or markets that are not active; or valuation models for which significant inputs are obtained from market-based data that are observable.
Level 3: FVs are based on prices or valuation models for which significant inputs to the model are unobservable.
Accounting Estimates
The preparation of financial statements in conformity with US GAAP requires Management to make reasonable estimates and assumptions that affect the reported amounts of assets, liabilities and uncommitted balances as of the end of the year and the reported amounts of revenue and expenses during the year. The actual results could differ from those estimates.
Accounting and Reporting Developments
In March 2024, the Financial Accounting Standards Board (FASB) issued Accounting Standard Update (ASU) 2024-02, “Codification Improvements – Amendments to Remove References to the Concepts Statements”. This Update contains amendments to the Codification that remove references to various FASB Concepts Statements. The amendments in this Update are effective for public business entities for fiscal years beginning after 15 December 2024. For all other entities, the amendments are effective for fiscal years beginning after 15 December 2025. Early adoption is permitted for all entities. ADB does not expect the adoption of this Update to have a material impact on the financial statements.
In December 2025, the FASB issued ASU 2025-11, “Interim Reporting (Topic 270): Narrow-Scope Improvements”—aimed at enhancing the structure and clarity of interim reporting guidance. The amendments reorganize existing disclosure requirements, define what constitutes interim financial statements and notes under GAAP (including SEC considerations where relevant), and introduce a new disclosure principle requiring entities to report material events occurring after the preceding annual reporting period. While the Update improves consistency and usability, it does not expand or reduce current disclosure requirements. The amendments are effective for public business entities for interim periods within annual reporting periods beginning after 15 December 2027, and one year later for all other entities, with early adoption permitted. Entities may apply the amendments prospectively or retrospectively. This Update is not expected to have a significant impact on APDRF’s interim financial statements.
233
APDRF-4
continued
Additionally, the FASB issued ASU 2025-12, “Codification Improvements”, introducing clarifications, corrections, and other minor amendments across a wide range of Topics. These updates are designed to make the Codification easier to navigate and apply, particularly in areas where the original language may have caused confusion. The amendments take effect for all entities for annual reporting periods beginning after 15 December 2026, including the related interim periods. This Update is not expected to have a significant impact on APDRF’s financial statements.
Statement of Cash Flows
For the purposes of the Statement of Cash Flows, APDRF considers that its cash and cash equivalents are limited to DUE FROM BANKS, which pertain to current accounts in banks used for operational disbursements.
NOTE C—INVESTMENTS FOR LIQUIDITY PURPOSE
The main investment management objective is to maintain security and liquidity of funds invested. Subject to these parameters, ADB seeks the highest possible return on its investments. Investments are governed by the Investment Authority approved by the Board of Directors.
All investments for liquidity purpose held as of 31 December 2025 and 2024 were in US dollar time deposits. The rate of return on the average investments for liquidity purpose held during the year ended 31 December 2025 was 4.4% (5.6% – 2024).
Fair Value Disclosure
The FV of INVESTMENTS FOR LIQUIDITY PURPOSE as of 31 December 2025 and 2024 is as follows:
| ($ thousand) | ||||||||||||||||
| Fair Value Measurements | ||||||||||||||||
| Total | Level 1 | Level 2 | Level 3 | |||||||||||||
| 2025 | ||||||||||||||||
| Investments for liquidity purpose | ||||||||||||||||
| Time deposits | $ | 21,371 | $ | – | $ | 21,371 | $ | – | ||||||||
| 2024 | ||||||||||||||||
| Investments for liquidity purpose | ||||||||||||||||
| Time deposits | $ | 31,643 | $ | – | $ | 31,643 | $ | – | ||||||||
Time deposits are reported at cost, which approximates FV.
NOTE D—RELATED PARTY TRANSACTIONS
The OCR and Special Funds resources are at all times used, committed, and invested entirely separately from each other. The administrative and operational expenses pertaining to the APDRF are settled regularly with OCR and the other funds. Grants programs may be combined activities financed by Special Funds and trust funds. ADB charges a service fee to cover ADB’s cost for the administration, management, supervision, and operation of the APDRF. The service fee is set at 2% of the amount disbursed for grant components of investment projects. See Note G for service fees during the years ended 31 December 2025 and 2024.
234
APDRF-4
continued
The interfund account balances included in ACCOUNTS PAYABLE AND OTHER LIABILITIES as of 31 December 2025 and 2024 are as follows:
| ($ thousand) | ||||||||
| 2025 | 2024 | |||||||
| Payable to: | ||||||||
| Ordinary capital resources | $ | 100 | $ | – | ||||
| JFPR (Note F) | – | 266 | ||||||
| Total | $ | 100 | $ | 266 | ||||
JFPR = Japan Fund for Prosperous and Resilient Asia and the Pacific
NOTE E—GRANTS AND UNDISBURSED GRANTS
During 2025, six grants (one grant – 2024) became effective resulting in a total Grants expense of $13,500,000 ($2,579,000 – 2024). There were no undisbursed grants that were reversed as a reduction in Grants expense during the period ($221,000 – 2024).
Undisbursed grants are denominated in US dollars and represent effective grants not yet disbursed and unliquidated. The undisbursed grants of $6,502,000 as of 31 December 2025 ($2,800,000 – 2024) includes $6,500,000 ($2,800,000 – 2024) advances for grants.
NOTE F—CONTRIBUTIONS AND UNCOMITTED BALANCES
No allocation was made for APDRF from OCR’s 2024 net income in 2025 ($15,000,000 – 2024).
Contributions received for specific purpose or grant programs are classified as support with donor restrictions. In May 2020, the Government of Japan contributed $75,000,000 to the APDRF, valid for two years, earmarked for ADB’s response to the coronavirus disease (COVID-19) pandemic. In July 2023, the government requested ADB to transfer the unused remaining balance of its contributions to the Japan Fund for Prosperous and Resilient Asia and the Pacific (JFPR), resulting in an initial transfer of $27,000,000 in August 2024, and a final transfer of $267,000 in June 2025 to JFPR.
Uncommitted balances comprise amounts which have not been committed by APDRF as of 31 December 2025 and 2024.
NOTE G—ADMINISTRATIVE AND OTHER EXPENSES
Administrative expenses includes service fees to OCR and audit fees, which are incurred for management and general supporting activities. Other expenses include direct charges of consultants engaged under the second window to provide a speedy post-disaster technical support.
235
APDRF-4
continued
The following table below summarizes the administrative and other expenses for the years ended 31 December 2025 and 2024:
| ($ thousand) | ||||||||
| 2025 | 2024 | |||||||
| Administrative expenses | ||||||||
| Service fees to OCR (Note D) | $ | 196 | $ | 90 | ||||
| Audit fees | 21 | 20 | ||||||
| Subtotal | 217 | 110 | ||||||
| Other expenses | ||||||||
| Direct charges | ||||||||
| Consultants | 160 | 0 | ||||||
| Total | $ | 377 | $ | 110 | ||||
0 = Less than $500.
NOTE H—LIQUIDITY AND AVAILABILITY OF RESOURCES
Liquidity risk refers to the risk that the fund has difficulties in meeting its short-term obligations. As part of APDRF’s liquidity management, it has a policy to structure its financial assets to be available as its general expenditures, liabilities, and other obligations come due. In addition, APDRF invests cash in excess of daily requirements in short-term investments.
As of 31 December 2025, APDRF has liquidity of $21,687,000 ($34,483,000 – 2024) consisting of DUE FROM BANKS of $316,000 ($2,840,000 – 2024) and INVESTMENTS FOR LIQUIDITY PURPOSE in time deposits of $21,371,000 ($31,643,000 – 2024), available within one year of the balance sheet date to meet cash needs for general expenditure. See Note F for discussions relating to donor restrictions on the APDRF’s uncommitted balance.
NOTE I—OTHER FAIR VALUE DISCLOSURES
As of 31 December 2025 and 2024, APDRF has no assets or liabilities measured at FV on a non-recurring basis. See Notes C and E for discussions relating to investments for liquidity purpose and undisbursed grants, respectively. In all other cases, the carrying amount of APDRF’s assets and liabilities is considered to approximate FV.
NOTE J—SUBSEQUENT EVENTS
ADB has evaluated subsequent events after 31 December 2025 through 9 March 2026, the date these financial statements are available for issuance. As a result of this evaluation, there are no subsequent events that require recognition or disclosure in the APDRF’s financial statements as of 31 December 2025.
236
FINANCIAL SECTOR DEVELOPMENT PARTNERSHIP SPECIAL FUND
MANAGEMENT’S REPORT ON INTERNAL CONTROL OVER FINANCIAL REPORTING
The management of Asian Development Bank (“ADB”) is responsible for designing, implementing, and maintaining effective internal control over financial reporting. ADB’s internal control over financial reporting is a process designed to provide reasonable assurance regarding the preparation of reliable financial statements in accordance with generally accepted accounting principles in the United States of America.
ADB’s internal control over financial reporting includes those policies and procedures that (i) pertain to the maintenance of records that, in reasonable detail, accurately and fairly reflect the transactions and dispositions of the assets of ADB; (ii) provide reasonable assurance that transactions are recorded as necessary to permit preparation of financial statements in accordance with generally accepted accounting principles in the United States of America, and that receipts and expenditures of ADB are being made only in accordance with authorizations of management and directors of ADB; and (iii) provide reasonable assurance regarding prevention, or timely detection and correction, of unauthorized acquisition, use, or disposition of ADB’s assets that could have a material effect on the financial statements.
Because of its inherent limitations, internal control over financial reporting may not prevent, or detect and correct, misstatements. Also, projections of any assessment of effectiveness to future periods are subject to the risk that controls may become inadequate because of changes in conditions, or that the degree of compliance with the policies or procedures may deteriorate.
ADB’s management assessed the effectiveness of ADB’s internal control over financial reporting as of 31 December 2025, based on the criteria established in Internal Control – Integrated Framework (2013) issued by the Committee of Sponsoring Organizations of the Treadway Commission. Based on that assessment, management concluded that ADB’s internal control over financial reporting is effective as of 31 December 2025.
Masato Kanda
President
Roberta Casali
Vice-President (Finance and Risk Management)
Helen Hall
Controller
9 March 2026
237
| |
Deloitte & Touche LLP Tel: +65 6224 8288 |
INDEPENDENT AUDITOR’S REPORT
To the Board of Directors and the Board of Governors of
Asian Development Bank
Opinion on Internal Control Over Financial Reporting
We have audited the internal control over financial reporting of Asian Development Bank (“ADB”) as of 31 December 2025, based on the criteria established in Internal Control — Integrated Framework (2013) issued by the Committee of Sponsoring Organizations of the Treadway Commission (COSO). In our opinion, ADB maintained, in all material respects, effective internal control over financial reporting as of 31 December 2025, based on the criteria established in Internal Control — Integrated Framework (2013) issued by COSO.
We also have audited, in accordance with auditing standards generally accepted in the United States of America (GAAS), the financial statements as of and for the years ended 31 December 2025 and 2024 of ADB – Financial Sector Development Partnership Special Fund, and our report dated 9 March 2026 expressed an unmodified opinion on those financial statements.
Basis for Opinion
We conducted our audit in accordance with GAAS. Our responsibilities under those standards are further described in the Auditor’s Responsibilities for the Audit of Internal Control over Financial Reporting section of our report. We are required to be independent of ADB and to meet our other ethical responsibilities, in accordance with the relevant ethical requirements relating to our audit. We believe that the audit evidence we have obtained is sufficient and appropriate to provide basis for our audit opinion.
Responsibilities of Management for Internal Control over Financial Reporting
Management is responsible for designing, implementing, and maintaining effective internal control over financial reporting, and for its assessment about the effectiveness of internal control over financial reporting, included in the accompanying Management’s Report on Internal Control over Financial Reporting.
Deloitte & Touche LLP (Unique Entity No. T08LL0721A) is an accounting limited liability partnership registered in Singapore under the Limited Liability Partnerships Act (Chapter 163A).
238
Auditor’s Responsibilities for the Audit of Internal Control over Financial Reporting
Our objectives are to obtain reasonable assurance about whether effective internal control over financial reporting was maintained in all material respects and to issue an auditor’s report that includes our opinion on internal control over financial reporting. Reasonable assurance is a high level of assurance but is not absolute assurance and therefore is not a guarantee that an audit of internal control over financial reporting conducted in accordance with GAAS will always detect a material weakness when it exists.
In performing an audit of internal control over financial reporting in accordance with GAAS, we:
| ● | Exercise professional judgment and maintain professional skepticism throughout the audit. |
| ● | Obtain an understanding of internal control over financial reporting, assess the risks that a material weakness exists, and test and evaluate the design and operating effectiveness of internal control over financial reporting based on the assessed risk. |
Definition and Inherent Limitations of Internal Control over Financial Reporting
ADB’s internal control over financial reporting is a process effected by management and directors of ADB, designed to provide reasonable assurance regarding the preparation of reliable financial statements in accordance with accounting principles generally accepted in the United States of America. ADB’s internal control over financial reporting includes those policies and procedures that (1) pertain to the maintenance of records that, in reasonable detail, accurately and fairly reflect the transactions and dispositions of the assets of ADB; (2) provide reasonable assurance that transactions are recorded as necessary to permit preparation of financial statements in accordance with accounting principles generally accepted in the United States of America, and that receipts and expenditures of ADB are being made only in accordance with authorizations of management and directors of ADB; and (3) provide reasonable assurance regarding prevention, or timely detection and correction of unauthorized acquisition, use, or disposition of ADB’s assets that could have a material effect on the financial statements.
Because of its inherent limitations, internal control over financial reporting may not prevent, or detect and correct, misstatements. Also, projections of any assessment of effectiveness to future periods are subject to the risk that the controls may become inadequate because of changes in conditions, or that the degree of compliance with the policies or procedures may deteriorate.
Public Accountants and
Chartered Accountants
Singapore
9 March 2026
239
| |
Deloitte & Touche LLP Tel: +65 6224 8288 |
INDEPENDENT AUDITOR’S REPORT
To the Board of Directors and the Board of Governors of
Asian Development Bank
Opinion
We have audited the financial statements of Asian Development Bank (“ADB”) – Financial Sector Development Partnership Special Fund, which comprise the statements of financial position as of 31 December 2025 and 2024, and the related statements of activities and changes in net assets, and cash flows for the years then ended, and the related notes to the financial statements.
In our opinion, the accompanying financial statements present fairly, in all material respects, the financial position of ADB - Financial Sector Development Partnership Special Fund as of 31 December 2025 and 2024, and the changes in its net assets and its cash flows for the years then ended in accordance with accounting principles generally accepted in the United States of America.
We have also audited, in accordance with auditing standards generally accepted in the United States of America (GAAS), ADB’s internal control over financial reporting as of 31 December 2025, based on the criteria established in Internal Control — Integrated Framework (2013) issued by the Committee of Sponsoring Organizations of the Treadway Commission and our report dated 9 March 2026 expressed an unmodified opinion on ADB’s internal control over financial reporting.
Basis for Opinion
We conducted our audits in accordance with GAAS. Our responsibilities under those standards are further described in the Auditor’s Responsibilities for the Audit of the Financial Statements section of our report. We are required to be independent of ADB - Financial Sector Development Partnership Special Fund and to meet our other ethical responsibilities, in accordance with the relevant ethical requirements relating to our audits. We believe that the audit evidence we have obtained is sufficient and appropriate to provide a basis for our audit opinion.
Deloitte & Touche LLP (Unique Entity No. T08LL0721A) is an accounting limited liability partnership registered in Singapore under the Limited Liability Partnerships Act (Chapter 163A).
240
Responsibilities of Management for the Financial Statements
Management is responsible for the preparation and fair presentation of these financial statements in accordance with accounting principles generally accepted in the United States of America, and for the design, implementation, and maintenance of internal control relevant to the preparation and fair presentation of financial statements that are free from material misstatement, whether due to fraud or error.
In preparing the financial statements, management is required to evaluate whether there are conditions or events, considered in the aggregate, that raise substantial doubt about ADB – Financial Sector Development Partnership Special Fund’s ability to continue as a going concern for one year after the date that the financial statements are available to be issued.
Auditor’s Responsibility for the Audit of the Financial Statements
Our objectives are to obtain reasonable assurance about whether the financial statements as a whole are free from material misstatement, whether due to fraud or error, and to issue an auditor’s report that includes our opinion. Reasonable assurance is a high level of assurance but is not absolute assurance and therefore is not a guarantee that an audit conducted in accordance with GAAS will always detect a material misstatement when it exists. The risk of not detecting a material misstatement resulting from fraud is higher than for one resulting from error, as fraud may involve collusion, forgery, intentional omissions, misrepresentations, or the override of internal control. Misstatements are considered material if there is a substantial likelihood that, individually or in the aggregate, they would influence the judgment made by a reasonable user based on the financial statements.
In performing an audit in accordance with GAAS, we:
| ● | Exercise professional judgment and maintain professional skepticism throughout the audit. |
| ● | Identify and assess the risks of material misstatement of the financial statements, whether due to fraud or error, and design and perform audit procedures responsive to those risks. Such procedures include examining, on a test basis, evidence regarding the amounts and disclosures in the financial statements. |
| ● | Obtain an understanding of internal control relevant to the audit in order to design audit procedures that are appropriate in the circumstances. |
| ● | Evaluate the appropriateness of accounting policies used and the reasonableness of significant accounting estimates made by management, as well as evaluate the overall presentation of the financial statements. |
| ● | Conclude whether, in our judgment, there are conditions or events, considered in the aggregate, that raise substantial doubt about ADB – Financial Sector Development Partnership Special Fund’s ability to continue as a going concern for a reasonable period of time. |
We are required to communicate with those charged with governance regarding, among other matters, the planned scope and timing of the audit, significant audit findings, and certain internal control–related matters that we identified during the audit.
241
Other Information Included in the Annual Report
Management is responsible for the other information included in the annual report. The other information comprises the information included in the annual report but does not include the financial statements and our auditor’s report thereon. Our opinion on the financial statements does not cover the other information, and we do not express an opinion or any form of assurance thereon.
In connection with our audits of the financial statements, our responsibility is to read the other information and consider whether a material inconsistency exists between the other information and the financial statements, or the other information otherwise appears to be materially misstated. If, based on the work performed, we conclude that an uncorrected material misstatement of the other information exists, we are required to describe it in our report.
Public Accountants and
Chartered Accountants
Singapore
9 March 2026
242
FSDPSF-1
ASIAN DEVELOPMENT BANK—FINANCIAL SECTOR DEVELOPMENT PARTNERSHIP SPECIAL FUND
STATEMENT OF FINANCIAL POSITION
31 December 2025 and 2024
Expressed in Thousands of US Dollars
| 2025 | 2024 | |||||||||||
| ASSETS | ||||||||||||
| DUE FROM BANKS (Note H) | $ |
453 | $ | 557 | ||||||||
| INVESTMENTS FOR LIQUIDITY PURPOSE (Notes C, and I) | ||||||||||||
| Time deposits | 11,446 | 10,458 | ||||||||||
| ACCRUED REVENUE | 42 | 53 | ||||||||||
| ADVANCES FOR TECHNICAL ASSISTANCE (Note E) | – | 8 | ||||||||||
| TOTAL | $ |
11,941 | $ | 11,076 | ||||||||
|
LIABILITIES AND UNCOMMITTED BALANCES |
||||||||||||||||
| ACCOUNTS PAYABLE AND OTHER LIABILITIES | ||||||||||||||||
| Payable to related funds (Note D) | $ | 98 | $ | 21 | ||||||||||||
| Accrued Expenses | 21 | $ | 119 | 20 | $ | 41 | ||||||||||
| UNDISBURSED TECHNICAL ASSISTANCE (Notes E and I) | 9,383 | 9,830 | ||||||||||||||
| TOTAL LIABILITIES | 9,502 | 9,871 | ||||||||||||||
| UNCOMMITTED BALANCES (FSDPSF-2), represented by: | ||||||||||||||||
| Net assets without donor restrictions | 2,439 | 1,205 | ||||||||||||||
| TOTAL | $ | 11,941 | $ | 11,076 | ||||||||||||
The accompanying Notes are an integral part of these financial statements (FSDPSF-4).
243
|
FSDPSF-2
ASIAN DEVELOPMENT BANK—FINANCIAL SECTOR DEVELOPMENT PARTNERSHIP SPECIAL FUND
|
||||||||
|
2025 |
2024 |
|||||||
| CHANGES IN NET ASSETS WITHOUT DONOR RESTRICTIONS | ||||||||
| CONTRIBUTIONS (Note F) | $ | 2,824 | $ | – | ||||
| REVENUE | ||||||||
| From investments for liquidity purpose (Note C) | 477 | 591 | ||||||
| From other sources | 7 | 18 | ||||||
| Total | 3,308 | 609 | ||||||
| EXPENSES | ||||||||
| Technical assistance—net (Notes E and G) | (1,991 | ) | (4,136 | ) | ||||
| Administrative and financial expenses (Notes D and G) | (144 | ) | (124 | ) | ||||
| Total | (2,135 | ) | (4,260 | ) | ||||
| CONTRIBUTIONS AND REVENUE IN EXCESS OF (LESS THAN) EXPENSES | 1,173 | (3,651 | ) | |||||
| EXCHANGE GAINS (LOSSES)—net | 61 | (38 | ) | |||||
| INCREASE (DECREASE) IN NET ASSETS | 1,234 | (3,689 | ) | |||||
| NET ASSETS AT BEGINNING OF YEAR | 1,205 | 4,894 | ||||||
| NET ASSETS AT END OF YEAR | $ | 2,439 | $ | 1,205 | ||||
The accompanying Notes are an integral part of these financial statements (FSDPSF-4).
244
FSDPSF-3
ASIAN DEVELOPMENT BANK—FINANCIAL SECTOR DEVELOPMENT PARTNERSHIP SPECIAL FUND
STATEMENT OF CASH FLOWS
For the Years Ended 31 December 2025 and 2024
Expressed in Thousands of US Dollars
| 2025 | 2024 | |||||||
| CASH FLOWS FROM OPERATING ACTIVITIES | ||||||||
| Contributions received | $ | 2,885 | $ | 2,170 | ||||
| Interest received on investments for liquidity purpose | 488 | 549 | ||||||
| Cash received from other sources | 7 | 18 | ||||||
| Technical assistance disbursed | (2,362 | ) | (2,064 | ) | ||||
| Administrative and financial expenses paid | (134 | ) | (129 | ) | ||||
| Net Cash Provided by Operating Activities | 884 | 544 | ||||||
| CASH FLOWS FROM INVESTING ACTIVITIES | ||||||||
| Maturities of investments for liquidity purpose | 254,195 | 319,751 | ||||||
| Purchases of investments for liquidity purpose | (255,183 | ) | (322,000 | ) | ||||
| Net Cash Used in Investing Activities | (988 | ) | (2,249 | ) | ||||
| Net Decrease in Due From Banks | (104 | ) | (1,705 | ) | ||||
| Due from Banks at Beginning of Year | 557 | 2,262 | ||||||
| Due from Banks at End of Year | $ | 453 | $ | 557 | ||||
The accompanying Notes are an integral part of these financial statements (FSDPSF-4).
245
FSDPSF-4
ASIAN DEVELOPMENT BANK—FINANCIAL SECTOR DEVELOPMENT PARTNERSHIP SPECIAL FUND
NOTES TO FINANCIAL STATEMENTS
31 December 2025 and 2024
NOTE A—NATURE OF OPERATIONS
The Asian Development Bank (ADB), a multilateral development bank, was established in 1966 with its headquarters in Manila, Philippines. ADB and its operations are governed by the Agreement Establishing the Asian Development Bank (the Charter). Its purpose is to foster economic development and co-operation in Asia and the Pacific region and to contribute to the acceleration of the process of economic development of the developing member countries (DMCs) in the region, collectively and individually. Since 1999, ADB’s corporate vision and mission has been to help DMCs reduce poverty in the region. This was reaffirmed under the long-term corporate strategy to 2030—Strategy 2030. Under Strategy 2030, ADB’s vision is to achieve a prosperous, inclusive, resilient, and sustainable Asia and the Pacific, while sustaining its efforts to eradicate extreme poverty. ADB will continue to prioritize the region’s poorest and most vulnerable countries. ADB provides financial and technical assistance for projects and programs, which will contribute to achieve this purpose. These are financed through ordinary capital resources (OCR) and Special Funds.1
The Financial Sector Development Partnership Special Fund (FSDPSF) was approved by the Board of Directors and established on 31 January 2013 to strengthen regional, subregional, and national financial systems in Asia and the Pacific. The FSDPSF will provide financial assistance through grants for components of investments projects and technical assistance projects.
FSDPSF’s resources may consist of contributions from ADB and other bilateral, multilateral, and individual sources, including companies and foundations.
ADB is immune from taxation pursuant to Chapter VIII, Article 56, Exemption from Taxation, of the Charter.
NOTE B—SUMMARY OF SIGNIFICANT ACCOUNTING POLICIES
Presentation of Financial Statements
The financial statements of the FSDPSF are prepared in accordance with accounting principles generally accepted in the United States of America (US GAAP), and are presented on the basis of those for not-for-profit organizations.
FSDPSF reports donors’ contributions of cash and other assets as assets without donor restrictions as these are made available to FSDPSF without conditions other than for the purpose of pursuing its objectives.
Functional and Reporting Currency
The US dollar is the functional and reporting currency, representing the currency of the primary economic operating environment of the FSDPSF.
Translation of Currencies
ADB adopts the use of daily exchange rates for accounting and financial reporting purposes. This allows transactions denominated in non-US dollar currencies to be translated to the reporting currency using exchange rates applicable at the time of the transactions. Contributions included in the financial statements during the year are recognized at applicable exchange rates as of the respective dates of commitment. At the end of each accounting month, translations of assets and liabilities which are denominated in non-US dollar currencies are adjusted using the applicable exchange rates at the end of the reporting period. These translation adjustments are accounted for as exchange gains or losses and are credited or charged to operations.
1 Asian Development Fund (ADF), Technical Assistance Special Fund (TASF), Japan Special Fund (JSF), Asian Development Bank Institute (ADBI), Regional Cooperation and Integration Fund (RCIF), Climate Change Fund (CCF), Asia Pacific Disaster Response Fund (APDRF), and Financial Sector Development Partnership Special Fund (FSDPSF).
246
FSDPSF-4
continued
Investments for Liquidity Purpose
All investments held by FSDPSF are reported at fair value (FV). Interest income on time deposits is recognized as earned and reported in REVENUE From investments for liquidity purpose.
Contributions
The contributions from donors and the allocations from net income of OCR are included in the financial statements, from the date of effectivity of the contributions agreement, and the Board of Governors’ approval, respectively.
Technical Assistance and Related Undisbursed Balance
Technical assistance (TA) are recognized as expense in the financial statements when the project becomes effective. Upon completion or cancellation of a TA project, any undisbursed committed balance is reversed. TA expenses are also reversed accordingly.
Advances are provided from TA to the executing agency or co-operating institution, for the purpose of making payments for eligible expenses. The advances are subject to liquidation and charged against undisbursed commitments. Any unutilized portion is required to be returned to the fund. These are included in ADVANCES FOR TECHNICAL ASSISTANCE.
Fair Value of Financial Instruments
Accounting Standards Codification (ASC) 820, “Fair Value Measurement” defines FV as the price that would be received to sell an asset or paid to transfer a liability at measurement date in an orderly transaction among willing participants with an assumption that the transaction takes place in the entity’s principal market, or in the absence of principal market, in the most advantageous market for the asset or liability. The most advantageous market is the market where the sale of the asset or transfer of liability would maximize the amount received for the asset or minimize the amount paid to transfer the liability. The FV measurement is not adjusted for transaction costs.
Fair Value Hierarchy
ASC 820 establishes a FV hierarchy that gives the highest priority to quoted prices in active markets for identical assets or liabilities (Level 1), next priority to observable market inputs or market corroborated data (Level 2), and the lowest priority to unobservable inputs without market corroborated data (Level 3).
The FVs of ADB’s financial assets and liabilities are categorized as follows:
Level 1: FVs are based on unadjusted quoted prices for identical assets or liabilities in active markets.
Level 2: FVs are based on quoted prices for similar assets or liabilities in active markets or markets that are not active; or valuation models for which significant inputs are obtained from market-based data that are observable.
Level 3: FVs are based on prices or valuation models for which significant inputs to the model are unobservable.
247
FSDPSF-4
continued
Accounting Estimates
The preparation of financial statements in conformity with US GAAP requires Management to make reasonable estimates and assumptions that affect the reported amounts of assets, liabilities and uncommitted balances as of the end of the year and the reported amounts of revenue and expenses during the year. The actual results could differ from those estimates.
Accounting and Reporting Developments
In March 2024, the Financial Accounting Standards Board (FASB) issued Accounting Standard Update (ASU) 2024-02, “Codification Improvements – Amendments to Remove References to the Concepts Statements”. This Update contains amendments to the Codification that remove references to various FASB Concepts Statements. The amendments in this Update are effective for public business entities for fiscal years beginning after 15 December 2024. For all other entities, the amendments are effective for fiscal years beginning after 15 December 2025. Early adoption is permitted for all entities. ADB does not expect the adoption of this Update to have a material impact on the financial statements.
In December 2025, the FASB issued ASU 2025-11, “Interim Reporting (Topic 270): Narrow-Scope Improvements”—aimed at enhancing the structure and clarity of interim reporting guidance. The amendments reorganize existing disclosure requirements, define what constitutes interim financial statements and notes under GAAP (including SEC considerations where relevant), and introduce a new disclosure principle requiring entities to report material events occurring after the preceding annual reporting period. While the Update improves consistency and usability, it does not expand or reduce current disclosure requirements. The amendments are effective for public business entities for interim periods within annual reporting periods beginning after 15 December 2027, and one year later for all other entities, with early adoption permitted. Entities may apply the amendments prospectively or retrospectively. This Update is not expected to have a significant impact on FSDPSF’s interim financial statements.
Additionally, the FASB issued ASU 2025-12, “Codification Improvements”, introducing clarifications, corrections, and other minor amendments across a wide range of Topics. These updates are designed to make the Codification easier to navigate and apply, particularly in areas where the original language may have caused confusion. The amendments take effect for all entities for annual reporting periods beginning after 15 December 2026, including the related interim periods. This Update is not expected to have a significant impact on FSDPSF’s financial statements.
Statement of Cash Flows
For the purposes of the Statement of Cash Flows, FSDPSF considers that its cash and cash equivalents are limited to DUE FROM BANKS, which pertain to current accounts in banks used for operational disbursements.
NOTE C—INVESTMENTS FOR LIQUIDITY PURPOSE
The main investment management objective is to maintain security and liquidity of funds invested. Subject to these parameters, ADB seeks the highest possible return on its investments. Investments are governed by the Investment Authority approved by the Board of Directors.
All investments for liquidity purpose held as of 31 December 2025 and 2024 were in US dollar time deposits.
The rate of return on the average investments for liquidity purpose held during the year ended 31 December 2025 was 4.4% (5.3% – 2024).
248
FSDPSF-4
continued
Fair Value Disclosure
The FV of INVESTMENTS FOR LIQUIDITY PURPOSE as of 31 December 2025 and 2024 is as follows:
| ($ thousand) | ||||||||||||||||
| Fair Value Measurements | ||||||||||||||||
| Total | Level 1 | Level 2 | Level 3 | |||||||||||||
| 2025 | ||||||||||||||||
| Investments for liquidity purpose | ||||||||||||||||
| Time deposits | $ | 11,446 | $ | – | $ | 11,446 | $ | – | ||||||||
| 2024 | ||||||||||||||||
| Investments for liquidity purpose | ||||||||||||||||
| Time deposits | $ | 10,458 | $ | – | $ | 10,458 | $ | – | ||||||||
Time deposits are reported at cost, which approximates FV.
NOTE D—RELATED PARTY TRANSACTIONS
The OCR and Special Funds resources are at all times used, committed, and invested entirely separately from each other. The administrative and operational expenses pertaining to the FSDPSF is settled regularly with OCR and the other funds. Regional technical assistance projects and programs may be combined activities financed by Special Funds and trust funds. ADB charges a service fee to cover ADB’s incremental cost for the administration, management, supervision, and operation of the FSDPSF. The service fees are set at (i) 5% of amounts disbursed for technical assistance projects; and (ii) 5% of amounts disbursed for grant components of investment projects up to $5,000,000, or 2% of amounts disbursed for grant components of investment projects above $5,000,000 with a minimum of $250,000, whichever is greater. As of 31 December 2025, all service fees pertain to the administration of TA projects. See Note G for service fees during the years ended 31 December 2025 and 2024.
The interfund account balances included in ACCOUNTS PAYABLE AND OTHER LIABILITIES as of 31 December 2025 and 2024 are as follows:
| ($ thousand) | ||||||||
| 2025 | 2024 | |||||||
| Payable to: | ||||||||
| Ordinary capital resources- net | $ | 21 | $ | 14 | ||||
| Technical Assistance Special Fund | 65 | 7 | ||||||
| Trust Fund | 11 | – | ||||||
| Total | $ | 98 | $ | 21 | ||||
Note: Numbers may not sum precisely because of rounding.
249
FSDPSF-4
continued
NOTE E—TECHNICAL ASSISTANCE AND UNDISBURSED TECHNICAL ASSISTANCE
Undisbursed TA are denominated in US dollars and represent effective TA projects not yet disbursed and unliquidated.
For the year ended 31 December 2025, three TA projects and thirteen supplementary TA (five TA projects and ten supplementary TA – 2024) became effective resulting in a total TA expense of $1,991,000 ($4,136,000 – 2024), net of $734,000 ($179,000– 2024) undisbursed TA that were reversed as reduction in TA expenses.
As of 31 December 2025, undisbursed TA amounted to $9,383,000 ($9,830,000 – 2024), including nil ($8,000 – 2024) advances for TA.
The FV of undisbursed commitments approximates the amounts outstanding, because ADB expects that disbursements will substantially be made for all the projects/programs covered by the commitments.
NOTE F—CONTRIBUTIONS AND UNCOMMITTED BALANCES
In May 2025, the Government of Luxembourg committed a contribution of €2,500,000 (equivalent to $2,824,000 at the time of commitment), which was transferred to the FSDPSF in July 2025.
Uncommitted balances comprise amounts which have not been committed by FSDPSF as of 31 December 2025 and 2024.
NOTE G—EXPENSES
Technical assistance—net
TA expenses are classified according to its nature using the budget allocation specified in the relevant TA agreement for the TA projects that became effective during the year. The details of TA expenses for the years ended 31 December 2025 and 2024 are as follows:
| ($ thousand) | ||||||||
| 2025 | 2024 | |||||||
| Consultants | $ | 1,608 | $ | 3,326 | ||||
| Trainings and Seminars | 879 | 485 | ||||||
| Studies | 5 | 120 | ||||||
| Other expenses–neta | (501 | ) | 205 | |||||
| Total | $ | 1,991 | $ | 4,136 | ||||
| a | Net of amounts reversed as reduction of TA expenses (See Note E). |
250
FSDPSF-4
continued
Administrative and financial expenses
The administrative expenses include service fees to OCR and audit fees, which are incurred for management and general supporting activities. The table below summarizes the administrative expenses for the years ended 31 December 2025 and 2024:
| ($ thousand) | ||||||||
| 2025 | 2024 | |||||||
| Service fees to OCR (Note D) | $ | 122 | $ | 104 | ||||
| Audit fees | 21 | 20 | ||||||
| Financial expenses | 1 | 0 | ||||||
| Total | $ | 144 | $ | 124 | ||||
0 = less than $500.
NOTE H—LIQUIDITY AND AVAILABILITY OF RESOURCES
Liquidity risk refers to the risk that the fund has difficulties in meeting its short-term obligations. As part of FSDPSF’s liquidity management, it has a policy to structure its financial assets to be available as its general expenditures, liabilities, and other obligations come due. In addition, FSDPSF invests cash in excess of daily requirements in short-term investments.
As of 31 December 2025, FSDPSF has liquidity of $11,899,000 ($11,015,000 – 2024) consisting of DUE FROM BANKS of $453,000 ($557,000 – 2024) and INVESTMENTS FOR LIQUIDITY PURPOSE in time deposits of $11,446,000 ($10,458,000 – 2024), available within one year of the balance sheet date to meet cash needs for general expenditure. None of the financial assets are subject to donor or other contractual restrictions that make them unavailable for general expenditure within one year of the balance sheet date.
NOTE I—OTHER FAIR VALUE DISCLOSURES
As of 31 December 2025 and 2024, FSDPSF has no assets or liabilities measured at FV on a non-recurring basis. See Notes C and E for discussions relating to investments for liquidity purpose and undisbursed technical assistance, respectively. In all other cases, the carrying amount of FSDPSF’s assets and liabilities is considered to approximate FV.
NOTE J—SUBSEQUENT EVENTS
ADB has evaluated subsequent events after 31 December 2025 through 9 March 2026, the date these financial statements are available for issuance. On 5 January 2026, the Government of Luxembourg committed a contribution of €650,000 (equivalent to $762,000 at the time of commitment), which was transferred to the FSDPSF on 20 January 2026.