| Icahn Enterprises L.P. Investor Presentation May 2026 |
| 2 Forward-Looking Statements and Non-GAAP Financial Measures Forward-Looking Statements This presentation contains certain statements that are, or may be deemed to be, “forward-looking statements” within the meaning of Section 27A of the Securities Act of 1933, as amended, and Section 21E of the Securities Exchange Act of 1934, as amended. All statements included herein, other than statements that relate solely to historical fact, are “forward-looking statements.” Such statements include, but are not limited to, any statement that may predict, forecast, indicate or imply future results, performance, achievements or events, or any statement that may relate to strategies, plans or objectives for, or potential results of, future operations, financial results, financial condition, business prospects, growth strategy or liquidity, and are based upon management’s current plans and beliefs or current estimates of future results or trends. Forward-looking statements can generally be identified by phrases such as “believes,” “expects,” “potential,” “continues,” “may,” “should,” “seeks,” “predicts,” “anticipates,” “intends,” “projects,” “estimates,” “plans,” “could,” “designed,” “should be” and other similar expressions that denote expectations of future or conditional events rather than statements of fact. Our expectations, beliefs and projections are expressed in good faith, and we believe that there is a reasonable basis for them. However, there can be no assurance that these expectations, beliefs and projections will result or be achieved. There are a number of risks and uncertainties that could cause our actual results to differ materially from the forward-looking statements contained in this presentation, including risks related to economic downturns, substantial competition and rising operating costs; risks related to our investment activities, including the nature of the investments made by the private funds in which we invest, including the impact of the use of leverage through options, short sales, swaps, forwards and other derivative instruments including counterparty termination and early settlement of these positions; risks related to our ability to comply with the covenants in our senior notes and the risk of foreclosure on the assets securing our notes; declines in the fair value of our investments, losses in the private funds and loss of key employees; risks related to our ability to continue to conduct our activities in a manner so as to not be deemed an investment company under the Investment Company Act of 1940, as amended, or to be taxed as a corporation; risks related to short sellers and associated litigation and regulatory inquiries; risks related to our general partner and controlling unitholder; pledges of our units by our controlling unitholder; risks related to our energy business, including the volatility and availability of crude oil, other feed stocks and refined products, declines in global demand for crude oil, refined products and liquid transportation fuels, unfavorable refining margin (crack spread), interrupted access to pipelines, significant fluctuations in nitrogen fertilizer demand in the agricultural industry and seasonality of results; volatile commodity pricing and higher industry utilization and oversupply risks related to potential strategic transactions involving our Energy segment, and the impact of tariffs; risks related to our automotive activities and exposure to adverse conditions in the automotive industry; risks related to our food packaging activities, including competition from better capitalized competitors, inability of our suppliers to timely deliver raw materials, and the failure to effectively respond to industry changes in casings technology; supply chain issues; inflation, including increased costs of raw materials and shipping; interest rate increases; labor shortages and workforce availability; risks related to our real estate activities, including the extent of any tenant bankruptcies and insolvencies; risks related to our home fashion operations, including changes in the availability and price of raw materials, manufacturing disruptions, and changes in transportation costs and delivery times; the impacts from the Russia/Ukraine conflict and conflict in the Middle East, the U.S. – Israel and Iran war, and any related economic volatility, disruptions to global commodity markets, export controls and other economic sanctions; and political and regulatory uncertainty, including changing economic policy and the imposition of tariffs. These and other risks and uncertainties are described in our filings with the Securities and Exchange Commission including our Annual Report on Form 10-K and our quarterly reports on Form 10-Q under the caption “Risk Factors”. There may be other factors not presently known to us or which we currently consider to be immaterial that may cause our actual results to differ materially from the forward-looking statements. All forward-looking statements attributable to us or persons acting on our behalf apply only as of the date of this presentation and are expressly qualified in their entirety by the cautionary statements included in this presentation. Except to the extent required by law, we undertake no obligation to update or revise forward-looking statements to reflect events or circumstances after the date such statements are made or to reflect the occurrence of unanticipated events. Non-GAAP Financial Measures This presentation contains certain non-GAAP financial measures, including EBITDA, Adjusted EBITDA and Indicative Net Asset Value. The non-GAAP financial measures contained herein have limitations as analytical tools and should not be considered in isolation or in lieu of an analysis of our results as reported under U.S. GAAP. These non-GAAP measures should be evaluated only on a supplementary basis in connection with our U.S. GAAP results, including those reported in our consolidated financial statements and the related notes thereto contained in our Annual Report on Form 10-K for the year ended December 31, 2025 and our subsequent quarterly reports on Form 10-Q. A reconciliation of these non-GAAP financial measures to the most directly comparable U.S. GAAP financial measures can be found in the back of this presentation. |
| Company Overview 3 |
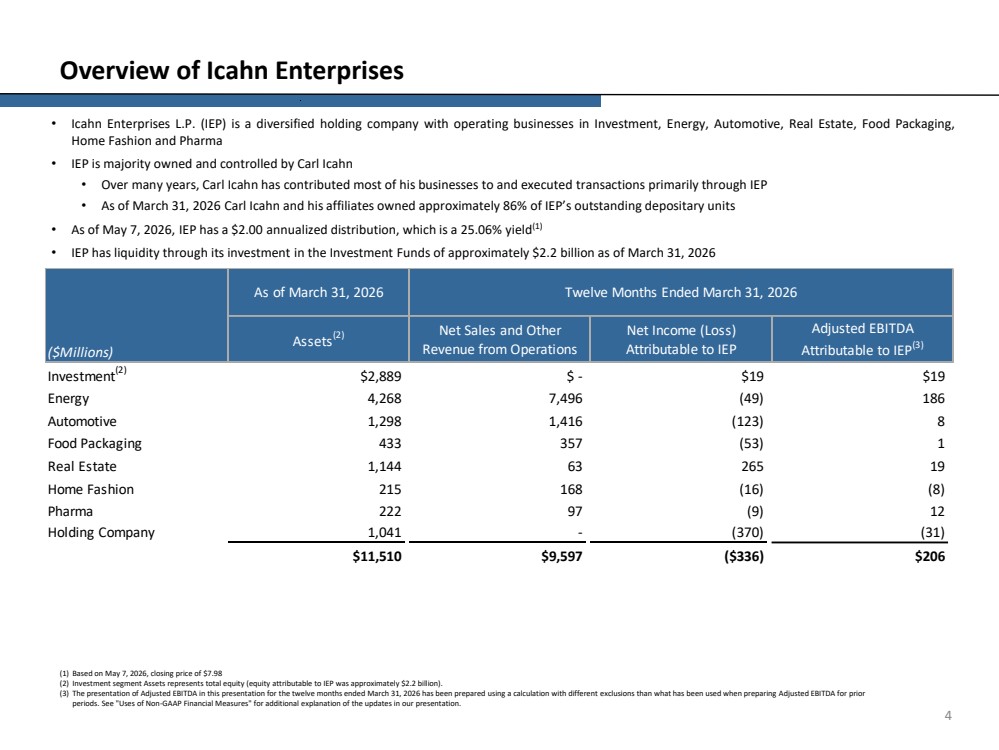
| 4 Overview of Icahn Enterprises (1) Based on May 7, 2026, closing price of $7.98 (2) Investment segment Assets represents total equity (equity attributable to IEP was approximately $2.2 billion). (3) The presentation of Adjusted EBITDA in this presentation for the twelve months ended March 31, 2026 has been prepared using a calculation with different exclusions than what has been used when preparing Adjusted EBITDA for prior periods. See "Uses of Non-GAAP Financial Measures" for additional explanation of the updates in our presentation. • Icahn Enterprises L.P. (IEP) is a diversified holding company with operating businesses in Investment, Energy, Automotive, Real Estate, Food Packaging, Home Fashion and Pharma • IEP is majority owned and controlled by Carl Icahn • Over many years, Carl Icahn has contributed most of his businesses to and executed transactions primarily through IEP • As of March 31, 2026 Carl Icahn and his affiliates owned approximately 86% of IEP’s outstanding depositary units • As of May 7, 2026, IEP has a $2.00 annualized distribution, which is a 25.06% yield(1) • IEP has liquidity through its investment in the Investment Funds of approximately $2.2 billion as of March 31, 2026 Investment(2) $2,889 $ - $19 $19 Energy 4,268 7,496 (49) 186 Automotive 1,298 1,416 (123) 8 Food Packaging 433 357 (53) 1 Real Estate 1,144 63 265 19 Home Fashion 215 168 (16) (8) Pharma 222 97 (9) 12 Holding Company 1,041 - (370) (31) $11,510 $9,597 ($336) $206 ($Millions) As of March 31, 2026 Twelve Months Ended March 31, 2026 Assets(2) Net Income (Loss) Attributable to IEP Adjusted EBITDA Attributable to IEP(3) Net Sales and Other Revenue from Operations |
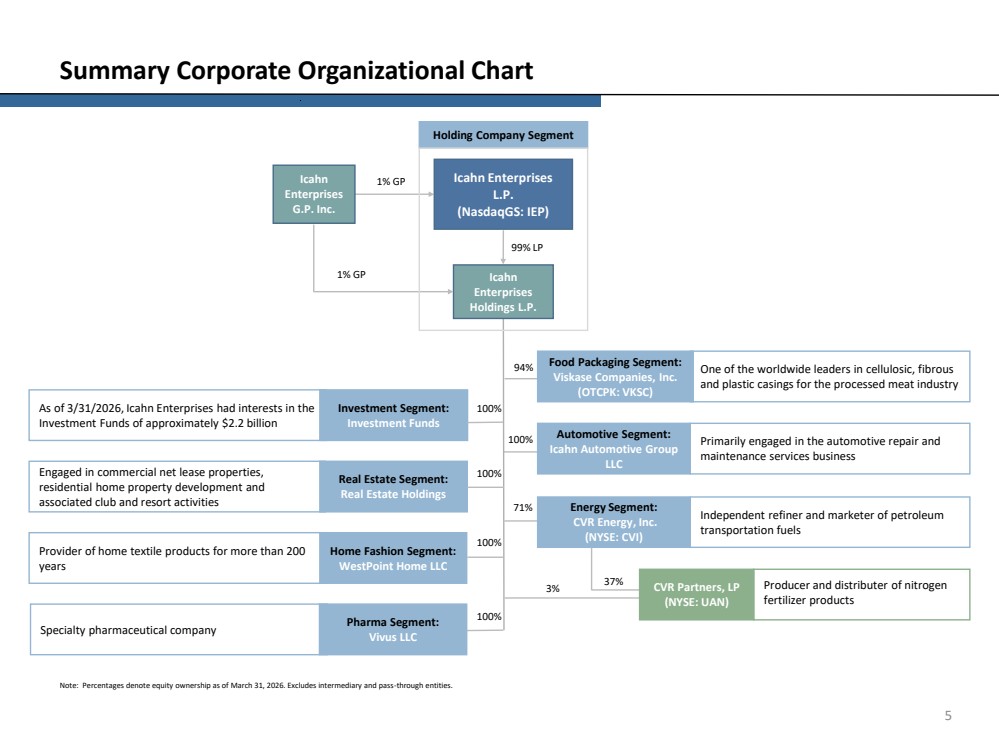
| 5 Summary Corporate Organizational Chart Note: Percentages denote equity ownership as of March 31, 2026. Excludes intermediary and pass-through entities. 99% LP Energy Segment: CVR Energy, Inc. (NYSE: CVI) Pharma Segment: Vivus LLC Real Estate Segment: Real Estate Holdings Home Fashion Segment: WestPoint Home LLC Icahn Enterprises G.P. Inc. Icahn Enterprises L.P. (NasdaqGS: IEP) Icahn Enterprises Holdings L.P. 1% GP 1% GP 94% 71% Investment Segment: Investment Funds Food Packaging Segment: Viskase Companies, Inc. (OTCPK: VKSC) As of 3/31/2026, Icahn Enterprises had interests in the Investment Funds of approximately $2.2 billion Engaged in commercial net lease properties, residential home property development and associated club and resort activities Provider of home textile products for more than 200 years Specialty pharmaceutical company One of the worldwide leaders in cellulosic, fibrous and plastic casings for the processed meat industry Independent refiner and marketer of petroleum transportation fuels 100% 100% 100% 100% Automotive Segment: Icahn Automotive Group LLC Primarily engaged in the automotive repair and maintenance services business 100% Producer and distributer of nitrogen fertilizer products CVR Partners, LP (NYSE: UAN) 37% Holding Company Segment 3% |
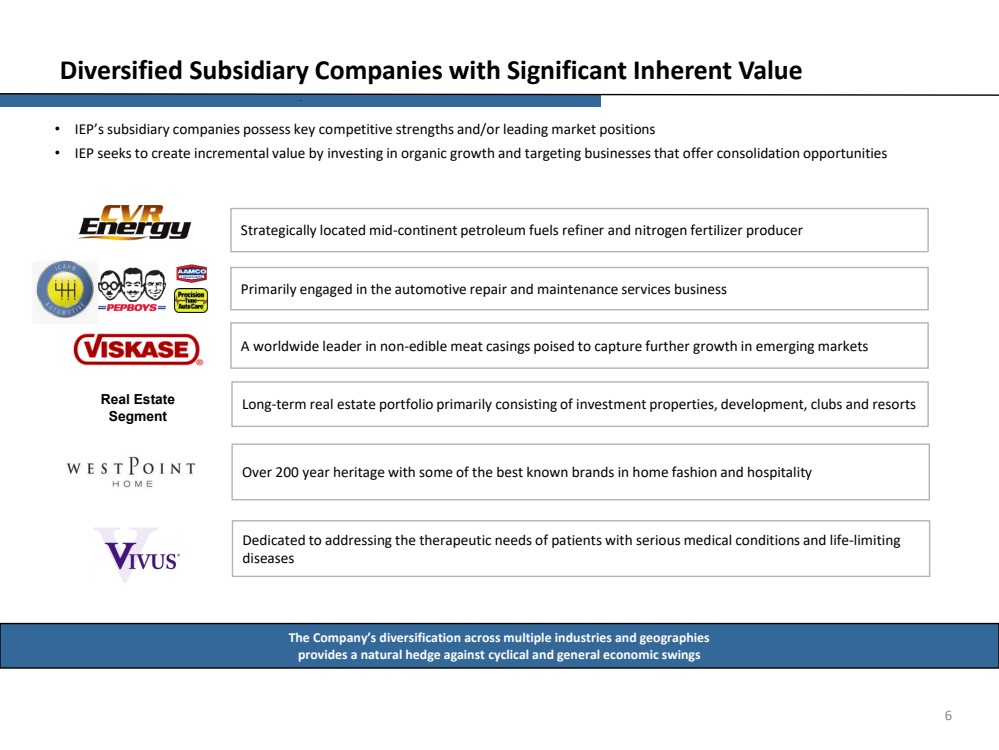
| 6 Diversified Subsidiary Companies with Significant Inherent Value • IEP’s subsidiary companies possess key competitive strengths and/or leading market positions • IEP seeks to create incremental value by investing in organic growth and targeting businesses that offer consolidation opportunities The Company’s diversification across multiple industries and geographies provides a natural hedge against cyclical and general economic swings Over 200 year heritage with some of the best known brands in home fashion and hospitality A worldwide leader in non-edible meat casings poised to capture further growth in emerging markets Strategically located mid-continent petroleum fuels refiner and nitrogen fertilizer producer Long-term real estate portfolio primarily consisting of investment properties, development, clubs and resorts Real Estate Segment Primarily engaged in the automotive repair and maintenance services business Dedicated to addressing the therapeutic needs of patients with serious medical conditions and life-limiting diseases |
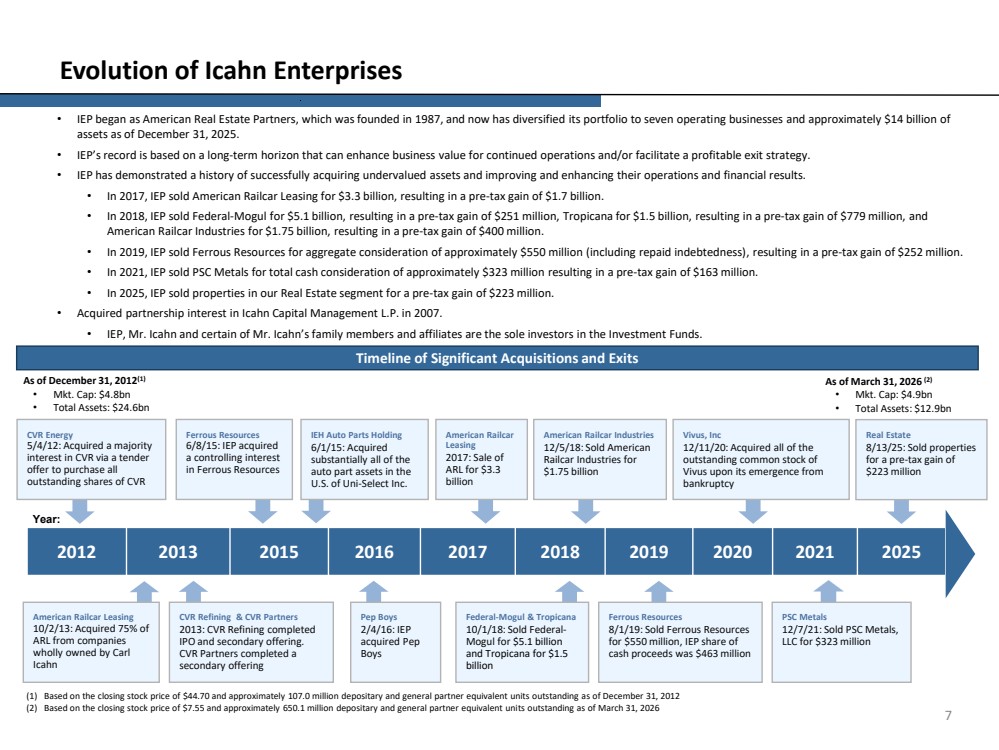
| 7 Evolution of Icahn Enterprises • IEP began as American Real Estate Partners, which was founded in 1987, and now has diversified its portfolio to seven operating businesses and approximately $14 billion of assets as of December 31, 2025. • IEP’s record is based on a long-term horizon that can enhance business value for continued operations and/or facilitate a profitable exit strategy. • IEP has demonstrated a history of successfully acquiring undervalued assets and improving and enhancing their operations and financial results. • In 2017, IEP sold American Railcar Leasing for $3.3 billion, resulting in a pre-tax gain of $1.7 billion. • In 2018, IEP sold Federal-Mogul for $5.1 billion, resulting in a pre-tax gain of $251 million, Tropicana for $1.5 billion, resulting in a pre-tax gain of $779 million, and American Railcar Industries for $1.75 billion, resulting in a pre-tax gain of $400 million. • In 2019, IEP sold Ferrous Resources for aggregate consideration of approximately $550 million (including repaid indebtedness), resulting in a pre-tax gain of $252 million. • In 2021, IEP sold PSC Metals for total cash consideration of approximately $323 million resulting in a pre-tax gain of $163 million. • In 2025, IEP sold properties in our Real Estate segment for a pre-tax gain of $223 million. • Acquired partnership interest in Icahn Capital Management L.P. in 2007. • IEP, Mr. Icahn and certain of Mr. Icahn’s family members and affiliates are the sole investors in the Investment Funds. Timeline of Significant Acquisitions and Exits (1) Based on the closing stock price of $44.70 and approximately 107.0 million depositary and general partner equivalent units outstanding as of December 31, 2012 (2) Based on the closing stock price of $7.55 and approximately 650.1 million depositary and general partner equivalent units outstanding as of March 31, 2026 As of December 31, 2012(1) • Mkt. Cap: $4.8bn • Total Assets: $24.6bn As of March 31, 2026 (2) • Mkt. Cap: $4.9bn • Total Assets: $12.9bn Year: 2012 2013 2015 2016 2017 2018 2019 2020 2021 2025 American Railcar Leasing 10/2/13: Acquired 75% of ARL from companies wholly owned by Carl Icahn Ferrous Resources 6/8/15: IEP acquired a controlling interest in Ferrous Resources Pep Boys 2/4/16: IEP acquired Pep Boys Federal-Mogul & Tropicana 10/1/18: Sold Federal-Mogul for $5.1 billion and Tropicana for $1.5 billion Ferrous Resources 8/1/19: Sold Ferrous Resources for $550 million, IEP share of cash proceeds was $463 million PSC Metals 12/7/21: Sold PSC Metals, LLC for $323 million CVR Energy 5/4/12: Acquired a majority interest in CVR via a tender offer to purchase all outstanding shares of CVR CVR Refining & CVR Partners 2013: CVR Refining completed IPO and secondary offering. CVR Partners completed a secondary offering IEH Auto Parts Holding 6/1/15: Acquired substantially all of the auto part assets in the U.S. of Uni-Select Inc. American Railcar Leasing 2017: Sale of ARL for $3.3 billion American Railcar Industries 12/5/18: Sold American Railcar Industries for $1.75 billion Vivus, Inc 12/11/20: Acquired all of the outstanding common stock of Vivus upon its emergence from bankruptcy Real Estate 8/13/25: Sold properties for a pre-tax gain of $223 million |
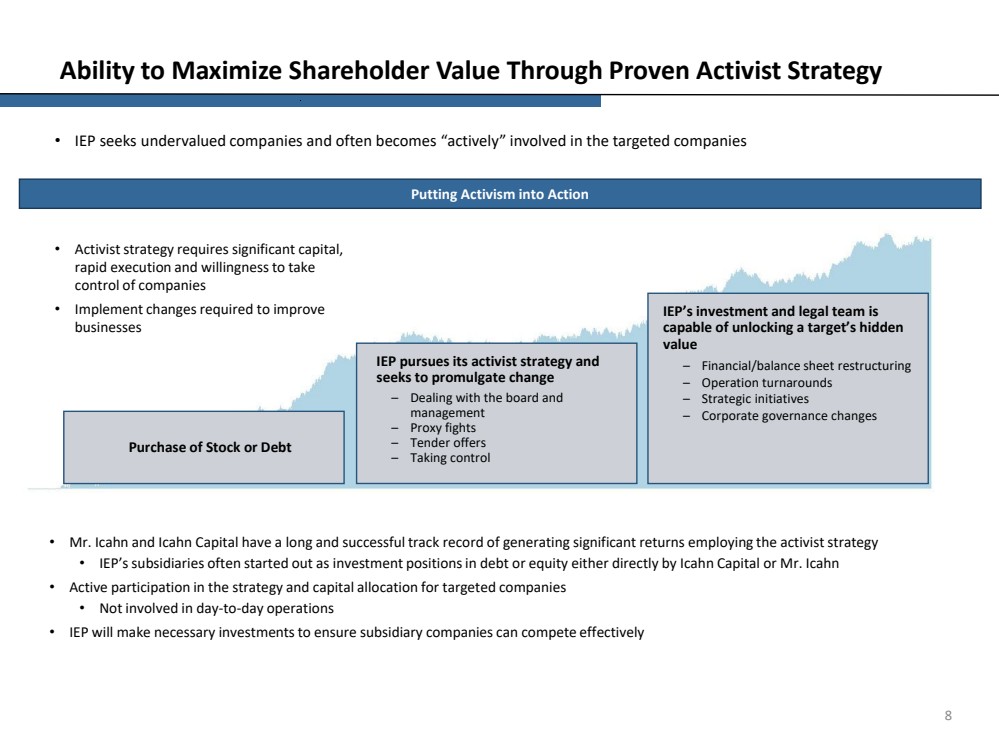
| 8 Ability to Maximize Shareholder Value Through Proven Activist Strategy • IEP seeks undervalued companies and often becomes “actively” involved in the targeted companies • Activist strategy requires significant capital, rapid execution and willingness to take control of companies • Implement changes required to improve businesses Purchase of Stock or Debt IEP pursues its activist strategy and seeks to promulgate change – Dealing with the board and management – Proxy fights – Tender offers – Taking control IEP’s investment and legal team is capable of unlocking a target’s hidden value – Financial/balance sheet restructuring – Operation turnarounds – Strategic initiatives – Corporate governance changes • Mr. Icahn and Icahn Capital have a long and successful track record of generating significant returns employing the activist strategy • IEP’s subsidiaries often started out as investment positions in debt or equity either directly by Icahn Capital or Mr. Icahn • Active participation in the strategy and capital allocation for targeted companies • Not involved in day-to-day operations • IEP will make necessary investments to ensure subsidiary companies can compete effectively Putting Activism into Action |
| Overview of Operating Segments 9 |
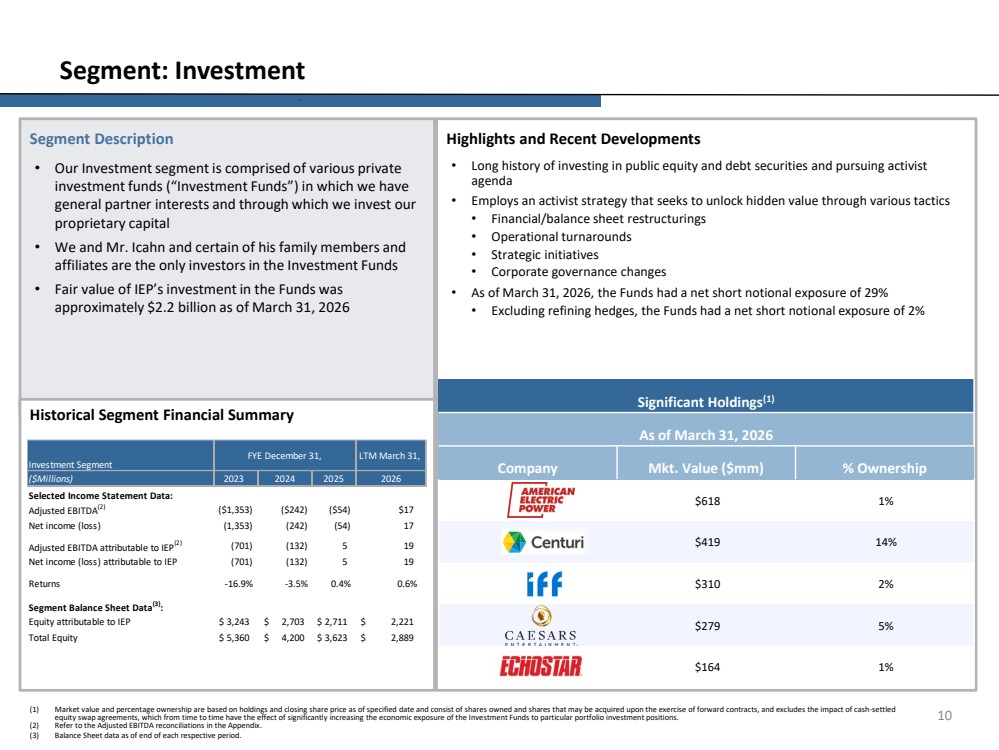
| Highlights and Recent Developments • Long history of investing in public equity and debt securities and pursuing activist agenda • Employs an activist strategy that seeks to unlock hidden value through various tactics • Financial/balance sheet restructurings • Operational turnarounds • Strategic initiatives • Corporate governance changes • As of March 31, 2026, the Funds had a net short notional exposure of 29% • Excluding refining hedges, the Funds had a net short notional exposure of 2% Segment Description • Our Investment segment is comprised of various private investment funds (“Investment Funds”) in which we have general partner interests and through which we invest our proprietary capital • We and Mr. Icahn and certain of his family members and affiliates are the only investors in the Investment Funds • Fair value of IEP’s investment in the Funds was approximately $2.2 billion as of March 31, 2026 10 Segment: Investment Historical Segment Financial Summary (1) Market value and percentage ownership are based on holdings and closing share price as of specified date and consist of shares owned and shares that may be acquired upon the exercise of forward contracts, and excludes the impact of cash-settled equity swap agreements, which from time to time have the effect of significantly increasing the economic exposure of the Investment Funds to particular portfolio investment positions. (2) Refer to the Adjusted EBITDA reconciliations in the Appendix. (3) Balance Sheet data as of end of each respective period. Significant Holdings(1) As of March 31, 2026 Company Mkt. Value ($mm) % Ownership $618 1% $419 14% $310 2% $279 5% $164 1% ($Millions) 2023 Selected Income Statement Data: Adjusted EBITDA(2) ($1,353) ($242) ($54) $17 Net income (loss) (1,353) (242) (54) 17 Adjusted EBITDA attributable to IEP(2) (701) (132) 5 19 Net income (loss) attributable to IEP (701) (132) 5 19 Returns -16.9% -3.5% 0.4% 0.6% Segment Balance Sheet Data(3) : Equity attributable to IEP $ 3,243 $ 2,703 $ 2,711 $ 2,221 Total Equity $ 5,360 $ 4,200 $ 3,623 $ 2,889 Investment Segment FYE December 31, LTM March 31, 2024 2025 2026 |
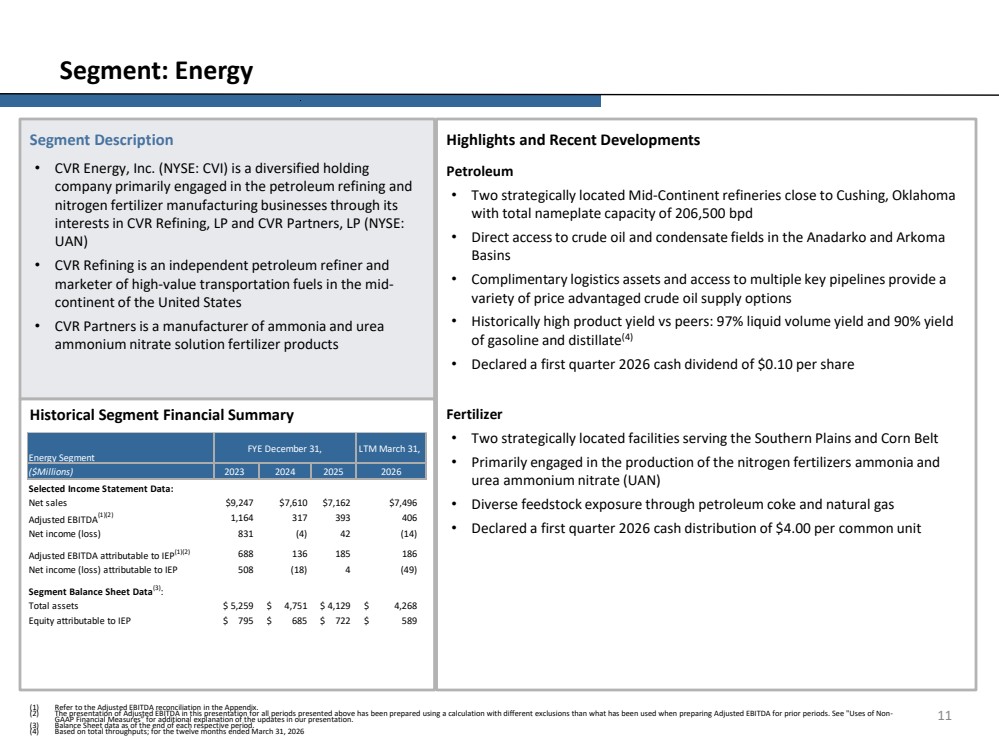
| Highlights and Recent Developments Petroleum • Two strategically located Mid-Continent refineries close to Cushing, Oklahoma with total nameplate capacity of 206,500 bpd • Direct access to crude oil and condensate fields in the Anadarko and Arkoma Basins • Complimentary logistics assets and access to multiple key pipelines provide a variety of price advantaged crude oil supply options • Historically high product yield vs peers: 97% liquid volume yield and 90% yield of gasoline and distillate(4) • Declared a first quarter 2026 cash dividend of $0.10 per share Fertilizer • Two strategically located facilities serving the Southern Plains and Corn Belt • Primarily engaged in the production of the nitrogen fertilizers ammonia and urea ammonium nitrate (UAN) • Diverse feedstock exposure through petroleum coke and natural gas • Declared a first quarter 2026 cash distribution of $4.00 per common unit Segment Description • CVR Energy, Inc. (NYSE: CVI) is a diversified holding company primarily engaged in the petroleum refining and nitrogen fertilizer manufacturing businesses through its interests in CVR Refining, LP and CVR Partners, LP (NYSE: UAN) • CVR Refining is an independent petroleum refiner and marketer of high-value transportation fuels in the mid-continent of the United States • CVR Partners is a manufacturer of ammonia and urea ammonium nitrate solution fertilizer products 11 Segment: Energy Historical Segment Financial Summary (1) Refer to the Adjusted EBITDA reconciliation in the Appendix. (2) The presentation of Adjusted EBITDA in this presentation for all periods presented above has been prepared using a calculation with different exclusions than what has been used when preparing Adjusted EBITDA for prior periods. See "Uses of Non-GAAP Financial Measures” for additional explanation of the updates in our presentation. (3) Balance Sheet data as of the end of each respective period. (4) Based on total throughputs; for the twelve months ended March 31, 2026 ($Millions) 2023 Selected Income Statement Data: Net sales $9,247 $7,610 $7,162 $7,496 Adjusted EBITDA(1)(2) 1,164 317 393 406 Net income (loss) 831 (4) 42 (14) Adjusted EBITDA attributable to IEP(1)(2) 688 136 185 186 Net income (loss) attributable to IEP 508 (18) 4 (49) Segment Balance Sheet Data(3) : Total assets $ 5,259 $ 4,751 $ 4,129 $ 4,268 Equity attributable to IEP $ 795 $ 685 $ 722 $ 589 Energy Segment FYE December 31, LTM March 31, 2024 2025 2026 |
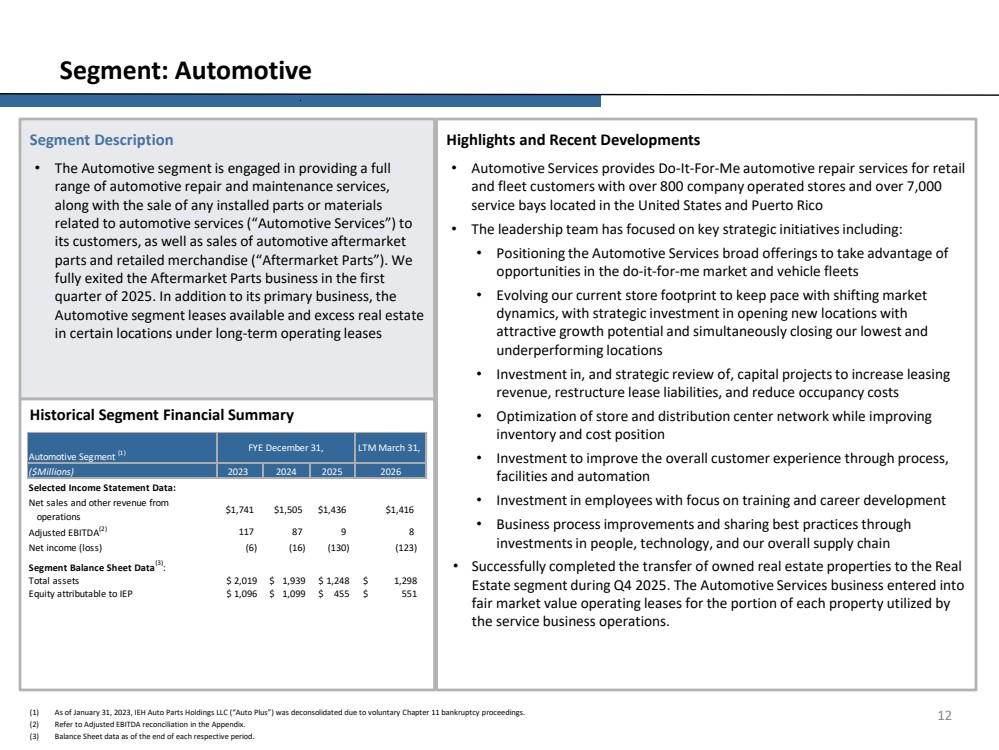
| Highlights and Recent Developments • Automotive Services provides Do-It-For-Me automotive repair services for retail and fleet customers with over 800 company operated stores and over 7,000 service bays located in the United States and Puerto Rico • The leadership team has focused on key strategic initiatives including: • Positioning the Automotive Services broad offerings to take advantage of opportunities in the do-it-for-me market and vehicle fleets • Evolving our current store footprint to keep pace with shifting market dynamics, with strategic investment in opening new locations with attractive growth potential and simultaneously closing our lowest and underperforming locations • Investment in, and strategic review of, capital projects to increase leasing revenue, restructure lease liabilities, and reduce occupancy costs • Optimization of store and distribution center network while improving inventory and cost position • Investment to improve the overall customer experience through process, facilities and automation • Investment in employees with focus on training and career development • Business process improvements and sharing best practices through investments in people, technology, and our overall supply chain • Successfully completed the transfer of owned real estate properties to the Real Estate segment during Q4 2025. The Automotive Services business entered into fair market value operating leases for the portion of each property utilized by the service business operations. Segment Description • The Automotive segment is engaged in providing a full range of automotive repair and maintenance services, along with the sale of any installed parts or materials related to automotive services (“Automotive Services”) to its customers, as well as sales of automotive aftermarket parts and retailed merchandise (“Aftermarket Parts”). We fully exited the Aftermarket Parts business in the first quarter of 2025. In addition to its primary business, the Automotive segment leases available and excess real estate in certain locations under long-term operating leases 12 Segment: Automotive Historical Segment Financial Summary (1) As of January 31, 2023, IEH Auto Parts Holdings LLC (“Auto Plus”) was deconsolidated due to voluntary Chapter 11 bankruptcy proceedings. (2) Refer to Adjusted EBITDA reconciliation in the Appendix. (3) Balance Sheet data as of the end of each respective period. ($Millions) 2023 Selected Income Statement Data: Net sales and other revenue from operations $1,741 $1,505 $1,436 $1,416 Adjusted EBITDA(2) 117 87 9 8 Net income (loss) (6) (16) (130) (123) Segment Balance Sheet Data(3) : Total assets $ 2,019 $ 1,939 $ 1,248 $ 1,298 Equity attributable to IEP $ 1,096 $ 1,099 $ 455 $ 551 Automotive Segment (1) FYE December 31, LTM March 31, 2024 2025 2026 |
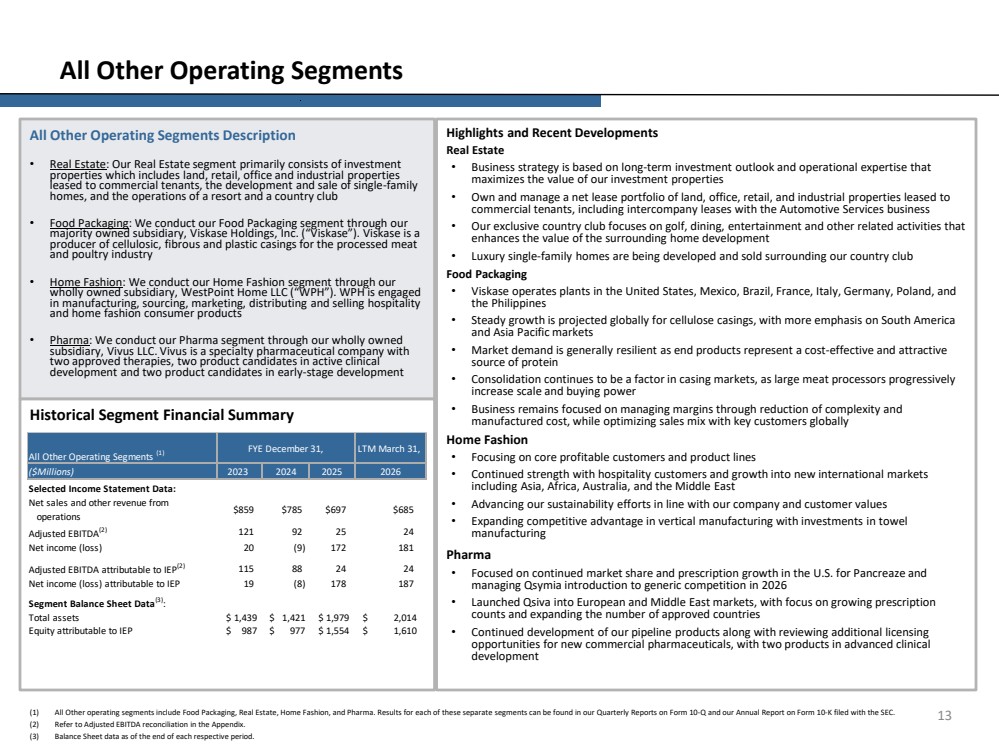
| Highlights and Recent Developments Real Estate • Business strategy is based on long-term investment outlook and operational expertise that maximizes the value of our investment properties • Own and manage a net lease portfolio of land, office, retail, and industrial properties leased to commercial tenants, including intercompany leases with the Automotive Services business • Our exclusive country club focuses on golf, dining, entertainment and other related activities that enhances the value of the surrounding home development • Luxury single-family homes are being developed and sold surrounding our country club Food Packaging • Viskase operates plants in the United States, Mexico, Brazil, France, Italy, Germany, Poland, and the Philippines • Steady growth is projected globally for cellulose casings, with more emphasis on South America and Asia Pacific markets • Market demand is generally resilient as end products represent a cost-effective and attractive source of protein • Consolidation continues to be a factor in casing markets, as large meat processors progressively increase scale and buying power • Business remains focused on managing margins through reduction of complexity and manufactured cost, while optimizing sales mix with key customers globally Home Fashion • Focusing on core profitable customers and product lines • Continued strength with hospitality customers and growth into new international markets including Asia, Africa, Australia, and the Middle East • Advancing our sustainability efforts in line with our company and customer values • Expanding competitive advantage in vertical manufacturing with investments in towel manufacturing Pharma • Focused on continued market share and prescription growth in the U.S. for Pancreaze and managing Qsymia introduction to generic competition in 2026 • Launched Qsiva into European and Middle East markets, with focus on growing prescription counts and expanding the number of approved countries • Continued development of our pipeline products along with reviewing additional licensing opportunities for new commercial pharmaceuticals, with two products in advanced clinical development All Other Operating Segments Description • Real Estate: Our Real Estate segment primarily consists of investment properties which includes land, retail, office and industrial properties leased to commercial tenants, the development and sale of single-family homes, and the operations of a resort and a country club • Food Packaging: We conduct our Food Packaging segment through our majority owned subsidiary, Viskase Holdings, Inc. (“Viskase”). Viskase is a producer of cellulosic, fibrous and plastic casings for the processed meat and poultry industry • Home Fashion: We conduct our Home Fashion segment through our wholly owned subsidiary, WestPoint Home LLC (“WPH”). WPH is engaged in manufacturing, sourcing, marketing, distributing and selling hospitality and home fashion consumer products • Pharma: We conduct our Pharma segment through our wholly owned subsidiary, Vivus LLC. Vivus is a specialty pharmaceutical company with two approved therapies, two product candidates in active clinical development and two product candidates in early-stage development 13 All Other Operating Segments Historical Segment Financial Summary (1) All Other operating segments include Food Packaging, Real Estate, Home Fashion, and Pharma. Results for each of these separate segments can be found in our Quarterly Reports on Form 10-Q and our Annual Report on Form 10-K filed with the SEC. (2) Refer to Adjusted EBITDA reconciliation in the Appendix. (3) Balance Sheet data as of the end of each respective period. ($Millions) 2023 Selected Income Statement Data: Net sales and other revenue from operations $859 $785 $697 $685 Adjusted EBITDA(2) 121 92 25 24 Net income (loss) 20 (9) 172 181 Adjusted EBITDA attributable to IEP(2) 115 88 24 24 Net income (loss) attributable to IEP 19 (8) 178 187 Segment Balance Sheet Data(3) : Total assets $ 1,439 $ 1,421 $ 1,979 $ 2,014 Equity attributable to IEP $ 987 $ 977 $ 1,554 $ 1,610 2024 2025 2026 All Other Operating Segments (1) FYE December 31, LTM March 31, |
| Financial Performance 14 |
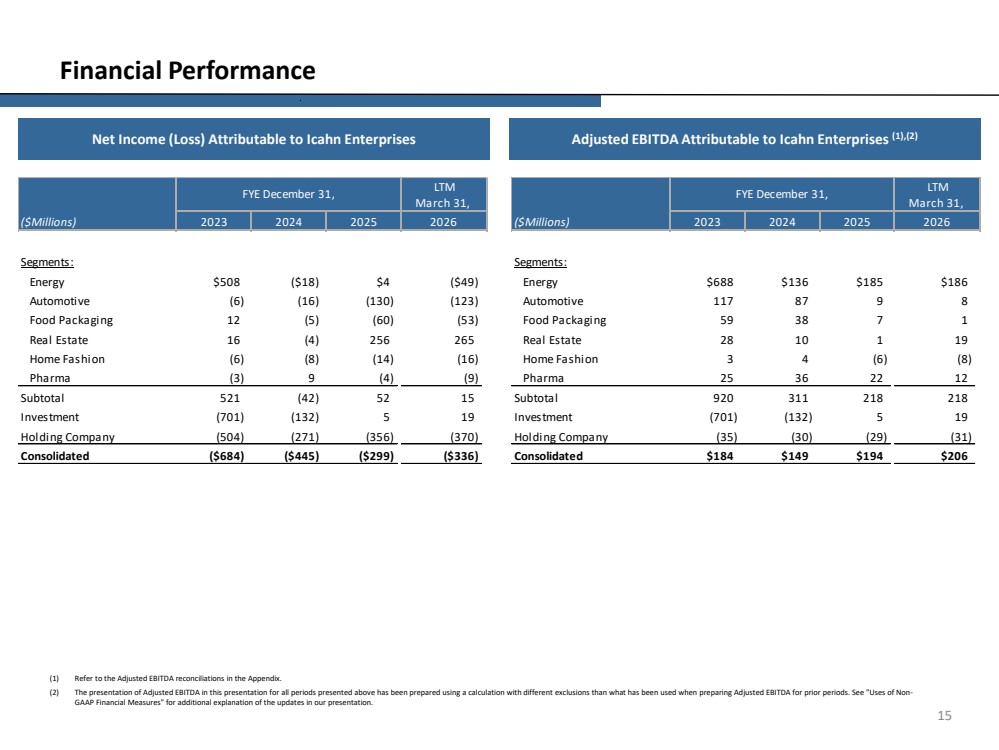
| 15 Financial Performance Net Income (Loss) Attributable to Icahn Enterprises Adjusted EBITDA Attributable to Icahn Enterprises (1),(2) (1) Refer to the Adjusted EBITDA reconciliations in the Appendix. (2) The presentation of Adjusted EBITDA in this presentation for all periods presented above has been prepared using a calculation with different exclusions than what has been used when preparing Adjusted EBITDA for prior periods. See "Uses of Non-GAAP Financial Measures" for additional explanation of the updates in our presentation. ($Millions) Segments: Energy $508 ($18) $ 4 ($49) Automotive (6) (16) (130) (123) Food Packaging 1 2 (5) (60) (53) Real Estate 1 6 (4) 256 265 Home Fashion (6) (8) (14) (16) Pharma (3) 9 (4) (9) Subtotal 521 (42) 5 2 1 5 Investment (701) (132) 5 1 9 Holding Company (504) (271) (356) (370) Consolidated ($684) ($445) ($299) ($336) FYE December 31, LTM March 31, 2023 2024 2025 2026 ($Millions) Segments: Energy $688 $136 $185 $186 Automotive 117 8 7 9 8 Food Packaging 5 9 3 8 7 1 Real Estate 2 8 1 0 1 1 9 Home Fashion 3 4 (6) (8) Pharma 2 5 3 6 2 2 1 2 Subtotal 920 311 218 218 Investment (701) (132) 5 1 9 Holding Company (35) (30) (29) (31) Consolidated $184 $149 $194 $206 2026 LTM March 31, FYE December 31, 2023 2024 2025 |
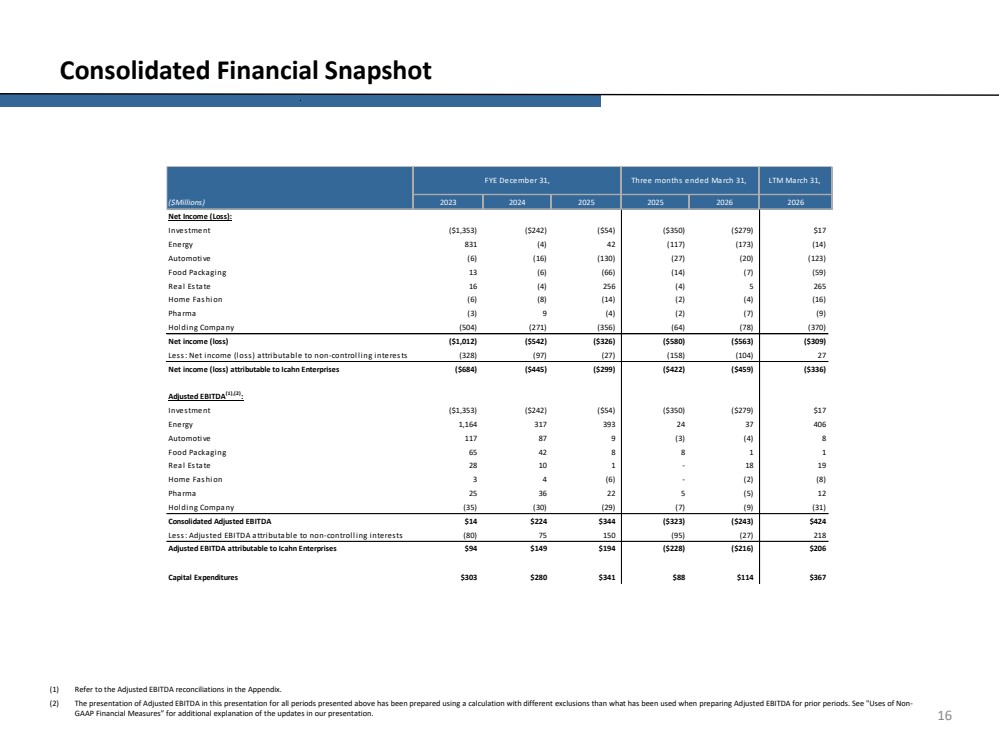
| 16 Consolidated Financial Snapshot (1) Refer to the Adjusted EBITDA reconciliations in the Appendix. (2) The presentation of Adjusted EBITDA in this presentation for all periods presented above has been prepared using a calculation with different exclusions than what has been used when preparing Adjusted EBITDA for prior periods. See "Uses of Non-GAAP Financial Measures” for additional explanation of the updates in our presentation. Net Income (Loss): Investment ($1,353) ($242) ($54) ($350) ($279) $17 Energy 831 (4) 42 (117) (173) (14) Automotive (6) (16) (130) (27) (20) (123) Food Packaging 13 (6) (66) (14) (7) (59) Real Estate 16 (4) 256 (4) 5 265 Home Fashion (6) (8) (14) (2) (4) (16) Pharma (3) 9 (4) (2) (7) (9) Holding Company (504) (271) (356) (64) (78) (370) Net income (loss) ($1,012) ($542) ($326) ($580) ($563) ($309) Less: Net income (loss) attributable to non-controlling interests (328) (97) (27) (158) (104) 27 Net income (loss) attributable to Icahn Enterprises ($684) ($445) ($299) ($422) ($459) ($336) Adjusted EBITDA(1),(2) : Investment ($1,353) ($242) ($54) ($350) ($279) $17 Energy 1,164 317 393 24 37 406 Automotive 117 87 9 (3) (4) 8 Food Packaging 65 42 8 8 1 1 Real Estate 28 10 1 - 18 19 Home Fashion 3 4 (6) - (2) (8) Pharma 25 36 22 5 (5) 12 Holding Company (35) (30) (29) (7) (9) (31) Consolidated Adjusted EBITDA $14 $224 $344 ($323) ($243) $424 Less: Adjusted EBITDA attributable to non-controlling interests (80) 75 150 (95) (27) 218 Adjusted EBITDA attributable to Icahn Enterprises $94 $149 $194 ($228) ($216) $206 Capital Expenditures $303 $280 $341 $88 $114 $367 ($Millions) 2023 2024 2025 FYE December 31, LTM March 31, 2025 2026 2026 Three months ended March 31, |
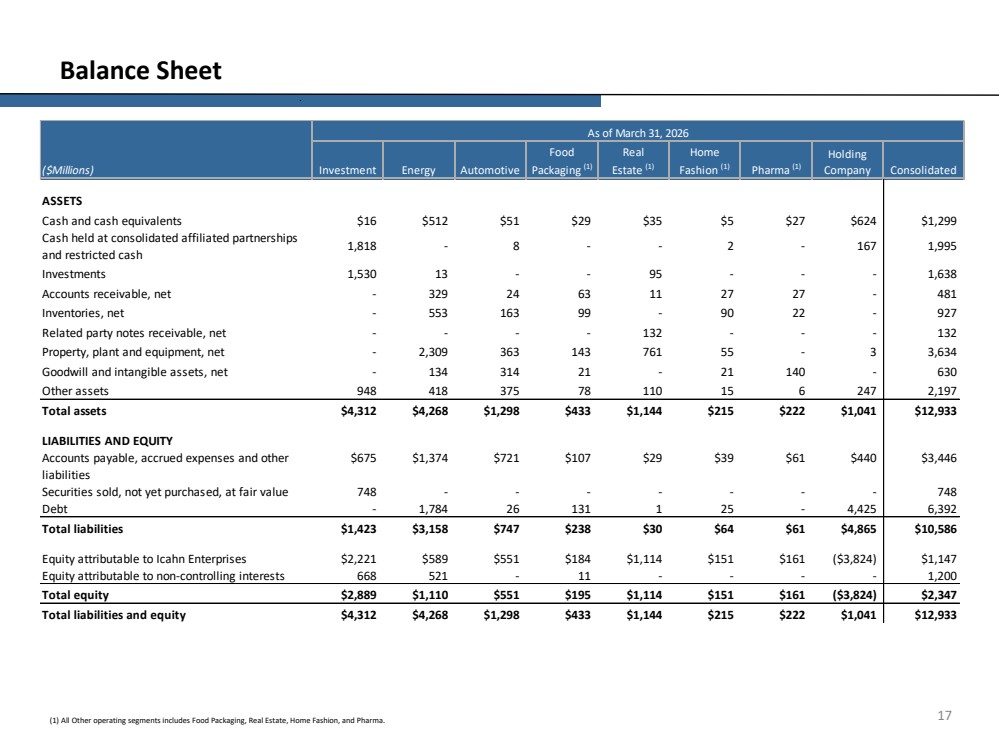
| 17 Balance Sheet (1) All Other operating segments includes Food Packaging, Real Estate, Home Fashion, and Pharma. ($Millions) ASSETS Cash and cash equivalents $16 $512 $51 $29 $35 $5 $27 $624 $1,299 Cash held at consolidated affiliated partnerships and restricted cash 1,818 - 8 - - 2 - 167 1,995 Investments 1,530 13 - - 95 - - - 1,638 Accounts receivable, net - 329 24 63 11 27 27 - 481 Inventories, net - 553 163 99 - 90 22 - 927 Related party notes receivable, net - - - - 132 - - - 132 Property, plant and equipment, net - 2,309 363 143 761 55 - 3 3,634 Goodwill and intangible assets, net - 134 314 21 - 21 140 - 630 Other assets 948 418 375 78 110 15 6 247 2,197 Total assets $4,312 $4,268 $1,298 $433 $1,144 $215 $222 $1,041 $12,933 LIABILITIES AND EQUITY Accounts payable, accrued expenses and other liabilities $675 $1,374 $721 $107 $29 $39 $61 $440 $3,446 Securities sold, not yet purchased, at fair value 748 - - - - - - - 748 Debt - 1,784 26 131 1 25 - 4,425 6,392 Total liabilities $1,423 $3,158 $747 $238 $30 $64 $61 $4,865 $10,586 Equity attributable to Icahn Enterprises $2,221 $589 $551 $184 $1,114 $151 $161 ($3,824) $1,147 Equity attributable to non-controlling interests 668 521 - 11 - - - - 1,200 Total equity $2,889 $1,110 $551 $195 $1,114 $151 $161 ($3,824) $2,347 Total liabilities and equity $4,312 $4,268 $1,298 $433 $1,144 $215 $222 $1,041 $12,933 As of March 31, 2026 Investment Energy Automotive Food Packaging (1) Consolidated Real Estate (1) Home Fashion (1) Pharma (1) Holding Company |
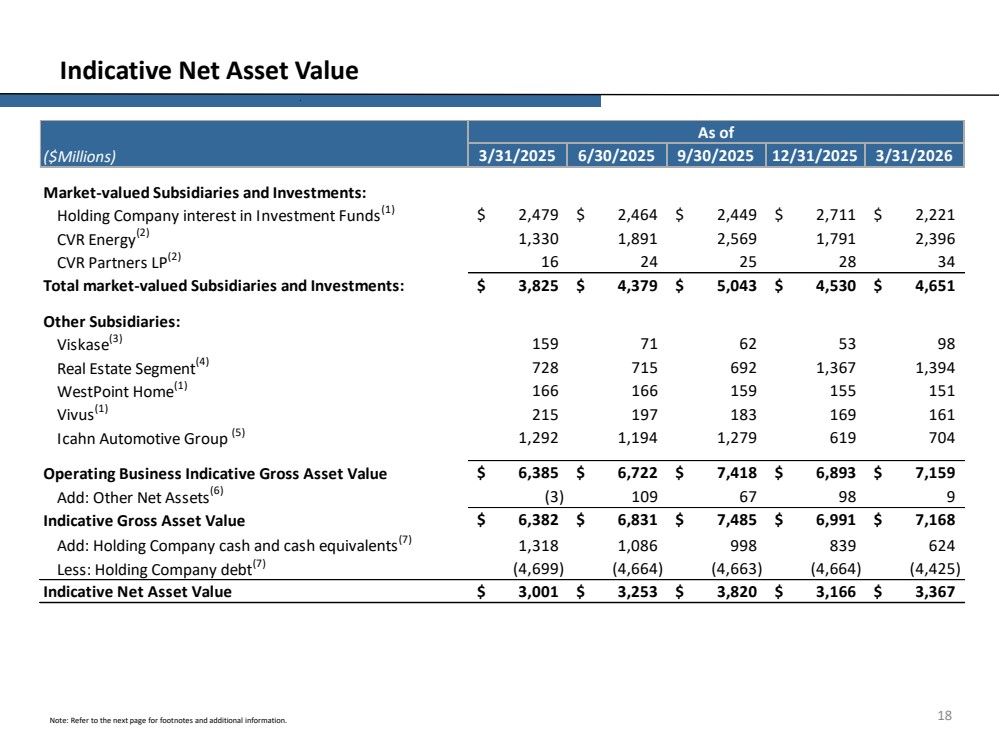
| 18 Indicative Net Asset Value Note: Refer to the next page for footnotes and additional information. 3/31/2025 6/30/2025 9/30/2025 12/31/2025 3/31/2026 Holding Company interest in Investment Funds(1) $ 2,479 $ 2,464 $ 2,449 $ 2,711 $ 2,221 CVR Energy(2) 1,330 1,891 2,569 1,791 2,396 CVR Partners LP(2) 1 6 2 4 2 5 2 8 3 4 Total market-valued Subsidiaries and Investments: $ 3,825 $ 4,379 $ 5,043 $ 4,530 $ 4,651 Viskase(3) 159 7 1 6 2 5 3 9 8 Real Estate Segment(4) 728 715 692 1,367 1,394 WestPoint Home(1) 166 166 159 155 151 Vivus(1) 215 197 183 169 161 Icahn Automotive Group (5) 1,292 1,194 1,279 619 704 Operating Business Indicative Gross Asset Value $ 6,385 $ 6,722 $ 7,418 $ 6,893 $ 7,159 Add: Other Net Assets(6) (3) 109 6 7 9 8 9 Indicative Gross Asset Value $ 6,382 $ 6,831 $ 7,485 $ 6,991 $ 7,168 Add: Holding Company cash and cash equivalents(7) 1,318 1,086 998 839 624 Less: Holding Company debt(7) (4,699) (4,664) (4,663) (4,664) (4,425) Indicative Net Asset Value $ 3,001 $ 3,253 $ 3,820 $ 3,166 $ 3,367 Other Subsidiaries: As of Market-valued Subsidiaries and Investments: ($Millions) |
| 19 Indicative Net Asset Value Use of Indicative Net Asset Value Data The Company uses indicative net asset value as an additional method for considering the value of the Company’s assets, and we believe that this information can be helpful to investors. Please note, however, that the indicative net asset value does not represent the market price at which the depositary units trade. Accordingly, data regarding indicative net asset value is of limited use and should not be considered in isolation. The Company's depositary units are not redeemable, which means that investors have no right or ability to obtain from the Company the indicative net asset value of units that they own. Units may be bought and sold on The Nasdaq Global Select Market at prevailing market prices. Those prices may be higher or lower than the indicative net asset value of the depositary units as calculated by management. Prior to September 30, 2025, we valued Viskase using the trailing twelve month Adjusted EBITDA. Management no longer believes that the trailing twelve month Adjusted EBITDA, which has declined significantly and has been increasingly volatile, represents uniform performance and growth for the business. Accordingly, starting September 30, 2025, management performed a valuation of the business using discounted cash flow and guideline public company methodologies with the assistance of third-party consultants and will continue to use these forward-looking methodologies in future periods. |
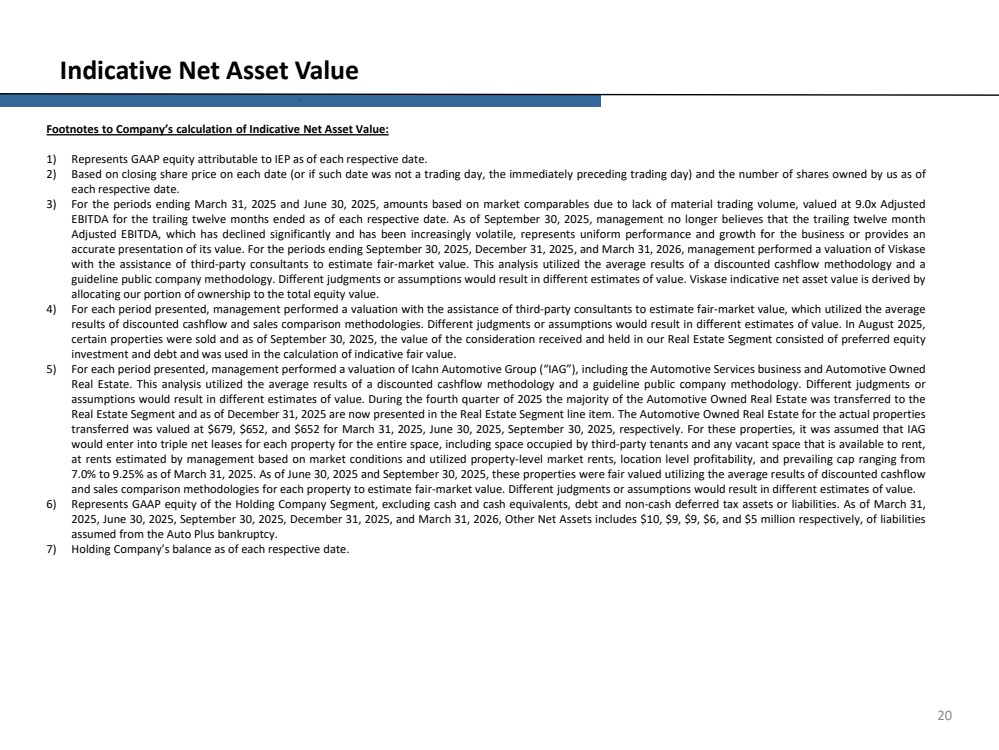
| 20 Indicative Net Asset Value Footnotes to Company’s calculation of Indicative Net Asset Value: 1) Represents GAAP equity attributable to IEP as of each respective date. 2) Based on closing share price on each date (or if such date was not a trading day, the immediately preceding trading day) and the number of shares owned by us as of each respective date. 3) For the periods ending March 31, 2025 and June 30, 2025, amounts based on market comparables due to lack of material trading volume, valued at 9.0x Adjusted EBITDA for the trailing twelve months ended as of each respective date. As of September 30, 2025, management no longer believes that the trailing twelve month Adjusted EBITDA, which has declined significantly and has been increasingly volatile, represents uniform performance and growth for the business or provides an accurate presentation of its value. For the periods ending September 30, 2025, December 31, 2025, and March 31, 2026, management performed a valuation of Viskase with the assistance of third-party consultants to estimate fair-market value. This analysis utilized the average results of a discounted cashflow methodology and a guideline public company methodology. Different judgments or assumptions would result in different estimates of value. Viskase indicative net asset value is derived by allocating our portion of ownership to the total equity value. 4) For each period presented, management performed a valuation with the assistance of third-party consultants to estimate fair-market value, which utilized the average results of discounted cashflow and sales comparison methodologies. Different judgments or assumptions would result in different estimates of value. In August 2025, certain properties were sold and as of September 30, 2025, the value of the consideration received and held in our Real Estate Segment consisted of preferred equity investment and debt and was used in the calculation of indicative fair value. 5) For each period presented, management performed a valuation of Icahn Automotive Group (“IAG”), including the Automotive Services business and Automotive Owned Real Estate. This analysis utilized the average results of a discounted cashflow methodology and a guideline public company methodology. Different judgments or assumptions would result in different estimates of value. During the fourth quarter of 2025 the majority of the Automotive Owned Real Estate was transferred to the Real Estate Segment and as of December 31, 2025 are now presented in the Real Estate Segment line item. The Automotive Owned Real Estate for the actual properties transferred was valued at $679, $652, and $652 for March 31, 2025, June 30, 2025, September 30, 2025, respectively. For these properties, it was assumed that IAG would enter into triple net leases for each property for the entire space, including space occupied by third-party tenants and any vacant space that is available to rent, at rents estimated by management based on market conditions and utilized property-level market rents, location level profitability, and prevailing cap ranging from 7.0% to 9.25% as of March 31, 2025. As of June 30, 2025 and September 30, 2025, these properties were fair valued utilizing the average results of discounted cashflow and sales comparison methodologies for each property to estimate fair-market value. Different judgments or assumptions would result in different estimates of value. 6) Represents GAAP equity of the Holding Company Segment, excluding cash and cash equivalents, debt and non-cash deferred tax assets or liabilities. As of March 31, 2025, June 30, 2025, September 30, 2025, December 31, 2025, and March 31, 2026, Other Net Assets includes $10, $9, $9, $6, and $5 million respectively, of liabilities assumed from the Auto Plus bankruptcy. 7) Holding Company’s balance as of each respective date. |
| Adjusted EBITDA Reconciliations 21 |
| 22 Non-GAAP Financial Measures The Company uses certain non-GAAP financial measures in evaluating its performance. These include non-GAAP EBITDA and Adjusted EBITDA. EBITDA represents earnings from continuing operations before net interest expense (excluding our Investment Segment), income tax (benefit) expense and depreciation and amortization. We define Adjusted EBITDA as EBITDA excluding certain effects of impairment, restructuring costs, transformation costs, certain pension plan expenses, gains/losses on disposition of assets, gains/losses on extinguishment of debt, the performance of closed stores and including closing costs, Energy segment unrealized gains/losses on hedging contracts, unrealized gains/losses on Renewable Fuel Standard ("RFS") positions, Energy segment inventory revaluation, and certain other non-operational or non-recurring charges. The Energy segment's basis for determining inventory value impacts are under a GAAP First-In, First-Out ("FIFO") basis. Changes in crude oil prices can cause fluctuations in the inventory valuation of crude oil, work in process and finished goods, thereby resulting in a favorable inventory valuation impact when crude oil prices increase and an unfavorable inventory valuation impact when crude oil prices decrease. The inventory valuation impact is calculated based upon inventory values at the beginning of the accounting period and at the end of the accounting period. We present EBITDA and Adjusted EBITDA on a consolidated basis and on a basis attributable to Icahn Enterprises net of the effects of non-controlling interests. We conduct substantially all of our operations through subsidiaries. The operating results of our subsidiaries may not be sufficient to make distributions to us. In addition, our subsidiaries are not obligated to make funds available to us for payment of our indebtedness, payment of distributions on our depositary units or otherwise, and distributions and intercompany transfers from our subsidiaries to us may be restricted by applicable law or covenants contained in debt agreements and other agreements to which these subsidiaries currently may be subject or into which they may enter into in the future. The terms of any borrowings of our subsidiaries or other entities in which we own equity may restrict dividends, distributions or loans to us. We believe that providing EBITDA and Adjusted EBITDA to investors has economic substance as these measures provide important supplemental information of our performance to investors and permits investors and management to evaluate the core operating performance of our business without regard to interest (except with respect to our Investment segment), taxes and depreciation and amortization and certain effects of impairment, restructuring costs, certain pension plan expenses, gains/losses on disposition of assets, gains/losses on extinguishment of debt and certain other non-operational charges. Additionally, we believe this information is frequently used by securities analysts, investors and other interested parties in the evaluation of companies that have issued debt. Management uses, and believes that investors benefit from referring to, these non-GAAP financial measures in assessing our operating results, as well as in planning, forecasting and analyzing future periods. Adjusting earnings for these charges allows investors to evaluate our performance from period to period, as well as our peers, without the effects of certain items that may vary depending on accounting methods and the book value of assets. Additionally, EBITDA and Adjusted EBITDA present meaningful measures of performance exclusive of our capital structure and the method by which assets were acquired and financed. Effective March 31, 2026, we modified our calculation of Adjusted EBITDA to exclude the impacts of certain of our Energy segment results, including unrealized gains/losses on hedging contracts, unrealized gains/losses on RFS positions, and inventory revaluation. We believe that this revised presentation improves the supplemental information provided to our investors because management believes these are not attributable to or indicative of our underlying operational results of the period or that may obscure results and trends we deem useful and the significance of these measures have been disproportionately impacted by increased volatility in recent periods. EBITDA and Adjusted EBITDA have limitations as analytical tools, and you should not consider them in isolation, or as substitutes for analysis of our results as reported under generally accepted accounting principles in the United States, or U.S. GAAP. For example, EBITDA and Adjusted EBITDA: • do not reflect our cash expenditures, or future requirements for capital expenditures, or contractual commitments; • do not reflect changes in, or cash requirements for, our working capital needs; and • do not reflect the significant interest expense, or the cash requirements necessary to service interest or principal payments on our debt. Although depreciation and amortization are non-cash charges, the assets being depreciated or amortized often will have to be replaced in the future, and EBITDA and Adjusted EBITDA do not reflect any cash requirements for such replacements. Other companies in the industries in which we operate may calculate EBITDA and Adjusted EBITDA differently than we do, limiting their usefulness as comparative measures. In addition, EBITDA and Adjusted EBITDA do not reflect the impact of earnings or charges resulting from matters we consider not to be indicative of our ongoing operations. EBITDA and Adjusted EBITDA are not measurements of our financial performance under U.S. GAAP and should not be considered as alternatives to net income or any other performance measures derived in accordance with U.S. GAAP or as alternatives to cash flow from operating activities as a measure of our liquidity. Given these limitations, we rely primarily on our U.S. GAAP results and use EBITDA and Adjusted EBITDA only as a supplemental measure of our financial performance. |
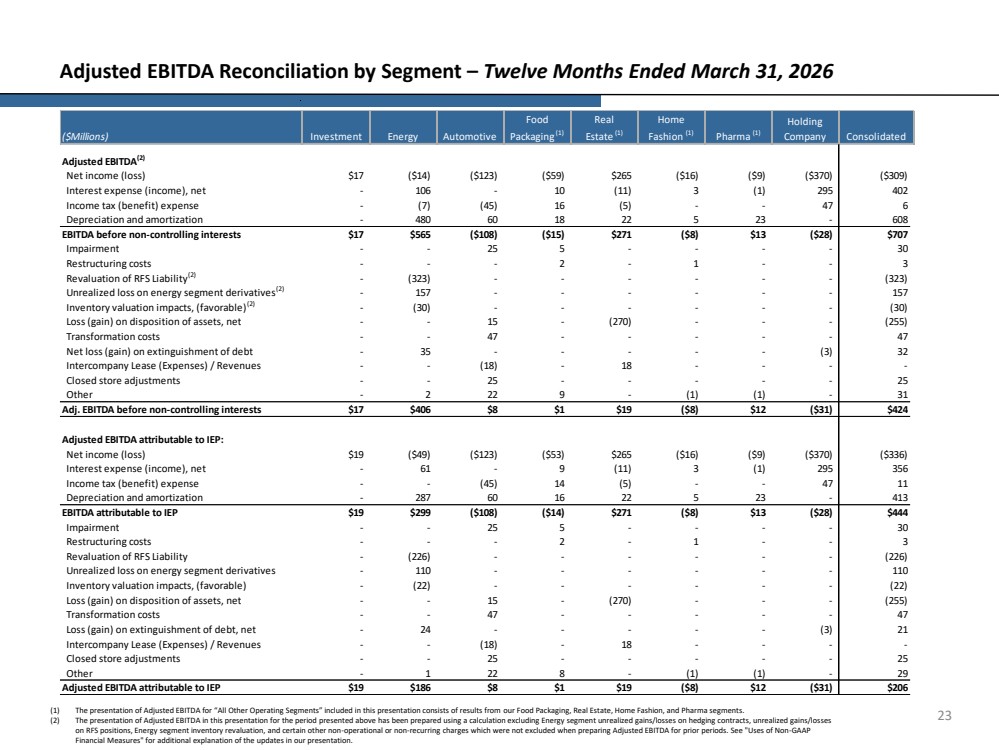
| 23 Adjusted EBITDA Reconciliation by Segment – Twelve Months Ended March 31, 2026 (1) The presentation of Adjusted EBITDA for “All Other Operating Segments” included in this presentation consists of results from our Food Packaging, Real Estate, Home Fashion, and Pharma segments. (2) The presentation of Adjusted EBITDA in this presentation for the period presented above has been prepared using a calculation excluding Energy segment unrealized gains/losses on hedging contracts, unrealized gains/losses on RFS positions, Energy segment inventory revaluation, and certain other non-operational or non-recurring charges which were not excluded when preparing Adjusted EBITDA for prior periods. See "Uses of Non-GAAP Financial Measures" for additional explanation of the updates in our presentation. Net income (loss) $17 ($14) ($123) ($59) $265 ($16) ($9) ($370) ($309) Interest expense (income), net - 106 - 10 (11) 3 (1) 295 402 Income tax (benefit) expense - (7) (45) 16 (5) - - 47 6 Depreciation and amortization - 480 60 18 22 5 23 - 608 $17 $565 ($108) ($15) $271 ($8) $13 ($28) $707 Impairment - - 25 5 - - - - 30 Restructuring costs - - - 2 - 1 - - 3 Revaluation of RFS Liability(2) - (323) - - - - - - (323) Unrealized loss on energy segment derivatives(2) - 157 - - - - - - 157 Inventory valuation impacts, (favorable)(2) - (30) - - - - - - (30) Loss (gain) on disposition of assets, net - - 15 - (270) - - - (255) Transformation costs - - 47 - - - - - 47 Net loss (gain) on extinguishment of debt - 35 - - - - - (3) 32 Intercompany Lease (Expenses) / Revenues - - (18) - 18 - - - - Closed store adjustments - - 25 - - - - - 25 Other - 2 22 9 - (1) (1) - 31 $17 $406 $8 $1 $19 ($8) $12 ($31) $424 Net income (loss) $19 ($49) ($123) ($53) $265 ($16) ($9) ($370) ($336) Interest expense (income), net - 61 - 9 (11) 3 (1) 295 356 Income tax (benefit) expense - - (45) 14 (5) - - 47 11 Depreciation and amortization - 287 60 16 22 5 23 - 413 $19 $299 ($108) ($14) $271 ($8) $13 ($28) $444 Impairment - - 25 5 - - - - 30 Restructuring costs - - - 2 - 1 - - 3 Revaluation of RFS Liability - (226) - - - - - - (226) Unrealized loss on energy segment derivatives - 110 - - - - - - 110 Inventory valuation impacts, (favorable) - (22) - - - - - - (22) Loss (gain) on disposition of assets, net - - 15 - (270) - - - (255) Transformation costs - - 47 - - - - - 47 Loss (gain) on extinguishment of debt, net - 24 - - - - - (3) 21 Intercompany Lease (Expenses) / Revenues - - (18) - 18 - - - - Closed store adjustments - - 25 - - - - - 25 Other - 1 22 8 - (1) (1) - 29 $19 $186 $8 $1 $19 ($8) $12 ($31) $206 ($Millions) Investment Energy Automotive Food Packaging (1) Real Estate (1) Home Fashion (1) Pharma (1) Holding Company Consolidated Adjusted EBITDA attributable to IEP Adjusted EBITDA(2) EBITDA before non-controlling interests Adj. EBITDA before non-controlling interests Adjusted EBITDA attributable to IEP: EBITDA attributable to IEP |
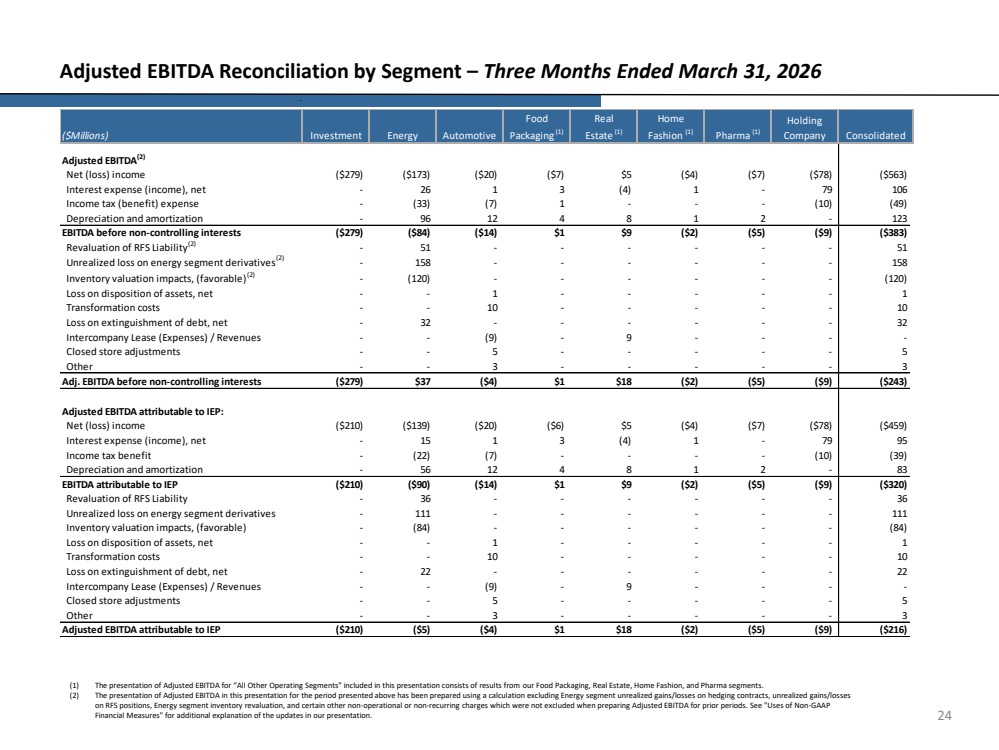
| 24 Adjusted EBITDA Reconciliation by Segment – Three Months Ended March 31, 2026 (1) The presentation of Adjusted EBITDA for “All Other Operating Segments” included in this presentation consists of results from our Food Packaging, Real Estate, Home Fashion, and Pharma segments. (2) The presentation of Adjusted EBITDA in this presentation for the period presented above has been prepared using a calculation excluding Energy segment unrealized gains/losses on hedging contracts, unrealized gains/losses on RFS positions, Energy segment inventory revaluation, and certain other non-operational or non-recurring charges which were not excluded when preparing Adjusted EBITDA for prior periods. See "Uses of Non-GAAP Financial Measures" for additional explanation of the updates in our presentation. Net (loss) income ($279) ($173) ($20) ($7) $5 ($4) ($7) ($78) ($563) Interest expense (income), net - 26 1 3 (4) 1 - 79 106 Income tax (benefit) expense - (33) (7) 1 - - - (10) (49) Depreciation and amortization - 96 12 4 8 1 2 - 123 ($279) ($84) ($14) $1 $9 ($2) ($5) ($9) ($383) Revaluation of RFS Liability(2) - 51 - - - - - - 51 Unrealized loss on energy segment derivatives(2) - 158 - - - - - - 158 Inventory valuation impacts, (favorable)(2) - (120) - - - - - - (120) Loss on disposition of assets, net - - 1 - - - - - 1 Transformation costs - - 10 - - - - - 10 Loss on extinguishment of debt, net - 32 - - - - - - 32 Intercompany Lease (Expenses) / Revenues - - (9) - 9 - - - - Closed store adjustments - - 5 - - - - - 5 Other - - 3 - - - - - 3 ($279) $37 ($4) $1 $18 ($2) ($5) ($9) ($243) Net (loss) income ($210) ($139) ($20) ($6) $5 ($4) ($7) ($78) ($459) Interest expense (income), net - 15 1 3 (4) 1 - 79 95 Income tax benefit - (22) (7) - - - - (10) (39) Depreciation and amortization - 56 12 4 8 1 2 - 83 ($210) ($90) ($14) $1 $9 ($2) ($5) ($9) ($320) Revaluation of RFS Liability - 36 - - - - - - 36 Unrealized loss on energy segment derivatives - 111 - - - - - - 111 Inventory valuation impacts, (favorable) - (84) - - - - - - (84) Loss on disposition of assets, net - - 1 - - - - - 1 Transformation costs - - 10 - - - - - 10 Loss on extinguishment of debt, net - 22 - - - - - - 22 Intercompany Lease (Expenses) / Revenues - - (9) - 9 - - - - Closed store adjustments - - 5 - - - - - 5 Other - - 3 - - - - - 3 ($210) ($5) ($4) $1 $18 ($2) ($5) ($9) ($216) ($Millions) Investment Energy Automotive Food Packaging (1) Holding Company Consolidated Real Estate (1) Home Fashion (1) Pharma (1) Adjusted EBITDA(2) EBITDA before non-controlling interests Adj. EBITDA before non-controlling interests Adjusted EBITDA attributable to IEP Adjusted EBITDA attributable to IEP: EBITDA attributable to IEP |
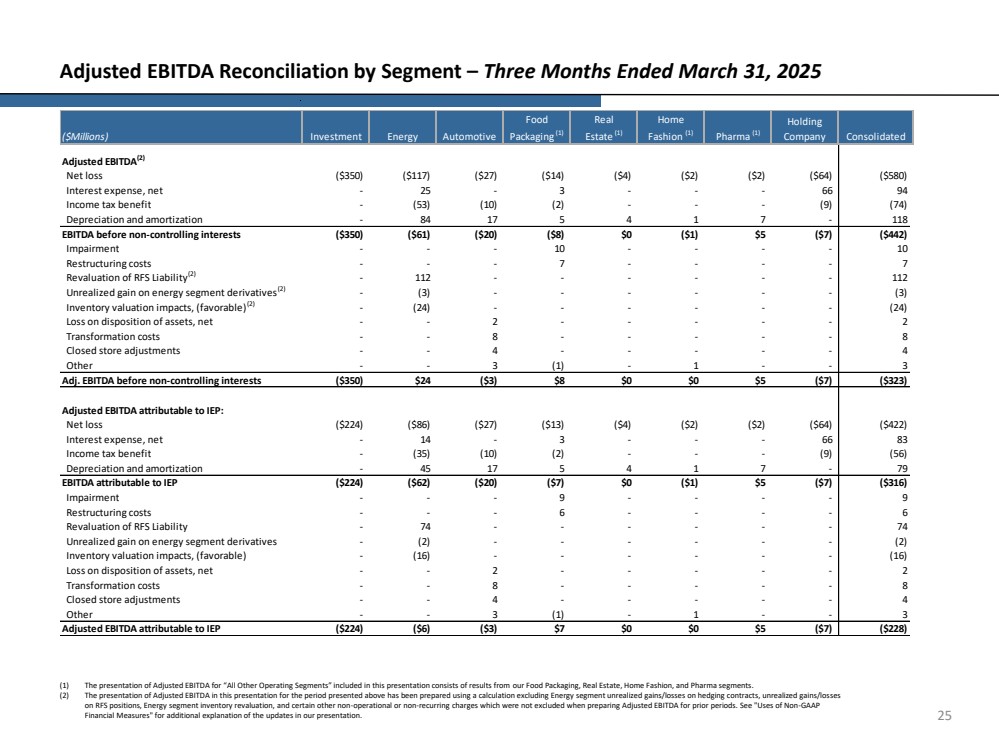
| 25 Adjusted EBITDA Reconciliation by Segment – Three Months Ended March 31, 2025 (1) The presentation of Adjusted EBITDA for “All Other Operating Segments” included in this presentation consists of results from our Food Packaging, Real Estate, Home Fashion, and Pharma segments. (2) The presentation of Adjusted EBITDA in this presentation for the period presented above has been prepared using a calculation excluding Energy segment unrealized gains/losses on hedging contracts, unrealized gains/losses on RFS positions, Energy segment inventory revaluation, and certain other non-operational or non-recurring charges which were not excluded when preparing Adjusted EBITDA for prior periods. See "Uses of Non-GAAP Financial Measures" for additional explanation of the updates in our presentation. Net loss ($350) ($117) ($27) ($14) ($4) ($2) ($2) ($64) ($580) Interest expense, net - 25 - 3 - - - 66 94 Income tax benefit - (53) (10) (2) - - - (9) (74) Depreciation and amortization - 84 17 5 4 1 7 - 118 ($350) ($61) ($20) ($8) $0 ($1) $5 ($7) ($442) Impairment - - - 10 - - - - 10 Restructuring costs - - - 7 - - - - 7 Revaluation of RFS Liability(2) - 112 - - - - - - 112 Unrealized gain on energy segment derivatives(2) - (3) - - - - - - (3) Inventory valuation impacts, (favorable)(2) - (24) - - - - - - (24) Loss on disposition of assets, net - - 2 - - - - - 2 Transformation costs - - 8 - - - - - 8 Closed store adjustments - - 4 - - - - - 4 Other - - 3 (1) - 1 - - 3 ($350) $24 ($3) $8 $0 $0 $5 ($7) ($323) Net loss ($224) ($86) ($27) ($13) ($4) ($2) ($2) ($64) ($422) Interest expense, net - 14 - 3 - - - 66 83 Income tax benefit - (35) (10) (2) - - - (9) (56) Depreciation and amortization - 45 17 5 4 1 7 - 79 ($224) ($62) ($20) ($7) $0 ($1) $5 ($7) ($316) Impairment - - - 9 - - - - 9 Restructuring costs - - - 6 - - - - 6 Revaluation of RFS Liability - 74 - - - - - - 74 Unrealized gain on energy segment derivatives - (2) - - - - - - (2) Inventory valuation impacts, (favorable) - (16) - - - - - - (16) Loss on disposition of assets, net - - 2 - - - - - 2 Transformation costs - - 8 - - - - - 8 Closed store adjustments - - 4 - - - - - 4 Other - - 3 (1) - 1 - - 3 ($224) ($6) ($3) $7 $0 $0 $5 ($7) ($228) ($Millions) Investment Energy Automotive Food Packaging (1) Holding Company Consolidated Real Estate (1) Home Fashion (1) Pharma (1) Adjusted EBITDA(2) EBITDA before non-controlling interests Adj. EBITDA before non-controlling interests Adjusted EBITDA attributable to IEP Adjusted EBITDA attributable to IEP: EBITDA attributable to IEP |
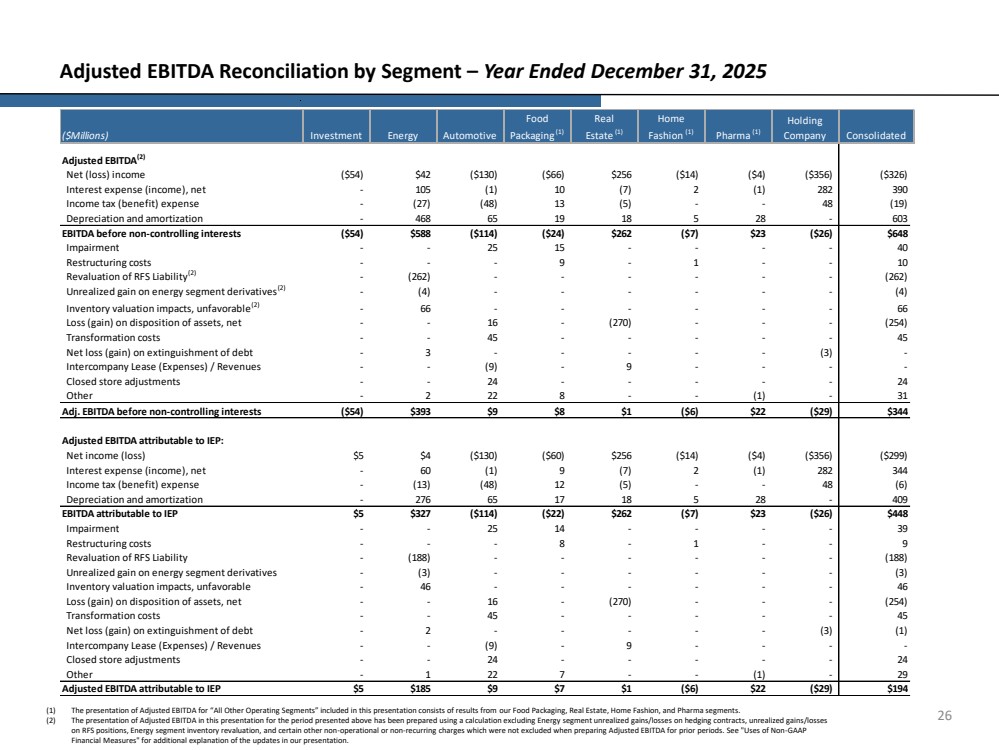
| 26 Adjusted EBITDA Reconciliation by Segment – Year Ended December 31, 2025 (1) The presentation of Adjusted EBITDA for “All Other Operating Segments” included in this presentation consists of results from our Food Packaging, Real Estate, Home Fashion, and Pharma segments. (2) The presentation of Adjusted EBITDA in this presentation for the period presented above has been prepared using a calculation excluding Energy segment unrealized gains/losses on hedging contracts, unrealized gains/losses on RFS positions, Energy segment inventory revaluation, and certain other non-operational or non-recurring charges which were not excluded when preparing Adjusted EBITDA for prior periods. See "Uses of Non-GAAP Financial Measures" for additional explanation of the updates in our presentation. Net (loss) income ($54) $42 ($130) ($66) $256 ($14) ($4) ($356) ($326) Interest expense (income), net - 105 (1) 10 (7) 2 (1) 282 390 Income tax (benefit) expense - (27) (48) 13 (5) - - 48 (19) Depreciation and amortization - 468 65 19 18 5 28 - 603 ($54) $588 ($114) ($24) $262 ($7) $23 ($26) $648 Impairment - - 25 15 - - - - 40 Restructuring costs - - - 9 - 1 - - 10 Revaluation of RFS Liability(2) - (262) - - - - - - (262) Unrealized gain on energy segment derivatives(2) - (4) - - - - - - (4) Inventory valuation impacts, unfavorable(2) - 66 - - - - - - 66 Loss (gain) on disposition of assets, net - - 16 - (270) - - - (254) Transformation costs - - 45 - - - - - 45 Net loss (gain) on extinguishment of debt - 3 - - - - - (3) - Intercompany Lease (Expenses) / Revenues - - (9) - 9 - - - - Closed store adjustments - - 24 - - - - - 24 Other - 2 22 8 - - (1) - 31 ($54) $393 $9 $8 $1 ($6) $22 ($29) $344 Net income (loss) $5 $4 ($130) ($60) $256 ($14) ($4) ($356) ($299) Interest expense (income), net - 60 (1) 9 (7) 2 (1) 282 344 Income tax (benefit) expense - (13) (48) 12 (5) - - 48 (6) Depreciation and amortization - 276 65 17 18 5 28 - 409 $5 $327 ($114) ($22) $262 ($7) $23 ($26) $448 Impairment - - 25 14 - - - - 39 Restructuring costs - - - 8 - 1 - - 9 Revaluation of RFS Liability - (188) - - - - - - (188) Unrealized gain on energy segment derivatives - (3) - - - - - - (3) Inventory valuation impacts, unfavorable - 46 - - - - - - 46 Loss (gain) on disposition of assets, net - - 16 - (270) - - - (254) Transformation costs - - 45 - - - - - 45 Net loss (gain) on extinguishment of debt - 2 - - - - - (3) (1) Intercompany Lease (Expenses) / Revenues - - (9) - 9 - - - - Closed store adjustments - - 24 - - - - - 24 Other - 1 22 7 - - (1) - 29 $5 $185 $9 $7 $1 ($6) $22 ($29) $194 ($Millions) Investment Energy Automotive Food Packaging (1) Real Estate (1) Home Fashion (1) Pharma (1) Holding Company Consolidated Adjusted EBITDA(2) EBITDA before non-controlling interests Adj. EBITDA before non-controlling interests Adjusted EBITDA attributable to IEP: EBITDA attributable to IEP Adjusted EBITDA attributable to IEP |
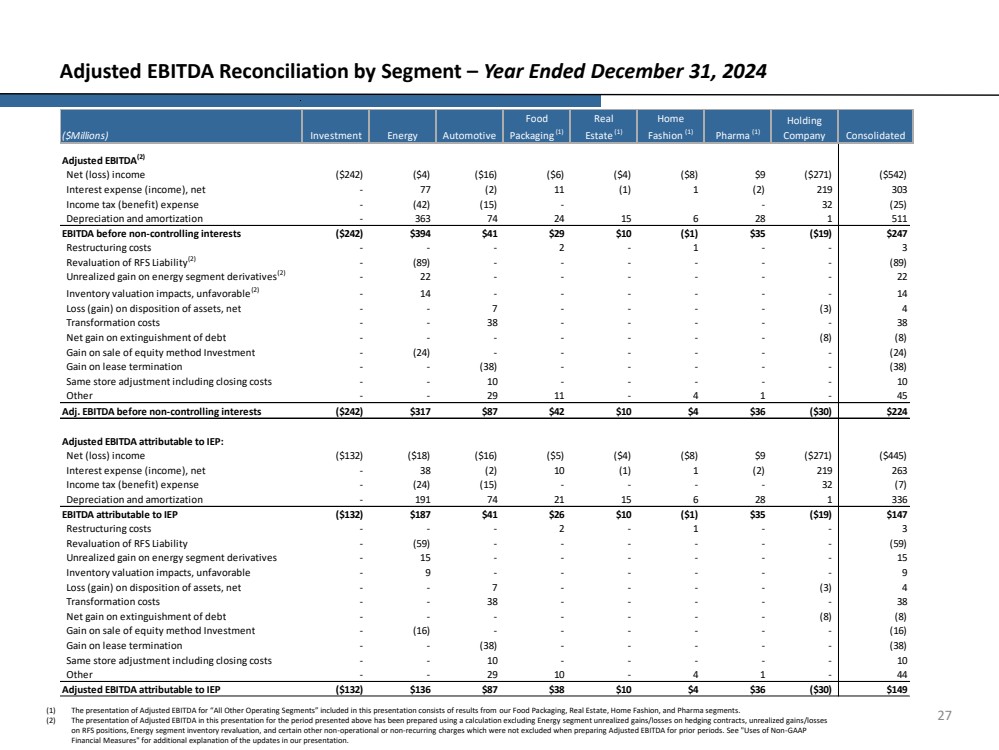
| 27 Adjusted EBITDA Reconciliation by Segment – Year Ended December 31, 2024 (1) The presentation of Adjusted EBITDA for “All Other Operating Segments” included in this presentation consists of results from our Food Packaging, Real Estate, Home Fashion, and Pharma segments. (2) The presentation of Adjusted EBITDA in this presentation for the period presented above has been prepared using a calculation excluding Energy segment unrealized gains/losses on hedging contracts, unrealized gains/losses on RFS positions, Energy segment inventory revaluation, and certain other non-operational or non-recurring charges which were not excluded when preparing Adjusted EBITDA for prior periods. See "Uses of Non-GAAP Financial Measures" for additional explanation of the updates in our presentation. Net (loss) income ($242) ($4) ($16) ($6) ($4) ($8) $9 ($271) ($542) Interest expense (income), net - 77 (2) 11 (1) 1 (2) 219 303 Income tax (benefit) expense - (42) (15) - - 32 (25) Depreciation and amortization - 363 74 24 15 6 28 1 511 ($242) $394 $41 $29 $10 ($1) $35 ($19) $247 Restructuring costs - - - 2 - 1 - - 3 Revaluation of RFS Liability(2) - (89) - - - - - - (89) Unrealized gain on energy segment derivatives(2) - 22 - - - - - - 22 Inventory valuation impacts, unfavorable(2) - 14 - - - - - - 14 Loss (gain) on disposition of assets, net - - 7 - - - - (3) 4 Transformation costs - - 38 - - - - - 38 Net gain on extinguishment of debt - - - - - - - (8) (8) Gain on sale of equity method Investment - (24) - - - - - - (24) Gain on lease termination - - (38) - - - - - (38) Same store adjustment including closing costs - - 10 - - - - - 10 Other - - 29 11 - 4 1 - 45 ($242) $317 $87 $42 $10 $4 $36 ($30) $224 Net (loss) income ($132) ($18) ($16) ($5) ($4) ($8) $9 ($271) ($445) Interest expense (income), net - 38 (2) 10 (1) 1 (2) 219 263 Income tax (benefit) expense - (24) (15) - - - - 32 (7) Depreciation and amortization - 191 74 21 15 6 28 1 336 ($132) $187 $41 $26 $10 ($1) $35 ($19) $147 Restructuring costs - - - 2 - 1 - - 3 Revaluation of RFS Liability - (59) - - - - - - (59) Unrealized gain on energy segment derivatives - 15 - - - - - - 15 Inventory valuation impacts, unfavorable - 9 - - - - - - 9 Loss (gain) on disposition of assets, net - - 7 - - - - (3) 4 Transformation costs - - 38 - - - - - 38 Net gain on extinguishment of debt - - - - - - - (8) (8) Gain on sale of equity method Investment - (16) - - - - - - (16) Gain on lease termination - - (38) - - - - - (38) Same store adjustment including closing costs - - 10 - - - - - 10 Other - - 29 10 - 4 1 - 44 ($132) $136 $87 $38 $10 $4 $36 ($30) $149 ($Millions) Investment Energy Automotive Food Packaging (1) Real Estate (1) Home Fashion (1) Pharma (1) Holding Company Consolidated Adjusted EBITDA(2) EBITDA before non-controlling interests Adj. EBITDA before non-controlling interests Adjusted EBITDA attributable to IEP: EBITDA attributable to IEP Adjusted EBITDA attributable to IEP |
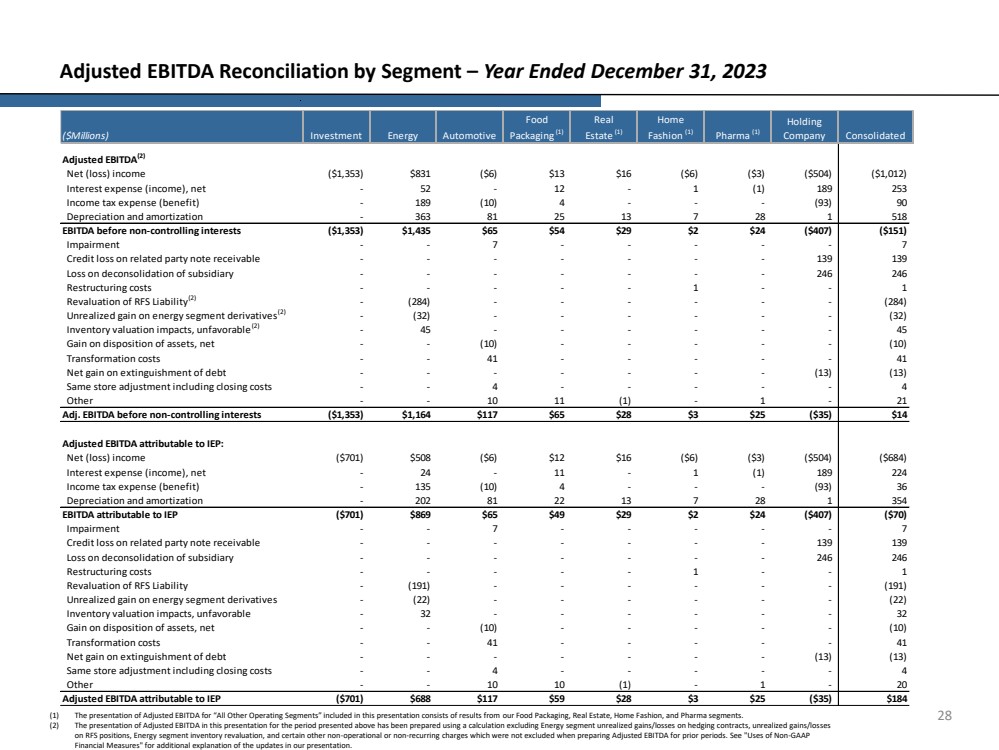
| 28 Adjusted EBITDA Reconciliation by Segment – Year Ended December 31, 2023 (1) The presentation of Adjusted EBITDA for “All Other Operating Segments” included in this presentation consists of results from our Food Packaging, Real Estate, Home Fashion, and Pharma segments. (2) The presentation of Adjusted EBITDA in this presentation for the period presented above has been prepared using a calculation excluding Energy segment unrealized gains/losses on hedging contracts, unrealized gains/losses on RFS positions, Energy segment inventory revaluation, and certain other non-operational or non-recurring charges which were not excluded when preparing Adjusted EBITDA for prior periods. See "Uses of Non-GAAP Financial Measures" for additional explanation of the updates in our presentation. Net (loss) income ($1,353) $831 ($6) $13 $16 ($6) ($3) ($504) ($1,012) Interest expense (income), net - 52 - 12 - 1 (1) 189 253 Income tax expense (benefit) - 189 (10) 4 - - - (93) 90 Depreciation and amortization - 363 81 25 13 7 28 1 518 ($1,353) $1,435 $65 $54 $29 $2 $24 ($407) ($151) Impairment - - 7 - - - - - 7 Credit loss on related party note receivable - - - - - - - 139 139 Loss on deconsolidation of subsidiary - - - - - - - 246 246 Restructuring costs - - - - - 1 - - 1 Revaluation of RFS Liability(2) - (284) - - - - - - (284) Unrealized gain on energy segment derivatives(2) - (32) - - - - - - (32) Inventory valuation impacts, unfavorable(2) - 45 - - - - - - 45 Gain on disposition of assets, net - - (10) - - - - - (10) Transformation costs - - 41 - - - - - 41 Net gain on extinguishment of debt - - - - - - - (13) (13) Same store adjustment including closing costs - - 4 - - - - - 4 Other - - 10 11 (1) - 1 - 21 ($1,353) $1,164 $117 $65 $28 $3 $25 ($35) $14 Net (loss) income ($701) $508 ($6) $12 $16 ($6) ($3) ($504) ($684) Interest expense (income), net - 24 - 11 - 1 (1) 189 224 Income tax expense (benefit) - 135 (10) 4 - - - (93) 36 Depreciation and amortization - 202 81 22 13 7 28 1 354 ($701) $869 $65 $49 $29 $2 $24 ($407) ($70) Impairment - - 7 - - - - - 7 Credit loss on related party note receivable - - - - - - - 139 139 Loss on deconsolidation of subsidiary - - - - - - - 246 246 Restructuring costs - - - - - 1 - - 1 Revaluation of RFS Liability - (191) - - - - - - (191) Unrealized gain on energy segment derivatives - (22) - - - - - - (22) Inventory valuation impacts, unfavorable - 32 - - - - - - 32 Gain on disposition of assets, net - - (10) - - - - - (10) Transformation costs - - 41 - - - - - 41 Net gain on extinguishment of debt - - - - - - - (13) (13) Same store adjustment including closing costs - - 4 - - - - - 4 Other - - 10 10 (1) - 1 - 20 ($701) $688 $117 $59 $28 $3 $25 ($35) $184 EBITDA attributable to IEP Adjusted EBITDA attributable to IEP Adjusted EBITDA attributable to IEP: EBITDA before non-controlling interests Adj. EBITDA before non-controlling interests Adjusted EBITDA(2) Consolidated Home Fashion (1) Pharma (1) Real Estate (1) ($Millions) Investment Energy Automotive Food Packaging (1) Holding Company |