Exhibit 99.2
| First Quarter 2026 Continuing Operations Supplemental Slides May 11, 2026 |
| p. 2 About Accendra Health • Accendra Health, Inc. is a leading nationwide provider of products, technology, and services that support health beyond the hospital for millions of people each year. • We connect patients, providers, and insurers, delivering innovative solutions that help promote better health outcomes and improve quality of life for people living with chronic, complex, and acute health conditions. • Backed by the industry-leading expertise of our Apria and Byram brands, Accendra Health is reimagining the future of home-based care. • To learn more about our broad portfolio of essentials for diabetes, sleep health, wound care, respiratory care, urology, and ostomy, please visit AccendraHealth.com. |
| p. 3 This presentation is intended to be disclosure through methods reasonably designed to provide broad, non-exclusionary distribution to the public in compliance with the SEC’s Fair Disclosure Regulation. This presentation contains certain “forward-looking” statements made pursuant to the Safe Harbor provisions of the Private Securities Litigation Reform Act of 1995. These statements include, but are not limited to, the statements in this presentation regarding our future prospects and performance, including our expectations with respect to our financial performance, our 2026 financial results, our expectations regarding the performance of our business following the completion of the sale of the Products & Healthcare Services business, the adverse impact of failing to consummate all or part of the balance sheet optimization transaction on the terms described herein or at all, our cost saving initiatives, future indebtedness and growth, industry trends, as well as statements related to our expectations regarding the performance of our business, including our ability to address macro and market conditions. Forward-looking statements involve known and unknown risks and uncertainties that may cause our actual results in future periods to differ materially from those projected or contemplated in the forward-looking statements. Investors should refer to the Accendra Health, Inc.’s (the Company)’s Annual Report on Form 10-K for the year ended December 31, 2025, filed with the SEC on February 20, 2026, including the section captioned “Item 1A. Risk Factors,” as applicable, and subsequent quarterly reports on Form 10-Q and current reports on Form 8-K filed with or furnished to the SEC, for a discussion of certain known risk factors that could cause the Company’s actual results to differ materially from its current estimates. These filings are available at www.accendrahealth.com. Given these risks and uncertainties, the Company can give no assurance that any forward-looking statements will, in fact, transpire and, therefore, cautions investors not to place undue reliance on them. The Company specifically disclaims any obligation to update or revise any forward-looking statements, whether as a result of new information, future developments or otherwise. Safe Harbor |
| p. 4 Non-GAAP This presentation contains financial measures that are not calculated in accordance with U.S. generally accepted accounting principles (GAAP). In general, the measures exclude items and charges that (i) management does not believe reflect the Company’s core business and relate more to strategic, multi-year corporate activities; or (ii) relate to activities or actions that may have occurred over multiple or in prior periods without predictable trends. Management uses these non-GAAP financial measures internally to evaluate the Company’s performance, evaluate the balance sheet, engage in financial and operational planning, and determine incentive compensation. Management provides these non-GAAP financial measures to investors as supplemental metrics to assist readers in assessing the effects of items and events on its financial and operating results and in comparing the Company’s performance to that of its competitors. However, the non-GAAP financial measures used by the Company may be calculated differently from, and therefore may not be comparable to, similarly titled measures used by other companies. The non-GAAP financial measures disclosed by the Company should not be considered substitutes for, or superior to, financial measures calculated in accordance with GAAP, and the financial results calculated in accordance with GAAP and reconciliations to those financial statements set forth above should be carefully evaluated. No Offer or Solicitation This presentation is not intended to and does not constitute an offer to sell or the solicitation of an offer to subscribe for or buy or an invitation to purchase or subscribe for any securities or the solicitation of any vote, consent or approval in any jurisdiction in connection with the offers to exchange the Company’s existing notes, or otherwise, nor shall there be any sale, issuance or transfer of securities in any jurisdiction in contravention of applicable law. In particular, this presentation is not an offer of securities for sale into the United States. The new notes to be offered in the offers to exchange have not been registered under the Securities Act or any state securities laws, and unless so registered, the new notes may not be offered or sold in the United States or to any U.S. persons except pursuant to an exemption from, or in a transaction not subject to, the registration requirements of the Securities Act and applicable state securities laws. |
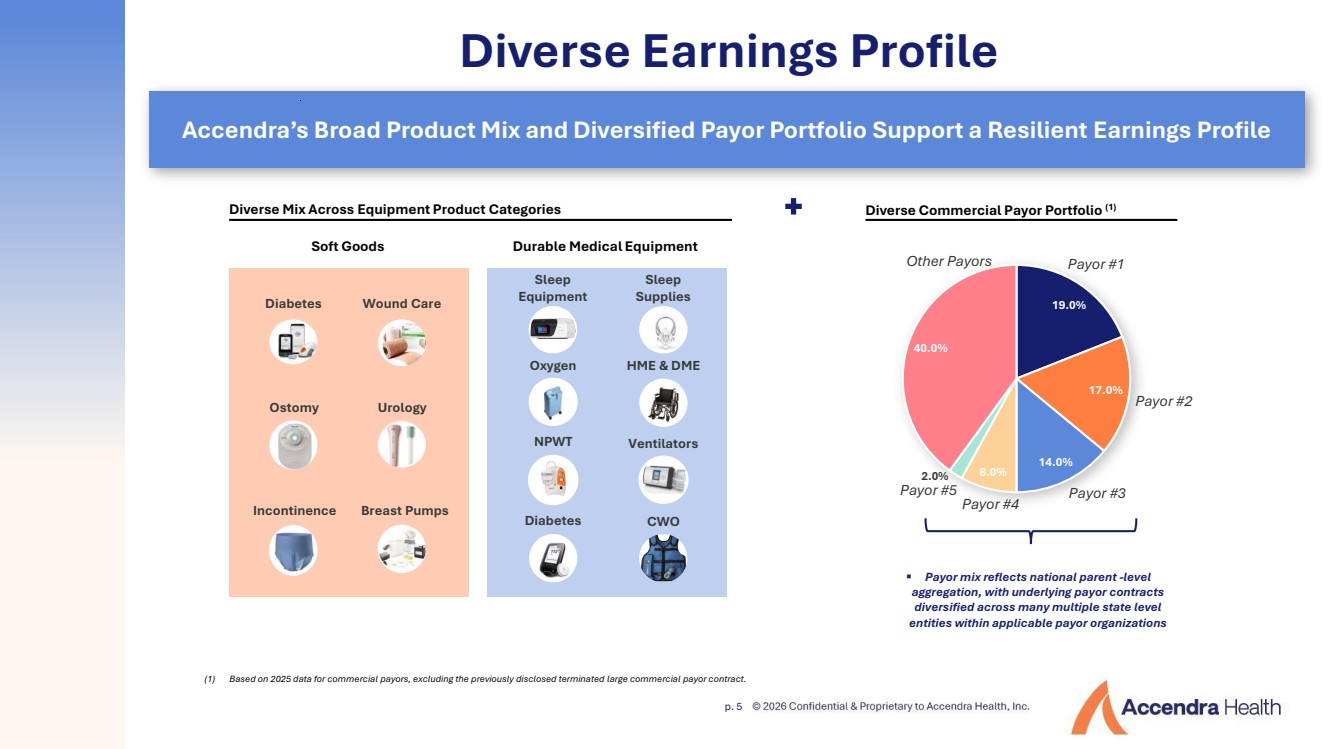
| p. 5 Accendra’s Broad Product Mix and Diversified Payor Portfolio Support a Resilient Earnings Profile Diverse Earnings Profile 19.0% 17.0% 14.0% 8.0% 2.0% 40.0% Diabetes Wound Care Ostomy Urology Incontinence Breast Pumps Sleep Equipment Oxygen Ventilators HME & DME NPWT Diabetes Diverse Mix Across Equipment Product Categories Diverse Commercial Payor Portfolio (1) Soft Goods Durable Medical Equipment Other Payors Payor #1 Payor #2 Payor #3 Payor #4 Payor #5 Payor mix reflects national parent -level aggregation, with underlying payor contracts diversified across many multiple state level entities within applicable payor organizations CWO Sleep Supplies (1) Based on 2025 data for commercial payors, excluding the previously disclosed terminated large commercial payor contract. |
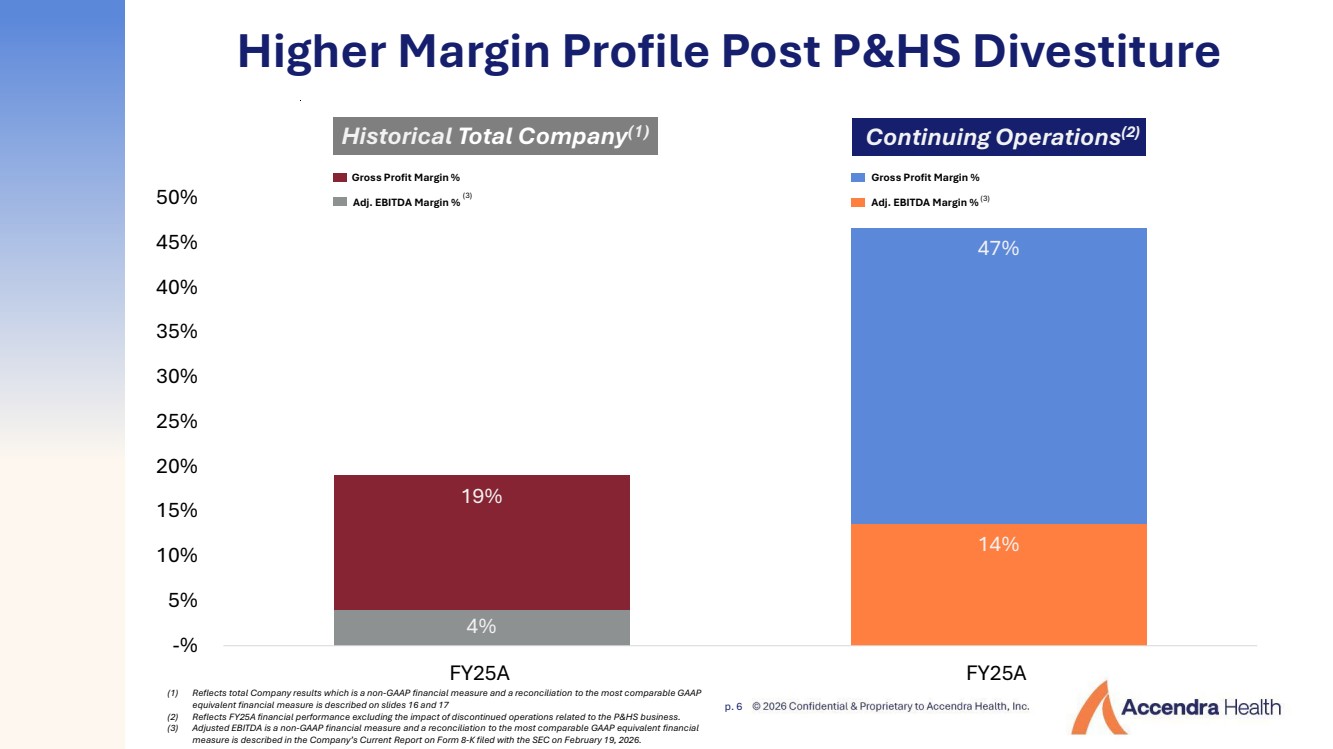
| p. 6 Historical Total Company(1) 19% 47% 4% 14% -% 5% 10% 15% 20% 25% 30% 35% 40% 45% 50% FY25A FY25A Gross Profit Margin % Adj. EBITDA Margin % Gross Profit Margin % Adj. EBITDA Margin % Higher Margin Profile Post P&HS Divestiture Continuing Operations(2) (1) Reflects total Company results which is a non-GAAP financial measure and a reconciliation to the most comparable GAAP equivalent financial measure is described on slides 16 and 17 (2) Reflects FY25A financial performance excluding the impact of discontinued operations related to the P&HS business. (3) Adjusted EBITDA is a non-GAAP financial measure and a reconciliation to the most comparable GAAP equivalent financial measure is described in the Company’s Current Report on Form 8-K filed with the SEC on February 19, 2026. (3) (3) |
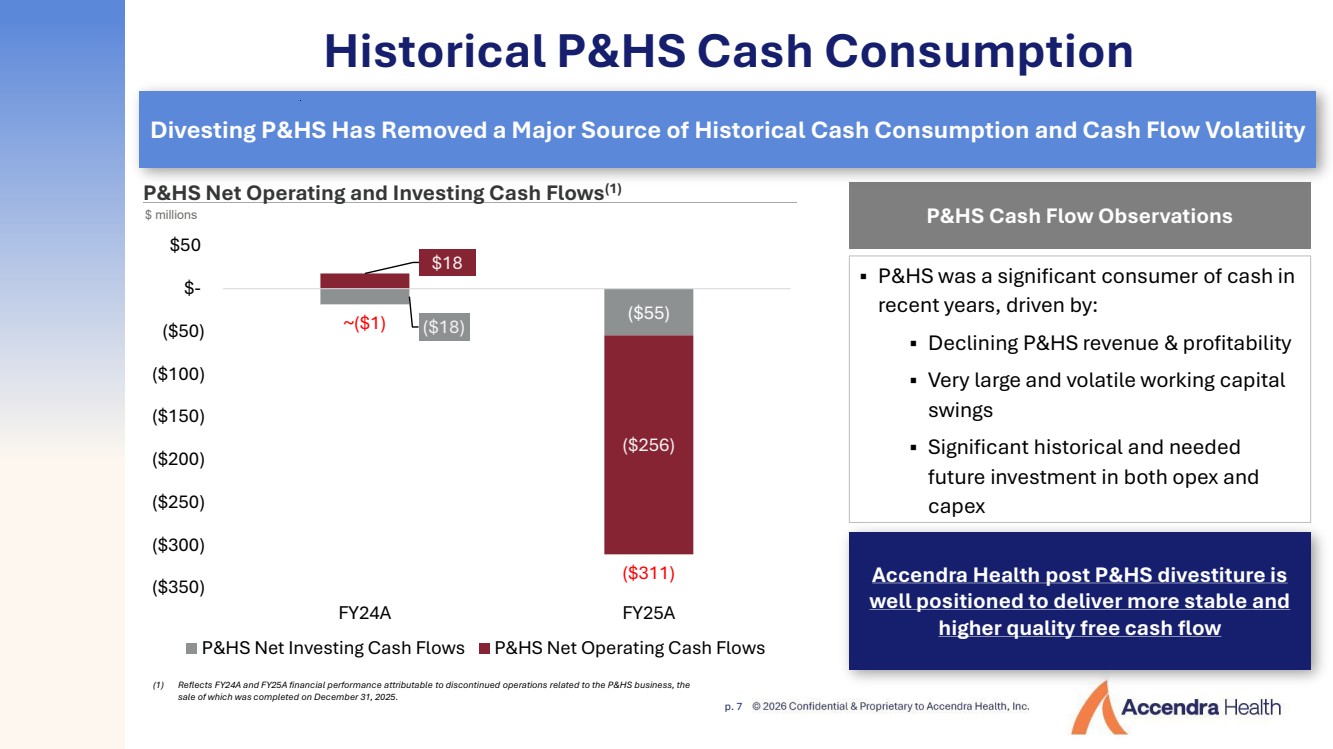
| p. 7 P&HS Net Operating and Investing Cash Flows(1) P&HS Cash Flow Observations P&HS was a significant consumer of cash in recent years, driven by: Declining P&HS revenue & profitability Very large and volatile working capital swings Significant historical and needed future investment in both opex and capex (1) Reflects FY24A and FY25A financial performance attributable to discontinued operations related to the P&HS business, the sale of which was completed on December 31, 2025. ($18) ($55) $18 ($256) ~($1) ($311) ($350) ($300) ($250) ($200) ($150) ($100) ($50) $- $50 FY24A FY25A P&HS Net Investing Cash Flows P&HS Net Operating Cash Flows Historical P&HS Cash Consumption Divesting P&HS Has Removed a Major Source of Historical Cash Consumption and Cash Flow Volatility Accendra Health post P&HS divestiture is well positioned to deliver more stable and higher quality free cash flow $ millions |
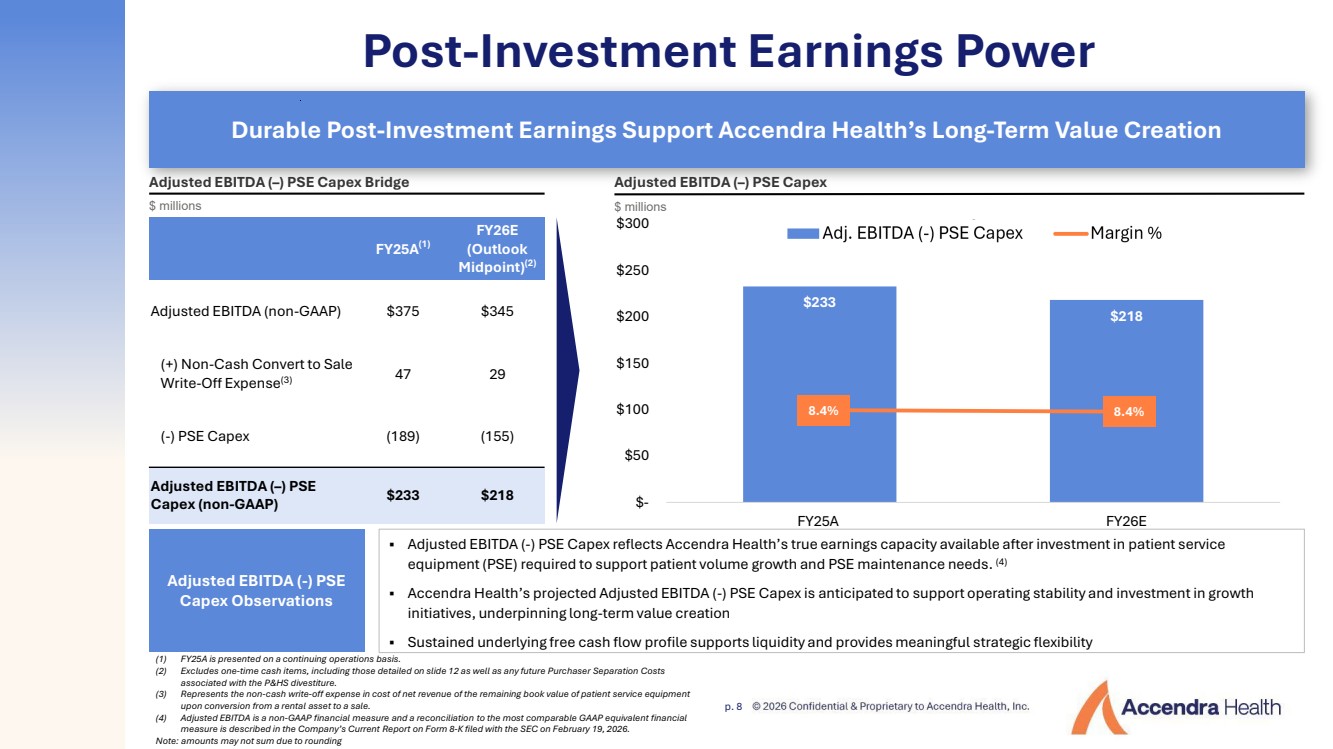
| p. 8 Durable Post-Investment Earnings Support Accendra Health’s Long-Term Value Creation Adjusted EBITDA (–) PSE Capex Adjusted EBITDA (-) PSE Capex Observations Post-Investment Earnings Power FY25A(1) FY26E (Outlook Midpoint)(2) Adjusted EBITDA (non-GAAP) $375 $345 (+) Non-Cash Convert to Sale Write-Off Expense(3) 47 29 (-) PSE Capex (189) (155) Adjusted EBITDA (–) PSE Capex (non-GAAP) $233 $218 Adjusted EBITDA (–) PSE Capex Bridge $233 $218 $- $50 $100 $150 $200 $250 $300 FY25A FY26E 8.4% 8.4% Adjusted EBITDA (-) PSE Capex reflects Accendra Health’s true earnings capacity available after investment in patient service equipment (PSE) required to support patient volume growth and PSE maintenance needs. (4) Accendra Health’s projected Adjusted EBITDA (-) PSE Capex is anticipated to support operating stability and investment in growth initiatives, underpinning long-term value creation Sustained underlying free cash flow profile supports liquidity and provides meaningful strategic flexibility $ millions $ millions (1) FY25A is presented on a continuing operations basis. (2) Excludes one-time cash items, including those detailed on slide 12 as well as any future Purchaser Separation Costs associated with the P&HS divestiture. (3) Represents the non-cash write-off expense in cost of net revenue of the remaining book value of patient service equipment upon conversion from a rental asset to a sale. (4) Adjusted EBITDA is a non-GAAP financial measure and a reconciliation to the most comparable GAAP equivalent financial measure is described in the Company’s Current Report on Form 8-K filed with the SEC on February 19, 2026. Note: amounts may not sum due to rounding |
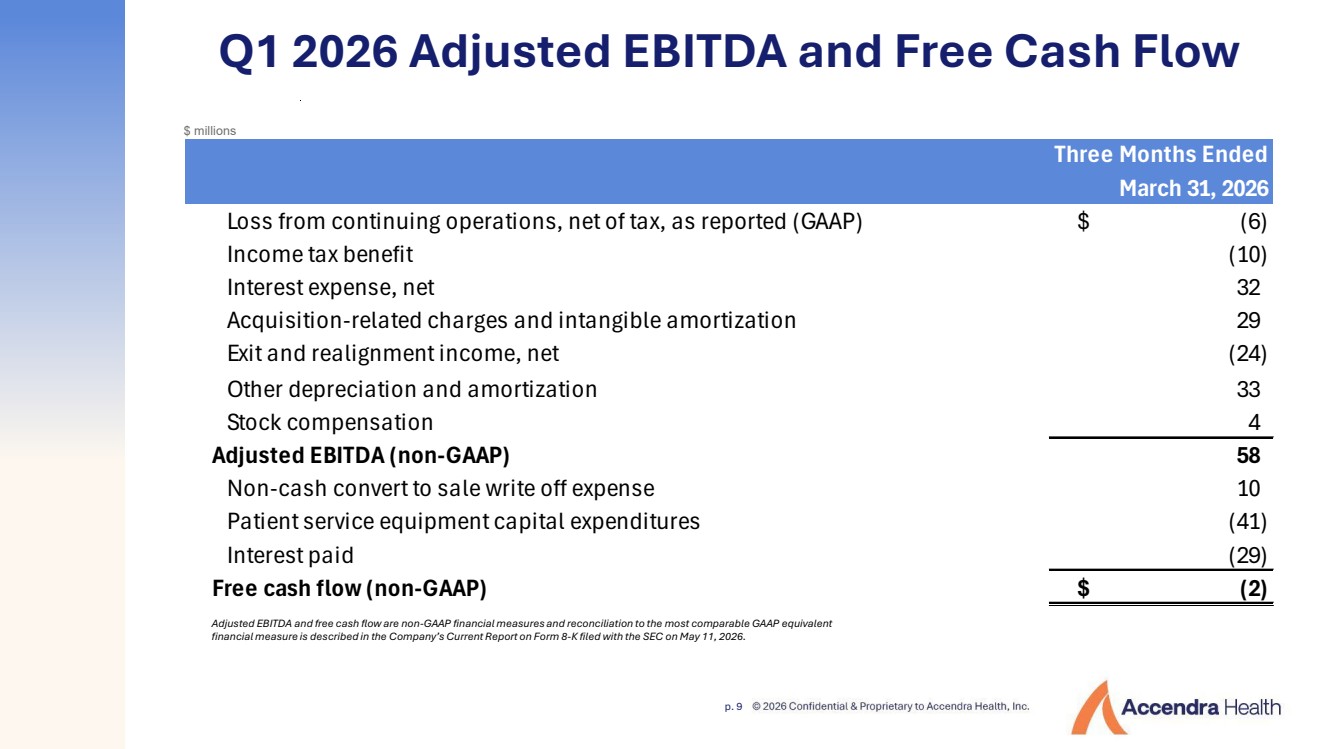
| p. 9 Q1 2026 Adjusted EBITDA and Free Cash Flow Three Months Ended March 31, 2026 Loss from continuing operations, net of tax, as reported (GAAP) $ (6) Income tax benefit (10) Interest expense, net 32 Acquisition-related charges and intangible amortization 29 Exit and realignment income, net (24) Other depreciation and amortization 33 Stock compensation 4 Adjusted EBITDA (non-GAAP) 58 Non-cash convert to sale write off expense 10 Patient service equipment capital expenditures (41) Interest paid (29) Free cash flow (non-GAAP) $ (2) $ millions Adjusted EBITDA and free cash flow are non-GAAP financial measures and reconciliation to the most comparable GAAP equivalent financial measure is described in the Company’s Current Report on Form 8-K filed with the SEC on May 11, 2026. |
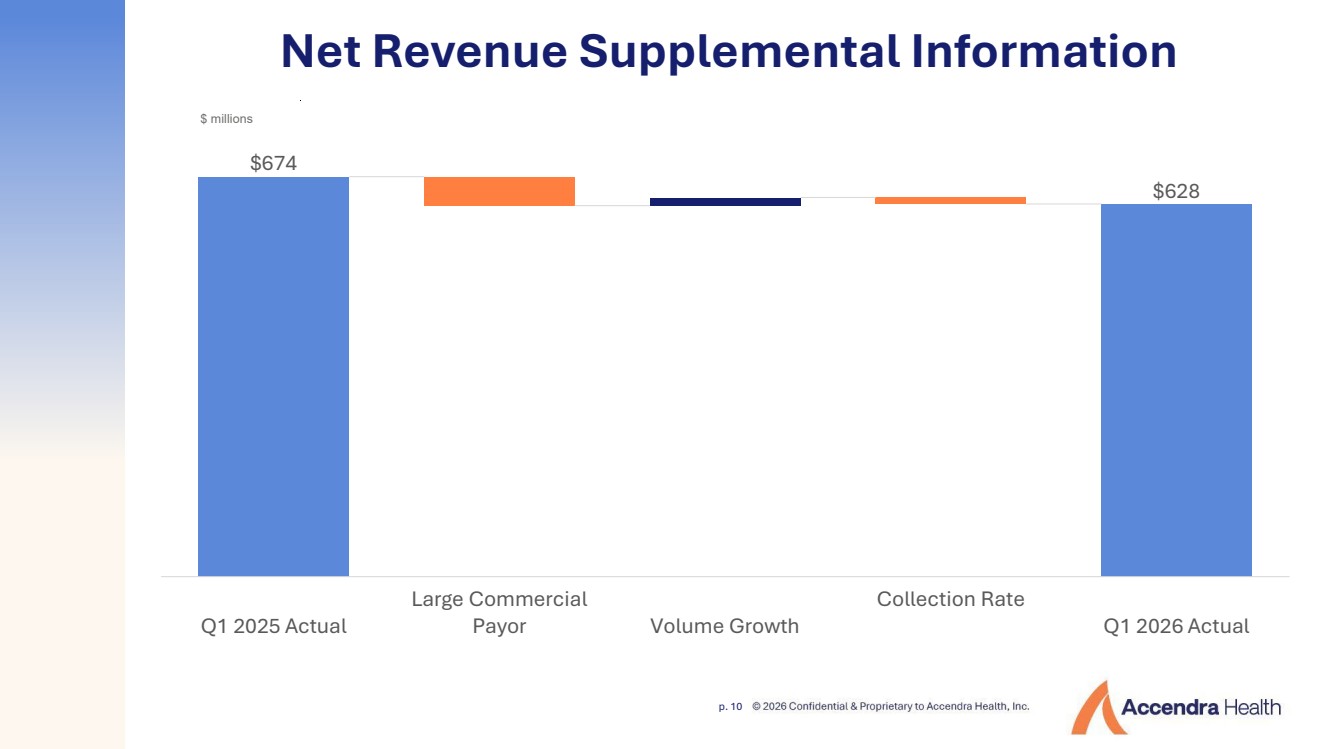
| p. 10 $674 $628 Q1 2025 Actual Large Commercial Payor Volume Growth Collection Rate Q1 2026 Actual Net Revenue Supplemental Information $ millions |
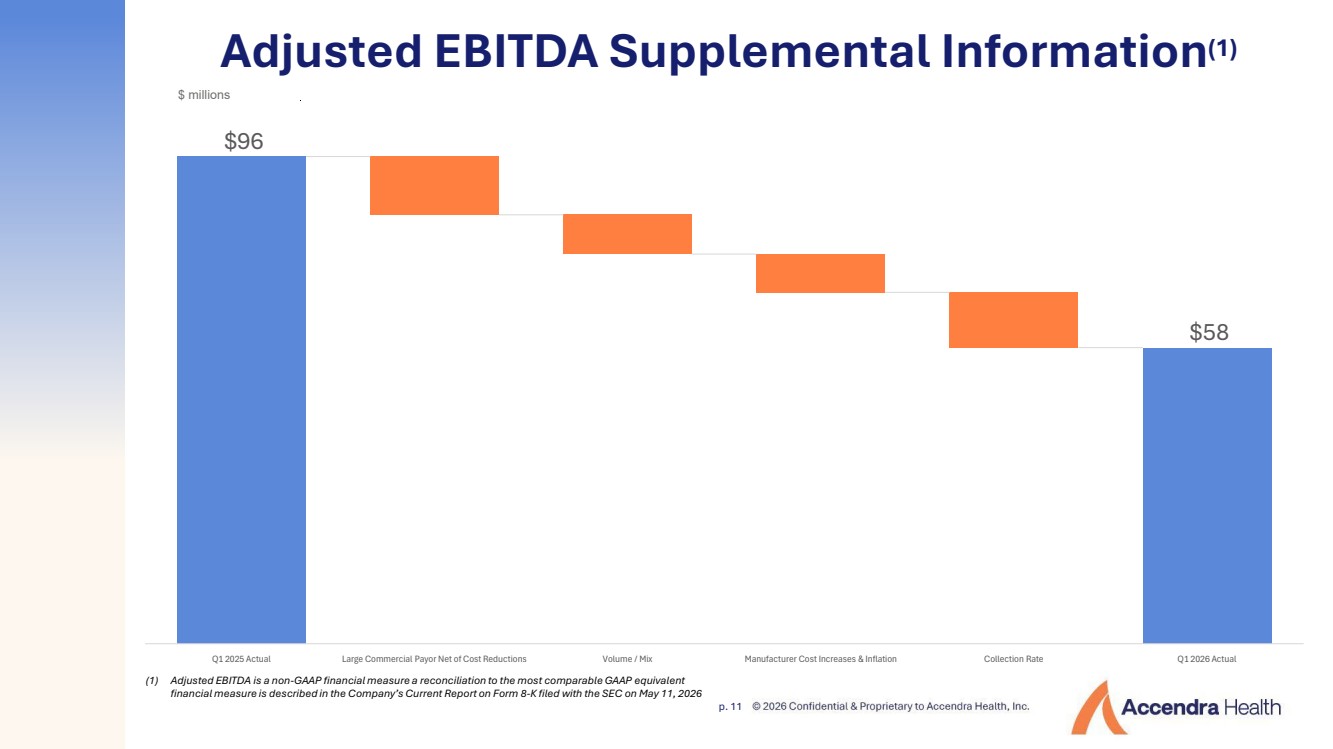
| p. 11 $96 $58 Q1 2025 Actual Large Commercial Payor Net of Cost Reductions Volume / Mix Manufacturer Cost Increases & Inflation Collection Rate Q1 2026 Actual Adjusted EBITDA Supplemental Information(1) $ millions (1) Adjusted EBITDA is a non-GAAP financial measure a reconciliation to the most comparable GAAP equivalent financial measure is described in the Company’s Current Report on Form 8-K filed with the SEC on May 11, 2026 |
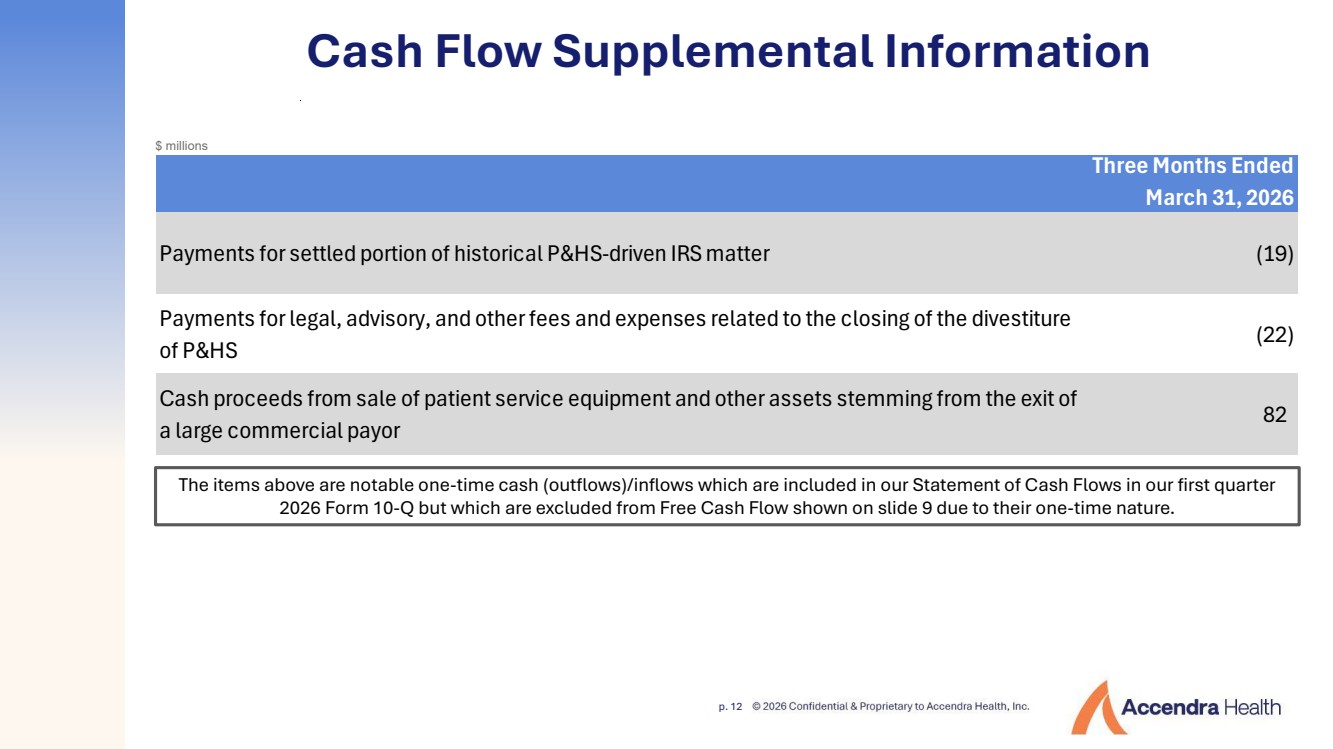
| p. 12 The items above are notable one-time cash (outflows)/inflows which are included in our Statement of Cash Flows in our first quarter 2026 Form 10-Q but which are excluded from Free Cash Flow shown on slide 9 due to their one-time nature. $ millions Cash Flow Supplemental Information Three Months Ended March 31, 2026 Payments for settled portion of historical P&HS-driven IRS matter (19) Payments for legal, advisory, and other fees and expenses related to the closing of the divestiture of P&HS (22) Cash proceeds from sale of patient service equipment and other assets stemming from the exit of a large commercial payor 82 |
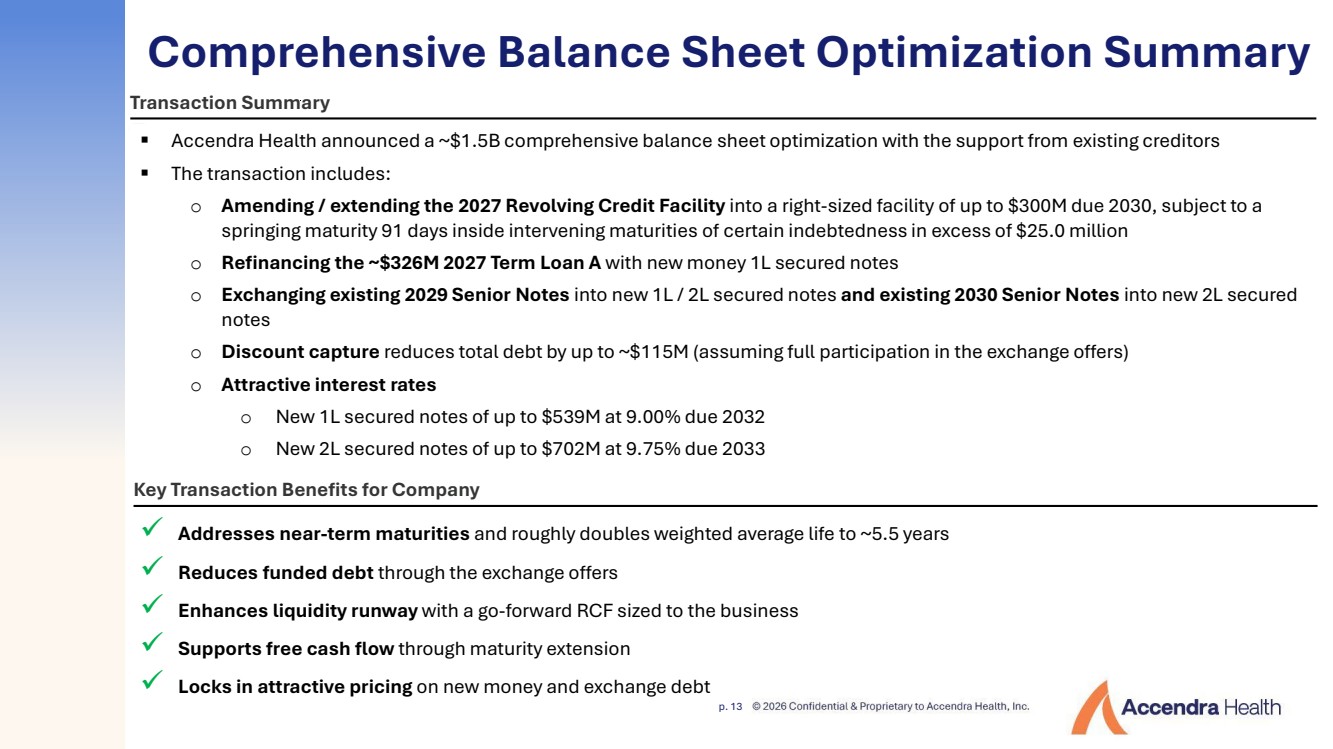
| p. 13 Comprehensive Balance Sheet Optimization Summary Addresses near-term maturities and roughly doubles weighted average life to ~5.5 years Reduces funded debt through the exchange offers Enhances liquidity runway with a go-forward RCF sized to the business Supports free cash flow through maturity extension Locks in attractive pricing on new money and exchange debt Key Transaction Benefits for Company Transaction Summary Accendra Health announced a ~$1.5B comprehensive balance sheet optimization with the support from existing creditors The transaction includes: o Amending / extending the 2027 Revolving Credit Facility into a right-sized facility of up to $300M due 2030, subject to a springing maturity 91 days inside intervening maturities of certain indebtedness in excess of $25.0 million o Refinancing the ~$326M 2027 Term Loan A with new money 1L secured notes o Exchanging existing 2029 Senior Notes into new 1L / 2L secured notes and existing 2030 Senior Notes into new 2L secured notes o Discount capture reduces total debt by up to ~$115M (assuming full participation in the exchange offers) o Attractive interest rates o New 1L secured notes of up to $539M at 9.00% due 2032 o New 2L secured notes of up to $702M at 9.75% due 2033 |
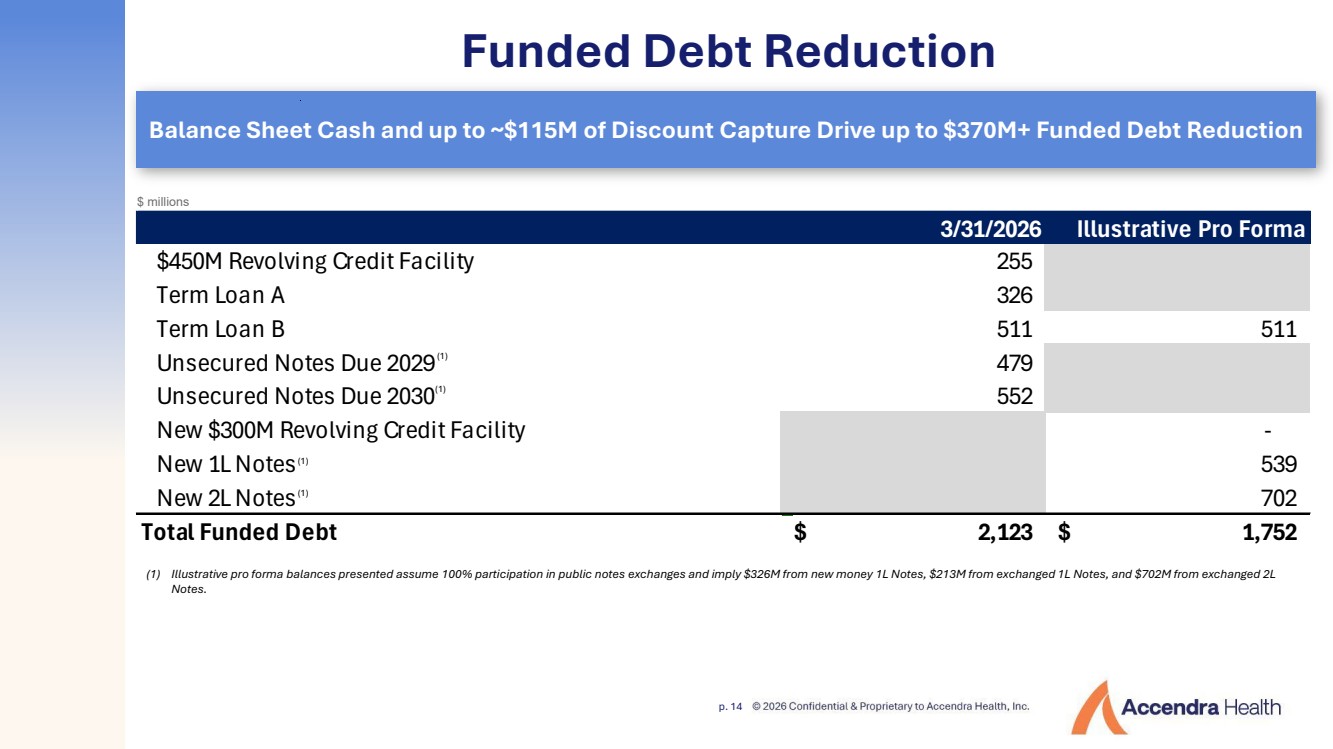
| p. 14 3/31/2026 Illustrative Pro Forma $450M Revolving Credit Facility 255 Term Loan A 326 Term Loan B 511 511 Unsecured Notes Due 2029 479 Unsecured Notes Due 2030 552 New $300M Revolving Credit Facility - New 1L Notes 539 New 2L Notes 702 Total Funded Debt $ 2,123 $ 1,752 Funded Debt Reduction (1) (1) (1) (1) Balance Sheet Cash and up to ~$115M of Discount Capture Drive up to $370M+ Funded Debt Reduction (1) Illustrative pro forma balances presented assume 100% participation in public notes exchanges and imply $326M from new money 1L Notes, $213M from exchanged 1L Notes, and $702M from exchanged 2L Notes. $ millions |
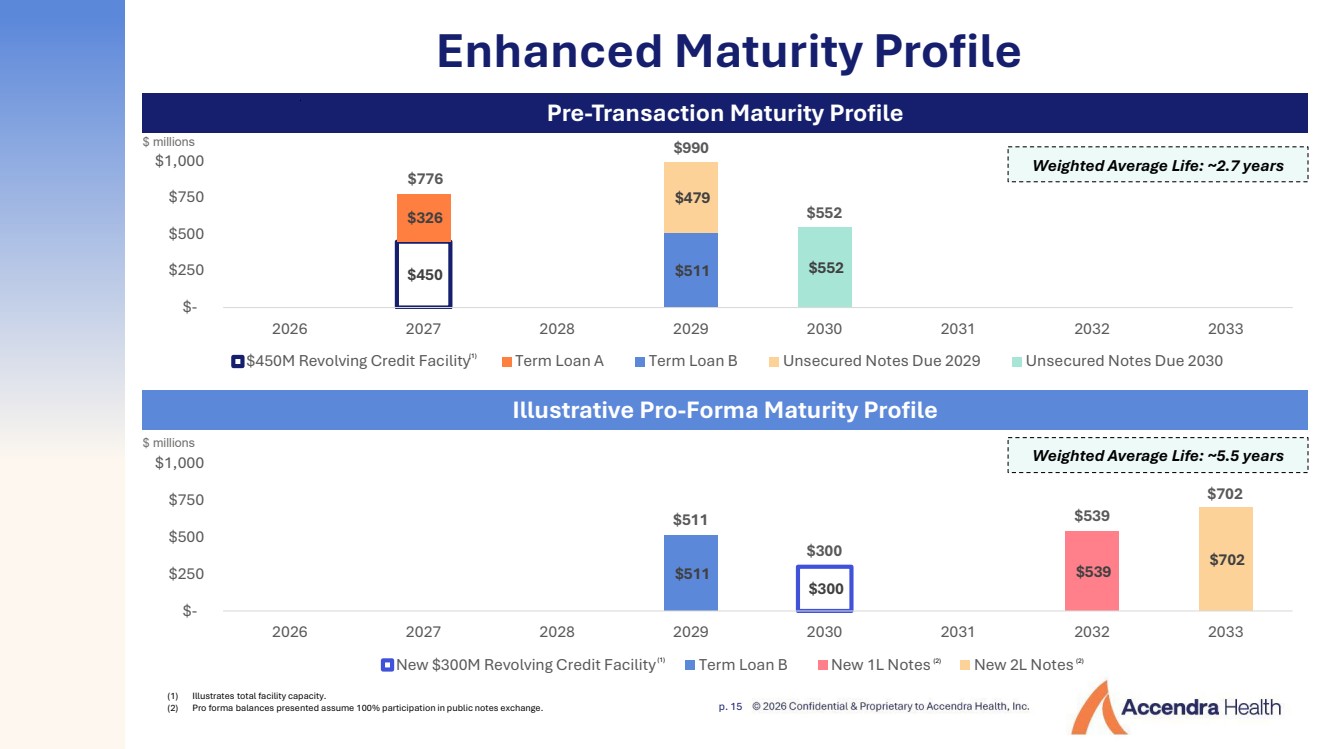
| p. 15 Enhanced Maturity Profile $450 $326 $511 $479 $552 $- $250 $500 $750 $1,000 2026 2027 2028 2029 2030 2031 2032 2033 $450M Revolving Credit Facility Term Loan A Term Loan B Unsecured Notes Due 2029 Unsecured Notes Due 2030 $300 $511 $539 $702 $- $250 $500 $750 $1,000 2026 2027 2028 2029 2030 2031 2032 2033 New $300M Revolving Credit Facility Term Loan B New 1L Notes New 2L Notes (2) Pre-Transaction Maturity Profile Illustrative Pro-Forma Maturity Profile $ millions $ millions (2) Weighted Average Life: ~2.7 years Weighted Average Life: ~5.5 years (1) (1) $511 $300 $539 $702 $990 $776 $552 (1) Illustrates total facility capacity. (2) Pro forma balances presented assume 100% participation in public notes exchange. |
| p. 16 GAAP to Non-GAAP Reconciliations $ millions Net loss, as reported (GAAP) $ (1,101) Loss from discontinued operations, net of tax 998 Income tax provision 1 Interest expense, net 107 Acquisition-related charges and intangible amortization (1) 96 Transaction breakage fee (2) 80 Exit and realignment charges, net (3) 18 Transaction financing fees, net (4) 18 Litigation and related charges (5) 2 Other depreciation and amortization (6) 141 Stock compensation (7) 12 Other (8) 2 Adjusted EBITDA from continuing operations (non-GAAP) 375 Adjusted EBITDA from discontinued operations (non-GAAP) 50 Total Adjusted EBITDA (non-GAAP) $ 424 $ millions Net revenue, as reported (GAAP) $ 2,762 Net revenue from discontinued operations (9) 7,910 Total net revenue (Non-GAAP) $ 10,672 $ millions Net revenue, as reported (GAAP) $ 2,762 Cost of net revenue, as reported (GAAP) 1,473 Gross profit from continuing operations (GAAP) 1,289 Gross profit from discontinued operations (10) 783 Total gross profit (Non-GAAP) $ 2,072 December 31, 2025 Year Ended December 31, 2025 Year Ended December 31, 2025 Year Ended |
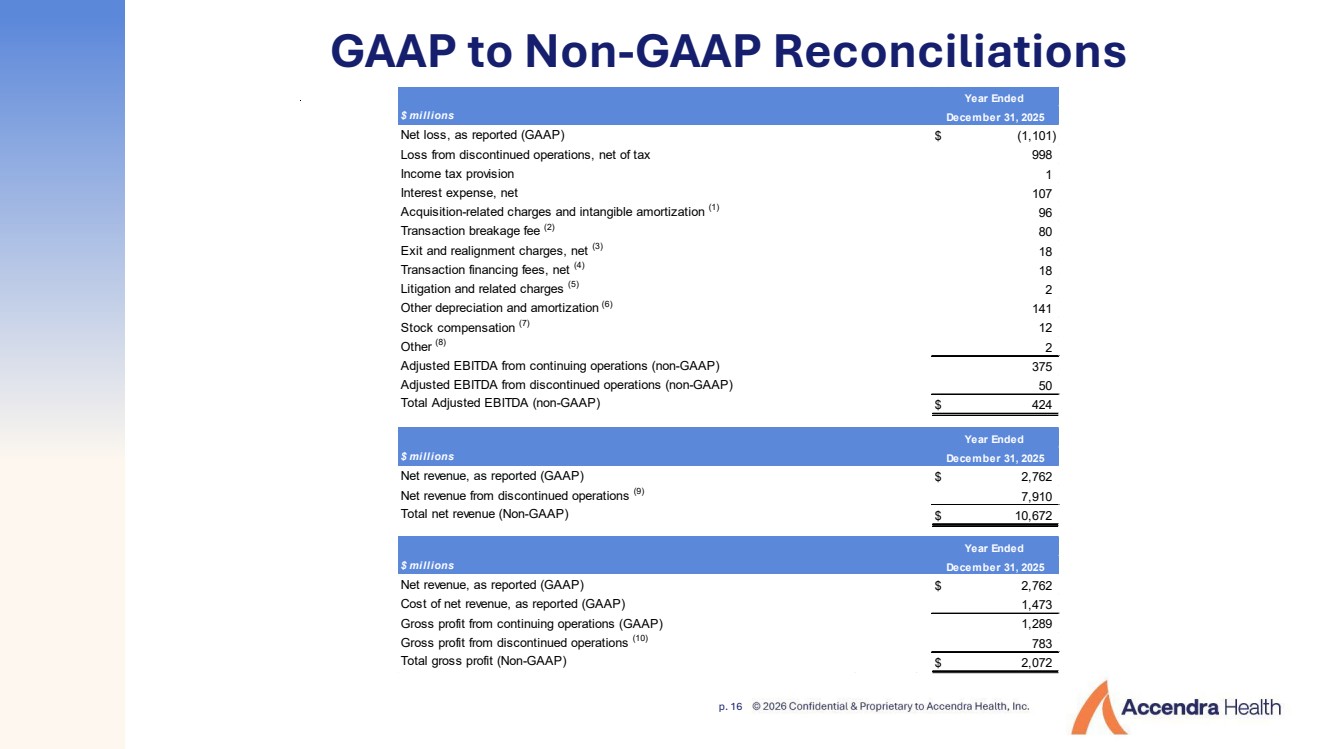
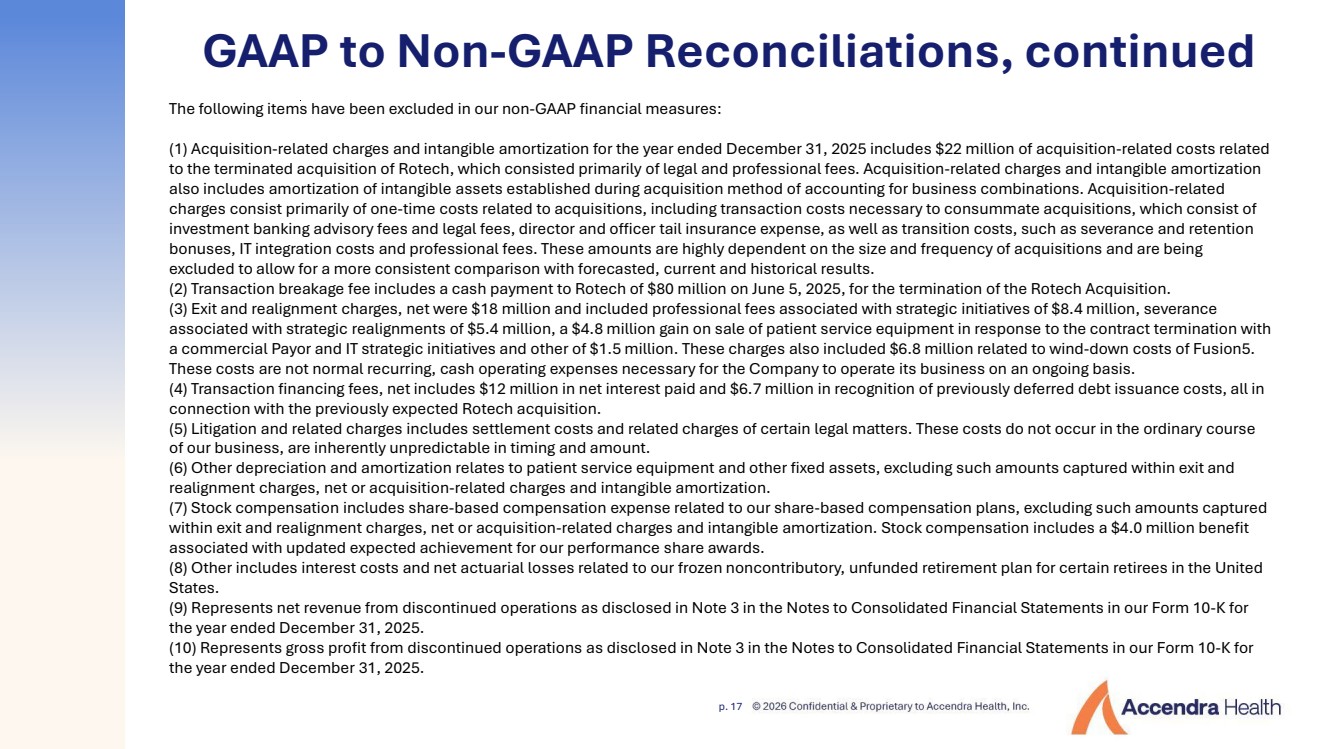
| p. 17 GAAP to Non-GAAP Reconciliations, continued The following items have been excluded in our non-GAAP financial measures: (1) Acquisition-related charges and intangible amortization for the year ended December 31, 2025 includes $22 million of acquisition-related costs related to the terminated acquisition of Rotech, which consisted primarily of legal and professional fees. Acquisition-related charges and intangible amortization also includes amortization of intangible assets established during acquisition method of accounting for business combinations. Acquisition-related charges consist primarily of one-time costs related to acquisitions, including transaction costs necessary to consummate acquisitions, which consist of investment banking advisory fees and legal fees, director and officer tail insurance expense, as well as transition costs, such as severance and retention bonuses, IT integration costs and professional fees. These amounts are highly dependent on the size and frequency of acquisitions and are being excluded to allow for a more consistent comparison with forecasted, current and historical results. (2) Transaction breakage fee includes a cash payment to Rotech of $80 million on June 5, 2025, for the termination of the Rotech Acquisition. (3) Exit and realignment charges, net were $18 million and included professional fees associated with strategic initiatives of $8.4 million, severance associated with strategic realignments of $5.4 million, a $4.8 million gain on sale of patient service equipment in response to the contract termination with a commercial Payor and IT strategic initiatives and other of $1.5 million. These charges also included $6.8 million related to wind-down costs of Fusion5. These costs are not normal recurring, cash operating expenses necessary for the Company to operate its business on an ongoing basis. (4) Transaction financing fees, net includes $12 million in net interest paid and $6.7 million in recognition of previously deferred debt issuance costs, all in connection with the previously expected Rotech acquisition. (5) Litigation and related charges includes settlement costs and related charges of certain legal matters. These costs do not occur in the ordinary course of our business, are inherently unpredictable in timing and amount. (6) Other depreciation and amortization relates to patient service equipment and other fixed assets, excluding such amounts captured within exit and realignment charges, net or acquisition-related charges and intangible amortization. (7) Stock compensation includes share-based compensation expense related to our share-based compensation plans, excluding such amounts captured within exit and realignment charges, net or acquisition-related charges and intangible amortization. Stock compensation includes a $4.0 million benefit associated with updated expected achievement for our performance share awards. (8) Other includes interest costs and net actuarial losses related to our frozen noncontributory, unfunded retirement plan for certain retirees in the United States. (9) Represents net revenue from discontinued operations as disclosed in Note 3 in the Notes to Consolidated Financial Statements in our Form 10-K for the year ended December 31, 2025. (10) Represents gross profit from discontinued operations as disclosed in Note 3 in the Notes to Consolidated Financial Statements in our Form 10-K for the year ended December 31, 2025. |