v3.26.1
Pay vs Performance Disclosure - USD ($)
12 Months Ended
Dec. 31, 2025
Dec. 31, 2024
Dec. 31, 2023
Pay vs Performance Disclosure [Table]      
Pay vs Performance [Table Text Block]
Year 

Summary

Compensation

Table for PEO

(Luther)

(US$)(1)(2)


Compensation

Actually Paid

to PEO

(Luther)

(US$)(2)(5)(6)


Summary

Compensation

Table for PEO

(Angel)

(US$)(1)(3)


Compensation

Actually Paid

to PEO

(Angel)

(US$)(3)(5)(6)


Average

Summary

Compensation

Table Total

for

NON-PEOs

(US$)(1)(4)


Average

Compensation

Actually Paid

to Non-PEO

(US$)(4)(5)(6)


Value of

Initial Fixed

$100

Investment

Based on:

Total

Shareholder

Return

(US$)


GAAP Net

Loss

(US$)(in

thousands)

 
2025  $888,813   $401,410   $-   $-   $385,198   $336,849   $0.02   $(14,084)
                                         
2024  $3,061,818   $784,000   $-   $-   $396,198   $296,209   $0.07   $(44,539)
                                         
2023  $-   $-   $824,680   $591,976   $333,996   $328,318   $0.42   $(21,668)
   
Named Executive Officers, Footnote [Text Block]


  (2) Mr. Luther was appointed our President and Chief Executive Officer (PEO) on January 1, 2024 and to our board of directors effective January 1, 2024.
     
  (3) Dr. Angel resigned as our Chief Executive Officer and President effective December 31, 2023.
     
  (4) The non-PEO NEO in the 2025 fiscal year and 2024 fiscal year was Ms. Gurrola The non-PEO NEOs in the 2023 fiscal year were Ms. Gurrola and Mr. Andrew Jackson.
   
Non-PEO NEO Average Total Compensation Amount [1],[2] $ 385,198 $ 396,198 $ 333,996
Non-PEO NEO Average Compensation Actually Paid Amount [2],[3],[4] $ 336,849 296,209 328,318
Adjustment to Non-PEO NEO Compensation Footnote [Text Block]


PEO

(Mr.

Luther)


Average

of

Other

Non-PEO

NEOs


PEO

(Mr.

Luther)


Average

of

Other

Non-PEO

NEOs


PEO

(Dr.

Angel)


Average of

Other

Non-PEO

NEOs

 
   2025   2024   2023 
  

PEO

(Mr.

Luther)


Average

of

Other

Non-PEO

NEOs


PEO

(Mr.

Luther)


Average

of

Other

Non-PEO

NEOs


PEO

(Dr.

Angel)


Average of

Other

Non-PEO

NEOs


Total Compensation from SCT  $888,813   $385,198   $3,061,818   $396,198   $824,680   $333,996 
                               
Subtractions:                              
SCT Value of Stock and Option Awards   324,813    43,372    2,422,818    110,198    461,680    - 
                               
Adjustments:                              
Addition: Fair value at covered year-end of awards granted during the covered fiscal year that are outstanding and unvested at covered year-end   50,394    6,730    145,000    11,583    -    - 
                               
Addition: Fair value at vest date of awards granted and vested during the covered fiscal year   -    -    -    -    394,732    - 
                               
Addition (Subtraction):                              
Year-over-year change in fair value of awards granted in any prior fiscal year that are outstanding and unvested at covered year end   (83,044)   (4,545)   -    (144)   -    (685)
                               
Addition (Subtraction):                              
Change as of the vesting date (from the end of the prior fiscal year) in fair value of awards granted in any prior fiscal year for which all vesting conditions were satisfied at the end of or during the covered fiscal year   (129,940)   (7,162)   -    (1,229)   (12,449)   (390)
                               
(Subtraction): Fair value at end of prior year of awards granted in any prior fiscal year that fail to meet the applicable vesting conditions during the covered fiscal year   -    -    -    -    (153,307)   (4,603)
                               
Total adjustments for equity awards   (162,590)   (4,977)   145,000    10,209    228,976    (5,678)
                               
Compensation Actually Paid (as calculated)  $401,410   $336,849   $784,000   $296,209   $591,976   $328,318 
   
Compensation Actually Paid vs. Total Shareholder Return [Text Block]


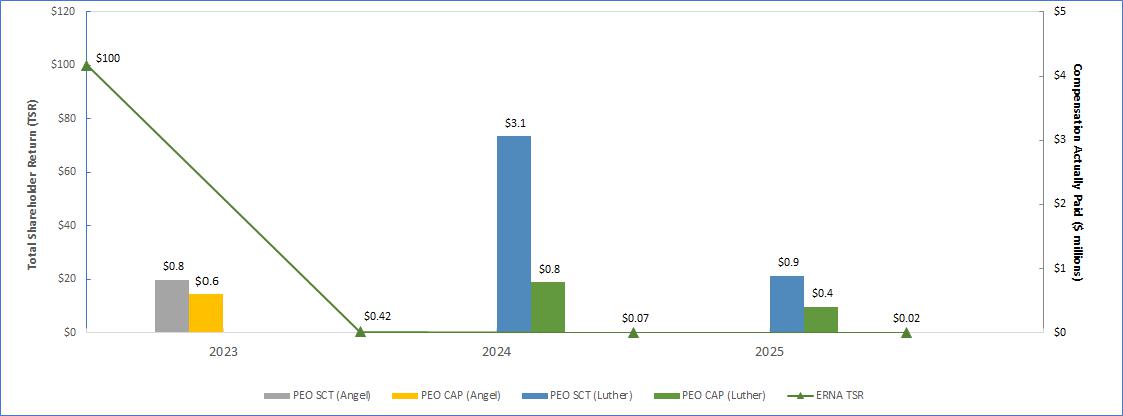
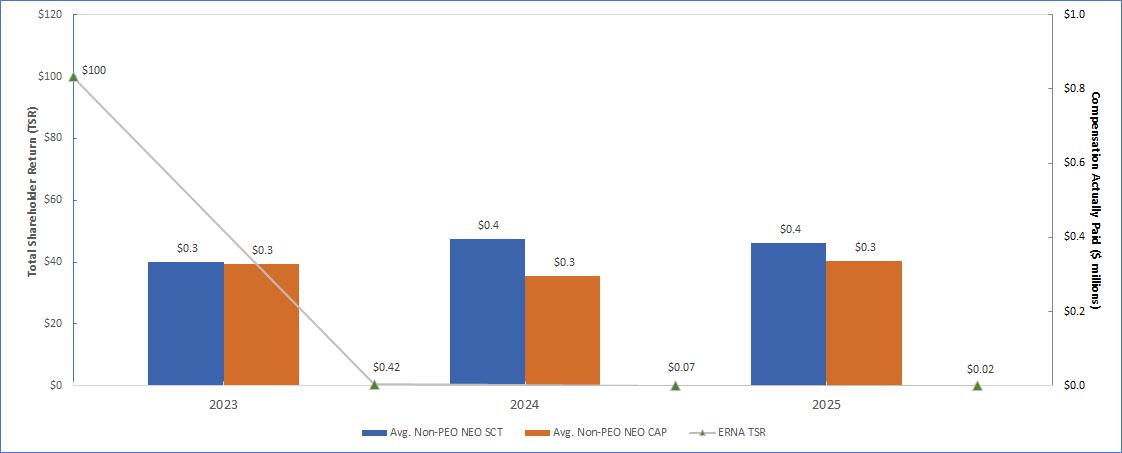
Relationship between CAP and TSR


The graphs below reflect the relationship between the PEO and average non-PEO NEO CAP and the Company’s cumulative indexed Total Shareholder Return (“TSR”) (assuming an initial fixed investment of $100) for the 2025, 2024 and 2023 fiscal years:


PEO CAP vs TSR (January 1, 2023 – December 31, 2025)


Average Other NEO CAP vs TSR (January 1, 2023 – December 31, 2025)


Compensation Actually Paid vs. Net Income [Text Block]


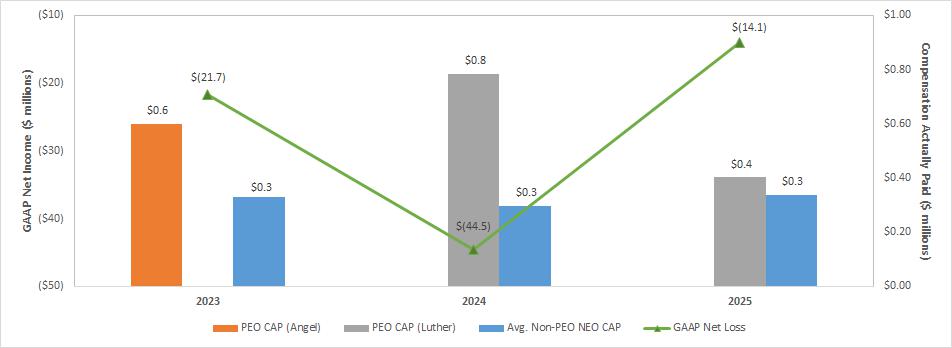
Relationship Between CAP and Net Income (GAAP)


The graph below reflects the relationship between the PEO and average non-PEO NEO CAP and the Company’s net income for the applicable reporting year. As a pre-commercial biotechnology company, we do not tie executive compensation to net income performance, and we do not have other financial metrics that are used to determine executive compensation. See the “—Narrative to Summary Compensation Table” for more information regarding how we compensate our NEOs.


Total Shareholder Return Amount $ 0.02 0.07 0.42
Net Income (Loss) Attributable to Parent $ (14,084,000) $ (44,539,000) $ (21,668,000)
PEO Name Mr. Luther Mr. Luther Mr. Luther
Mr. Luther [Member]      
Pay vs Performance Disclosure [Table]      
Total Compensation from SCT [1],[5] $ 888,813 $ 3,061,818
Compensation Actually Paid (as calculated) [3],[4],[5] 401,410 784,000
Total adjustments for equity awards (162,590) 145,000  
Mr. Luther [Member] | SCT Value of Stock and Option Awards [Member]      
Pay vs Performance Disclosure [Table]      
Total adjustments for equity awards 324,813 2,422,818  
Mr. Luther [Member] | Fair Value at Covered Year-End of Awards Granted During the Covered Fiscal Year that are Outstanding and Unvested at Covered Year-End [Member]      
Pay vs Performance Disclosure [Table]      
Total adjustments for equity awards 50,394 145,000  
Mr. Luther [Member] | Fair Value at Vest Date of Awards Granted and Vested During the Covered Fiscal Year [Member]      
Pay vs Performance Disclosure [Table]      
Total adjustments for equity awards  
Mr. Luther [Member] | Year-Over-Year Change in Fair Value of Awards Granted in any Prior Fiscal Year that are Outstanding and Unvested at Covered Year End [Member]      
Pay vs Performance Disclosure [Table]      
Total adjustments for equity awards (83,044)  
Mr. Luther [Member] | Change as of the Vesting Date (From the End of the Prior Fiscal Year) in Fair Value of Awards Granted in any Prior Fiscal Year for Which All Vesting Conditions were Satisfied at the End of or During the Covered Fiscal Year [Member]      
Pay vs Performance Disclosure [Table]      
Total adjustments for equity awards (129,940)  
Mr. Luther [Member] | Fair Value at End of Prior Year of Awards Granted in any Prior Fiscal Year that Fail to Meet the Applicable Vesting Conditions During the Covered Fiscal Year [Member]      
Pay vs Performance Disclosure [Table]      
Total adjustments for equity awards  
Dr. Angel [Member]      
Pay vs Performance Disclosure [Table]      
Total Compensation from SCT [1],[6] 824,680
Compensation Actually Paid (as calculated) [3],[4],[6] 591,976
Total adjustments for equity awards     228,976
Dr. Angel [Member] | SCT Value of Stock and Option Awards [Member]      
Pay vs Performance Disclosure [Table]      
Total adjustments for equity awards     461,680
Dr. Angel [Member] | Fair Value at Covered Year-End of Awards Granted During the Covered Fiscal Year that are Outstanding and Unvested at Covered Year-End [Member]      
Pay vs Performance Disclosure [Table]      
Total adjustments for equity awards    
Dr. Angel [Member] | Fair Value at Vest Date of Awards Granted and Vested During the Covered Fiscal Year [Member]      
Pay vs Performance Disclosure [Table]      
Total adjustments for equity awards     394,732
Dr. Angel [Member] | Year-Over-Year Change in Fair Value of Awards Granted in any Prior Fiscal Year that are Outstanding and Unvested at Covered Year End [Member]      
Pay vs Performance Disclosure [Table]      
Total adjustments for equity awards    
Dr. Angel [Member] | Change as of the Vesting Date (From the End of the Prior Fiscal Year) in Fair Value of Awards Granted in any Prior Fiscal Year for Which All Vesting Conditions were Satisfied at the End of or During the Covered Fiscal Year [Member]      
Pay vs Performance Disclosure [Table]      
Total adjustments for equity awards     (12,449)
Dr. Angel [Member] | Fair Value at End of Prior Year of Awards Granted in any Prior Fiscal Year that Fail to Meet the Applicable Vesting Conditions During the Covered Fiscal Year [Member]      
Pay vs Performance Disclosure [Table]      
Total adjustments for equity awards     (153,307)
Non-PEO NEO [Member]      
Pay vs Performance Disclosure [Table]      
Total Compensation from SCT 385,198 396,198 333,996
Compensation Actually Paid (as calculated) 336,849 296,209 328,318
Total adjustments for equity awards (4,977) 10,209 (5,678)
Non-PEO NEO [Member] | SCT Value of Stock and Option Awards [Member]      
Pay vs Performance Disclosure [Table]      
Total adjustments for equity awards 43,372 110,198
Non-PEO NEO [Member] | Fair Value at Covered Year-End of Awards Granted During the Covered Fiscal Year that are Outstanding and Unvested at Covered Year-End [Member]      
Pay vs Performance Disclosure [Table]      
Total adjustments for equity awards 6,730 11,583
Non-PEO NEO [Member] | Fair Value at Vest Date of Awards Granted and Vested During the Covered Fiscal Year [Member]      
Pay vs Performance Disclosure [Table]      
Total adjustments for equity awards
Non-PEO NEO [Member] | Year-Over-Year Change in Fair Value of Awards Granted in any Prior Fiscal Year that are Outstanding and Unvested at Covered Year End [Member]      
Pay vs Performance Disclosure [Table]      
Total adjustments for equity awards (4,545) (144) (685)
Non-PEO NEO [Member] | Change as of the Vesting Date (From the End of the Prior Fiscal Year) in Fair Value of Awards Granted in any Prior Fiscal Year for Which All Vesting Conditions were Satisfied at the End of or During the Covered Fiscal Year [Member]      
Pay vs Performance Disclosure [Table]      
Total adjustments for equity awards (7,162) (1,229) (390)
Non-PEO NEO [Member] | Fair Value at End of Prior Year of Awards Granted in any Prior Fiscal Year that Fail to Meet the Applicable Vesting Conditions During the Covered Fiscal Year [Member]      
Pay vs Performance Disclosure [Table]      
Total adjustments for equity awards $ (4,603)
[1] The Summary Compensation Table (“SCT”) numbers include the values as reported in this proxy statement for fiscal years 2025 and 2024 and as reported in the proxy statement filed on May 5, 2023 for the fiscal year.
[2] The non-PEO NEO in the 2025 fiscal year and 2024 fiscal year was Ms. Gurrola The non-PEO NEOs in the 2023 fiscal year were Ms. Gurrola and Mr. Andrew Jackson.
[3] SEC rules require certain adjustments be made to the SCT total compensation to determine CAP as reported in the Pay Versus Performance Table above. CAP does not represent cash and/or equity value transferred to the applicable NEO without restriction, but rather is a value calculated under applicable SEC rules. Generally, CAP is calculated as SCT total compensation adjusted to include the fair market value of equity awards as of the applicable fiscal year end, or, if earlier, the vesting date (rather than the grant date). NEOs do not participate in a defined benefit plan, so no adjustment for pension benefits is included in the table below. The following table details these adjustments:
[4] The tables below illustrate the valuation assumptions as of the vesting date for awards that vested in the 2025 fiscal year, the 2024 the fiscal year and the 2023 fiscal year computed in a manner consistent with the fair value methodology used to account for stock-based compensation in our Consolidated Financial Statements contained in the applicable Annual Report on Form 10-K filed with the SEC. For a description of such valuation assumptions, see Note 14, Stock-Based Compensation, in the Notes to the Consolidated Financial Statements contained in our Annual Report on Form 10-K filed with the SEC on March 13, 2026.
[5] Mr. Luther was appointed our President and Chief Executive Officer (PEO) on January 1, 2024 and to our board of directors effective January 1, 2024.
[6] Dr. Angel resigned as our Chief Executive Officer and President effective December 31, 2023.