Pay vs Performance Disclosure - USD ($)
|
12 Months Ended |
Dec. 31, 2025 |
Dec. 31, 2024 |
Dec. 31, 2023 |
Dec. 31, 2022 |
Dec. 31, 2021 |
| Pay vs Performance Disclosure |
|
|
|
|
|
| Pay vs Performance Disclosure, Table |
PAY VERSUS PERFORMANCE
|
|
|
|
|
|
|
|
|
|
|
|
|
|
|
|
|
|
|
|
|
|
|
|
|
|
|
Value of Initial Fixed $100 Investment Based On: |
|
|
|
|
Year |
|
Summary Compensation for Mark Fogel(1) |
|
Compensation Actually Paid to Mark Fogel(1) |
|
Average Summary Compensation Total to NEOs(2) |
|
Average Compensation Actually Paid to NEOs(3) |
|
ACR Total Shareholder Return(4) |
|
Peer Group Total Shareholder Return(5) |
|
Net Income (Loss) (in thousands)(6) |
|
Earnings Available for Distribution allocable to common shares (in thousands)(7) |
2025 |
|
$— |
|
$— |
|
$420,124 |
|
$420,124 |
|
$178.28 |
|
$123.88 |
|
$27,976 |
|
$(1,869) |
2024 |
|
— |
|
— |
|
413,670 |
|
413,670 |
|
134.92 |
|
121.85 |
|
28,695 |
|
10,941 |
2023 |
|
— |
|
— |
|
459,492 |
|
459,492 |
|
80.37 |
|
116.79 |
|
21,848 |
|
20,565 |
2022 |
|
— |
|
— |
|
385,345 |
|
385,345 |
|
69.01 |
|
104.76 |
|
10,426 |
|
10,384 |
2021 |
|
— |
|
— |
|
521,386 |
|
521,386 |
|
104.18 |
|
139.88 |
|
33,923 |
|
(457) |
(1)The dollar amounts reported in these columns are the amounts of total compensation reported and actually paid for our Chief Executive Officer (the “PEO”) for each corresponding year, as reported in the “Total” column of the Summary Compensation Table. Mr. Fogel did not receive any compensation directly from the Company as he is compensated by the Manager as discussed above. (2)These amounts reflect the average total compensation reported for the Company’s named executive officers (“NEOs”) as a group (excluding Mr. Fogel) in the “Total” column of the Summary Compensation Table in each applicable year. The names of each of the NEOs (excluding Mr. Fogel) included for purposes of calculating the average amounts in each applicable year are as follows: (i) for 2025 and 2024, Mr. Blackwell, Ms. Jesberger and Ms. Kilpatrick; and (ii) for 2023, 2022 and 2021, Mr. Bryant (former Chief Financial Officer), Ms. Jesberger and Mr. Blackwell. (3)There were no equity awards granted for any of the periods presented. (4)Total Shareholder Return ("TSR") is calculated by dividing (a) the sum of the cumulative amount of dividends for the measurement period, assuming dividend reinvestment in the security, and the difference between the Company’s share price at the end and the beginning of the measurement period by (b) the Company’s share price at the beginning of the measurement period. (5)The peer group used for this purpose is the FTSE Nareit All REITs, which we also use for purposes of the stock performance graph required by Item 201(e) of Regulation S-K included in our Annual Report for the year ended December 31, 2025. The Total Shareholder Return is calculated using the same methodology described above in footnote 4. (6)Amounts reported represented the amount of net income reflected in the Company's audited consolidated financial statements for the applicable year. (7)For purposes of Item 402(v) of Regulation S-K, we have identified Earnings Available for Distribution ("EAD") as our Company-Selected Metric. EAD is a non-GAAP financial measure that the Company uses to evaluate its operating performance. EAD, for reporting purposes, is defined as GAAP net income (loss) allocable to common shares, excluding (i) non-cash equity compensation expense, (ii) unrealized gains and losses, (iii) non-cash provisions for loan losses, (iv) non-cash impairments on securities, (v) non-cash amortization of discounts or premiums associated with borrowings, (vi) net income or loss from a limited partnership interest owned at the initial measurement date, (vii) net income or loss from non-core assets, (viii) real estate depreciation and amortization, (ix) foreign currency gains or losses and (x) income or loss from discontinued operations. EAD may also be adjusted periodically to exclude certain one-time events pursuant to changes in GAAP and certain non-cash items.
|
|
|
|
|
| Company Selected Measure Name |
Earnings Available for Distribution ("EAD")
|
|
|
|
|
| Named Executive Officers, Footnote |
(2)These amounts reflect the average total compensation reported for the Company’s named executive officers (“NEOs”) as a group (excluding Mr. Fogel) in the “Total” column of the Summary Compensation Table in each applicable year. The names of each of the NEOs (excluding Mr. Fogel) included for purposes of calculating the average amounts in each applicable year are as follows: (i) for 2025 and 2024, Mr. Blackwell, Ms. Jesberger and Ms. Kilpatrick; and (ii) for 2023, 2022 and 2021, Mr. Bryant (former Chief Financial Officer), Ms. Jesberger and Mr. Blackwell.
|
|
|
|
|
| Peer Group Issuers, Footnote |
The peer group used for this purpose is the FTSE Nareit All REITs, which we also use for purposes of the stock performance graph required by Item 201(e) of Regulation S-K included in our Annual Report for the year ended December 31, 2025. The Total Shareholder Return is calculated using the same methodology described above in footnote 4.
|
|
|
|
|
| Non-PEO NEO Average Total Compensation Amount |
$ 420,124
|
$ 413,670
|
$ 459,492
|
$ 385,345
|
$ 521,386
|
| Non-PEO NEO Average Compensation Actually Paid Amount |
$ 420,124
|
413,670
|
459,492
|
385,345
|
521,386
|
| Compensation Actually Paid vs. Total Shareholder Return |
Compensation Actually Paid vs. TSR Performance $600,000 $160 $500,000 $140 $400,000 $120 $300,000 $100 $80 $200,000 $60 $100,000 $40 $20 $0 $0 ($100,000) ($20) ($200,000) ($40) Compensation Actually Paid Total Shareholder Return ($100 Investment) 200 2021 2022 Compensation Actually Paid to PEOs Average compensation Actually Paid to NEOs ACR TSR Peer Group TSR 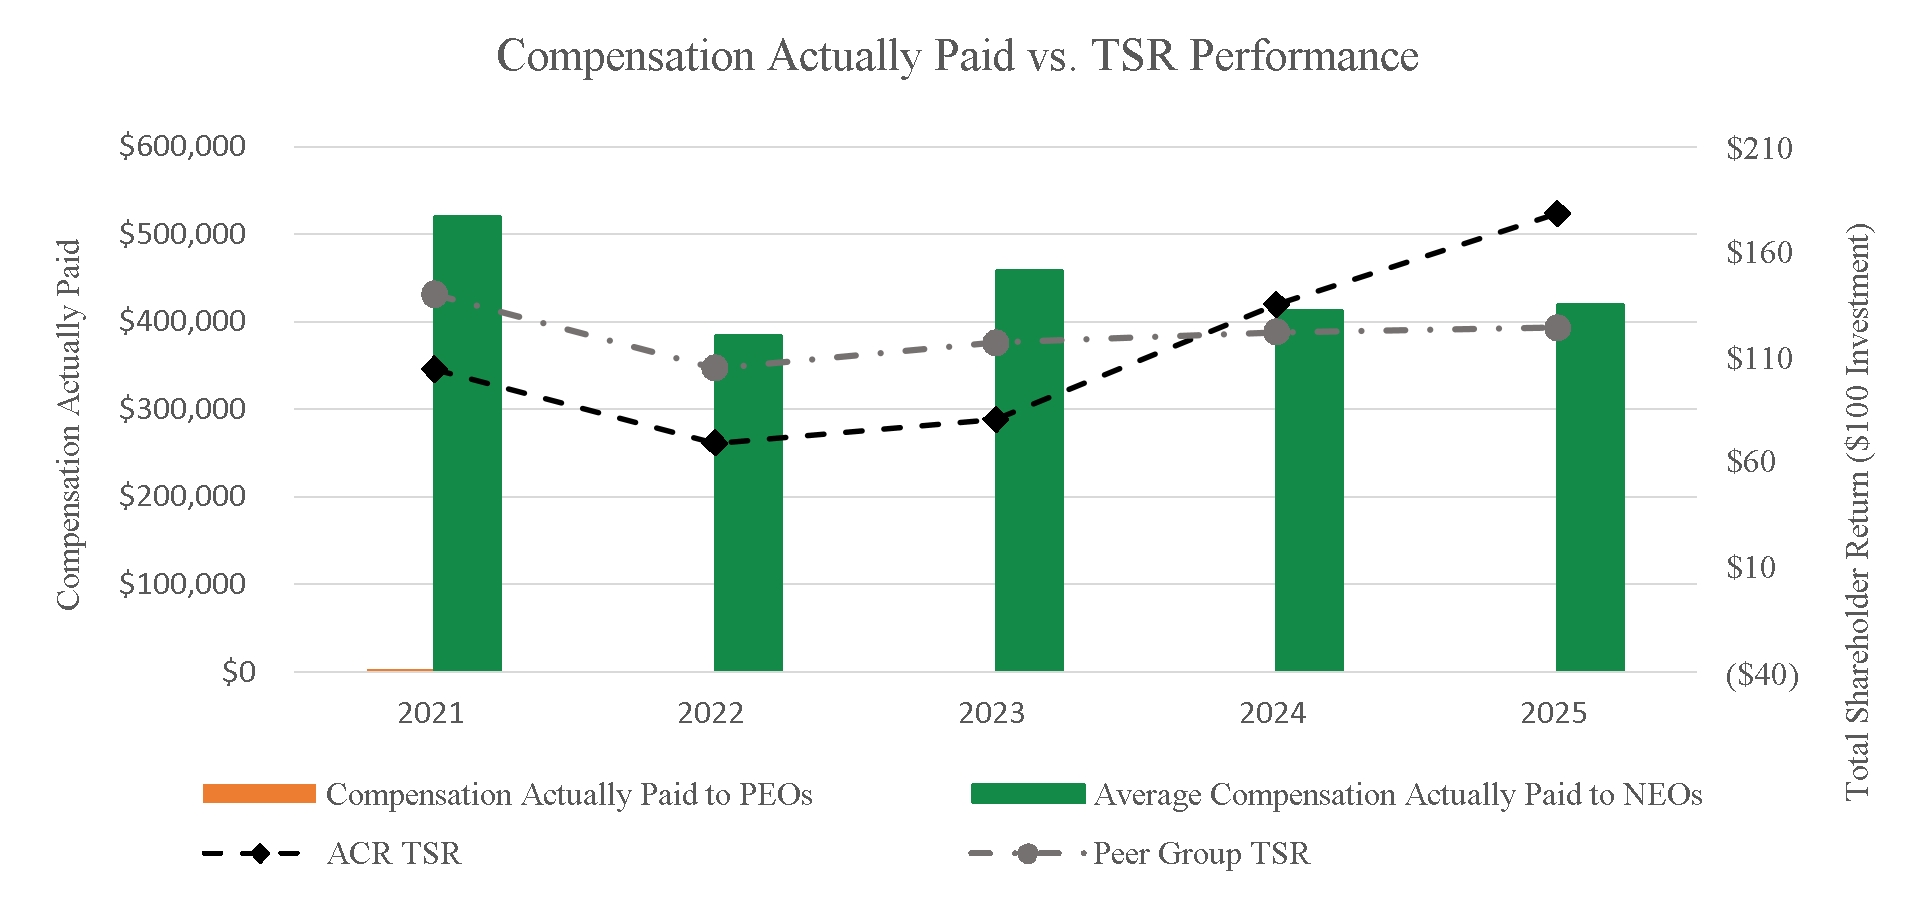
|
|
|
|
|
| Compensation Actually Paid vs. Net Income |
Compensation Actually Paid vs. Net Income $600,000 $50,000 $500,000 $0 $400,000 $300,000 $($50,000) $200,000 ($100,000) $100,000 ($150,000) $0 ($100,000) ($200,000) ($200,000) ($250,000) 2020 2021 2022 Compensation Actually Paid Net Income (in thousands) Compensation Actually Paid to PEOs Average Compensation Actually Paid to NEOs Net Income 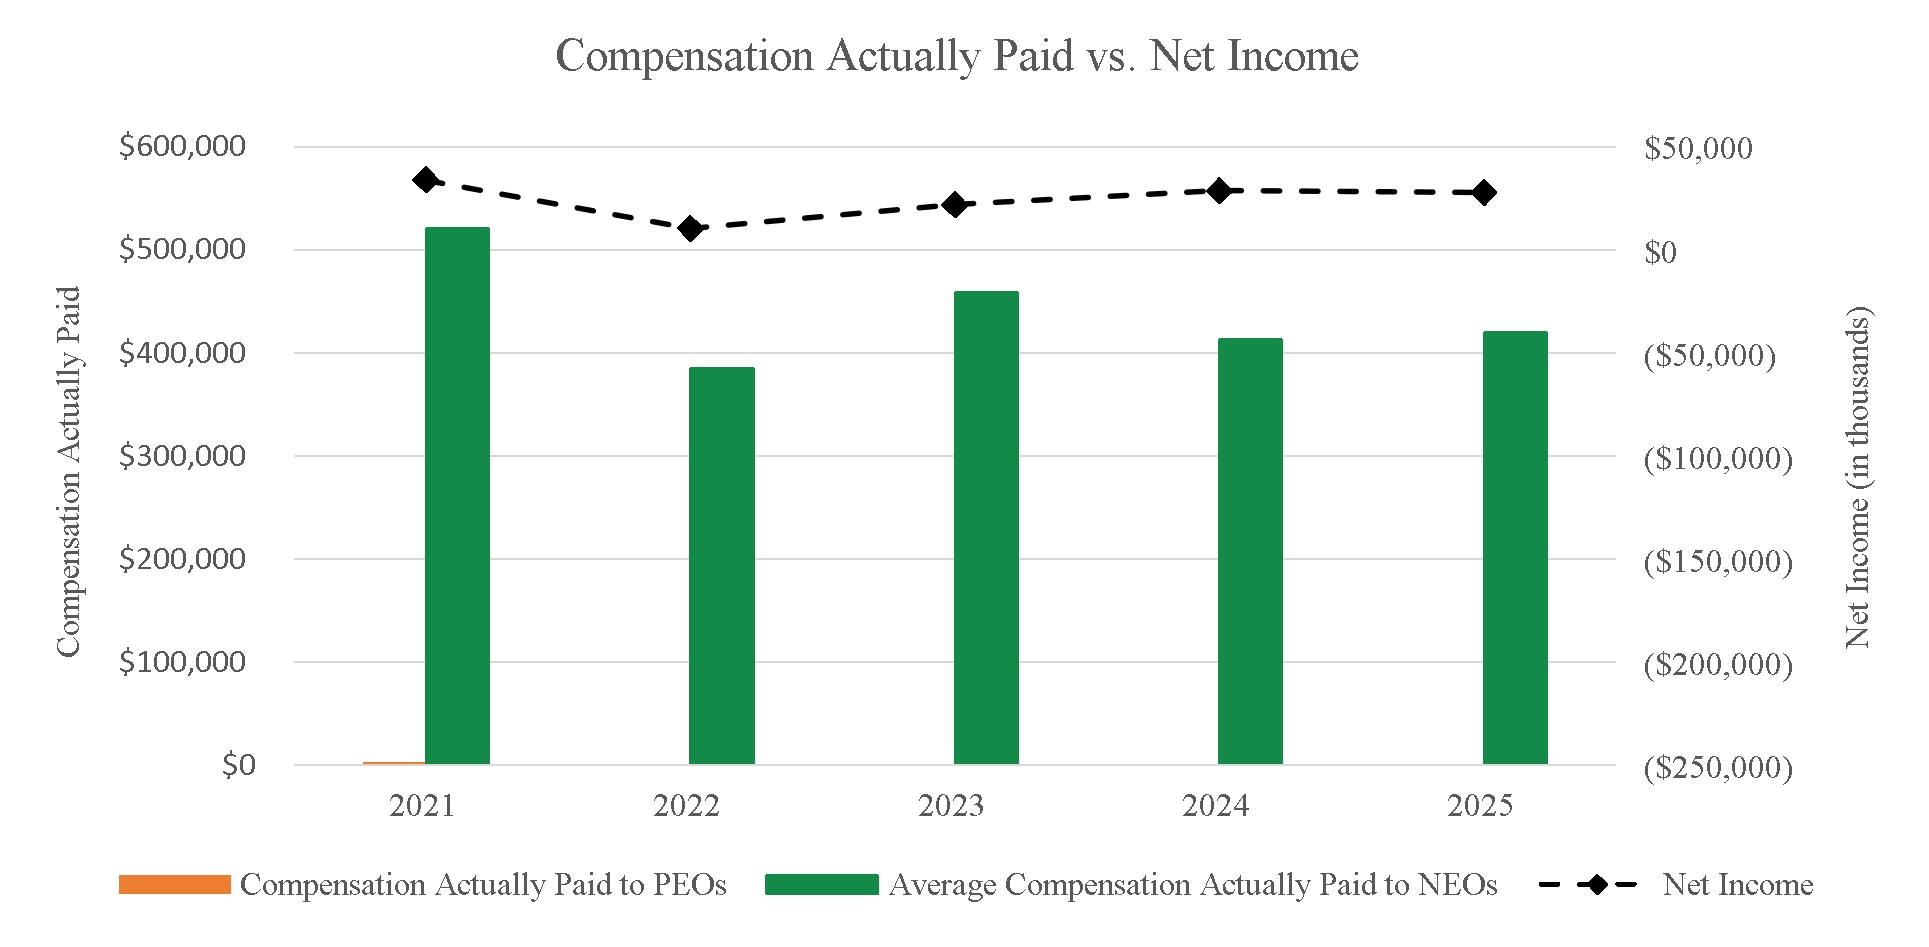
|
|
|
|
|
| Compensation Actually Paid vs. Company Selected Measure |
Compensation Actually Paid vs. EAD $600,000 $50,000 $500,000 $0 $400,000 $300,000 ($50,000) $200,000 ($100,000) $100,000 ($150,000) $0 ($100,000) ($200,000) ($200,000) ($250,000) 2020 2021 2022 Compensation Actually Paid EAD (in thousands) Compensation Actually Paid to PEOs Average Compensation Actually Paid to NEOs EAD 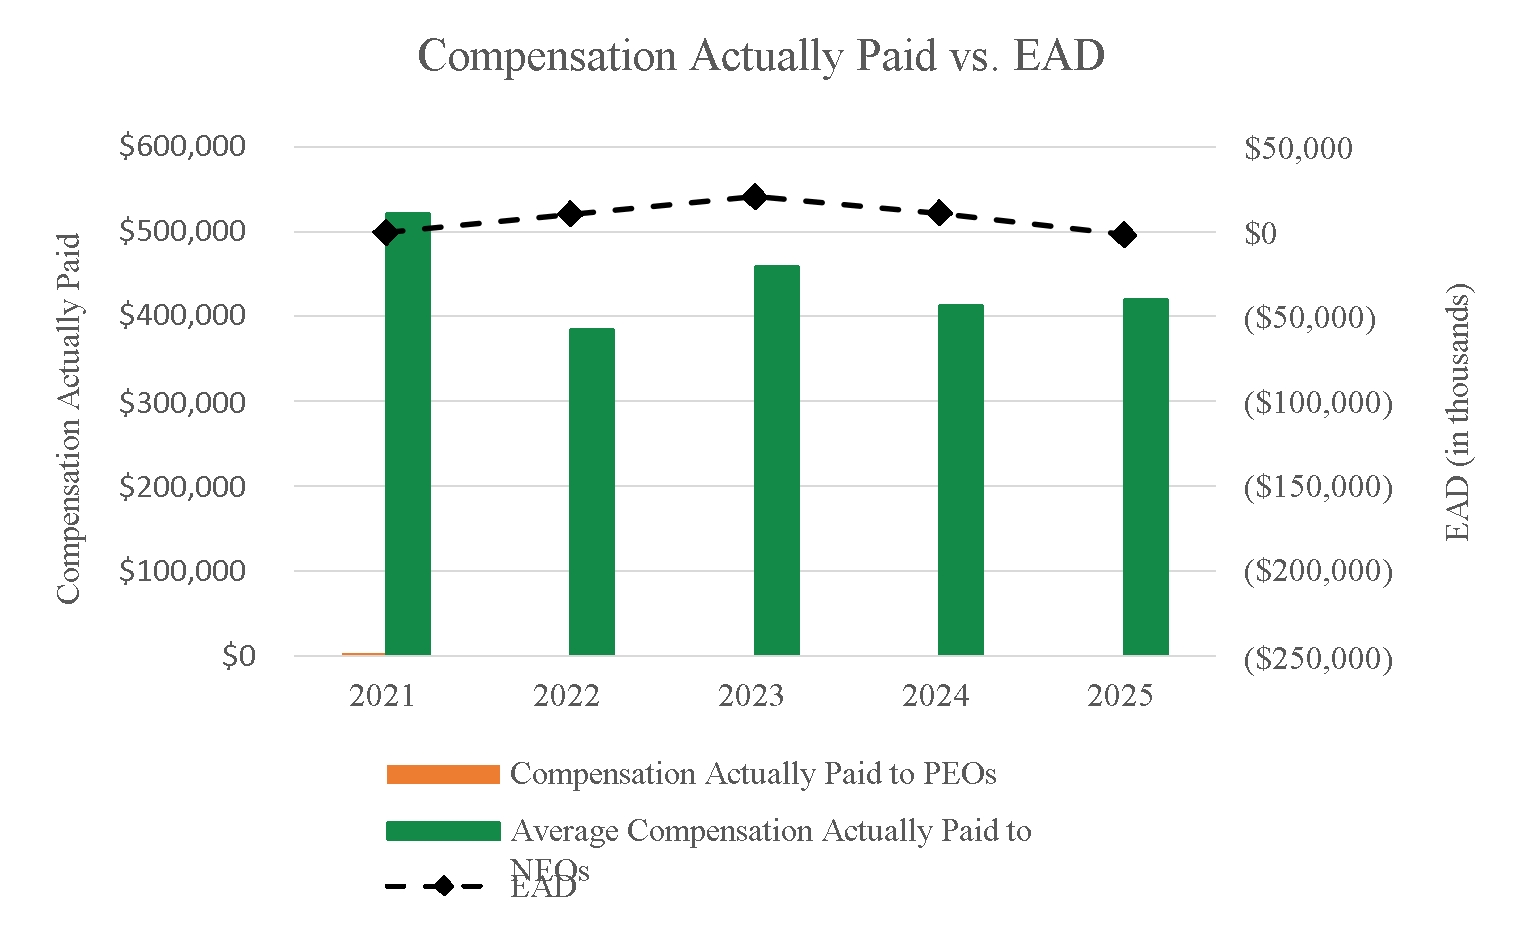
|
|
|
|
|
| Total Shareholder Return Vs Peer Group |
Compensation Actually Paid vs. TSR Performance $600,000 $160 $500,000 $140 $400,000 $120 $300,000 $100 $80 $200,000 $60 $100,000 $40 $20 $0 $0 ($100,000) ($20) ($200,000) ($40) Compensation Actually Paid Total Shareholder Return ($100 Investment) 200 2021 2022 Compensation Actually Paid to PEOs Average compensation Actually Paid to NEOs ACR TSR Peer Group TSR
|
|
|
|
|
| Tabular List, Table |
Tabular List of Performance Measures The list below includes the three financial performance measures that in our assessment represent the most important financial performance measures used to link compensation actually paid to our NEOs for 2025 to company performance.
|
Financial Performance Measures |
EAD |
Book Value |
Production |
|
|
|
|
|
| Total Shareholder Return Amount |
$ 178.28
|
134.92
|
80.37
|
69.01
|
104.18
|
| Peer Group Total Shareholder Return Amount |
123.88
|
121.85
|
116.79
|
104.76
|
139.88
|
| Net Income (Loss) |
$ 27,976,000
|
$ 28,695,000
|
$ 21,848,000
|
$ 10,426,000
|
$ 33,923,000
|
| Company Selected Measure Amount |
(1,869,000)
|
10,941,000
|
20,565,000
|
10,384,000
|
(457,000)
|
| PEO Name |
Mr. Fogel
|
|
|
|
|
| Measure:: 1 |
|
|
|
|
|
| Pay vs Performance Disclosure |
|
|
|
|
|
| Name |
EAD
|
|
|
|
|
| Non-GAAP Measure Description |
For purposes of Item 402(v) of Regulation S-K, we have identified Earnings Available for Distribution ("EAD") as our Company-Selected Metric. EAD is a non-GAAP financial measure that the Company uses to evaluate its operating performance. EAD, for reporting purposes, is defined as GAAP net income (loss) allocable to common shares, excluding (i) non-cash equity compensation expense, (ii) unrealized gains and losses, (iii) non-cash provisions for loan losses, (iv) non-cash impairments on securities, (v) non-cash amortization of discounts or premiums associated with borrowings, (vi) net income or loss from a limited partnership interest owned at the initial measurement date, (vii) net income or loss from non-core assets, (viii) real estate depreciation and amortization, (ix) foreign currency gains or losses and (x) income or loss from discontinued operations. EAD may also be adjusted periodically to exclude certain one-time events pursuant to changes in GAAP and certain non-cash items.
|
|
|
|
|
| Measure:: 2 |
|
|
|
|
|
| Pay vs Performance Disclosure |
|
|
|
|
|
| Name |
Book Value
|
|
|
|
|
| Measure:: 3 |
|
|
|
|
|
| Pay vs Performance Disclosure |
|
|
|
|
|
| Name |
Production
|
|
|
|
|
| Mark Fogel [Member] |
|
|
|
|
|
| Pay vs Performance Disclosure |
|
|
|
|
|
| PEO Total Compensation Amount |
$ 0
|
$ 0
|
$ 0
|
$ 0
|
$ 0
|
| PEO Actually Paid Compensation Amount |
$ 0
|
$ 0
|
$ 0
|
$ 0
|
$ 0
|