Shareholder Report
|
12 Months Ended |
|
Feb. 28, 2026
USD ($)
Holding
|
|---|
| Shareholder Report [Line Items] |
|
| Document Type |
N-CSR
|
| Amendment Flag |
false
|
| Registrant Name |
Northern Lights Fund Trust II
|
| Entity Central Index Key |
0001518042
|
| Entity Investment Company Type |
N-1A
|
| Document Period End Date |
Feb. 28, 2026
|
| Shareholder Report Annual or Semi-Annual |
Annual Shareholder Report
|
| C000241788 |
|
| Shareholder Report [Line Items] |
|
| Fund Name |
Beacon Selective Risk ETF
|
| Trading Symbol |
BSR
|
| Security Exchange Name |
NYSEArca
|
| Additional Information Phone Number |
1-866-439-9093
|
| Additional Information Website |
https://beaconinvestingfunds.com/beacon-selective-risk/#documents
|
| Expenses [Text Block] |
What were the Fund’s costs for the last year?(based on a hypothetical $10,000 investment) Table SummaryFund Name | Costs of a $10,000 investment | Costs paid as a percentage of a $10,000 investment |
|---|
Beacon Selective Risk ETF | $104 | 1.00% |
|---|
|
| Expenses Paid, Amount |
$ 104
|
| Expense Ratio, Percent |
1.00%
|
| Performance Past Does Not Indicate Future [Text] |
The Fund's past performance is not a good predictor of how the Fund will perform in the future.
|
| Performance Inception Date |
Apr. 17, 2023
|
| No Deduction of Taxes [Text Block] |
The graph and table do not reflect the deduction of taxes that a shareholder would pay on fund distributions or redemption of fund shares.
|
| AssetsNet |
$ 40,168,909
|
| Holdings Count | Holding |
11
|
| Advisory Fees Paid, Amount |
$ 78,184
|
| InvestmentCompanyPortfolioTurnover |
126.00%
|
| Additional Fund Statistics [Text Block] |
Table SummaryNet Assets | $40,168,909 |
|---|
Number of Portfolio Holdings | 11 |
|---|
Advisory Fee (net of waivers) | $78,184 |
|---|
Portfolio Turnover | 126% |
|---|
|
| Holdings [Text Block] |
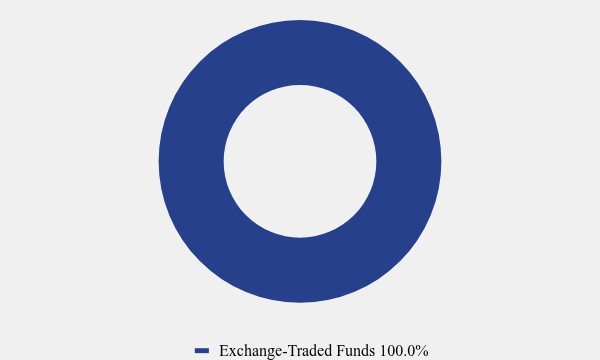
Asset Weighting (% of total investments)Table SummaryValue | Value |
|---|
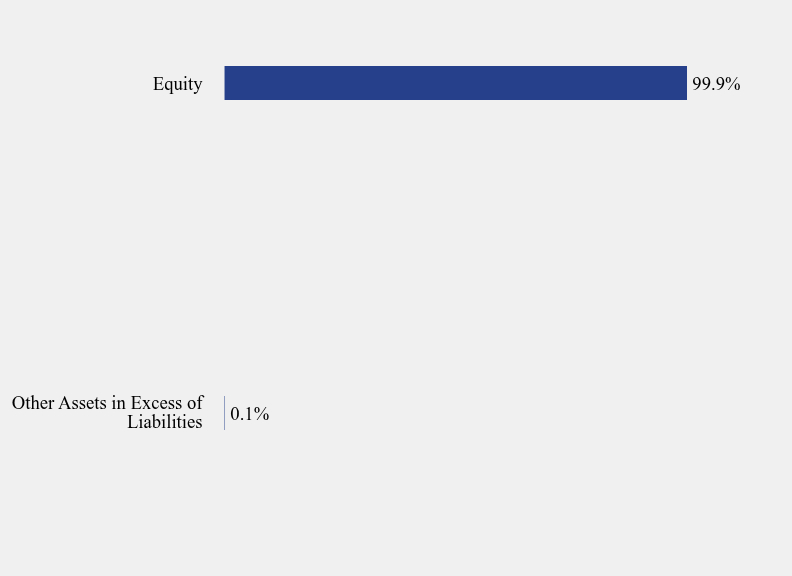
Exchange-Traded Funds | 100.0% | Sector Weighting (% of net assets)Table SummaryValue | Value |
|---|
Other Assets in Excess of Liabilities | 0.1% | Equity | 99.9% | • May represent asset weighting given fund’s investment approach/investments in other investment companies. Top 10 Holdings (% of net assets)Table SummaryHolding Name | % of Net Assets |
|---|
Vanguard Utilities ETF | 10.3% |
|---|
Vanguard Consumer Staples ETF | 9.6% |
|---|
Vanguard Communication Services ETF | 9.4% |
|---|
Vanguard Materials ETF | 9.4% |
|---|
Vanguard Energy ETF | 9.4% |
|---|
Vanguard Health Care ETF | 9.3% |
|---|
Vanguard Information Technology ETF | 9.3% |
|---|
Vanguard Industrials ETF | 9.1% |
|---|
Vanguard Real Estate ETF | 8.5% |
|---|
Vanguard Consumer Discretionary ETF | 8.4% |
|---|
|
| C000241789 |
|
| Shareholder Report [Line Items] |
|
| Fund Name |
Beacon Tactical Risk ETF
|
| Trading Symbol |
BTR
|
| Security Exchange Name |
NYSEArca
|
| Additional Information Phone Number |
1-866-439-9093
|
| Additional Information Website |
https://beaconinvestingfunds.com/beacon-tactical-risk/#documents
|
| Expenses [Text Block] |
What were the Fund’s costs for the last year?(based on a hypothetical $10,000 investment) Fund Name | Costs of a $10,000 investment | Costs paid as a percentage of a $10,000 investment |
|---|
Beacon Tactical Risk ETF | $101 | 1.00% |
|---|
|
| Expenses Paid, Amount |
$ 101
|
| Expense Ratio, Percent |
1.00%
|
| Performance Past Does Not Indicate Future [Text] |
The Fund's past performance is not a good predictor of how the Fund will perform in the future.
|
| Performance Inception Date |
Apr. 17, 2023
|
| No Deduction of Taxes [Text Block] |
The graph and table do not reflect the deduction of taxes that a shareholder would pay on fund distributions or redemption of fund shares.
|
| AssetsNet |
$ 36,515,898
|
| Holdings Count | Holding |
11
|
| Advisory Fees Paid, Amount |
$ 36,335
|
| InvestmentCompanyPortfolioTurnover |
172.00%
|
| Additional Fund Statistics [Text Block] |
Net Assets | $36,515,898 |
|---|
Number of Portfolio Holdings | 11 |
|---|
Advisory Fee (net of waivers) | $36,335 |
|---|
Portfolio Turnover | 172% |
|---|
|
| Holdings [Text Block] |
Asset Weighting (% of total investments)Value | Value |
|---|
Exchange-Traded Funds | 100.0% |
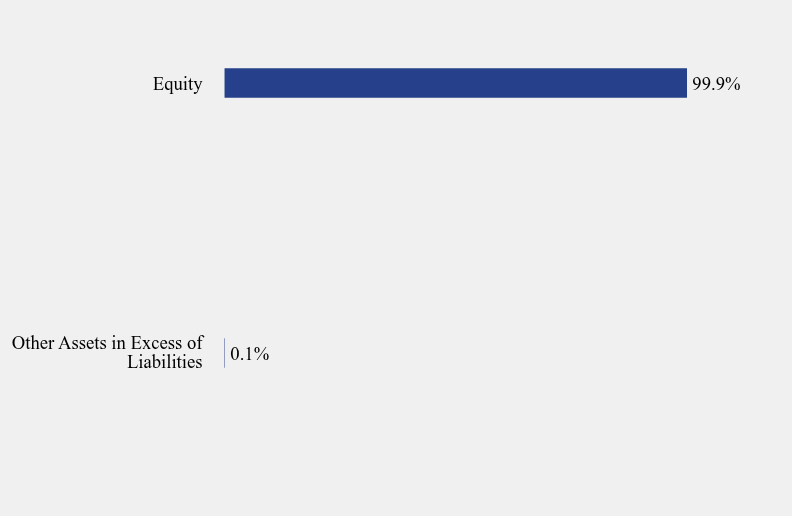
Sector Weighting (% of net assets)Value | Value |
|---|
Other Assets in Excess of Liabilities | 0.1% | Equity | 99.9% |
• May represent asset weighting given fund’s investment approach/investments in other investment companies. Top 10 Holdings (% of net assets)Holding Name | % of Net Assets |
|---|
Vanguard Energy ETF | 10.5% |
|---|
Vanguard Materials ETF | 9.8% |
|---|
Vanguard Industrials ETF | 9.7% |
|---|
Vanguard Health Care ETF | 9.3% |
|---|
Vanguard Utilities ETF | 9.2% |
|---|
Vanguard Communication Services ETF | 9.1% |
|---|
Vanguard Information Technology ETF | 9.0% |
|---|
Vanguard Consumer Staples ETF | 8.6% |
|---|
Vanguard Consumer Discretionary ETF | 8.5% |
|---|
Vanguard Real Estate ETF | 8.3% |
|---|
|