UNITED
STATES
SECURITIES AND EXCHANGE COMMISSION
WASHINGTON, D.C. 20549
FORM
N-CSR
CERTIFIED
SHAREHOLDER REPORT OF REGISTERED MANAGEMENT
INVESTMENT COMPANIES
| Investment
Company Act file number |
811-22549 |
| Northern
Lights Fund Trust II |
| (Exact
name of registrant as specified in charter) |
| 225
Pictoria Drive, Cincinnati, Ohio |
45246 |
| (Address
of principal executive offices) |
(Zip
code) |
| The
Corporation Trust Company |
| 1209
Orange Street Wilmington, DE 19801 |
| (Name
and address of agent for service) |
| Registrant’s
telephone number, including area code: |
631-470-2600 |
| Date
of fiscal year end: |
2/28 |
| |
|
| Date
of reporting period: |
02/28/2026 |
Item
1. Reports to Stockholders.
0001518042falseN-CSRNorthern Lights Fund Trust IIN-1A2026-02-280001518042nlft2:C000266022Member2025-03-012026-02-2800015180422025-03-012026-02-280001518042nlft2:C000266022Member2016-02-292016-02-290001518042nlft2:SP500IndexTR3039AdditionalIndexMember2016-02-292016-02-290001518042nlft2:BloombergUSAggregateBondIndex3039BroadBasedIndexMember2016-02-292016-02-290001518042nlft2:A60SP500TR40BBUSAggregate3039AdditionalIndexMember2016-02-292016-02-290001518042nlft2:C000266022Member2016-03-012017-02-280001518042nlft2:SP500IndexTR3039AdditionalIndexMember2016-03-012017-02-280001518042nlft2:BloombergUSAggregateBondIndex3039BroadBasedIndexMember2016-03-012017-02-280001518042nlft2:A60SP500TR40BBUSAggregate3039AdditionalIndexMember2016-03-012017-02-280001518042nlft2:C000266022Member2016-03-012018-02-280001518042nlft2:SP500IndexTR3039AdditionalIndexMember2016-03-012018-02-280001518042nlft2:BloombergUSAggregateBondIndex3039BroadBasedIndexMember2016-03-012018-02-280001518042nlft2:A60SP500TR40BBUSAggregate3039AdditionalIndexMember2016-03-012018-02-280001518042nlft2:C000266022Member2016-03-012019-02-280001518042nlft2:SP500IndexTR3039AdditionalIndexMember2016-03-012019-02-280001518042nlft2:BloombergUSAggregateBondIndex3039BroadBasedIndexMember2016-03-012019-02-280001518042nlft2:A60SP500TR40BBUSAggregate3039AdditionalIndexMember2016-03-012019-02-280001518042nlft2:C000266022Member2016-03-012020-02-290001518042nlft2:SP500IndexTR3039AdditionalIndexMember2016-03-012020-02-290001518042nlft2:BloombergUSAggregateBondIndex3039BroadBasedIndexMember2016-03-012020-02-290001518042nlft2:A60SP500TR40BBUSAggregate3039AdditionalIndexMember2016-03-012020-02-290001518042nlft2:C000266022Member2016-03-012021-02-280001518042nlft2:SP500IndexTR3039AdditionalIndexMember2016-03-012021-02-280001518042nlft2:BloombergUSAggregateBondIndex3039BroadBasedIndexMember2016-03-012021-02-280001518042nlft2:A60SP500TR40BBUSAggregate3039AdditionalIndexMember2016-03-012021-02-280001518042nlft2:C000266022Member2016-03-012022-02-280001518042nlft2:SP500IndexTR3039AdditionalIndexMember2016-03-012022-02-280001518042nlft2:BloombergUSAggregateBondIndex3039BroadBasedIndexMember2016-03-012022-02-280001518042nlft2:A60SP500TR40BBUSAggregate3039AdditionalIndexMember2016-03-012022-02-280001518042nlft2:C000266022Member2016-03-012023-02-280001518042nlft2:SP500IndexTR3039AdditionalIndexMember2016-03-012023-02-280001518042nlft2:BloombergUSAggregateBondIndex3039BroadBasedIndexMember2016-03-012023-02-280001518042nlft2:A60SP500TR40BBUSAggregate3039AdditionalIndexMember2016-03-012023-02-280001518042nlft2:C000266022Member2016-03-012024-02-290001518042nlft2:SP500IndexTR3039AdditionalIndexMember2016-03-012024-02-290001518042nlft2:BloombergUSAggregateBondIndex3039BroadBasedIndexMember2016-03-012024-02-290001518042nlft2:A60SP500TR40BBUSAggregate3039AdditionalIndexMember2016-03-012024-02-290001518042nlft2:C000266022Member2016-03-012025-02-280001518042nlft2:SP500IndexTR3039AdditionalIndexMember2016-03-012025-02-280001518042nlft2:BloombergUSAggregateBondIndex3039BroadBasedIndexMember2016-03-012025-02-280001518042nlft2:A60SP500TR40BBUSAggregate3039AdditionalIndexMember2016-03-012025-02-280001518042nlft2:C000266022Member2016-03-012026-02-280001518042nlft2:SP500IndexTR3039AdditionalIndexMember2016-03-012026-02-280001518042nlft2:BloombergUSAggregateBondIndex3039BroadBasedIndexMember2016-03-012026-02-280001518042nlft2:A60SP500TR40BBUSAggregate3039AdditionalIndexMember2016-03-012026-02-280001518042nlft2:C000266022Memberoef:WithoutSalesLoadMember2025-08-012026-02-280001518042nlft2:C000266022Memberoef:WithoutSalesLoadMember2025-03-012026-02-280001518042nlft2:C000266022Memberoef:WithoutSalesLoadMember2021-03-012026-02-280001518042nlft2:C000266022Memberoef:WithoutSalesLoadMember2016-03-012026-02-280001518042nlft2:C000266022Member2025-08-012026-02-280001518042nlft2:C000266022Member2021-03-012026-02-280001518042nlft2:A60SP500TR40BBUSAggregate3039AdditionalIndexMember2025-08-012026-02-280001518042nlft2:A60SP500TR40BBUSAggregate3039AdditionalIndexMember2025-03-012026-02-280001518042nlft2:A60SP500TR40BBUSAggregate3039AdditionalIndexMember2021-03-012026-02-280001518042nlft2:BloombergUSAggregateBondIndex3039BroadBasedIndexMember2025-08-012026-02-280001518042nlft2:BloombergUSAggregateBondIndex3039BroadBasedIndexMember2025-03-012026-02-280001518042nlft2:BloombergUSAggregateBondIndex3039BroadBasedIndexMember2021-03-012026-02-280001518042nlft2:SP500IndexTR3039AdditionalIndexMember2025-08-012026-02-280001518042nlft2:SP500IndexTR3039AdditionalIndexMember2025-03-012026-02-280001518042nlft2:SP500IndexTR3039AdditionalIndexMember2021-03-012026-02-280001518042nlft2:C000266022Member2026-02-280001518042nlft2:C000266022Membernlft2:FixedIncomeMinusOther03463K760SectorMember2026-02-280001518042nlft2:C000266022Membernlft2:CashEquivalent31846V336SectorMember2026-02-280001518042nlft2:C000266022Membernlft2:MoneyMarketFundsSectorMember2026-02-280001518042nlft2:C000266022Membernlft2:AlternativeSectorMember2026-02-280001518042nlft2:C000266022Membernlft2:FixedIncomeSectorMember2026-02-280001518042nlft2:C000266022Membernlft2:EquitySectorMember2026-02-280001518042nlft2:C000266022Membernlft2:A92647X830VictorySharesFreeCashFlowETFCTIMember2026-02-280001518042nlft2:C000266022Membernlft2:A78464A854StateStreetSPDRPortfolioSP500ETFCTIMember2026-02-280001518042nlft2:C000266022Membernlft2:A78464A805StateStreetSPDRPortfolioSP1500CompositeStockMarketETFCTIMember2026-02-280001518042nlft2:C000266022Membernlft2:A72201R718PIMCOEnhancedLowDurationActiveETFCTIMember2026-02-280001518042nlft2:C000266022Membernlft2:A72201R585PIMCOMultisectorBondActiveETFCTIMember2026-02-280001518042nlft2:C000266022Membernlft2:A87283Q826TRowePriceSmallMinusMidCapETFCTIMember2026-02-280001518042nlft2:C000266022Membernlft2:A78468R200StateStreetSPDRBloombergInvestmentGradeFloatingRateETFCTIMember2026-02-280001518042nlft2:C000266022Membernlft2:A02072L433AstoriaUSEqualWeightQualityKingsETFCTIMember2026-02-280001518042nlft2:C000266022Membernlft2:A47103U845JanusHendersonAAACLOETFCTIMember2026-02-280001518042nlft2:C000266022Membernlft2:A03463K760AngelOakIncomeETFCTIMember2026-02-280001518042nlft2:C000274166Member2025-03-012026-02-280001518042nlft2:C000274166Member2016-02-292016-02-290001518042nlft2:SP500IndexTR2989AdditionalIndexMember2016-02-292016-02-290001518042nlft2:BloombergUSAggregateBondIndex2989BroadBasedIndexMember2016-02-292016-02-290001518042nlft2:A60SP500TR40BBUSAggregate2989AdditionalIndexMember2016-02-292016-02-290001518042nlft2:C000274166Member2016-03-012017-02-280001518042nlft2:SP500IndexTR2989AdditionalIndexMember2016-03-012017-02-280001518042nlft2:BloombergUSAggregateBondIndex2989BroadBasedIndexMember2016-03-012017-02-280001518042nlft2:A60SP500TR40BBUSAggregate2989AdditionalIndexMember2016-03-012017-02-280001518042nlft2:C000274166Member2016-03-012018-02-280001518042nlft2:SP500IndexTR2989AdditionalIndexMember2016-03-012018-02-280001518042nlft2:BloombergUSAggregateBondIndex2989BroadBasedIndexMember2016-03-012018-02-280001518042nlft2:A60SP500TR40BBUSAggregate2989AdditionalIndexMember2016-03-012018-02-280001518042nlft2:C000274166Member2016-03-012019-02-280001518042nlft2:SP500IndexTR2989AdditionalIndexMember2016-03-012019-02-280001518042nlft2:BloombergUSAggregateBondIndex2989BroadBasedIndexMember2016-03-012019-02-280001518042nlft2:A60SP500TR40BBUSAggregate2989AdditionalIndexMember2016-03-012019-02-280001518042nlft2:C000274166Member2016-03-012020-02-290001518042nlft2:SP500IndexTR2989AdditionalIndexMember2016-03-012020-02-290001518042nlft2:BloombergUSAggregateBondIndex2989BroadBasedIndexMember2016-03-012020-02-290001518042nlft2:A60SP500TR40BBUSAggregate2989AdditionalIndexMember2016-03-012020-02-290001518042nlft2:C000274166Member2016-03-012021-02-280001518042nlft2:SP500IndexTR2989AdditionalIndexMember2016-03-012021-02-280001518042nlft2:BloombergUSAggregateBondIndex2989BroadBasedIndexMember2016-03-012021-02-280001518042nlft2:A60SP500TR40BBUSAggregate2989AdditionalIndexMember2016-03-012021-02-280001518042nlft2:C000274166Member2016-03-012022-02-280001518042nlft2:SP500IndexTR2989AdditionalIndexMember2016-03-012022-02-280001518042nlft2:BloombergUSAggregateBondIndex2989BroadBasedIndexMember2016-03-012022-02-280001518042nlft2:A60SP500TR40BBUSAggregate2989AdditionalIndexMember2016-03-012022-02-280001518042nlft2:C000274166Member2016-03-012023-02-280001518042nlft2:SP500IndexTR2989AdditionalIndexMember2016-03-012023-02-280001518042nlft2:BloombergUSAggregateBondIndex2989BroadBasedIndexMember2016-03-012023-02-280001518042nlft2:A60SP500TR40BBUSAggregate2989AdditionalIndexMember2016-03-012023-02-280001518042nlft2:C000274166Member2016-03-012024-02-290001518042nlft2:SP500IndexTR2989AdditionalIndexMember2016-03-012024-02-290001518042nlft2:BloombergUSAggregateBondIndex2989BroadBasedIndexMember2016-03-012024-02-290001518042nlft2:A60SP500TR40BBUSAggregate2989AdditionalIndexMember2016-03-012024-02-290001518042nlft2:C000274166Member2016-03-012025-02-280001518042nlft2:SP500IndexTR2989AdditionalIndexMember2016-03-012025-02-280001518042nlft2:BloombergUSAggregateBondIndex2989BroadBasedIndexMember2016-03-012025-02-280001518042nlft2:A60SP500TR40BBUSAggregate2989AdditionalIndexMember2016-03-012025-02-280001518042nlft2:C000274166Member2016-03-012026-02-280001518042nlft2:SP500IndexTR2989AdditionalIndexMember2016-03-012026-02-280001518042nlft2:BloombergUSAggregateBondIndex2989BroadBasedIndexMember2016-03-012026-02-280001518042nlft2:A60SP500TR40BBUSAggregate2989AdditionalIndexMember2016-03-012026-02-280001518042nlft2:C000274166Memberoef:WithoutSalesLoadMember2025-08-012026-02-280001518042nlft2:C000274166Memberoef:WithoutSalesLoadMember2025-03-012026-02-280001518042nlft2:C000274166Memberoef:WithoutSalesLoadMember2021-03-012026-02-280001518042nlft2:C000274166Memberoef:WithoutSalesLoadMember2016-03-012026-02-280001518042nlft2:A60SP500TR40BBUSAggregate2989AdditionalIndexMember2025-08-012026-02-280001518042nlft2:A60SP500TR40BBUSAggregate2989AdditionalIndexMember2025-03-012026-02-280001518042nlft2:A60SP500TR40BBUSAggregate2989AdditionalIndexMember2021-03-012026-02-280001518042nlft2:BloombergUSAggregateBondIndex2989BroadBasedIndexMember2025-08-012026-02-280001518042nlft2:BloombergUSAggregateBondIndex2989BroadBasedIndexMember2025-03-012026-02-280001518042nlft2:BloombergUSAggregateBondIndex2989BroadBasedIndexMember2021-03-012026-02-280001518042nlft2:SP500IndexTR2989AdditionalIndexMember2025-08-012026-02-280001518042nlft2:SP500IndexTR2989AdditionalIndexMember2025-03-012026-02-280001518042nlft2:SP500IndexTR2989AdditionalIndexMember2021-03-012026-02-280001518042nlft2:C000274166Member2026-02-280001518042nlft2:C000274166Membernlft2:FixedIncomeMinusOther03463K760SectorMember2026-02-280001518042nlft2:C000274166Membernlft2:CashEquivalent31846V336SectorMember2026-02-280001518042nlft2:C000274166Membernlft2:MoneyMarketFundsSectorMember2026-02-280001518042nlft2:C000274166Membernlft2:AlternativeSectorMember2026-02-280001518042nlft2:C000274166Membernlft2:FixedIncomeSectorMember2026-02-280001518042nlft2:C000274166Membernlft2:EquitySectorMember2026-02-280001518042nlft2:C000274166Membernlft2:A92647X830VictorySharesFreeCashFlowETFCTIMember2026-02-280001518042nlft2:C000274166Membernlft2:A78464A854StateStreetSPDRPortfolioSP500ETFCTIMember2026-02-280001518042nlft2:C000274166Membernlft2:A78464A805StateStreetSPDRPortfolioSP1500CompositeStockMarketETFCTIMember2026-02-280001518042nlft2:C000274166Membernlft2:A72201R718PIMCOEnhancedLowDurationActiveETFCTIMember2026-02-280001518042nlft2:C000274166Membernlft2:A72201R585PIMCOMultisectorBondActiveETFCTIMember2026-02-280001518042nlft2:C000274166Membernlft2:A87283Q826TRowePriceSmallMinusMidCapETFCTIMember2026-02-280001518042nlft2:C000274166Membernlft2:A78468R200StateStreetSPDRBloombergInvestmentGradeFloatingRateETFCTIMember2026-02-280001518042nlft2:C000274166Membernlft2:A02072L433AstoriaUSEqualWeightQualityKingsETFCTIMember2026-02-280001518042nlft2:C000274166Membernlft2:A47103U845JanusHendersonAAACLOETFCTIMember2026-02-280001518042nlft2:C000274166Membernlft2:A03463K760AngelOakIncomeETFCTIMember2026-02-280001518042nlft2:C000274167Member2025-03-012026-02-280001518042nlft2:C000274167Member2016-02-292016-02-290001518042nlft2:SP500IndexTR2961AdditionalIndexMember2016-02-292016-02-290001518042nlft2:BloombergUSAggregateBondIndex2961BroadBasedIndexMember2016-02-292016-02-290001518042nlft2:A60SP500TR40BBUSAggregate2961AdditionalIndexMember2016-02-292016-02-290001518042nlft2:C000274167Member2016-03-012017-02-280001518042nlft2:SP500IndexTR2961AdditionalIndexMember2016-03-012017-02-280001518042nlft2:BloombergUSAggregateBondIndex2961BroadBasedIndexMember2016-03-012017-02-280001518042nlft2:A60SP500TR40BBUSAggregate2961AdditionalIndexMember2016-03-012017-02-280001518042nlft2:C000274167Member2016-03-012018-02-280001518042nlft2:SP500IndexTR2961AdditionalIndexMember2016-03-012018-02-280001518042nlft2:BloombergUSAggregateBondIndex2961BroadBasedIndexMember2016-03-012018-02-280001518042nlft2:A60SP500TR40BBUSAggregate2961AdditionalIndexMember2016-03-012018-02-280001518042nlft2:C000274167Member2016-03-012019-02-280001518042nlft2:SP500IndexTR2961AdditionalIndexMember2016-03-012019-02-280001518042nlft2:BloombergUSAggregateBondIndex2961BroadBasedIndexMember2016-03-012019-02-280001518042nlft2:A60SP500TR40BBUSAggregate2961AdditionalIndexMember2016-03-012019-02-280001518042nlft2:C000274167Member2016-03-012020-02-290001518042nlft2:SP500IndexTR2961AdditionalIndexMember2016-03-012020-02-290001518042nlft2:BloombergUSAggregateBondIndex2961BroadBasedIndexMember2016-03-012020-02-290001518042nlft2:A60SP500TR40BBUSAggregate2961AdditionalIndexMember2016-03-012020-02-290001518042nlft2:C000274167Member2016-03-012021-02-280001518042nlft2:SP500IndexTR2961AdditionalIndexMember2016-03-012021-02-280001518042nlft2:BloombergUSAggregateBondIndex2961BroadBasedIndexMember2016-03-012021-02-280001518042nlft2:A60SP500TR40BBUSAggregate2961AdditionalIndexMember2016-03-012021-02-280001518042nlft2:C000274167Member2016-03-012022-02-280001518042nlft2:SP500IndexTR2961AdditionalIndexMember2016-03-012022-02-280001518042nlft2:BloombergUSAggregateBondIndex2961BroadBasedIndexMember2016-03-012022-02-280001518042nlft2:A60SP500TR40BBUSAggregate2961AdditionalIndexMember2016-03-012022-02-280001518042nlft2:C000274167Member2016-03-012023-02-280001518042nlft2:SP500IndexTR2961AdditionalIndexMember2016-03-012023-02-280001518042nlft2:BloombergUSAggregateBondIndex2961BroadBasedIndexMember2016-03-012023-02-280001518042nlft2:A60SP500TR40BBUSAggregate2961AdditionalIndexMember2016-03-012023-02-280001518042nlft2:C000274167Member2016-03-012024-02-290001518042nlft2:SP500IndexTR2961AdditionalIndexMember2016-03-012024-02-290001518042nlft2:BloombergUSAggregateBondIndex2961BroadBasedIndexMember2016-03-012024-02-290001518042nlft2:A60SP500TR40BBUSAggregate2961AdditionalIndexMember2016-03-012024-02-290001518042nlft2:C000274167Member2016-03-012025-02-280001518042nlft2:SP500IndexTR2961AdditionalIndexMember2016-03-012025-02-280001518042nlft2:BloombergUSAggregateBondIndex2961BroadBasedIndexMember2016-03-012025-02-280001518042nlft2:A60SP500TR40BBUSAggregate2961AdditionalIndexMember2016-03-012025-02-280001518042nlft2:C000274167Member2016-03-012026-02-280001518042nlft2:SP500IndexTR2961AdditionalIndexMember2016-03-012026-02-280001518042nlft2:BloombergUSAggregateBondIndex2961BroadBasedIndexMember2016-03-012026-02-280001518042nlft2:A60SP500TR40BBUSAggregate2961AdditionalIndexMember2016-03-012026-02-280001518042nlft2:C000274167Memberoef:WithoutSalesLoadMember2025-08-012026-02-280001518042nlft2:C000274167Memberoef:WithoutSalesLoadMember2025-03-012026-02-280001518042nlft2:C000274167Memberoef:WithoutSalesLoadMember2021-03-012026-02-280001518042nlft2:C000274167Memberoef:WithoutSalesLoadMember2016-03-012026-02-280001518042nlft2:A60SP500TR40BBUSAggregate2961AdditionalIndexMember2025-08-012026-02-280001518042nlft2:A60SP500TR40BBUSAggregate2961AdditionalIndexMember2025-03-012026-02-280001518042nlft2:A60SP500TR40BBUSAggregate2961AdditionalIndexMember2021-03-012026-02-280001518042nlft2:BloombergUSAggregateBondIndex2961BroadBasedIndexMember2025-08-012026-02-280001518042nlft2:BloombergUSAggregateBondIndex2961BroadBasedIndexMember2025-03-012026-02-280001518042nlft2:BloombergUSAggregateBondIndex2961BroadBasedIndexMember2021-03-012026-02-280001518042nlft2:SP500IndexTR2961AdditionalIndexMember2025-08-012026-02-280001518042nlft2:SP500IndexTR2961AdditionalIndexMember2025-03-012026-02-280001518042nlft2:SP500IndexTR2961AdditionalIndexMember2021-03-012026-02-280001518042nlft2:C000274167Member2026-02-280001518042nlft2:C000274167Membernlft2:FixedIncomeMinusOther03463K760SectorMember2026-02-280001518042nlft2:C000274167Membernlft2:CashEquivalent31846V336SectorMember2026-02-280001518042nlft2:C000274167Membernlft2:MoneyMarketFundsSectorMember2026-02-280001518042nlft2:C000274167Membernlft2:AlternativeSectorMember2026-02-280001518042nlft2:C000274167Membernlft2:FixedIncomeSectorMember2026-02-280001518042nlft2:C000274167Membernlft2:EquitySectorMember2026-02-280001518042nlft2:C000274167Membernlft2:A92647X830VictorySharesFreeCashFlowETFCTIMember2026-02-280001518042nlft2:C000274167Membernlft2:A78464A854StateStreetSPDRPortfolioSP500ETFCTIMember2026-02-280001518042nlft2:C000274167Membernlft2:A78464A805StateStreetSPDRPortfolioSP1500CompositeStockMarketETFCTIMember2026-02-280001518042nlft2:C000274167Membernlft2:A72201R718PIMCOEnhancedLowDurationActiveETFCTIMember2026-02-280001518042nlft2:C000274167Membernlft2:A72201R585PIMCOMultisectorBondActiveETFCTIMember2026-02-280001518042nlft2:C000274167Membernlft2:A87283Q826TRowePriceSmallMinusMidCapETFCTIMember2026-02-280001518042nlft2:C000274167Membernlft2:A78468R200StateStreetSPDRBloombergInvestmentGradeFloatingRateETFCTIMember2026-02-280001518042nlft2:C000274167Membernlft2:A02072L433AstoriaUSEqualWeightQualityKingsETFCTIMember2026-02-280001518042nlft2:C000274167Membernlft2:A47103U845JanusHendersonAAACLOETFCTIMember2026-02-280001518042nlft2:C000274167Membernlft2:A03463K760AngelOakIncomeETFCTIMember2026-02-28iso4217:USDxbrli:sharesiso4217:USDxbrli:sharesxbrli:pureutr:Dnlft2:Holding
Beacon Dynamic Allocation Fund
Annual Shareholder Report - February 28, 2026
This annual shareholder report contains important information about Beacon Dynamic Allocation Fund for the period of August 1, 2025 to February
28, 2026. You can find additional information about the Fund at https://beaconinvestingfunds.com/beacon-dynamic-allocation/. You can
also request this information by contacting us at (866) 439-9093. This report describes change to the Fund that occurred during the reporting period.
What were the Fund’s costs for the last year?
(based on a hypothetical $10,000 investment)
Table SummaryFund Name | Costs of a $10,000 investment | Costs paid as a percentage of a $10,000 investment |
|---|
Beacon Dynamic Allocation Fund | $85 | 1.40%Footnote Reference* |
|---|
| Footnote | Description |
Footnote* | Annualized for periods less than 1 year. |
How did the Fund perform during the reporting period?
The seven-month period ending February 28, 2026 was defined by a meaningful shift in equity market leadership that had been building since mid-2025. After years of outsized concentration among a handful of mega-cap technology companies, most notably the so-called "Magnificent Seven," the market began a visible and sustained rotation toward smaller-capitalization and value-oriented equities beginning in earnest in August 2025. Equal-weight measures of the S&P 500 reached new all-time highs as breadth improved and capital began flowing into a wider array of companies. For an index that had derived a disproportionate share of its returns from a narrow cluster of AI-driven growth names, this represented a structurally important rebalancing of market participation.
The Federal Reserve provided a constructive backdrop for the rotation. After holding rates steady for much of the year as it assessed the residual inflationary impact of tariffs, the Fed resumed its easing cycle in September 2025 with three consecutive 25-basis-point cuts, bringing the federal funds rate to a range of 3.50% to 3.75% by December. While inflation remained persistently above the 2% target due in part to tariff-related price pressures, the Fed characterized its posture as deliberately cautious, with the December dot plot signaling only limited additional cuts in 2026. The easing cycle nonetheless provided meaningful relief to rate-sensitive segments of the market, particularly smaller companies carrying floating-rate debt, and reinforced the fundamental case for the broadening of equity market leadership. Heading into 2026, the Fed entered a wait-and-see mode as the committee faced the additional uncertainty of a pending leadership transition upon the expiration of Chair Powell's term in May.
Fixed income markets reflected a similar narrative of modest easing tempered by ongoing uncertainty. The Bloomberg U.S. Aggregate Bond Index posted positive returns over the period as the rate cuts fed through to intermediate maturities, though the overall magnitude of gains was constrained by inflation stickiness and a market that remained skeptical of aggressive further easing. Credit markets were broadly constructive, with spread-sensitive sectors outperforming pure duration as investors remained willing to take on incremental credit risk in a still-growing economy.
The Fund Class A Shares returned 8.22% for the 7-month period ending February 28, 2026, while the 60% S&P 500 Index/40% Bloomberg U.S. Aggregate Bond Index (the "60/40 Benchmark") returned 7.67%. During the same period, the S&P 500 large cap equity market index and Bloomberg U.S. Aggregate Bond Index returned 9.30% and 5.23%, respectively.
The Beacon Economic Index® (BEI) maintained a balanced reading of approximately 0.50 to 0.55 beta throughout the period, reflecting a macro environment that was neither deteriorating nor broadly accelerating. While this positioning kept the portfolio meaningfully invested in risk assets and participating in the period's overall market gains, it also informed a deliberate decision to diversify the equity allocation away from concentrated large-cap growth exposure. Rather than mirroring benchmark-level weights to the S&P 500, the portfolio was structured to broaden its equity base, incorporating exposure to small- and mid-cap equities and free cash flow-oriented strategies, in anticipation of exactly the rotation that played out. This active equity allocation decision proved consequential as the composition of the equity exposure was better positioned to benefit from the broadening of market leadership away from large-cap growth.
Performance attribution for the period reflects this dynamic clearly. At the asset class level, security selection within domestic equities was the primary driver of relative outperformance, more than offsetting a modest drag from the portfolio's allocation underweight to domestic equities relative to the 60/40 Benchmark.
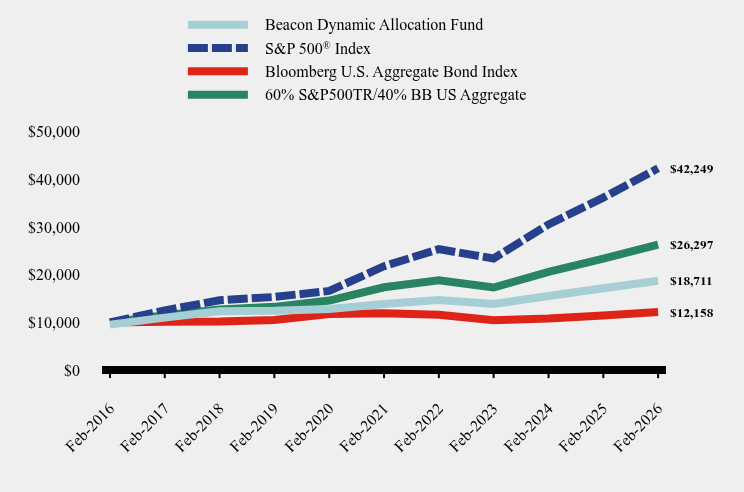
How has the Fund performed over the last ten years?
Total Return Based on $10,000 Investment
Table Summary | Beacon Dynamic Allocation Fund | S&P 500® Index | Bloomberg U.S. Aggregate Bond Index | 60% S&P500TR/40% BB US Aggregate |
|---|
Feb-2016 | $9,527 | $10,000 | $10,000 | $10,000 |
|---|
Feb-2017 | $11,000 | $12,498 | $10,142 | $11,510 |
|---|
Feb-2018 | $12,324 | $14,635 | $10,193 | $12,690 |
|---|
Feb-2019 | $12,417 | $15,320 | $10,516 | $13,249 |
|---|
Feb-2020 | $12,811 | $16,575 | $11,744 | $14,566 |
|---|
Feb-2021 | $13,837 | $21,761 | $11,907 | $17,348 |
|---|
Feb-2022 | $14,668 | $25,327 | $11,592 | $18,836 |
|---|
Feb-2023 | $13,869 | $23,379 | $10,465 | $17,299 |
|---|
Feb-2024 | $15,506 | $30,499 | $10,813 | $20,590 |
|---|
Feb-2025 | $17,157 | $36,113 | $11,441 | $23,327 |
|---|
Feb-2026 | $18,711 | $42,249 | $12,158 | $26,297 |
|---|
Average Annual Total Returns
Table Summary | 7 months | 1 Year | 5 Years | 10 Years |
|---|
Beacon Dynamic Allocation Fund | | | | |
|---|
Without Load | 8.22% | 9.06% | 6.22% | 6.98% |
|---|
With Load | 3.06% | 3.86% | 5.19% | 6.47% |
|---|
60% S&P500TR/40% BB US Aggregate | 7.67% | 12.73% | 8.67% | 10.15% |
|---|
Bloomberg U.S. Aggregate Bond Index | 5.23% | 6.26% | 0.42% | 1.97% |
|---|
S&P 500® Index | 9.30% | 16.99% | 14.19% | 15.50% |
|---|
The Fund’s past performance is not a good predictor of how the Fund will perform in the future. The graph and table do not reflect the deduction of taxes that a shareholder would pay on fund distributions or redemption of fund shares. For updated performance call (866) 439-9093.
- Net Assets$70,965,076
- Number of Portfolio Holdings12
- Advisory Fee (net of waivers)$169,792
- Portfolio Turnover34%
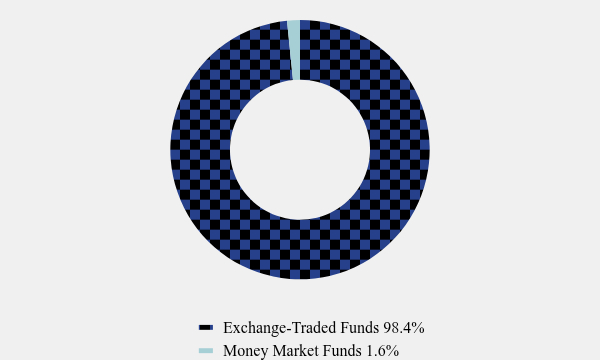
Asset Weighting (% of total investments)
Table SummaryValue | Value |
|---|
Exchange-Traded Funds | 98.4% |
Money Market Funds | 1.6% |
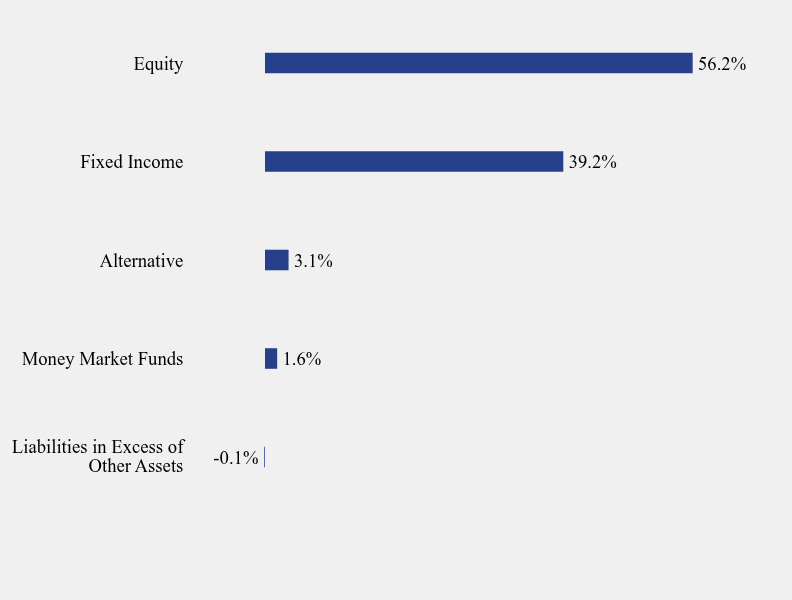
What did the Fund invest in?
Sector Weighting (% of net assets)
Table SummaryValue | Value |
|---|
Liabilities in Excess of Other Assets | -0.1% |
Money Market Funds | 1.6% |
Alternative | 3.1% |
Fixed Income | 39.2% |
Equity | 56.2% |
Top 10 Holdings (% of net assets)
Table SummaryHolding Name | % of Net Assets |
|---|
VictoryShares Free Cash Flow ETF | 14.1% |
|---|
State Street SPDR Portfolio S&P 500 ETF | 13.6% |
|---|
State Street SPDR Portfolio S&P 1500 Composite Stock Market ETF | 13.5% |
|---|
PIMCO Enhanced Low Duration Active ETF | 11.6% |
|---|
PIMCO Multisector Bond Active ETF | 10.1% |
|---|
T Rowe Price Small-Mid Cap ETF | 10.0% |
|---|
State Street SPDR Bloomberg Investment Grade Floating Rate ETF | 8.0% |
|---|
Astoria US Equal Weight Quality Kings ETF | 5.0% |
|---|
Janus Henderson AAA CLO ETF | 5.0% |
|---|
Angel Oak Income ETF | 4.5% |
|---|
The Beacon Dynamic Allocation Fund, a series of Northern Lights Fund Trust II, is the successor to the Astor Dynamic Allocation Fund and Astor Sector Allocation Fund, each a series of Northern Lights Fund Trust, (the “Predecessor Funds), pursuant to a reorganization that took place after the close of business on February 13, 2026. The Fund's fiscal year end changed from July 31 to February 28, effective February 13, 2026.
Beacon Dynamic Allocation Fund - Class A (BCMAX)
Annual Shareholder Report - February 28, 2026
Where can I find additional information about the Fund?
Additional information is available on the Fund's website (https://beaconinvestingfunds.com/beacon-dynamic-allocation/), including its:
Prospectus
Financial information
Holdings
Proxy voting information
Beacon Dynamic Allocation Fund
Annual Shareholder Report - February 28, 2026
This annual shareholder report contains important information about Beacon Dynamic Allocation Fund for the period of August 1, 2025 to February
28, 2026. You can find additional information about the Fund at https://beaconinvestingfunds.com/beacon-dynamic-allocation/. You can also request this information by contacting us at (866) 439-9093. This report describes change to the Fund that occurred during the reporting period.
What were the Fund’s costs for the last year?
(based on a hypothetical $10,000 investment)
Table SummaryFund Name | Costs of a $10,000 investment | Costs paid as a percentage of a $10,000 investment |
|---|
Beacon Dynamic Allocation Fund | $130 | 2.15%Footnote Reference* |
|---|
| Footnote | Description |
Footnote* | Annualized for periods less than 1 year. |
How did the Fund perform during the reporting period?
The seven-month period ending February 28, 2026 was defined by a meaningful shift in equity market leadership that had been building since mid-2025. After years of outsized concentration among a handful of mega-cap technology companies, most notably the so-called "Magnificent Seven," the market began a visible and sustained rotation toward smaller-capitalization and value-oriented equities beginning in earnest in August 2025. Equal-weight measures of the S&P 500 reached new all-time highs as breadth improved and capital began flowing into a wider array of companies. For an index that had derived a disproportionate share of its returns from a narrow cluster of AI-driven growth names, this represented a structurally important rebalancing of market participation.
The Federal Reserve provided a constructive backdrop for the rotation. After holding rates steady for much of the year as it assessed the residual inflationary impact of tariffs, the Fed resumed its easing cycle in September 2025 with three consecutive 25-basis-point cuts, bringing the federal funds rate to a range of 3.50% to 3.75% by December. While inflation remained persistently above the 2% target due in part to tariff-related price pressures, the Fed characterized its posture as deliberately cautious, with the December dot plot signaling only limited additional cuts in 2026. The easing cycle nonetheless provided meaningful relief to rate-sensitive segments of the market, particularly smaller companies carrying floating-rate debt, and reinforced the fundamental case for the broadening of equity market leadership. Heading into 2026, the Fed entered a wait-and-see mode as the committee faced the additional uncertainty of a pending leadership transition upon the expiration of Chair Powell's term in May.
Fixed income markets reflected a similar narrative of modest easing tempered by ongoing uncertainty. The Bloomberg U.S. Aggregate Bond Index posted positive returns over the period as the rate cuts fed through to intermediate maturities, though the overall magnitude of gains was constrained by inflation stickiness and a market that remained skeptical of aggressive further easing. Credit markets were broadly constructive, with spread-sensitive sectors outperforming pure duration as investors remained willing to take on incremental credit risk in a still-growing economy.
The Fund Class C Shares returned 7.78% for the 7-month period ending February 28, 2026, while the 60% S&P 500 Index/40% Bloomberg U.S. Aggregate Bond Index (the "60/40 Benchmark") returned 7.67%. During the same period, the S&P 500 large cap equity market index and Bloomberg U.S. Aggregate Bond Index returned 9.30% and 5.23%, respectively.
The Beacon Economic Index® (BEI) maintained a balanced reading of approximately 0.50 to 0.55 beta throughout the period, reflecting a macro environment that was neither deteriorating nor broadly accelerating. While this positioning kept the portfolio meaningfully invested in risk assets and participating in the period's overall market gains, it also informed a deliberate decision to diversify the equity allocation away from concentrated large-cap growth exposure. Rather than mirroring benchmark-level weights to the S&P 500, the portfolio was structured to broaden its equity base, incorporating exposure to small- and mid-cap equities and free cash flow-oriented strategies, in anticipation of exactly the rotation that played out. This active equity allocation decision proved consequential as the composition of the equity exposure was better positioned to benefit from the broadening of market leadership away from large-cap growth.
Performance attribution for the period reflects this dynamic clearly. At the asset class level, security selection within domestic equities was the primary driver of relative outperformance, more than offsetting a modest drag from the portfolio's allocation underweight to domestic equities relative to the 60/40 Benchmark.
How has the Fund performed over the last ten years?
Total Return Based on $10,000 Investment
Table Summary | Beacon Dynamic Allocation Fund | S&P 500® Index | Bloomberg U.S. Aggregate Bond Index | 60% S&P500TR/40% BB US Aggregate |
|---|
Feb-2016 | $10,000 | $10,000 | $10,000 | $10,000 |
|---|
Feb-2017 | $11,463 | $12,498 | $10,142 | $11,510 |
|---|
Feb-2018 | $12,746 | $14,635 | $10,193 | $12,690 |
|---|
Feb-2019 | $12,738 | $15,320 | $10,516 | $13,249 |
|---|
Feb-2020 | $13,057 | $16,575 | $11,744 | $14,566 |
|---|
Feb-2021 | $13,990 | $21,761 | $11,907 | $17,348 |
|---|
Feb-2022 | $14,723 | $25,327 | $11,592 | $18,836 |
|---|
Feb-2023 | $13,810 | $23,379 | $10,465 | $17,299 |
|---|
Feb-2024 | $15,337 | $30,499 | $10,813 | $20,590 |
|---|
Feb-2025 | $16,826 | $36,113 | $11,441 | $23,327 |
|---|
Feb-2026 | $18,220 | $42,249 | $12,158 | $26,297 |
|---|
Average Annual Total Returns
Table Summary | 7 months | 1 Year | 5 Years | 10 Years |
|---|
Beacon Dynamic Allocation Fund | 7.78% | 8.29% | 5.43% | 6.18% |
|---|
60% S&P500TR/40% BB US Aggregate | 7.67% | 12.73% | 8.67% | 10.15% |
|---|
Bloomberg U.S. Aggregate Bond Index | 5.23% | 6.26% | 0.42% | 1.97% |
|---|
S&P 500® Index | 9.30% | 16.99% | 14.19% | 15.50% |
|---|
The Fund’s past performance is not a good predictor of how the Fund will perform in the future. The graph and table do not reflect the deduction of taxes that a shareholder would pay on fund distributions or redemption of fund shares. For updated performance call (866) 439-9093.
- Net Assets$70,965,076
- Number of Portfolio Holdings12
- Advisory Fee (net of waivers)$169,792
- Portfolio Turnover34%
Asset Weighting (% of total investments)
Table SummaryValue | Value |
|---|
Exchange-Traded Funds | 98.4% |
Money Market Funds | 1.6% |
What did the Fund invest in?
Sector Weighting (% of net assets)
Table SummaryValue | Value |
|---|
Liabilities in Excess of Other Assets | -0.1% |
Money Market Funds | 1.6% |
Alternative | 3.1% |
Fixed Income | 39.2% |
Equity | 56.2% |
Top 10 Holdings (% of net assets)
Table SummaryHolding Name | % of Net Assets |
|---|
VictoryShares Free Cash Flow ETF | 14.1% |
|---|
State Street SPDR Portfolio S&P 500 ETF | 13.6% |
|---|
State Street SPDR Portfolio S&P 1500 Composite Stock Market ETF | 13.5% |
|---|
PIMCO Enhanced Low Duration Active ETF | 11.6% |
|---|
PIMCO Multisector Bond Active ETF | 10.1% |
|---|
T Rowe Price Small-Mid Cap ETF | 10.0% |
|---|
State Street SPDR Bloomberg Investment Grade Floating Rate ETF | 8.0% |
|---|
Astoria US Equal Weight Quality Kings ETF | 5.0% |
|---|
Janus Henderson AAA CLO ETF | 5.0% |
|---|
Angel Oak Income ETF | 4.5% |
|---|
The Beacon Dynamic Allocation Fund, a series of Northern Lights Fund Trust II, is the successor to the Astor Dynamic Allocation Fund and Astor Sector Allocation Fund, each a series of Northern Lights Fund Trust, (the “Predecessor Funds), pursuant to a reorganization that took place after the close of business on February 13, 2026. The Fund's fiscal year end changed from July 31 to February 28, effective February 13, 2026.
Beacon Dynamic Allocation Fund - Class C (BCMCX)
Annual Shareholder Report - February 28, 2026
Where can I find additional information about the Fund?
Additional information is available on the Fund's website (https://beaconinvestingfunds.com/beacon-dynamic-allocation/), including its:
Prospectus
Financial information
Holdings
Proxy voting information
Beacon Dynamic Allocation Fund
Annual Shareholder Report - February 28, 2026
This annual shareholder report contains important information about Beacon Dynamic Allocation Fund for the period of August 1, 2025 to February
28, 2026. You can find additional information about the Fund at https://beaconinvestingfunds.com/beacon-dynamic-allocation/. You can also request this information by contacting us at (866) 439-9093. This report describes change to the Fund that occurred during the reporting period.
What were the Fund’s costs for the last year?
(based on a hypothetical $10,000 investment)
Table SummaryFund Name | Costs of a $10,000 investment | Costs paid as a percentage of a $10,000 investment |
|---|
Beacon Dynamic Allocation Fund | $70 | 1.15%Footnote Reference* |
|---|
| Footnote | Description |
Footnote* | Annualized for periods less than 1 year. |
How did the Fund perform during the reporting period?
The seven-month period ending February 28, 2026 was defined by a meaningful shift in equity market leadership that had been building since mid-2025. After years of outsized concentration among a handful of mega-cap technology companies, most notably the so-called "Magnificent Seven," the market began a visible and sustained rotation toward smaller-capitalization and value-oriented equities beginning in earnest in August 2025. Equal-weight measures of the S&P 500 reached new all-time highs as breadth improved and capital began flowing into a wider array of companies. For an index that had derived a disproportionate share of its returns from a narrow cluster of AI-driven growth names, this represented a structurally important rebalancing of market participation.
The Federal Reserve provided a constructive backdrop for the rotation. After holding rates steady for much of the year as it assessed the residual inflationary impact of tariffs, the Fed resumed its easing cycle in September 2025 with three consecutive 25-basis-point cuts, bringing the federal funds rate to a range of 3.50% to 3.75% by December. While inflation remained persistently above the 2% target due in part to tariff-related price pressures, the Fed characterized its posture as deliberately cautious, with the December dot plot signaling only limited additional cuts in 2026. The easing cycle nonetheless provided meaningful relief to rate-sensitive segments of the market, particularly smaller companies carrying floating-rate debt, and reinforced the fundamental case for the broadening of equity market leadership. Heading into 2026, the Fed entered a wait-and-see mode as the committee faced the additional uncertainty of a pending leadership transition upon the expiration of Chair Powell's term in May.
Fixed income markets reflected a similar narrative of modest easing tempered by ongoing uncertainty. The Bloomberg U.S. Aggregate Bond Index posted positive returns over the period as the rate cuts fed through to intermediate maturities, though the overall magnitude of gains was constrained by inflation stickiness and a market that remained skeptical of aggressive further easing. Credit markets were broadly constructive, with spread-sensitive sectors outperforming pure duration as investors remained willing to take on incremental credit risk in a still-growing economy.
The Fund Class I Shares returned 8.39% for the 7-month period ending February 28, 2026, while the 60% S&P 500 Index/40% Bloomberg U.S. Aggregate Bond Index (the "60/40 Benchmark") returned 7.67%. During the same period, the S&P 500 large cap equity market index and Bloomberg U.S. Aggregate Bond Index returned 9.30% and 5.23%, respectively.
The Beacon Economic Index® (BEI) maintained a balanced reading of approximately 0.50 to 0.55 beta throughout the period, reflecting a macro environment that was neither deteriorating nor broadly accelerating. While this positioning kept the portfolio meaningfully invested in risk assets and participating in the period's overall market gains, it also informed a deliberate decision to diversify the equity allocation away from concentrated large-cap growth exposure. Rather than mirroring benchmark-level weights to the S&P 500, the portfolio was structured to broaden its equity base, incorporating exposure to small- and mid-cap equities and free cash flow-oriented strategies, in anticipation of exactly the rotation that played out. This active equity allocation decision proved consequential as the composition of the equity exposure was better positioned to benefit from the broadening of market leadership away from large-cap growth.
Performance attribution for the period reflects this dynamic clearly. At the asset class level, security selection within domestic equities was the primary driver of relative outperformance, more than offsetting a modest drag from the portfolio's allocation underweight to domestic equities relative to the 60/40 Benchmark.
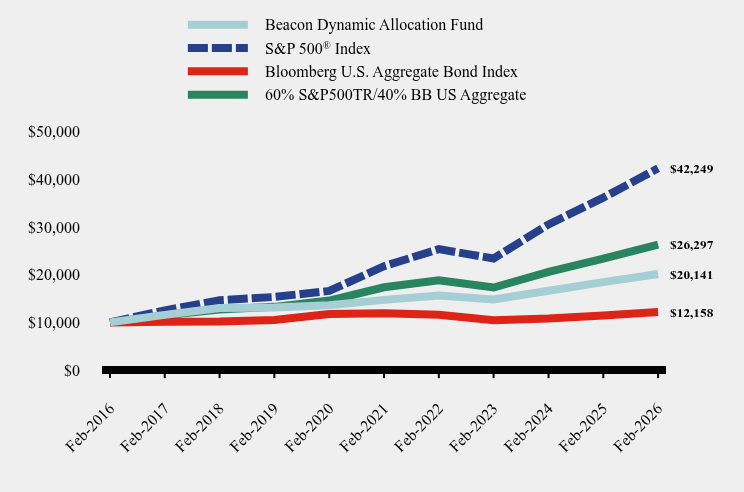
How has the Fund performed over the last ten years?
Total Return Based on $10,000 Investment
Table Summary | Beacon Dynamic Allocation Fund | S&P 500® Index | Bloomberg U.S. Aggregate Bond Index | 60% S&P500TR/40% BB US Aggregate |
|---|
Feb-2016 | $10,000 | $10,000 | $10,000 | $10,000 |
|---|
Feb-2017 | $11,572 | $12,498 | $10,142 | $11,510 |
|---|
Feb-2018 | $13,001 | $14,635 | $10,193 | $12,690 |
|---|
Feb-2019 | $13,131 | $15,320 | $10,516 | $13,249 |
|---|
Feb-2020 | $13,588 | $16,575 | $11,744 | $14,566 |
|---|
Feb-2021 | $14,713 | $21,761 | $11,907 | $17,348 |
|---|
Feb-2022 | $15,630 | $25,327 | $11,592 | $18,836 |
|---|
Feb-2023 | $14,813 | $23,379 | $10,465 | $17,299 |
|---|
Feb-2024 | $16,611 | $30,499 | $10,813 | $20,590 |
|---|
Feb-2025 | $18,416 | $36,113 | $11,441 | $23,327 |
|---|
Feb-2026 | $20,141 | $42,249 | $12,158 | $26,297 |
|---|
Average Annual Total Returns
Table Summary | 7 months | 1 Year | 5 Years | 10 Years |
|---|
Beacon Dynamic Allocation Fund | 8.39% | 9.37% | 6.48% | 7.25% |
|---|
60% S&P500TR/40% BB US Aggregate | 7.67% | 12.73% | 8.67% | 10.15% |
|---|
Bloomberg U.S. Aggregate Bond Index | 5.23% | 6.26% | 0.42% | 1.97% |
|---|
S&P 500® Index | 9.30% | 16.99% | 14.19% | 15.50% |
|---|
The Fund’s past performance is not a good predictor of how the Fund will perform in the future. The graph and table do not reflect the deduction of taxes that a shareholder would pay on fund distributions or redemption of fund shares. For updated performance call (866) 439-9093.
- Net Assets$70,965,076
- Number of Portfolio Holdings12
- Advisory Fee (net of waivers)$169,792
- Portfolio Turnover34%
Asset Weighting (% of total investments)
Table SummaryValue | Value |
|---|
Exchange-Traded Funds | 98.4% |
Money Market Funds | 1.6% |
What did the Fund invest in?
Sector Weighting (% of net assets)
Table SummaryValue | Value |
|---|
Liabilities in Excess of Other Assets | -0.1% |
Money Market Funds | 1.6% |
Alternative | 3.1% |
Fixed Income | 39.2% |
Equity | 56.2% |
Top 10 Holdings (% of net assets)
Table SummaryHolding Name | % of Net Assets |
|---|
VictoryShares Free Cash Flow ETF | 14.1% |
|---|
State Street SPDR Portfolio S&P 500 ETF | 13.6% |
|---|
State Street SPDR Portfolio S&P 1500 Composite Stock Market ETF | 13.5% |
|---|
PIMCO Enhanced Low Duration Active ETF | 11.6% |
|---|
PIMCO Multisector Bond Active ETF | 10.1% |
|---|
T Rowe Price Small-Mid Cap ETF | 10.0% |
|---|
State Street SPDR Bloomberg Investment Grade Floating Rate ETF | 8.0% |
|---|
Astoria US Equal Weight Quality Kings ETF | 5.0% |
|---|
Janus Henderson AAA CLO ETF | 5.0% |
|---|
Angel Oak Income ETF | 4.5% |
|---|
The Beacon Dynamic Allocation Fund, a series of Northern Lights Fund Trust II, is the successor to the Astor Dynamic Allocation Fund and Astor Sector Allocation Fund, each a series of Northern Lights Fund Trust, (the “Predecessor Funds), pursuant to a reorganization that took place after the close of business on February 13, 2026. The Fund's fiscal year end changed from July 31 to February 28, effective February 13, 2026.
Beacon Dynamic Allocation Fund - Class I (BCMDX)
Annual Shareholder Report - February 28, 2026
Where can I find additional information about the Fund?
Additional information is available on the Fund's website (https://beaconinvestingfunds.com/beacon-dynamic-allocation/), including its:
Prospectus
Financial information
Holdings
Proxy voting information
Item
2. Code of Ethics.
| (a) |
The
registrant has, as of the end of the period covered by this report, adopted a code of ethics that applies to the registrant’s principal
executive officer, principal financial officer, and principal accounting officer or controller, or persons performing similar functions,
regardless of whether these individuals are employed by the registrant or a third party. |
| |
|
| (b) |
Not
applicable |
| |
|
| (c) |
During
the period covered by this report, there were no amendments to any provision of the code of ethics. |
| |
|
| (d) |
During
the period covered by this report, there were no waivers or implicit waivers of a provision of the code of ethics. |
| |
|
| (e) |
Not
applicable |
| |
|
| (f) |
See
Item 19(a)(1) |
Item
3. Audit Committee Financial Expert.
(a)(1)
The Registrant’s board of trustees has determined that Keith Rhoades is an audit committee financial expert, as defined in Item
3 of Form N-CSR. Mr. Rhoades is independent for purposes of this Item 3.
(a)(2)
Not applicable.
(a)(3)
Not applicable.
Item
4. Principal Accountant Fees and Services.
| (a) |
Audit
Fees. The aggregate fees billed for each of the last two fiscal years for professional services rendered by the registrant’s principal
accountant for the audit of the registrant’s annual financial statements or services that are normally provided by the accountant
in connection with statutory and regulatory filings or engagements for those fiscal years are as follows: |
| (b) |
Audit-Related
Fees. There were no fees billed in each of the last two fiscal years for assurances and related services by the principal accountant that
are reasonably related to the performance of the audit of the registrant’s financial statements and are not reported under paragraph
(a) of this item. |
| (c) |
Tax
Fees. The aggregate fees billed in each of the last two fiscal years for professional services rendered by the principal accountant for
tax compliance are as follows: |
| |
2026
– $2,750 |
| |
|
| |
Preparation
of Federal & State income tax returns, assistance with calculation of required income, capital gain and excise distributions and preparation
of Federal excise tax returns. |
| (d) |
All
Other Fees. The aggregate fees billed in each of the last two fiscal years for products and services provided by the registrant’s
principal accountant, other than the services reported in paragraphs (a) through (c) of this item were $0 for the fiscal year ended February
28, 2026. |
| (e)(1) |
The
audit committee does not have pre-approval policies and procedures. Instead, the audit committee or audit committee chairman approves
on a case-by-case basis each audit or non-audit service before the principal accountant is engaged by the registrant. |
| |
|
| (e)(2) |
There
were no services described in each of paragraphs (b) through (d) of this Item that were approved by the audit committee pursuant to paragraph
(c)(7)(i)(C) of Rule 2-01 of Regulation S-X. |
| |
|
| (f) |
Not
applicable. |
| (g) |
All
non-audit fees billed by the registrant’s principal accountant for services rendered to the registrant for the fiscal year ended
February 28, 2026, respectively are disclosed in (b)-(d) above. There were no audit or non-audit services performed by the registrant’s
principal accountant for the registrant’s adviser. |
| |
|
| (h)
|
Not
applicable. |
| |
|
| (i)
|
Not
applicable. |
| |
|
| (j)
|
Not
applicable. |
Item
5. Audit Committee of Listed Registrants. Not applicable to open-end investment companies.
Item
6. Investments. Schedule of investments in securities of unaffiliated issuers is included under Item 7.
Item
7. Financial Statements and Financial Highlights for Open-End Management Investment Companies.
(a) Long
Form Financial Statements
| |
| |
| |
| |
| |
 |
| |
| |
| |
| |
| |
| Beacon
Dynamic Allocation Fund |
| (formerly
known as the Astor Dynamic Allocation Fund) |
| Class
A: BCMAX Class C: BCMCX Class I: BCMDX |
| |
| |
| |
| |
| |
| Annual
Financial Statements and Additional |
| Information |
| |
| |
| |
| February
28, 2026 |
| |
| |
| |
| |
| |
| |
| |
| |
| |
| |
| BEACON
DYNAMIC ALLOCATION FUND |
| SCHEDULE OF
INVESTMENTS |
| February 28,
2026 |
| Shares |
|
|
|
|
Fair Value |
|
| |
|
|
|
EXCHANGE-TRADED FUNDS — 98.5% |
|
|
|
|
| |
|
|
|
|
|
|
|
|
| |
|
|
|
ALTERNATIVE - 3.1% |
|
|
|
|
| |
69,968 |
|
|
iMGP DBi Managed Futures Strategy ETF |
|
$ |
2,201,893 |
|
| |
|
|
|
|
|
|
|
|
| |
|
|
|
EQUITY - 56.2% |
|
|
|
|
| |
94,515 |
|
|
Astoria US Equal Weight Quality Kings ETF |
|
|
3,566,769 |
|
| |
115,154 |
|
|
State Street SPDR Portfolio S&P 1500 Composite Stock Market ETF |
|
|
9,611,904 |
|
| |
119,118 |
|
|
State Street SPDR Portfolio S&P 500 ETF |
|
|
9,619,970 |
|
| |
180,884 |
|
|
T Rowe Price Small-Mid Cap ETF |
|
|
7,087,035 |
|
| |
247,520 |
|
|
VictoryShares Free Cash Flow ETF |
|
|
10,019,610 |
|
| |
|
|
|
|
|
|
39,905,288 |
|
| |
|
|
|
FIXED INCOME - 39.2% |
|
|
|
|
| |
152,281 |
|
|
Angel Oak Income ETF |
|
|
3,205,515 |
|
| |
70,197 |
|
|
Janus Henderson AAA CLO ETF |
|
|
3,536,525 |
|
| |
85,108 |
|
|
PIMCO Enhanced Low Duration Active ETF |
|
|
8,210,122 |
|
| |
264,970 |
|
|
PIMCO Multisector Bond Active ETF |
|
|
7,135,642 |
|
| |
184,946 |
|
|
State Street SPDR Bloomberg Investment Grade Floating Rate ETF |
|
|
5,703,735 |
|
| |
|
|
|
|
|
|
27,791,539 |
|
| |
|
|
|
|
|
|
|
|
| |
|
|
|
TOTAL EXCHANGE-TRADED FUNDS (Cost $63,572,728) |
|
|
69,898,720 |
|
| |
|
|
|
|
|
|
|
|
| |
|
|
|
SHORT-TERM INVESTMENT — 1.6% |
|
|
|
|
| |
|
|
|
MONEY MARKET FUND - 1.6% |
|
|
|
|
| |
1,162,954 |
|
|
First American
Government Obligations Fund, Class X, 3.60% (Cost $1,162,954)(a) |
|
|
1,162,954 |
|
| |
|
|
|
|
|
|
|
|
| |
|
|
|
TOTAL INVESTMENTS - 100.1% (Cost $64,735,682) |
|
$ |
71,061,674 |
|
| |
|
|
|
LIABILITIES IN EXCESS OF OTHER ASSETS – (0.1)% |
|
|
(96,598 |
) |
| |
|
|
|
NET ASSETS - 100.0% |
|
$ |
70,965,076 |
|
ETF
– Exchange Traded Fund
|
(a) |
Rate disclosed is the seven day effective
yield as of February 28, 2026. |
See
accompanying notes to financial statements.
| Beacon
Dynamic Allocation Fund |
| STATEMENT
OF ASSETS AND LIABILITIES |
| February
28, 2026 |
| ASSETS |
|
|
|
|
| Investment securities : |
|
|
|
|
| At cost |
|
$ |
64,735,682 |
|
| At value |
|
$ |
71,061,674 |
|
| Receivable due from advisor |
|
|
21,554 |
|
| Dividends and interest receivable |
|
|
28,421 |
|
| Receivable for Fund shares sold |
|
|
236 |
|
| Prepaid expenses and other assets |
|
|
6,093 |
|
| TOTAL ASSETS |
|
|
71,117,978 |
|
| |
|
|
|
|
| LIABILITIES |
|
|
|
|
| Payable to related parties |
|
|
22,043 |
|
| Distribution (12b-1) fees payable |
|
|
9,711 |
|
| Payable for Fund shares redeemed |
|
|
71,745 |
|
| Accrued expenses and other liabilities |
|
|
49,403 |
|
| TOTAL LIABILITIES |
|
|
152,902 |
|
| NET ASSETS |
|
$ |
70,965,076 |
|
| |
|
|
|
|
| Net Assets Consist Of: |
|
|
|
|
| Paid in capital ($0 par value, unlimited shares authorized) |
|
$ |
64,114,203 |
|
| Accumulated earnings |
|
|
6,850,873 |
|
| NET ASSETS |
|
$ |
70,965,076 |
|
| |
|
|
|
|
| Net Asset Value Per Share: |
|
|
|
|
| Class A Shares: |
|
|
|
|
| Net Assets |
|
$ |
14,071,636 |
|
| Shares of beneficial interest outstanding ($0 par value, unlimited
shares authorized) |
|
|
1,070,806 |
|
| Net asset value (Net Assets ÷ Shares Outstanding), and redemption
price per share |
|
$ |
13.14 |
|
| Maximum offering price per share (4.75% sales charge) |
|
$ |
13.80 |
|
| |
|
|
|
|
| Class C Shares: |
|
|
|
|
| Net Assets |
|
$ |
13,063,018 |
|
| Shares of beneficial interest outstanding ($0 par value, unlimited
shares authorized) |
|
|
1,086,588 |
|
| Net asset value (Net Assets ÷ Shares Outstanding),
offering price and redemption price per share |
|
$ |
12.02 |
|
| |
|
|
|
|
| Class I Shares: |
|
|
|
|
| Net Assets |
|
$ |
43,830,422 |
|
| Shares of beneficial interest outstanding ($0 par value, unlimited
shares authorized) |
|
|
3,312,886 |
|
| Net asset value (Net Assets ÷ Shares Outstanding),
offering price and redemption price per share |
|
$ |
13.23 |
|
See
accompanying notes to financial statements.
| Beacon
Dynamic Allocation Fund |
| STATEMENTS
OF OPERATIONS* |
| |
|
For the Period Ended |
|
|
For the Year Ended |
|
| |
|
February 28, 2026 * |
|
|
July 31, 2025 |
|
| INVESTMENT INCOME |
|
|
|
|
|
|
|
|
| Dividends |
|
$ |
1,202,230 |
|
|
$ |
2,273,734 |
|
| Interest |
|
|
17,978 |
|
|
|
52,208 |
|
| TOTAL INVESTMENT INCOME |
|
|
1,220,208 |
|
|
|
2,325,942 |
|
| |
|
|
|
|
|
|
|
|
| EXPENSES |
|
|
|
|
|
|
|
|
| Investment advisory fees |
|
|
349,636 |
|
|
|
657,588 |
|
| Distribution (12b-1) fees, Class A shares |
|
|
12,391 |
|
|
|
22,161 |
|
| Distribution (12b-1) fees, Class C shares |
|
|
70,147 |
|
|
|
136,834 |
|
| Administrative services fees |
|
|
58,089 |
|
|
|
98,319 |
|
| Transfer agent fees |
|
|
36,881 |
|
|
|
61,995 |
|
| Registration fees |
|
|
33,920 |
|
|
|
63,875 |
|
| Accounting services fees |
|
|
24,733 |
|
|
|
44,679 |
|
| Trustees fees and expenses |
|
|
23,160 |
|
|
|
15,556 |
|
| Third party administrative servicing fees |
|
|
21,477 |
|
|
|
43,081 |
|
| Legal fees |
|
|
12,186 |
|
|
|
19,944 |
|
| Audit fees |
|
|
12,113 |
|
|
|
19,944 |
|
| Compliance officer fees |
|
|
11,854 |
|
|
|
20,217 |
|
| Printing expenses |
|
|
8,790 |
|
|
|
20,944 |
|
| Custodian fees |
|
|
6,642 |
|
|
|
9,277 |
|
| Insurance expense |
|
|
1,060 |
|
|
|
1,825 |
|
| Miscellaneous expense |
|
|
2,836 |
|
|
|
4,449 |
|
| TOTAL EXPENSES |
|
|
685,915 |
|
|
|
1,240,688 |
|
| Less: Fees waived and/or expenses reimbursed
by the advisor |
|
|
(179,844 |
) |
|
|
(286,002 |
) |
| NET EXPENSES |
|
|
506,071 |
|
|
|
954,686 |
|
| NET INVESTMENT INCOME |
|
|
714,137 |
|
|
|
1,371,256 |
|
| |
|
|
|
|
|
|
|
|
| REALIZED AND UNREALIZED GAIN FROM INVESTMENTS |
|
|
|
|
|
|
|
|
| Net realized gain from security transactions |
|
|
2,789,928 |
|
|
|
3,626,815 |
|
| Distributions of realized gains by underlying investment companies |
|
|
1,344 |
|
|
|
1,053 |
|
| Net change in net unrealized appreciation on
investments |
|
|
1,566,142 |
(a) |
|
|
(837,312 |
) |
| NET REALIZED AND UNREALIZED
GAIN FROM INVESTMENTS |
|
|
4,357,414 |
|
|
|
2,790,556 |
|
| |
|
|
|
|
|
|
|
|
| NET INCREASE IN NET ASSETS RESULTING FROM OPERATIONS |
|
$ |
5,071,551 |
|
|
$ |
4,161,812 |
|
|
* |
The Fund’s fiscal year end changed
from July 31 to February 28, effective February 13, 2026. Therefore, period represented is from August 1, 2025 through February 28, 2026. |
|
(a) |
Change in unrealized appreciation
(depreciation) does not include net unrealized appreciation (depreciation) of $802,255 in connection with the Fund’s reorganization.
See Note 6 in the Notes to Financial Statements. |
See
accompanying notes to financial statements.
| Beacon
Dynamic Allocation Fund |
| STATEMENTS
OF CHANGES IN NET ASSETS |
| |
|
For the |
|
|
For the |
|
|
For the |
|
| |
|
Period Ended |
|
|
Year Ended |
|
|
Year Ended |
|
| |
|
February 28, 2026 * |
|
|
July 31, 2025 |
|
|
July 31, 2024 |
|
| FROM OPERATIONS |
|
|
|
|
|
|
|
|
|
|
|
|
| Net investment income |
|
$ |
714,137 |
|
|
$ |
1,371,256 |
|
|
$ |
2,188,086 |
|
| Net realized gain from security transactions |
|
|
2,789,928 |
|
|
|
3,626,815 |
|
|
|
4,883,595 |
|
| Distributions of long term capital gains from underlying investment
companies |
|
|
1,344 |
|
|
|
1,053 |
|
|
|
1,364 |
|
| Net change in unrealized appreciation (depreciation)
on investments |
|
|
1,566,142 |
|
|
|
(837,312 |
) |
|
|
2,059,485 |
|
| Net increase in net assets resulting from operations |
|
|
5,071,551 |
|
|
|
4,161,812 |
|
|
|
9,132,530 |
|
| |
|
|
|
|
|
|
|
|
|
|
|
|
| DISTRIBUTIONS TO SHAREHOLDERS |
|
|
|
|
|
|
|
|
|
|
|
|
| Class A |
|
|
(521,812 |
) |
|
|
(878,980 |
) |
|
|
(186,751 |
) |
| Class C |
|
|
(790,905 |
) |
|
|
(1,416,733 |
) |
|
|
(211,701 |
) |
| Class I |
|
|
(2,750,713 |
) |
|
|
(4,748,796 |
) |
|
|
(1,117,476 |
) |
| Total distributions to shareholders |
|
|
(4,063,430 |
) |
|
|
(7,044,509 |
) |
|
|
(1,515,928 |
) |
| |
|
|
|
|
|
|
|
|
|
|
|
|
| FROM SHARES OF BENEFICIAL INTEREST |
|
|
|
|
|
|
|
|
|
|
|
|
| Proceeds from shares sold |
|
|
|
|
|
|
|
|
|
|
|
|
| Class A |
|
|
897,959 |
|
|
|
461,504 |
|
|
|
1,448,583 |
|
| Class C |
|
|
52,985 |
|
|
|
81,582 |
|
|
|
374,562 |
|
| Class I |
|
|
2,778,563 |
|
|
|
9,338,132 |
|
|
|
11,824,076 |
|
| Proceeds
issued in connection with reorganization (1) |
|
|
|
|
|
|
|
|
|
|
|
|
| Class A |
|
|
6,195,688 |
|
|
|
— |
|
|
|
— |
|
| Class C |
|
|
2,058,510 |
|
|
|
— |
|
|
|
— |
|
| Class I |
|
|
5,711,486 |
|
|
|
— |
|
|
|
— |
|
| Distributions reinvested |
|
|
|
|
|
|
|
|
|
|
|
|
| Class A |
|
|
476,120 |
|
|
|
797,611 |
|
|
|
163,807 |
|
| Class C |
|
|
709,934 |
|
|
|
1,274,435 |
|
|
|
188,026 |
|
| Class I |
|
|
2,185,013 |
|
|
|
3,690,484 |
|
|
|
731,421 |
|
| Cost of shares redeemed |
|
|
|
|
|
|
|
|
|
|
|
|
| Class A |
|
|
(1,746,345 |
) |
|
|
(3,163,947 |
) |
|
|
(2,224,770 |
) |
| Class C |
|
|
(2,159,248 |
) |
|
|
(3,595,174 |
) |
|
|
(3,612,390 |
) |
| Class I |
|
|
(12,657,606 |
) |
|
|
(14,068,580 |
) |
|
|
(43,935,313 |
) |
| Net increase (decrease) in net assets from shares
of beneficial interest |
|
|
4,503,059 |
|
|
|
(5,183,953 |
) |
|
|
(35,041,998 |
) |
| |
|
|
|
|
|
|
|
|
|
|
|
|
| TOTAL DECREASE IN NET ASSETS |
|
|
5,511,180 |
|
|
|
(8,066,650 |
) |
|
|
(27,425,396 |
) |
| |
|
|
|
|
|
|
|
|
|
|
|
|
| NET ASSETS |
|
|
|
|
|
|
|
|
|
|
|
|
| Beginning of Period |
|
|
65,453,896 |
|
|
|
73,520,546 |
|
|
|
100,945,942 |
|
| End of Period |
|
$ |
70,965,076 |
|
|
$ |
65,453,896 |
|
|
$ |
73,520,546 |
|
|
* |
The Fund’s fiscal year end changed
from July 31 to February 28, effective February 13, 2026. Therefore, period represented is from August 1, 2025 through February 28, 2026.
The Fund is the successor to the Astor Dynamic Allocation Fund and Astor Sector Allocation Fund, each a series of Northern Lights Fund
Trust, (the “Predecessor Funds), pursuant to a reorganization that took place after the close of business on February 13, 2026. |
See
accompanying notes to financial statements.
| Beacon
Dynamic Allocation Fund |
| STATEMENTS
OF CHANGES IN NET ASSETS (Continued) |
| |
|
For the |
|
|
For the |
|
|
For the |
|
| |
|
Period Ended |
|
|
Year Ended |
|
|
Year Ended |
|
| |
|
February 28, 2026 * |
|
|
July 31, 2025 |
|
|
July 31, 2024 |
|
| SHARE ACTIVITY |
|
|
|
|
|
|
|
|
|
|
|
|
| Class A: |
|
|
|
|
|
|
|
|
|
|
|
|
| Shares Sold |
|
|
67,531 |
|
|
|
35,870 |
|
|
|
115,655 |
|
| Shares
issued in connection with reorganization (1) |
|
|
473,409 |
|
|
|
— |
|
|
|
— |
|
| Shares Reinvested |
|
|
36,093 |
|
|
|
63,125 |
|
|
|
12,842 |
|
| Shares Redeemed |
|
|
(130,645 |
) |
|
|
(239,264 |
) |
|
|
(177,417 |
) |
| Net increase (decrease) in shares of beneficial
interest outstanding |
|
|
446,388 |
|
|
|
(140,269 |
) |
|
|
(48,920 |
) |
| |
|
|
|
|
|
|
|
|
|
|
|
|
| Class C: |
|
|
|
|
|
|
|
|
|
|
|
|
| Shares Sold |
|
|
4,343 |
|
|
|
6,719 |
|
|
|
30,894 |
|
| Shares
issued in connection with reorganization (1) |
|
|
171,879 |
|
|
|
— |
|
|
|
— |
|
| Shares Reinvested |
|
|
58,765 |
|
|
|
109,576 |
|
|
|
15,902 |
|
| Shares Redeemed |
|
|
(176,023 |
) |
|
|
(296,484 |
) |
|
|
(304,418 |
) |
| Net increase (decrease) in shares of beneficial
interest outstanding |
|
|
58,964 |
|
|
|
(180,189 |
) |
|
|
(257,622 |
) |
| |
|
|
|
|
|
|
|
|
|
|
|
|
| Class I: |
|
|
|
|
|
|
|
|
|
|
|
|
| Shares Sold |
|
|
205,463 |
|
|
|
716,590 |
|
|
|
938,150 |
|
| Shares
issued in connection with reorganization (1) |
|
|
433,519 |
|
|
|
— |
|
|
|
— |
|
| Shares Reinvested |
|
|
164,660 |
|
|
|
290,695 |
|
|
|
57,851 |
|
| Shares Redeemed |
|
|
(941,461 |
) |
|
|
(1,074,020 |
) |
|
|
(3,412,105 |
) |
| Net decrease in shares of beneficial interest
outstanding |
|
|
(137,819 |
) |
|
|
(66,735 |
) |
|
|
(2,416,104 |
) |
|
* |
The Fund’s fiscal year end changed
from July 31 to February 28, effective February 13, 2026. Therefore, period represented is from August 1, 2025 through February 28, 2026.
The Fund is the successor to the Astor Dynamic Allocation Fund and Astor Sector Allocation Fund, each a series of Northern Lights Fund
Trust, (the “Predecessor Funds), pursuant to a reorganization that took place after the close of business on February 13, 2026. |
See
accompanying notes to financial statements.
| Beacon
Dynamic Allocation Fund |
| FINANCIAL
HIGHLIGHTS |
| |
| Per
Share Data and Ratios for a Share of Beneficial Interest Outstanding Throughout Each Period/Year Presented |
| |
|
Class A |
|
| |
|
Period Ended |
|
|
Year Ended |
|
|
Year Ended |
|
|
Year Ended |
|
|
Year Ended |
|
|
Year Ended |
|
| |
|
February 28 |
|
|
July 31, |
|
|
July 31, |
|
|
July 31, |
|
|
July 31, |
|
|
July 31, |
|
| |
|
2026* |
|
|
2025 |
|
|
2024 |
|
|
2023 |
|
|
2022 |
|
|
2021 |
|
| Net asset value, beginning of period/year |
|
$ |
12.98 |
|
|
$ |
13.55 |
|
|
$ |
12.40 |
|
|
$ |
12.39 |
|
|
$ |
15.13 |
|
|
$ |
12.86 |
|
| Activity from investment operations: |
|
|
|
|
|
|
|
|
|
|
|
|
|
|
|
|
|
|
|
|
|
|
|
|
| Net investment income (1) |
|
|
0.14 |
|
|
|
0.26 |
|
|
|
0.31 |
|
|
|
0.23 |
|
|
|
0.03 |
|
|
|
0.03 |
|
| Net realized and unrealized gain (loss) on investments |
|
|
0.92 |
|
|
|
0.54 |
|
|
|
1.08 |
|
|
|
0.32 |
|
|
|
(0.85 |
) |
|
|
2.30 |
|
| Total from investment operations |
|
|
1.06 |
|
|
|
0.80 |
|
|
|
1.39 |
|
|
|
0.55 |
|
|
|
(0.82 |
) |
|
|
2.33 |
|
| Less distributions from: |
|
|
|
|
|
|
|
|
|
|
|
|
|
|
|
|
|
|
|
|
|
|
|
|
| Net investment income |
|
|
(0.16 |
) |
|
|
(0.49 |
) |
|
|
(0.24 |
) |
|
|
(0.18 |
) |
|
|
(0.06 |
) |
|
|
(0.04 |
) |
| Net realized gains |
|
|
(0.74 |
) |
|
|
(0.88 |
) |
|
|
0.00 |
|
|
|
(0.36 |
) |
|
|
(1.86 |
) |
|
|
(0.02 |
) |
| Total distributions |
|
|
(0.90 |
) |
|
|
(1.37 |
) |
|
|
(0.24 |
) |
|
|
(0.54 |
) |
|
|
(1.92 |
) |
|
|
(0.06 |
) |
| Net asset value, end of period/year |
|
$ |
13.14 |
|
|
$ |
12.98 |
|
|
$ |
13.55 |
|
|
$ |
12.40 |
|
|
$ |
12.39 |
|
|
$ |
15.13 |
|
| Total return (2) |
|
|
8.22 |
% (8) |
|
|
6.33 |
% |
|
|
11.35 |
% |
|
|
4.65 |
% |
|
|
(6.59 |
)% |
|
|
18.20 |
% |
| Net assets, at end of period/year (000s) |
|
$ |
14,072 |
|
|
$ |
8,104 |
|
|
$ |
10,365 |
|
|
$ |
10,086 |
|
|
$ |
10,469 |
|
|
$ |
11,834 |
|
| Ratio of gross expenses to average net assets (3)(4) |
|
|
1.88 |
% (9) |
|
|
1.81 |
% |
|
|
1.67 |
% (6) |
|
|
1.67 |
% |
|
|
1.58 |
% |
|
|
1.59 |
% |
| Ratio of net expenses to average net assets (4) |
|
|
1.40 |
% (9) |
|
|
1.40 |
% |
|
|
1.41 |
% (7) |
|
|
1.40 |
% |
|
|
1.40 |
% |
|
|
1.40 |
% |
| Ratio of net investment income to average net assets (4)(5) |
|
|
1.80 |
% (9) |
|
|
1.98 |
% |
|
|
2.43 |
% |
|
|
1.89 |
% |
|
|
0.20 |
% |
|
|
0.21 |
% |
| Portfolio Turnover Rate |
|
|
34 |
% (8) |
|
|
142 |
% |
|
|
151 |
% |
|
|
73 |
% |
|
|
122 |
% |
|
|
111 |
% |
|
* |
The Fund’s
fiscal year end changed from July 31 to February 28, effective February 13, 2026. Therefore, period represented is from August 1, 2025
through February 28, 2026. |
|
(1) |
Per share amounts calculated using
the average shares method, which more appropriately presents the per share data for the period/year. |
|
(2) |
Total returns are historical in nature
and assume changes in share price, reinvestment of dividends and capital gains distributions, if any, and excludes any sales charges (loads)
and redemption fees. |
|
(3) |
Represents the ratio of expenses to
average net assets absent fee waivers and/or expense reimbursements by the advisor and affiliates. |
|
(4) |
Does not include the expenses of other
investment companies in which the Fund invests. |
|
(5) |
Recognition of net investment income
by the Fund is affected by the timing of the declaration of dividends by the underlying investment companies in which the Fund invests. |
|
(6) |
Gross expenses before waivers (excluding
overdraft custody expense of 0.01%) was 1.66% for the year ended July 31, 2024. |
|
(7) |
Net expenses after waivers (excluding
overdraft custody expense of 0.01%) was 1.40% for the year ended July 31, 2024. |
See
accompanying notes to financial statements.
| Beacon
Dynamic Allocation Fund |
| FINANCIAL
HIGHLIGHTS |
| |
| Per
Share Data and Ratios for a Share of Beneficial Interest Outstanding Throughout Each Period/Year Presented |
| |
|
Class C |
|
| |
|
Period Ended |
|
|
Year Ended |
|
|
Year Ended |
|
|
Year Ended |
|
|
Year Ended |
|
|
Year Ended |
|
| |
|
February 28 |
|
|
July 31, |
|
|
July 31, |
|
|
July 31, |
|
|
July 31, |
|
|
July 31, |
|
| |
|
2026* |
|
|
2025 |
|
|
2024 |
|
|
2023 |
|
|
2022 |
|
|
2021 |
|
| Net asset value, beginning of period/year |
|
$ |
11.95 |
|
|
$ |
12.60 |
|
|
$ |
11.55 |
|
|
$ |
11.60 |
|
|
$ |
14.33 |
|
|
$ |
12.26 |
|
| Activity from investment operations: |
|
|
|
|
|
|
|
|
|
|
|
|
|
|
|
|
|
|
|
|
|
|
|
|
| Net investment income (loss) (1) |
|
|
0.08 |
|
|
|
0.15 |
|
|
|
0.20 |
|
|
|
0.13 |
|
|
|
(0.07 |
) |
|
|
(0.08 |
) |
| Net realized and unrealized gain (loss) on investments |
|
|
0.84 |
|
|
|
0.49 |
|
|
|
1.02 |
|
|
|
0.28 |
|
|
|
(0.79 |
) |
|
|
2.19 |
|
| Total from investment operations |
|
|
0.92 |
|
|
|
0.64 |
|
|
|
1.22 |
|
|
|
0.41 |
|
|
|
(0.86 |
) |
|
|
2.11 |
|
| Less distributions from: |
|
|
|
|
|
|
|
|
|
|
|
|
|
|
|
|
|
|
|
|
|
|
|
|
| Net Investment income |
|
|
(0.11 |
) |
|
|
(0.41 |
) |
|
|
(0.17 |
) |
|
|
(0.10 |
) |
|
|
(0.01 |
) |
|
|
(0.02 |
) |
| Net realized gains |
|
|
(0.74 |
) |
|
|
(0.88 |
) |
|
|
— |
|
|
|
(0.36 |
) |
|
|
(1.86 |
) |
|
|
(0.02 |
) |
| Total distributions |
|
|
(0.85 |
) |
|
|
(1.29 |
) |
|
|
(0.17 |
) |
|
|
(0.46 |
) |
|
|
(1.87 |
) |
|
|
(0.04 |
) |
| Net asset value, end of period/year |
|
$ |
12.02 |
|
|
$ |
11.95 |
|
|
$ |
12.60 |
|
|
$ |
11.55 |
|
|
$ |
11.60 |
|
|
$ |
14.33 |
|
| Total return (2) |
|
|
7.78 |
% (8) |
|
|
5.43 |
% |
|
|
10.62 |
% |
|
|
3.79 |
% |
|
|
(7.22 |
)% |
|
|
17.25 |
% |
| Net assets, at end of period/year (000s) |
|
$ |
13,063 |
|
|
$ |
12,284 |
|
|
$ |
15,215 |
|
|
$ |
16,929 |
|
|
$ |
22,446 |
|
|
$ |
31,288 |
|
| Ratio of gross expenses to average net assets (3)(4) |
|
|
2.64 |
% (9) |
|
|
2.56 |
% |
|
|
2.42 |
% (6) |
|
|
2.42 |
% |
|
|
2.33 |
% |
|
|
2.34 |
% |
| Ratio of net expenses to average net assets (4) |
|
|
2.15 |
% (9) |
|
|
2.15 |
% |
|
|
2.16 |
% (7) |
|
|
2.15 |
% |
|
|
2.15 |
% |
|
|
2.15 |
% |
| Ratio of net investment income (loss) to average net assets (4)(5) |
|
|
1.16 |
% (9) |
|
|
1.22 |
% |
|
|
1.68 |
% |
|
|
1.15 |
% |
|
|
(0.55 |
)% |
|
|
(0.55 |
)% |
| Portfolio Turnover Rate |
|
|
34 |
% (8) |
|
|
142 |
% |
|
|
151 |
% |
|
|
73 |
% |
|
|
122 |
% |
|
|
111 |
% |
|
* |
The Fund’s
fiscal year end changed from July 31 to February 28, effective February 13, 2026. Therefore, period represented is from August 1, 2025
through February 28, 2026. |
|
(1) |
Per share amounts calculated using
the average shares method, which more appropriately presents the per share data for the period/year. |
|
(2) |
Total returns are historical in nature
and assume changes in share price, reinvestment of dividends and capital gains distributions, if any, and excludes any redemption fees. |
|
(3) |
Represents the ratio of expenses to
average net assets absent fee waivers and/or expense reimbursements by the advisor and affiliates. |
|
(4) |
Does not include the expenses of other
investment companies in which the Fund invests. |
|
(5) |
Recognition of net investment income
(loss) by the Fund is affected by the timing of the declaration of dividends by the underlying investment companies in which the Fund
invests. |
|
(6) |
Gross expenses before waivers (excluding
overdraft custody expense of 0.01%) was 2.41% for the year ended July 31, 2024. |
|
(7) |
Net expenses after waivers (excluding
overdraft custody expense of 0.01%) was 2.15% for the year ended July 31, 2024. |
See
accompanying notes to financial statements.
| Beacon
Dynamic Allocation Fund |
| FINANCIAL
HIGHLIGHTS |
| |
| Per
Share Data and Ratios for a Share of Beneficial Interest Outstanding Throughout Each Period/Year Presented |
| |
|
Class I |
|
| |
|
Period Ended |
|
|
Year Ended |
|
|
Year Ended |
|
|
Year Ended |
|
|
Year Ended |
|
|
Year Ended |
|
| |
|
February 28 |
|
|
July 31, |
|
|
July 31, |
|
|
July 31, |
|
|
July 31, |
|
|
July 31, |
|
| |
|
2026* |
|
|
2025 |
|
|
2024 |
|
|
2023 |
|
|
2022 |
|
|
2021 |
|
| Net asset value, beginning of period/year |
|
$ |
13.06 |
|
|
$ |
13.63 |
|
|
$ |
12.46 |
|
|
$ |
12.44 |
|
|
$ |
15.18 |
|
|
$ |
12.90 |
|
| Activity from investment operations: |
|
|
|
|
|
|
|
|
|
|
|
|
|
|
|
|
|
|
|
|
|
|
|
|
| Net investment income (1) |
|
|
0.17 |
|
|
|
0.30 |
|
|
|
0.35 |
|
|
|
0.26 |
|
|
|
0.06 |
|
|
|
0.06 |
|
| Net realized and unrealized gain (loss) on investments |
|
|
0.91 |
|
|
|
0.53 |
|
|
|
1.09 |
|
|
|
0.32 |
|
|
|
(0.86 |
) |
|
|
2.31 |
|
| Total from investment operations |
|
|
1.08 |
|
|
|
0.83 |
|
|
|
1.44 |
|
|
|
0.58 |
|
|
|
(0.80 |
) |
|
|
2.37 |
|
| Less distributions from: |
|
|
|
|
|
|
|
|
|
|
|
|
|
|
|
|
|
|
|
|
|
|
|
|
| Net investment income |
|
|
(0.17 |
) |
|
|
(0.52 |
) |
|
|
(0.27 |
) |
|
|
(0.20 |
) |
|
|
(0.08 |
) |
|
|
(0.07 |
) |
| Net realized gains |
|
|
(0.74 |
) |
|
|
(0.88 |
) |
|
|
— |
|
|
|
(0.36 |
) |
|
|
(1.86 |
) |
|
|
(0.02 |
) |
| Total distributions |
|
|
(0.91 |
) |
|
|
(1.40 |
) |
|
|
(0.27 |
) |
|
|
(0.56 |
) |
|
|
(1.94 |
) |
|
|
(0.09 |
) |
| Net asset value, end of period/year |
|
$ |
13.23 |
|
|
$ |
13.06 |
|
|
$ |
13.63 |
|
|
$ |
12.46 |
|
|
$ |
12.44 |
|
|
$ |
15.18 |
|
| Total return (2) |
|
|
8.39 |
% (8) |
|
|
6.54 |
% |
|
|
11.68 |
% |
|
|
4.93 |
% |
|
|
(6.40 |
)% |
|
|
18.49 |
% |
| Net assets, at end of period/year (000s) |
|
$ |
43,830 |
|
|
$ |
45,066 |
|
|
$ |
47,941 |
|
|
$ |
73,932 |
|
|
$ |
89,960 |
|
|
$ |
114,744 |
|
| Ratio of gross expenses to average net assets (3)(4) |
|
|
1.64 |
% (9) |
|
|
1.56 |
% |
|
|
1.42 |
% (6) |
|
|
1.42 |
% |
|
|
1.33 |
% |
|
|
1.34 |
% |
| Ratio of net expenses to average net assets (4) |
|
|
1.15 |
% (9) |
|
|
1.15 |
% |
|
|
1.16 |
% (7) |
|
|
1.15 |
% |
|
|
1.15 |
% |
|
|
1.15 |
% |
| Ratio of net investment income to average net assets (4)(5) |
|
|
2.19 |
% (9) |
|
|
2.20 |
% |
|
|
2.77 |
% |
|
|
2.15 |
% |
|
|
0.45 |
% |
|
|
0.45 |
% |
| Portfolio Turnover Rate |
|
|
34 |
% (8) |
|
|
142 |
% |
|
|
151 |
% |
|
|
73 |
% |
|
|
122 |
% |
|
|
111 |
% |
|
* |
The Fund’s
fiscal year end changed from July 31 to February 28, effective February 13, 2026. Therefore, period represented is from August 1, 2025
through February 28, 2026. |
|
(1) |
Per share amounts calculated using
the average shares method, which more appropriately presents the per share data for the period/year. |
|
(2) |
Total returns are historical in nature
and assume changes in share price, reinvestment of dividends and capital gains distributions, if any, and excludes any redemption fees. |
|
(3) |
Represents the ratio of expenses to
average net assets absent fee waivers and/or expense reimbursements by the advisor and affiliates. |
|
(4) |
Does not include the expenses of other
investment companies in which the Fund invests. |
|
(5) |
Recognition of net investment income
by the Fund is affected by the timing of the declaration of dividends by the underlying investment companies in which the Fund invests. |
|
(6) |
Gross expenses before waivers (excluding
overdraft custody expense of 0.01%) was 1.41% for the year ended July 31, 2024. |
|
(7) |
Net expenses after waivers (excluding
overdraft custody expense of 0.01%) was 1.15% for the year ended July 31, 2024. |
See
accompanying notes to financial statements.
| Beacon
Dynamic Allocation Fund |
| NOTES
TO FINANCIAL STATEMENTS |
| February
28, 2026 |
The
Beacon Dynamic Allocation Fund (the “Fund”) is a diversified series of shares of beneficial interest of Northern Lights Fund
Trust II (the “Trust”), a statutory trust organized under the laws of the State of Delaware on August 26, 2010, and registered
under the Investment Company Act of 1940, as amended (the “1940 Act”), as an open-end management investment company. The Fund
seeks total return through a combination of capital appreciation and income.
The
Fund is the successor to the Astor Dynamic Allocation Fund and Astor Sector Allocation Fund, each a series of Northern Lights Fund Trust,
(the “Predecessor Funds), pursuant to a reorganization that took place after the close of business on February 13, 2026. For accounting
and financial reporting purposes, the Astor Dynamic Allocation Fund is the accounting and performance survivor. Accordingly, the financial
statements and financial highlights reflect the historical operations of the Astor Dynamic Allocation Fund.
Prior
to February 13, 2026, the Fund was organized as a series of Northern Lights Fund Trust (the “Predecessor Trust”), a Delaware
statutory trust, and was known as the Astor Dynamic Allocation Fund (the “Predecessor Fund”). The Predecessor Fund’s Class
A shares, Class C shares and Class I shares commenced operations on November 30, 2011, March 12, 2010, and October 19, 2009, respectively.
The Predecessor Fund was reorganized from Predecessor Trust to the Trust as of the close of business on February 13, 2026, in a tax-free
transaction. The Fund and the Predecessor Fund have the same investment objective and principal investment strategies.
The
Fund currently offers Class A, Class C, and Class I shares. Class C and Class I shares are offered at net asset value. Class A shares
are offered at net asset value plus a maximum sales charge of 4.75%. Each class represents an interest in the same assets of the respective
Fund and classes of a Fund are identical except for differences in their sales charge structures and ongoing service and distribution
charges. All classes of shares of a Fund have equal voting privileges except that each class has exclusive voting rights with respect
to its service and/or distribution plans. The Fund’s income, expenses (other than class specific distribution fees), and realized
and unrealized gains and losses are allocated proportionately each day based upon the relative net assets of each class.
|
2. |
SIGNIFICANT ACCOUNTING POLICIES |
The
following is a summary of significant accounting policies followed by the Fund in preparation of its financial statements. The policies
are in conformity with U.S. generally accepted accounting principles (“GAAP”). The preparation of the financial statements requires
management to make estimates and assumptions that affect the reported amounts of assets and liabilities and disclosure of contingent assets
and liabilities at the date of the financial statements and the reported amounts of income and expenses for the period. Actual results
could differ from those estimates. The Fund is an investment company and accordingly follows the investment company accounting and reporting
guidance of the Financial Accounting Standards Board (“FASB”) Accounting Standards Codification Topic 946 “Financial Services
Investment Companies”, including Accounting Standards Update (“ASU”) 2013-08.
Operating
Segments – The Fund has adopted FASB ASU 2023-07, Segment Reporting (Topic 280) - Improvements to Reportable Segment Disclosures
(“ASU 2023-07”). Adoption of the standard impacted financial statement disclosures only and did not affect the Fund’s financial
position or the results of its operations. An operating segment is defined as a component of a public entity that engages in business
activities from which it may recognize revenues and incur expenses, has operating results that are regularly reviewed by the public entity’s
chief operating decision maker (“CODM”) to make decisions about resources to be allocated to the segment and assess its performance,
and has discrete financial information available. The CODM is comprised of the portfolio manager and Chief Financial Officer of the Trust.
The Fund operates as a single operating segment. The Fund’s income, expenses, assets, changes in net assets resulting from operations
and performance are regularly monitored and assessed as a whole by the CODM responsible for oversight functions of the Fund, using the
information presented in the financial statements and financial highlights.
| Beacon
Dynamic Allocation Fund |
| NOTES
TO FINANCIAL STATEMENTS (Continued) |
| February
28, 2026 |
Securities
Valuation – Securities listed on an exchange are valued at the last reported sale price at the close of the regular trading
session of the exchange on the business day the value is being determined or, in the case of securities listed on NASDAQ, at the NASDAQ
Official Closing Price. In the absence of a sale, such securities shall be valued at the mean between the current bid and ask prices on
the day of valuation. Debt securities (other than short-term obligations) are valued each day by an independent pricing service approved
by the Trust’s Board of Trustees (the “Board”) using methods which include current market quotations from a major market
maker in the securities and based on methods which include the consideration of yields or prices of securities of comparable quality,
coupon, maturity and type. The independent pricing service does not distinguish between smaller-sized bond positions known as “odd
lots” and larger institutional-sized bond positions known as “round lots”. A Fund may fair value a particular bond if the
advisor does not believe that the round lot value provided by the independent pricing service reflects fair value of the Fund’s holding.
Short-term debt obligations with remaining maturities in excess of sixty days are valued at current market prices by an independent pricing
service approved by the Board. Short-term debt obligations having sixty days or less remaining until maturity, at time of purchase, may
be valued at amortized cost.
The
Fund may hold investments, such as private investments, interests in commodity pools, other non-traded securities or temporarily illiquid
investments, for which market quotations are not readily available or are determined to be unreliable. These investments are valued using
the “fair value” procedures approved by the Board. The Board designated the advisor as its valuation designee (the “Valuation
Designee”) to execute these procedures. The Board may also enlist third party consultants such as a valuation specialist at a public
accounting firm, valuation consultant or financial officer of a security issuer on an as-needed basis to assist the Valuation Designee
in determining a security-specific fair value. The Board is responsible for reviewing and approving fair value methodologies utilized
by the Valuation Designee, approval of which shall be based upon whether the Valuation Designee followed the valuation procedures established
by the Board.
Fair
Valuation Process – The applicable investments are valued by the Valuation Designee pursuant to valuation procedures established
by the Board. For example, fair value determinations are required for the following securities: (i) securities for which market quotations
are insufficient or not readily available on a particular business day (including securities for which there is a short and temporary
lapse in the provision of a price by the regular pricing source); (ii) securities for which, in the judgment of the Valuation Designee,
the prices or values available do not represent the fair value of the instrument; factors which may cause the Valuation Designee to make
such a judgment include, but are not limited to, the following: only a bid price or an asked price is available; the spread between bid
and asked prices is substantial; the frequency of sales; the thinness of the market; the size of reported trades; and actions of the securities
markets, such as the suspension or limitation of trading; (iii) securities determined to be illiquid; and (iv) securities with respect
to which an event that will affects the value thereof has occurred (a “significant event”) since the closing prices were established
on the principal exchange on which they are traded, but prior to a Fund’s calculation of its net asset value. Specifically, interests
in commodity pools or managed futures pools are valued on a daily basis by reference to the closing market prices of each futures contract
or other asset held by a pool, as adjusted for pool expenses. Restricted or illiquid securities, such as private investments or non-traded
securities are valued based upon the current bid for the security from two or more independent dealers or other parties reasonably familiar
with the facts and circumstances of the security (who should take into consideration all relevant factors as may be appropriate under
the circumstances). If a current bid from such independent dealers or other independent parties is unavailable, the Valuation Designee
shall determine, the fair value of such security using the following factors: (i) the type of security; (ii) the cost at date of purchase;
(iii) the size and nature of a Fund’s holdings; (iv) the discount from market value of unrestricted securities of the same class
at the time of purchase and subsequent thereto; (v) information as to any transactions or offers with respect to the security; (vi) the
nature and duration of restrictions on disposition of the security and the existence of any registration rights; (vii) how the yield of
the security compares to similar securities of companies of similar or equal creditworthiness; (viii) the level of recent trades of similar
or comparable securities; (ix) the liquidity characteristics of the security; (x) current market conditions; and (xi) the market
value of any securities into which the security is convertible or exchangeable.
| Beacon
Dynamic Allocation Fund |
| NOTES
TO FINANCIAL STATEMENTS (Continued) |
| February
28, 2026 |
Valuation
of Fund of Funds - The Fund may invest in portfolios of open-end or closed-end investment companies (the “Underlying Funds”).
The Underlying Funds value securities in their portfolios for which market quotations are readily available at their market values (generally
the last reported sale price) and all other securities and assets at their fair value to the methods established by the board of directors
of the Underlying Funds. The shares of many closed-end investment companies, after their initial public offering, frequently trade at
a price per share, which is different than the net asset value per share. The difference represents a market premium or market discount
of such shares. There can be no assurances that the market discount or market premium on shares of any closed-end investment company purchased
by the Fund will not change. The Fund utilizes various methods to measure the fair value of all of its investments on a recurring basis.
GAAP
establishes a hierarchy that prioritizes inputs to valuation methods. The three levels of inputs are:
Level
1 – Unadjusted quoted prices in active markets for identical assets and liabilities that the Fund has the ability to access.
Level
2 – Observable inputs other than quoted prices included in Level 1 that are observable for the asset or liability, either directly
or indirectly. These inputs may include quoted prices for the identical instrument in an inactive market, prices for similar instruments,
interest rates, prepayment speeds, credit risk, yield curves, default rates, and similar data.
Level
3 – Unobservable inputs for the asset or liability, to the extent relevant observable inputs are not available, representing the
Fund’s own assumptions about the assumptions a market participant would use in valuing the asset or liability, and would be based
on the best information available.
The
availability of observable inputs can vary from security to security and is affected by a wide variety of factors, including, for example,
the type of security, whether the security is new and not yet established in the marketplace, the liquidity of markets, and other characteristics
particular to the security. To the extent that valuation is based on models or inputs that are less observable or unobservable in the
market, the determination of fair value requires more judgment. Accordingly, the degree of judgment exercised in determining fair value
is greatest for instruments categorized in Level 3.
The
inputs used to measure fair value may fall into different levels of the fair value hierarchy. In such cases, for disclosure purposes,
the level in the fair value hierarchy within which the fair value measurement falls in its entirety, is determined based on the lowest
level input that is significant to the fair value measurement in its entirety.
The
inputs or methodology used for valuing securities are not necessarily an indication of the risk associated with investing in those securities.
The following table summarizes the inputs used as of February 28, 2026, for the Fund’s assets and liabilities measured at fair value:
| Assets * |
|
Level 1 |
|
|
Level 2 |
|
|
Level 3 |
|
|
Total |
|
| Exchange-Traded
Funds |
|
$ |
69,898,720 |
|
|
$ |
— |
|
|
$ |
— |
|
|
$ |
69,898,720 |
|
| Short-Term
Investment |
|
|
1,162,954 |
|
|
|
— |
|
|
|
— |
|
|
|
1,162,954 |
|
| Total |
|
$ |
71,061,674 |
|
|
$ |
— |
|
|
$ |
— |
|
|
$ |
71,061,674 |
|
The
Fund did not hold any Level 2 or 3 securities during the period.
|
* |
Refer to the Schedule of Investments
for classification by asset class. |
Exchange
Traded Funds (“ETFs”) – The Fund may invest in ETFs. ETFs are generally a type of fund bought and sold on a securities
exchange. An ETF trades like common stock and represents a portfolio of securities. The risks of owning an ETF generally reflect the risks
of owning the underlying securities they hold, although the lack of liquidity on an ETF could result in it being more volatile. Additionally,
ETFs have fees and expenses that reduce their value.
| Beacon
Dynamic Allocation Fund |
| NOTES
TO FINANCIAL STATEMENTS (Continued) |
| February
28, 2026 |
Security
transactions and related income – Security transactions are accounted for on the trade date. Interest income is recognized on
an accrual basis. Dividend income is recorded on the ex-dividend date. Realized gains or losses from sales of securities are determined
by comparing the identified cost of the security lot sold with the net sales proceeds.
Dividends
and distributions to shareholders – The Fund distributes substantially all of its net investment income quarterly and net realized
capital gains, if any, are declared and paid annually. Dividends from net investment income and distributions from net realized gains
are determined in accordance with federal income tax regulations, which may differ from GAAP. These “book/tax” differences are
considered either temporary (e.g., deferred losses) or permanent in nature. To the extent these differences are permanent in nature, such
amounts are reclassified within the composition of net assets based on their federal tax-basis treatment; temporary differences do not
require reclassification. Dividends and distributions to shareholders are recorded on the ex-dividend date.
Cash
and Cash Equivalents – Idle cash may be swept into various overnight demand deposits and is classified as cash and cash equivalents
on the Statements of Assets and Liabilities. The Fund maintains cash in bank deposit accounts which, at times, may exceed United States
federally insured limits. Amounts swept overnight are available on the next business day.
Federal
Income Taxes – The Fund intends to continue to comply with the requirements of the Internal Revenue Code applicable to regulated
investment companies and to distribute all of its taxable income to its shareholders. Therefore, no provision for federal income tax is
required. The Fund recognizes the tax benefits of uncertain tax positions only where the position is “more likely than not”
to be sustained assuming examination by tax authorities. Management has analyzed the Fund’s tax positions and has concluded that
no liability for unrecognized tax benefits should be recorded related to uncertain tax positions taken on returns filed for open tax years
ended July 31, 2023 to July 31, 2025 or expected to be taken in the Fund’s February 28, 2026 year-end tax returns.
The
Fund identifies its major tax jurisdictions as U.S. federal, Ohio and foreign jurisdictions where the Fund makes significant investments.
The Fund is not aware of any tax positions for which it is reasonably possible that the total amounts of unrecognized tax benefits will
change materially in the next twelve months.
Expenses
– Expenses of the Trust that are directly identifiable to a specific Fund are charged to that Fund. Expenses, which are not
readily identifiable to a specific Fund, are allocated in such a manner as deemed equitable (as determined by the Board), taking into
consideration the nature and type of expense and the relative sizes of the Funds in the Trust.
Indemnification
– The Trust indemnifies its officers and Trustees for certain liabilities that may arise from the performance of their duties
to the Trust. Additionally, in the normal course of business, the Fund enters into contracts that contain a variety of representations
and warranties and which provide general indemnities. The Fund’s maximum exposure under these arrangements is unknown, as this would
involve future claims that may be made against the Fund that has not yet occurred. However, based on experience, the risk of loss due
to these warranties and indemnities appears to be remote.
|
3. |
INVESTMENT
TRANSACTIONS |
For
the period ended February 28, 2026, cost of purchases and proceeds from sales of portfolio securities, other than short-term investments
and U.S. government securities, amounted to $21,827,022 and $34,886,429.
| Beacon
Dynamic Allocation Fund |
| NOTES
TO FINANCIAL STATEMENTS (Continued) |
| February
28, 2026 |
|
4. |
INVESTMENT
ADVISORY AGREEMENT AND TRANSACTIONS WITH RELATED PARTIES |
Beacon
Capital Management, LLC (the “Advisor”) is the Fund’s investment advisor. Pursuant to an investment advisory agreement
with the Trust, on behalf of the Fund, the Advisor, under the supervision of the Board, oversees the daily operations of the Fund and
supervises the performance of administrative and professional services provided by others. As compensation for its services and the related
expenses borne by the Advisor, the Advisor receives a management fee, computed and accrued daily and paid monthly, at an annual rate of
0.95% for the Fund’s average daily net assets. The Advisor earned $349,636 in management fees for the period ended February 28, 2026
from the Beacon Dynamic Allocation Fund.
For
the fiscal year ended July 31, 2025, the Predecessor Fund’s prior advisor, Astor Investment Management, LLC, received an advisory
fee net of fee waivers and expense reimbursements equal to 0.54% of the Fund’s average daily net assets.
Pursuant
to a written contract (the “Expense Limitation Agreement”), the Advisor has agreed, at least until February 28, 2028, to waive
its advisory fee and make payments to the Fund to the extent necessary so that the total expenses incurred by the Funs (excluding (i)
any front-end or contingent deferred loads; (ii) brokerage fees and commissions; (iii) acquired fund fees and expenses; (iv) fees and
expenses associated with investments in other collective investment vehicles or derivative instruments (including for example options
and swap fees and expenses); (v) borrowing costs (such as interest and dividend expense on securities sold short); (vi) taxes; and (vii)
extraordinary expenses, such as litigation expenses (which may include indemnification of Fund officers and Trustees, contractual indemnification
of Fund service providers (other than the Adviser)) do not exceed 1.40%, 2.15% and 1.15% per annum of the Fund’s average daily net
assets for Class A, Class C, and Class I shares, respectively.
Any
fee waivers and expense reimbursements are subject to possible recoupment from the Fund in future years (within the three years from the
date when the amount is waived or reimbursed) if such recoupment can be achieved within the lesser of the foregoing expense limits or
the then-current expense limits. The Board of the Trust may terminate the Expense Limitation Agreement upon 60 days’ notice to the
Adviser.
During
the period ended February 28, 2026, the Advisor waived fees or reimbursed expenses of $179,844, pursuant to the Expense Limitation Agreement.
As February 28, 2026 the Advisor has waived/reimbursed expenses that may be recovered no later February of the year indicated below:
| Fund |
|
February 28, 2029 |
|
|
Total |
|
| Beacon Dynamic Allocation Fund |
|
$ |
179,844 |
|
|
$ |
179,844 |
|
The
Trust has adopted, on behalf of the Fund, the Trust’s Master Distribution and Shareholder Servicing Plan (the “Plan”) pursuant
to Rule 12b-1 under the 1940 Act with respect to Class A and Class C shares of the Fund. The Plan provides that a monthly service and/or
distribution fee is calculated by the Fund at an annual rate of 0.25% of the average daily net assets attributable to such Class A shares
and 1.00% of the average daily net assets attributable to Class C shares and is paid to Northern Lights Distributors, LLC (the “Distributor”),
to provide compensation for ongoing distribution-related activities or services and/or maintenance of the Fund’s shareholder accounts,
not otherwise required to be provided by the Advisor. The Plan is a compensation plan, which means that compensation is provided regardless
of 12b-1 expenses incurred. The Fund paid $82,538 in 12b-1 fees for the period ended February 28, 2026.
The
Distributor acts as the Fund’s principal underwriter in a continuous public offering of the Fund’s Class A, Class C, and Class
I shares. For the period ended February 28, 2026, $16 was paid to the underwriter for the Fund. Of this amount, $3 was retained by the
Fund. The Advisor incurs and pays for these fees for the benefit of the Fund.
| Beacon
Dynamic Allocation Fund |
| NOTES
TO FINANCIAL STATEMENTS (Continued) |
| February
28, 2026 |
In
addition, certain affiliates of the Distributor provide services to the Fund as follows:
Ultimus
Fund Solutions, LLC (“UFS”), an affiliate of the Distributor, provides administration, fund accounting, and transfer
agent services to the Trust. Pursuant to separate servicing agreements with UFS, the Fund pays UFS customary fees for providing administration,
fund accounting and transfer agency services to the Fund. Certain officers of the Trust are also officers of UFS and are not paid any
fees directly by the Fund for serving in such capacities.
Northern
Lights Compliance Services, LLC (“NLCS”), an affiliate of UFS and the Distributor, provides a Chief Compliance Officer
to the Trust, as well as related compliance services, pursuant to a consulting agreement between NLCS and the Trust. Under the terms of
such agreement, NLCS receives fees from the Fund.
Blu
Giant, LLC (“Blu Giant”), an affiliate of UFS and the Distributor, provides EDGAR conversion and filing services as well
as print management services for the Fund on an ad-hoc basis. For the provision of these services, Blu Giant receives fees from the Fund.
|
5. |
AGGREGATE UNREALIZED APPRECIATION
AND DEPRECIATION – TAX BASIS |
The
below table represents aggregate cost for federal tax purposes, for the Fund as of February 28, 2026 and differs from market value by
net unrealized appreciation which consisted of:
| Cost for Federal Tax purposes |
|
$ |
64,738,341 |
|
| Unrealized Appreciation |
|
|
6,325,992 |
|
| Unrealized Depreciation |
|
|
(2,659 |
) |
| Tax Net Unrealized Appreciation |
|
$ |
6,323,333 |
|
|
6. |
DISTRIBUTIONS TO SHAREHOLDERS
AND TAX COMPONENTS OF CAPITAL |
The
tax character of Fund distributions paid for the fiscal periods ended February 28, 2026 and July 31, 2025, was as follows:
| |
|
Fiscal Period Ended |
|
|
Fiscal Year Ended |
|
| |
|
February 28, 2026 |
|
|
July 31, 2025 |
|
| Ordinary Income |
|
|
1,188,639 |
|
|
|
4,989,098 |
|
| Long-Term Capital Gain |
|
|
2,874,791 |
|
|
|
2,055,411 |
|
| Return of Capital |
|
|
— |
|
|
|
— |
|
| |
|
$ |
4,063,430 |
|
|
$ |
7,044,509 |
|
As
of February 28, 2026, the components of accumulated earnings/ (deficit) on a tax basis were as follows:
| Undistributed |
|
|
Undistributed |
|
|
Post October Loss |
|
|
Capital Loss |
|
|
Other |
|
|
Unrealized |
|
|
Total |
|
| Ordinary |
|
|
Long-Term |
|
|
and |
|
|
Carry |
|
|
Book/Tax |
|
|
Appreciation/ |
|
|
Accumulated |
|
| Income |
|
|
Capital Gains |
|
|
Late Year Loss |
|
|
Forwards |
|
|
Differences |
|
|
(Depreciation) |
|
|
Earnings/(Deficits) |
|
| $ |
527,540 |
|
|
$ |
— |
|
|
$ |
— |
|
|
$ |
— |
|
|
$ |
— |
|
|
$ |
6,323,333 |
|
|
$ |
6,850,873 |
|
The
difference between book basis and tax basis accumulated net realized gain (loss) and unrealized appreciation (depreciation) from investments
is primarily attributable to the tax deferral of losses on wash sales.
During
the fiscal period ending February 28, 2026, the Fund utilized tax equalization which is the use of earnings and profits distributions
to shareholders on redemption of shares as part of the dividends paid deduction for income tax purposes. Permanent book and tax differences,
primarily attributable to tax adjustments for use of tax equalization credits, resulted in reclassifications for the Fund for the fiscal
period ended February 28, 2026, as follows:
| Paid |
|
|
|
|
| In |
|
|
Accumulated |
|
| Capital |
|
|
Earnings (Losses) |
|
| $ |
400,975 |
|
|
$ |
(400,975 |
) |
| Beacon
Dynamic Allocation Fund |
| NOTES
TO FINANCIAL STATEMENTS (Continued) |
| February
28, 2026 |
|
7. |
ACCOUNTING PRONOUNCEMENT |
The
Fund adopted the FASB Accounting Standards Update 2023-09, “Income Taxes (Topic 740) Improvements to Income Tax Disclosures”
(“ASU 2023-09”), which establishes new income tax disclosure requirements and modifies or eliminates certain existing disclosure
provisions. The amendments in this ASU are intended to address investor requests for more transparency about income tax information and
to improve the effectiveness of income tax disclosures. The Fund’s adoption of ASU 2023-09 did not have a material impact on the
Fund’s financial statements as of February 28, 2026.
At
a meeting held on August 28, 2025, the Board of Trustees approved the following reorganizations (each, a “Reorganization”) of
the Astor Dynamic Allocation Fund and the Astor Sector Allocation Fund (each an “Acquired Fund,” and collectively, the “Acquired
Funds”) into the same new series of Northern Lights Fund Trust II. The Beacon Dynamic Allocation Fund, a series of Northern Lights
Fund Trust (the “Predecessor Fund” or “Predecessor Dynamic Fund”), reorganized into the Fund following the close of
business on February 13, 2026.
The
Plan provides with respect to each Target Fund for: (1) the transfer of all of the assets of the Target Fund in exchange for shares of
beneficial interest of the Acquiring Fund (as shown below), and the assumption by the Acquiring Fund of all of the liabilities of the
Target Fund, and (2) the distribution of the shares of the Acquiring Fund pro rata to the shareholders of the Target Fund in complete
liquidation and termination of the Target Fund. After the Reorganization, shareholders will no longer be shareholders of the Target Fund
but will become shareholders of the Acquiring Fund.
Each
Reorganization occurred by transferring all of the assets of the Acquired Funds to the Acquiring Fund in exchange for shares of the Acquiring
Fund and the assumption of all the liabilities of the Acquired Funds by the Acquiring Fund. Astor Dynamic Allocation Fund and the Astor
Sector Allocation Fund Reorganization was accomplished by a tax-free exchange of shares of the Acquiring Fund. A tax-free exchange means
that shareholders of the Acquired Funds will not realize any capital gains (losses) for federal income tax purposes. The following amounts
were exchanged:
| Target Fund: |
|
|
|
|
|
|
|
|
|
| Astor Sector Allocation Fund (1) |
|
Class A |
|
|
Class C |
|
|
Class I |
|
| Net Assets |
|
$ |
6,195,688 |
|
|
$ |
2,058,511 |
|
|
$ |
5,711,486 |
|
| Shares Outstanding |
|
|
466,304 |
|
|
|
181,497 |
|
|
|
416,882 |
|
| Net Asset Value |
|
$ |
13.29 |
|
|
$ |
11.34 |
|
|
$ |
13.70 |
|
| Exchange Rate for Shares Issued |
|
|
1.02 |
|
|
|
0.95 |
|
|
|
1.04 |
|
| |
|
|
|
|
|
|
|
|
|
|
|
|
| Target Fund: |
|
|
|
|
|
|
|
|
|
|
|
|
| Astor Dynamic Allocation Fund (2) |
|
Class A |
|
|
Class C |
|
|
Institutional Class |
|
| Net Assets |
|
$ |
7,873,537 |
|
|
$ |
11,143,181 |
|
|
$ |
38,210,894 |
|
| Shares Outstanding |
|
|
601,612 |
|
|
|
930,418 |
|
|
|
2,900,322 |
|
| Net Asset Value |
|
$ |
13.09 |
|
|
$ |
11.98 |
|
|
$ |
13.17 |
|
| Exchange Rate for Shares Issued |
|
|
1 |
|
|
|
1 |
|
|
|
1 |
|
| |
|
|
|
|
|
|
|
|
|
|
|
|
| Merged Acquiring & Reorganized Fund: |
|
|
|
|
|
|
|
|
|
|
|
|
| Beacon Dynamic Allocation Fund |
|
Class A |
|
|
Class C |
|
|
Institutional Class |
|
| Net Assets |
|
$ |
14,069,225 |
|
|
$ |
13,201,691 |
|
|
$ |
43,922,380 |
|
| Shares Outstanding |
|
|
1,075,021 |
|
|
|
1,102,296 |
|
|
|
3,333,841 |
|
| Net Asset Value |
|
|
13.09 |
|
|
|
11.98 |
|
|
|
13.17 |
|
|
1. |
Includes accumulated net investment
income, accumulated realized gains and unrealized appreciation in the amounts of $88,367, $606,262 and $802,255, respectively. |
|
2. |
Includes accumulated net investment
income, accumulated realized gains and unrealized appreciation in the amounts of $730,023, $1,895,338 and $6,111,850, respectively. |
| Beacon
Dynamic Allocation Fund |
| NOTES
TO FINANCIAL STATEMENTS (Continued) |
| February
28, 2026 |
The
Acquiring Fund has elected to carry forward the assets of the Acquired Funds at each Acquired Fund’s historical cost basis for purposes
of measuring unrealized appreciation (depreciation) and future realized gain (loss) of those acquired assets.
Assuming
the acquisition into Beacon Dynamic Allocation Fund had been completed on August 1, 2025, the Acquiring Fund’s pro-forma results
of operations for the period ended February 28, 2026, would have been as follows:
| |
|
|
|
|
Net Realized |
|
|
Net Unrealized Gain |
|
|
Net Increase (Decrease) in |
|
| |
|
Net Investment |
|
|
Gain (Loss) on |
|
|
(Loss) on |
|
|
Net Assets Resulting from |
|
| Acquiring Fund Name |
|
Income (Loss) |
|
|
Investments |
|
|
Investments |
|
|
Operations |
|
| Beacon Dynamic Allocation Fund |
|
$ |
802,504 |
|
|
$ |
3,397,534 |
|
|
|
1,581,410 |
|
|
$ |
5,781,448 |
|
Because
the combined investment portfolios have been managed as single integrated portfolios of the Acquiring Fund since the Reorganization was
completed, it is not practicable to separate the amount of revenue and earnings of the Acquired Funds that have been included in the Acquiring
Fund’s Statement of Operations since February 13, 2026.
Subsequent
events after the date of the Statement of Assets and Liabilities have been evaluated through the date the financial statements were issued.
Management has determined that no other events or transactions occurred requiring adjustment or disclosure in the financial statements.

REPORT
OF INDEPENDENT REGISTERED PUBLIC ACCOUNTING FIRM
To
the Board of Trustees
of
Northern Lights Fund Trust II and
Shareholders
of Beacon Dynamic Allocation Fund
Opinion
on the Financial Statements
We
have audited the accompanying statement of assets and liabilities of Beacon Dynamic Allocation Fund (the “Fund”), a series of
Northern Lights Fund Trust II, including the schedule of investments, as of February 28, 2026, the related statement of operations, the
statement of changes in net assets and the financial highlights for the period ended February 28, 2026, and the related notes (collectively
referred to as the “financial statements”). In our opinion, the financial statements present fairly, in all material respects,
the financial position of the Fund as of February 28, 2026, the results of its operations, the changes in its net assets, and the financial
highlights for the period ended February 28, 2026, in conformity with accounting principles generally accepted in the United States of
America.
The
statement of operations for the year ended July 31, 2025, the statements of changes in net asset for the two years in the period ended
July 31, 2025, and the financial highlights for each of the five years in the period ended July 31, 2025, have been audited by other auditors,
whose report dated September 29, 2025 expressed unqualified opinion on such statements and financial highlights.
Basis
for Opinion
These
financial statements are the responsibility of the Fund’s management. Our responsibility is to express an opinion on the Fund’s
financial statements based on our audit. We are a public accounting firm registered with the Public Company Accounting Oversight Board
(United States) (“PCAOB”) and are required to be independent with respect to the Fund in accordance with the U.S. federal securities
laws and the applicable rules and regulations of the Securities and Exchange Commission and the PCAOB. We have served as the auditor of
one or more of the funds in the Trust since 1995.
We
conducted our audits in accordance with the standards of the PCAOB. Those standards require that we plan and perform the audit to obtain
reasonable assurance about whether the financial statements are free of material misstatement, whether due to error or fraud. The Fund
is not required to have, nor were we engaged to perform, an audit of the Fund’s internal control over financial reporting. As part
of our audits, we are required to obtain an understanding of internal control over financial reporting, but not for the purpose of expressing
an opinion on the effectiveness of the Fund’s internal control over financial reporting. Accordingly, we express no such opinion.
Our
audits included performing procedures to assess the risks of material misstatement of the financial statements, whether due to error or
fraud, and performing procedures that respond to those risks. Such procedures included examining, on a test basis, evidence regarding
the amounts and disclosures in the financial statements. Our audits also included evaluating the accounting principles used and significant
estimates made by management, as well as evaluating the overall presentation of the financial statements. Our procedures included confirmation
of securities owned as of February 28, 2026 by correspondence with the custodian. We believe that our audits provide a reasonable basis
for our opinion.
/s/
TAIT, WELLER & BAKER LLP
Philadelphia,
Pennsylvania
April
29, 2026
| Beacon
Dynamic Allocation Fund |
| ADDITIONAL
INFORMATION (Unaudited) |
| February
28, 2026 |
Changes
in and Disagreements with Accountants
There
were no changes in or disagreements with accountants during the period covered by this report.
Proxy
Disclosures
The
Board of Trustees of the Predecessor Trust held a Special Meeting of the Shareholders of Astor Dynamic Allocation Fund, on February 10,
2026, for the purpose of approving an Agreement and Plan of Reorganization, pursuant to which the Astor Dynamic Allocation Fund would
be reorganized as the Beacon Dynamic Allocation Fund, a newly created series of Northern Lights Fund Trust II and a new Investment Advisory
Agreement between Beacon and the Predecessor Trust, on behalf of the Astor Dynamic Allocation Fund.
At
the close of business October 31, 2025, the record date for the Special Meeting of Shareholders, there were outstanding 4,739,912.50 shares
of beneficial interest of the Fund. Accordingly, shares represented in person and by proxy at the Special Meeting equaled 51.29% of the
outstanding shares of the Fund. Therefore, a quorum was present for the Fund.
With
respect to approval of the proposed Agreement and Plan of Reorganization the following votes were cast:
For
Approval: 1,947,780 shares voted
Against
Approval: 113,418 shares voted
Abstained:
367,796 shares voted
With
respect to approval of the proposed Investment Advisory Agreement the following votes were cast:
For
Approval: 1,985,450 shares voted
Against
Approval: 89,950 shares voted
Abstained:
345,239 shares voted
Remuneration
Paid to Directors, Officers and Others
Refer
to the financial statements included herein.
Statement
Regarding Basis for Approval of Investment Advisory Agreement
FACTORS
CONSIDERED BY THE TRUSTEES IN APPROVAL OF THE INVESTMENT ADVISORY AGREEMENT AND SUB-ADVISORY AGREEMENT
At
a Meeting (the “Meeting”) of the Board of Trustees (the “Board”) of Northern Lights Fund Trust II (the “Trust”)
held on October 21, 2025, the Board, including the disinterested Trustees (the “Independent Trustees”), considered the approval
of the investment advisory agreement (the “Beacon Advisory Agreement”) between Beacon Capital Management, Inc. (“BCM”)
and the Trust, on behalf of the Beacon Dynamic Fund (the “Beacon Dynamic”). The Board also considered the approval of the sub-advisory
agreement between Beacon and Exchange Traded Concepts, LLC (“ETC”) with respect to the Fund (the “ETC Sub-Advisory Agreement”
and, together with the Beacon Advisory Agreement, the “Beacon Dynamic Advisory Agreements’).
Based
on their evaluation of the information provided by BCM and ETC, in conjunction with Beacon Dynamic’s other service providers, the
Board, by a unanimous vote (including a separate vote of the Independent Trustees), approved each of the Beacon Dynamic Advisory Agreements.
In
advance of the Meeting, the Board requested and received materials to assist them in considering the approval of the Beacon Dynamic Advisory
Agreements. The materials provided contained information with respect to the factors enumerated below, including the each of the Beacon
Dynamic Advisory Agreements, a memorandum prepared by independent trustee counsel discussing in detail the Trustees’ fiduciary obligations
and the factors they should assess in considering the approval of the Beacon Dynamic Advisory Agreements and
| Beacon
Dynamic Allocation Fund |
| ADDITIONAL
INFORMATION (Unaudited) (Continued) |
| February
28, 2026 |
comparative
information relating to the advisory fee and other expenses of Beacon Dynamic. The materials also included due diligence materials relating
to BCM and ETC (including due diligence questionnaires completed by BCM and ETC, select financial information of BCM and ETC, bibliographic
information regarding BCM’s and ETC’s key management and investment advisory personnel, and comparative fee information relating
to Beacon Dynamic and other pertinent information. At the Meeting, the Independent Trustees were advised by counsel that is experienced
in Investment Company Act of 1940 matters and that is independent of fund management and met with such counsel separately from fund management.
In considering the approval of the Beacon Dynamic Advisory Agreements, the Board did not identify any one factor as all important, but
rather considered these factors collectively and determined that approval of the Beacon Dynamic Advisory Agreements was in the best interests
of Beacon Dynamic and its shareholders. Moreover, the Board noted that each Trustee may have afforded different weight to the various
factors in reaching his conclusions with respect to each of the Beacon Dynamic Advisory Agreements.
Beacon
Advisory Agreement
Nature,
Extent and Quality of Services. The Board reviewed materials provided by BCM related to the proposed approval of the Beacon Advisory
Agreement, including its ADV, a description of the manner in which investment decisions will be made and executed, and a review of the
personnel performing services for Beacon Dynamic, including the individuals that will primarily monitor and execute the investment strategies
and provide oversight of Beacon Dynamic’s sub-adviser. The Board noted that BCM has been a registered investment adviser with the
SEC since June 13, 2002, and that its personnel have many years of experience in the financial services industry and with investment management.
The Board discussed BCM’s research capabilities and the quality of its compliance infrastructure. Additionally, the Board received
satisfactory responses from representatives of BCM with respect to a series of important questions, including: whether BCM or its principals
were involved in any lawsuits or pending regulatory actions; whether the management of other accounts would conflict with its management
of Beacon Dynamic; and whether there are procedures in place to adequately allocate trades among its clients. The Board reviewed the description
provided on the practices for monitoring compliance with Beacon Dynamic’s investment limitations, noting that BCM’s CCO would
actively review the portfolio managers’ performance of their duties to ensure compliance under BCM’s compliance program. The
Board reviewed the capitalization of BCM and, based on financial information provided by and representations made by BCM and its representatives,
concluded that BCM was sufficiently well-capitalized in order to meet its obligations to Beacon Dynamic. The Board also discussed BCM’s
compliance program with the CCO of the Trust. The Board noted the representation by the CCO of the Trust that, based on his review, BCM’s
policies and procedures were reasonably designed to prevent violations of applicable federal securities laws. The Board also noted BCM’s
representation that the draft prospectus and statement of additional information for Beacon Dynamic accurately describes the investment
strategies of Beacon Dynamic. After further discussion, the Board concluded that BCM had sufficient quality and depth of personnel, resources
and investment methods essential to performing its duties under the Beacon Advisory Agreement and that the nature, overall quality and
extent of the management services to be provided by BCM to Beacon Dynamic appear to be satisfactory.
Performance.
Because Beacon Dynamic had not yet commenced operations, the Board reviewed the composite performance of BCM’s similar managed accounts
and noted that the strategy has underperformed its benchmark, a 60/40 S&P 500 Total Return Index/Bloomberg U.S. Aggregated Bond Index
for the one-year, five-year, ten-year and since inception periods. The Board noted that BCM had only recently acquired Astor and the strategy
and was satisfied that BCM would be able to provide an adequate level of service for Beacon Dynamic.
Fees
and Expenses. As to the costs of the services to be provided by BCM, the Board reviewed and discussed the proposed advisory fee for
Beacon Dynamic and the anticipated total operating expenses for the Fund as compared to its peer group as presented in the Broadridge
Report noting that the proposed advisory fee was lower than the peer group median but higher than the Morningstar category median. The
Board then reviewed the proposed contractual arrangements for Beacon Dynamic noting that BCM was willing to agree to contractually waive
or limit its advisory fee and/or reimburse expenses for the Fund in order to limit its net annual operating expenses, exclusive of certain
fees,
| Beacon
Dynamic Allocation Fund |
| ADDITIONAL
INFORMATION (Unaudited) (Continued) |
| February
28, 2026 |
for
at least two years from the date of the reorganization of the Astor Funds into Beacon Dynamic so as not to exceed 1.40%, 2.15% and 1.15%
of the average annual net assets for Class A, Class C and Class I shares of the Fund, respectively, and found such arrangements would
be beneficial to the shareholders of Beacon Dynamic. The Board concluded that the advisory fee to be charged by BCM with respect to Beacon
Dynamic was not unreasonable.
Profitability.
The Board also considered the level of profits that could be expected to accrue to BCM with respect to Beacon Dynamic based on profitability
estimates and analyses provided by BCM and reviewed by the Board. After review and discussion, the Board concluded that, based on the
services to be provided by BCM and the projected growth of Beacon Dynamic, the anticipated level of profit from BCM’s relationship
with Beacon Dynamic was not excessive.
Economies
of Scale. As to the extent to which Beacon Dynamic will realize economies of scale as it grows, and whether the fee levels reflect
these economies of scale for the benefit of investors, the Board discussed BCM’s expectations for growth of Beacon Dynamic and concluded
that any material economies of scale would not be achieved in the near term.
ETC
Sub-Advisory Agreement
The
Board then reviewed and discussed the written materials that were provided in advance of the Meeting and deliberated on the approval of
the ETC Sub-Advisory Agreement. In addition to the materials described above, the Board reviewed: (i) the nature and quality of the investment
advisory services to be provided by ETC, including the experience and qualifications of the personnel providing such services; (ii) the
investment strategies and style of investing of ETC; (iii) the performance history of ETC; and (iv) ETC’s financial condition, history
of operations and ownership structure. In considering the approval of the ETC Sub-Advisory Agreement, the Board reviewed and analyzed
various factors that they determined were relevant, including the factors enumerated below.
Nature,
Extent and Quality of Services. As to the nature, quality and extent of the services to be provided by ETC, the Board noted the experience
of the portfolio management personnel of ETC, including their experience in the investment field, education and industry credentials.
The Board discussed the financial condition of ETC and reviewed supporting materials. The Board reviewed the materials prepared by ETC
describing its investment services and noted ETC’s considerable experience executing, settling and reporting trades. The Board concluded
that ETC had sufficient quality and depth of personnel, resources, investment methods essential to performing its duties under the ETC
Sub-Advisory Agreement and that the nature, overall quality and extent of investment advisory services to be provided to Beacon Dynamic
appear to be satisfactory.
Performance.
Because Beacon Dynamic had not yet commenced operations, and ETC does not currently provide sub-advisory services to Astor Dynamic, the
expected predecessor fund of Beacon Dynamic, and ETC only provides trade execution services, the Board did not consider past performance.
The Board considered the depth and experience of ETC and the particular services they provide and did not expect that they would have
a significant impact on the performance of Beacon Dynamic.
Fees
and Expenses. As to the costs of the services provided by ETC, the Board discussed the sub-advisory fee and considered that ETC is
paid by Beacon out of its advisory fees and not by Beacon Dynamic. The Board also looked at the advisory fee split between Beacon and
ETC and concluded that the sub-advisory fee paid to ETC was not unreasonable in light of the quality of the services to be performed by
it. The Board also considered, based on statements made and information provided by Beacon and ETC that the ETC Sub-Advisory Agreement
was negotiated at arm’s-length between Beacon and ETC.
Profitability.
As to profitability, the Board discussed and noted that ETC will receive no compensation from Beacon, other than the sub-advisory fee
earned pursuant to the ETC Sub-Advisory Agreement. The Board further noted that the sub-advisory fee is paid by Beacon out of the advisory
fee that it receives and not directly by Beacon Dynamic. While the Board did not consider the costs of services provided by ETC or its
profitability to be significant
| Beacon
Dynamic Allocation Fund |
| ADDITIONAL
INFORMATION (Unaudited) (Continued) |
| February
28, 2026 |
factors,
nonetheless, based on all these factors and on profitability estimates and analyses provided by ETC and reviewed by the Board, the Board
concluded that anticipated profits from ETC’s relationship with Beacon Dynamic was not excessive.
Economies
of Scale. The Board noted that the sub-advisory fee is not paid by Beacon Dynamic, therefore the Board did not consider whether the
sub-advisory fee should reflect any potential economies of scale that might be realized as Beacon Dynamic’s assets increase and rather
determined the economies of scale would be evaluated as part of looking at the advisory fee paid to Beacon.
Conclusion.
The Board relied upon the advice of counsel, and their own business judgment in determining the material factors to be considered in evaluating
the Beacon Advisory Agreement and the ETC Sub-Advisory Agreement and the weight to be given to each such factor. Accordingly, having requested
and received such information from Beacon and ETC as the Board believed to be reasonably necessary to evaluate the terms of each of the
Beacon Dynamic Advisory Agreements, and as assisted by the advice of independent counsel, the Board, including a majority of the Independent
Trustees, determined that, with respect to each of the Beacon Dynamic Advisory Agreements separately, (a) the terms of the Beacon Dynamic
Advisory Agreements are reasonable; (b) the advisory (or sub-advisory) fee is not unreasonable; and (c) the Beacon Dynamic Advisory Agreements
are in the best interests of Beacon Dynamic and its shareholders. In considering the approval of each of the Beacon Dynamic Advisory Agreements,
the Board did not identify any one factor as all important, but rather considered these factors collectively and determined that approval
of each of the Beacon Dynamic Advisory Agreements was in the best interests of Beacon Dynamic and its shareholders. Moreover, the Board
noted that each Trustee may have afforded different weight to the various factors in reaching his conclusions with respect to each of
the Beacon Dynamic Advisory Agreements.
PROXY
VOTING POLICY
Information
regarding how the Funds voted proxies relating to portfolio securities for the most recent 12 month period ended June 30 as well as a
description of the policies and procedures that the Funds use to determine how to vote proxies is available without charge, upon request,
by calling 1-866-439-9039, by visiting beaconinvesting.com, or by referring to the Securities and Exchange Commission’s (“SEC”)
website at http://www.sec.gov.
INVESTMENT
ADVISER
Beacon
Capital Management, Inc.
7777
Washington Village Dr. Suite 280
Dayton,
OH 45459
ADMINISTRATOR
Ultimus
Fund Solutions, LLC
Pictoria
Drive, Suite 450
Cincinnati,
OH 45246
BEACONDAMF-A26
Item
8. Changes in and Disagreements with Accountants for Open-End Management Investment Companies.
Included
under Item 7.
Item
9. Proxy Disclosures for Open-End Management Investment Companies.
Included
under Item 7.
Item
10. Remuneration Paid to Directors, Officers, and Others of Open-End Management Investment Companies.
Included
under Item 7
Item
11. Statement Regarding Basis for Approval of Investment Advisory Contract.
Included
under Item 7.
Item
12. Disclosure of Proxy Voting Policies and Procedures for Closed-End Management Investment Companies.
Not
applicable
Item
13. Portfolio Managers of Closed-End Management Investment Companies.
Not
applicable
Item
14. Purchases of Equity Securities by Closed-End Management Investment Company and Affiliated Purchasers.
Not
applicable
Item
15. Submission of Matters to a Vote of Security Holders.
Included
under Item 7.
Item
16. Controls and Procedures
(a)
The registrant’s Principal Executive Officer and Principal Financial Officer have concluded that the registrant’s disclosure
controls and procedures (as defined in Rule 30a-3(c) under the Act) are effective in design and operation and are sufficient to form the
basis of the certifications required by Rule 30a-(2) under the Act, based on their evaluation of these disclosure controls and procedures
as of a date within 90 days of this report on Form N-CSR.
(b)
There were no changes in the registrant’s internal control over financial reporting (as defined in Rule 30a-3(d) under the Act) during
the period covered by this report that have materially affected, or are reasonably likely to materially affect, the registrant’s
internal control over financial reporting.
Item
17. Disclosure of Securities Lending Activities for Closed-End Management Investment Companies.
Not
applicable
Item
18. Recovery of Erroneously Awarded Compensation.
(a) Not
applicable
(b) Not
applicable
Item
19. Exhibits.
(a)(1)
Not applicable
(a)(2) Not
applicable
(a)(3)
A separate certification for each principal executive officer and principal financial officer of the registrant as required by Rule 30a-2(a)
under the Act (17 CFR 270.30a-2(a)): Attached hereto. Exhibit 99. CERT
(a)(4)
Not applicable
(b)
Certifications required by Rule 30a-2(b) under the Act (17 CFR 270.30a-2(b)): Attached hereto Exhibit 99.
CERT
SIGNATURES
Pursuant
to the requirements of the Securities Exchange Act of 1934 and the Investment Company Act of 1940, the registrant has duly caused this
report to be signed on its behalf by the undersigned, thereunto duly authorized.
(Registrant)
Northern Lights Fund Trust II
By
(Signature and Title)
| /s/
Kevin E. Wolf |
|
| Kevin
E. Wolf, Principal Executive Officer/President |
Pursuant
to the requirements of the Securities Exchange Act of 1934 and the Investment Company Act of 1940, this report has been signed below by
the following persons on behalf of the registrant and in the capacities and on the dates indicated.
By
(Signature and Title)
| /s/
Kevin E. Wolf |
|
| Kevin
E. Wolf, Principal Executive Officer/President |
By
(Signature and Title)
| /s/
Erik Naviloff |
|
| Erik
Naviloff, Principal Financial Officer/ Treasurer |