Year (a) | Summary (b)(1) | Compensation Actually Paid to First PEO ($) (c)(2) | Summary Compensation Table Total for Second PEO ($) (d)(1) | Compensation Actually Paid to Second PEO ($) (e)(2) | Average Summary Compensation Table Total for Non-PEO NEOs ($) (f)(1) | Average Compensation Actually Paid to Non-PEO NEOs ($) (g)(2) | Total Shareholder Return (TSR) ($) (h) | Net Income / Loss ($) (i)(3) | |||||||||||||||||
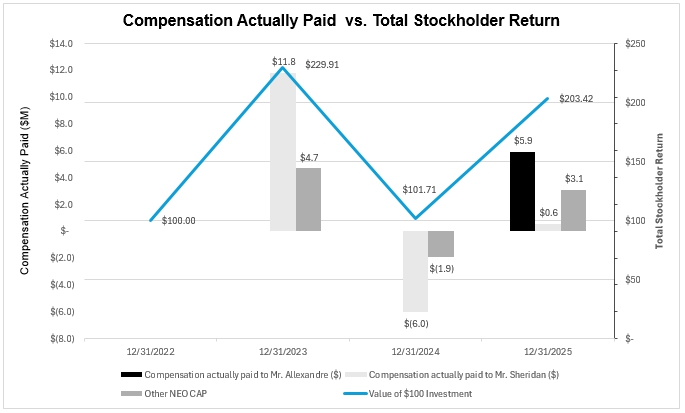
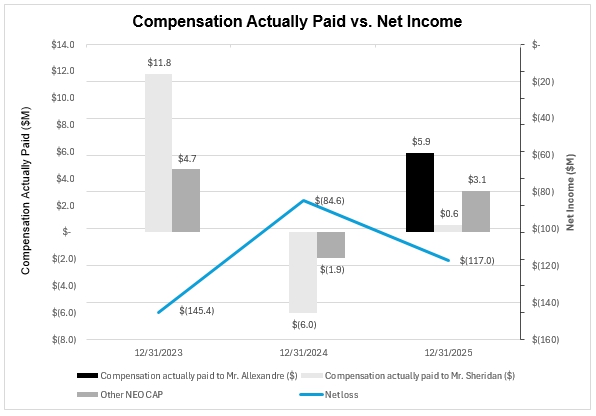
| 2025 | 4,996,820 | 5,885,381 | 1,362,152 | 503,211 | 1,187,263 | 3,144,237 | 203.42 | (116,953,000 | ) | ||||||||||||||||
| 2024 | 0 | 0 | 579,087 | (6,008,951 | ) | 566,034 | (1,936,899 | ) | 101.71 | (84,599,000 | ) | ||||||||||||||
| 2023 | 0 | 0 | 1,060,001 | 11,764,262 | 669,455 | 4,744,960 | 229.91 | (145,433,000 | ) | ||||||||||||||||
(1) Amounts shown in column (b) reflect total compensation reported for our current President and Chief Executive Officer, Mr. Allexandre, for the year during which he was employed by the Company as reflected in the Summary Compensation Table for the Year Ended December 31, 2025, and amounts shown in column (d) reflect total compensation reported for our former President and Chief Executive Officer, Mr. Sheridan, for each year in the Summary Compensation Table for the Year Ended December 31, 2025. Amounts shown in column (f) reflect the average amount of total compensation reported for our non-CEO NEOs in the corresponding year, as reflected in the applicable row of Summary Compensation Table for the Year Ended December 31, 2025. For all years, we have provided “scaled disclosure” of our executive compensation in compliance with SEC rules applicable to smaller reporting companies. For 2025, the non-CEO NEOs were Todd Glickman and Daniel M. Kinzer. For 2024, the non-CEO NEOs were Mr. Glickman and Mr. Kinzer; refer to the summary compensation table on page 17 of the definitive proxy statement on Schedule 14A for our 2024 annual stockholders’ meeting, filed with the SEC on May 29, 2025. For 2023, the non-CEO NEOs were Mr. Kinzer and Ranbir Singh; refer to the summary compensation table on page 17 of the definitive proxy statement on Schedule 14A for our 2023 annual stockholders’ meeting, filed with the SEC on April 26, 2024.
(2) Amounts shown in columns (c), (e), and (g) represent “compensation actually paid” or “CAP” to our each of our CEOs, as applicable, and the average CAP to our non-CEO NEOs for the corresponding year. The calculation of CAP according to SEC rules, and reconciliations to total amounts reported in the applicable summary compensation table, are shown in the table below. CAP does not necessarily represent cash or equity value transferred to an NEO without restriction, but rather is a value calculated according to SEC rules by adding or subtracting the accounting values shown below. We do not have a defined benefit plan, so no adjustment for pension benefits is included. Similarly, no dividends or other earnings have been paid on stock or on equity awards, so no adjustments are included for those items. Fair values were computed in accordance with Financial Accounting Standards Board ASC Topic 718, Stock Compensation, as of the dates indicated below.
| 2025 | 2024 | 2023 | ||||||||||||||||||||||||||
| (amounts in ($)) | First CEO | Second CEO | Other NEOs (Average) | CEO | Other NEOs (Average) | CEO | Other NEOs (Average) | |||||||||||||||||||||
| NEOs included in average | Allexandre | Sheridan | Glickman, Kinzer | Sheridan | Kinzer, Glickman | Sheridan | Kinzer, Singh | |||||||||||||||||||||
| Total reported in summary compensation table | 4,996,820 | 1,362,152 | 1,187,263 | 579,087 | 566,034 | 1,060,001 | 669,455 | |||||||||||||||||||||
| (Subtract) grant date fair value of equity awards included in summary compensation table total | (4,823,438 | ) | (170,535 | ) | ($ | 799,477 | ) | (162,999 | ) | (504,970 | ) | (251,197 | ) | |||||||||||||||
| Add year-end fair value of equity awards granted in the reported year that were unvested at year-end | 5,712,000 | 2,265,465 | ||||||||||||||||||||||||||
| Add (subtract) change in fair value of prior-year awards that did not vest during the reported year, from the end of the prior year to the end of the reported year | 102,880 | (2,551,250 | ) | (1,366,237 | ) | 6,417,470 | 3,329,369 | |||||||||||||||||||||
| Add (subtract) change in fair value of prior-year awards that vested during the reported year, from the end of the prior year to the vesting date | (5,059 | ) | 504,972 | 237,259 | 4,541,760 | 908,352 | ||||||||||||||||||||||
| Add fair value of awards that were granted and vested in the reported year, as of the vesting date | 120,844 | 797,789 | (4,541,760 | ) | (1,210,955 | ) | 250,001 | 88,981 | ||||||||||||||||||||
| (Subtract) fair value of awards granted in prior fiscal years that failed to meet vesting conditions in the reported year | (809,250 | ) | (404,625 | ) | ||||||||||||||||||||||||
| Compensation actually paid (CAP) | 5,885,381 | 503,211 | 3,144,237 | (6,008,951 | ) | (1,936,899 | ) | 11,764,262 | 4,744,960 | |||||||||||||||||||
(3) Net income in each year was significantly affected by non-operating gains and losses. Specifically, net income in 2025, 2024 and 2023 included a loss of $12.4 million, a gain of $36.6 million and a loss of $33.8 million, respectively, resulting from changes in the fair value of earnout liabilities. For more information, see our consolidated financial statements included in Item 8 of Part II of our 2025 Annual Report and our annual reports on Form 10-K for the years ended December 31, 2024 and 2023, filed with the SEC on March 19, 2025, as amended by Amendment No. 1 thereto, filed with the SEC on May 1, 2025, and March 6, 2024, as amended by Amendment No. 1 thereto, filed with the SEC on July 23, 2024, respectively.
(1) Amounts shown in column (b) reflect total compensation reported for our current President and Chief Executive Officer, Mr. Allexandre, for the year during which he was employed by the Company as reflected in the Summary Compensation Table for the Year Ended December 31, 2025, and amounts shown in column (d) reflect total compensation reported for our former President and Chief Executive Officer, Mr. Sheridan, for each year in the Summary Compensation Table for the Year Ended December 31, 2025. Amounts shown in column (f) reflect the average amount of total compensation reported for our non-CEO NEOs in the corresponding year, as reflected in the applicable row of Summary Compensation Table for the Year Ended December 31, 2025. For all years, we have provided “scaled disclosure” of our executive compensation in compliance with SEC rules applicable to smaller reporting companies. For 2025, the non-CEO NEOs were Todd Glickman and Daniel M. Kinzer. For 2024, the non-CEO NEOs were Mr. Glickman and Mr. Kinzer; refer to the summary compensation table on page 17 of the definitive proxy statement on Schedule 14A for our 2024 annual stockholders’ meeting, filed with the SEC on May 29, 2025. For 2023, the non-CEO NEOs were Mr. Kinzer and Ranbir Singh; refer to the summary compensation table on page 17 of the definitive proxy statement on Schedule 14A for our 2023 annual stockholders’ meeting, filed with the SEC on April 26, 2024.
(2) Amounts shown in columns (c), (e), and (g) represent “compensation actually paid” or “CAP” to our each of our CEOs, as applicable, and the average CAP to our non-CEO NEOs for the corresponding year. The calculation of CAP according to SEC rules, and reconciliations to total amounts reported in the applicable summary compensation table, are shown in the table below. CAP does not necessarily represent cash or equity value transferred to an NEO without restriction, but rather is a value calculated according to SEC rules by adding or subtracting the accounting values shown below. We do not have a defined benefit plan, so no adjustment for pension benefits is included. Similarly, no dividends or other earnings have been paid on stock or on equity awards, so no adjustments are included for those items. Fair values were computed in accordance with Financial Accounting Standards Board ASC Topic 718, Stock Compensation, as of the dates indicated below.
| 2025 | 2024 | 2023 | ||||||||||||||||||||||||||
| (amounts in ($)) | First CEO | Second CEO | Other NEOs (Average) | CEO | Other NEOs (Average) | CEO | Other NEOs (Average) | |||||||||||||||||||||
| NEOs included in average | Allexandre | Sheridan | Glickman, Kinzer | Sheridan | Kinzer, Glickman | Sheridan | Kinzer, Singh | |||||||||||||||||||||
| Total reported in summary compensation table | 4,996,820 | 1,362,152 | 1,187,263 | 579,087 | 566,034 | 1,060,001 | 669,455 | |||||||||||||||||||||
| (Subtract) grant date fair value of equity awards included in summary compensation table total | (4,823,438 | ) | (170,535 | ) | ($ | 799,477 | ) | (162,999 | ) | (504,970 | ) | (251,197 | ) | |||||||||||||||
| Add year-end fair value of equity awards granted in the reported year that were unvested at year-end | 5,712,000 | 2,265,465 | ||||||||||||||||||||||||||
| Add (subtract) change in fair value of prior-year awards that did not vest during the reported year, from the end of the prior year to the end of the reported year | 102,880 | (2,551,250 | ) | (1,366,237 | ) | 6,417,470 | 3,329,369 | |||||||||||||||||||||
| Add (subtract) change in fair value of prior-year awards that vested during the reported year, from the end of the prior year to the vesting date | (5,059 | ) | 504,972 | 237,259 | 4,541,760 | 908,352 | ||||||||||||||||||||||
| Add fair value of awards that were granted and vested in the reported year, as of the vesting date | 120,844 | 797,789 | (4,541,760 | ) | (1,210,955 | ) | 250,001 | 88,981 | ||||||||||||||||||||
| (Subtract) fair value of awards granted in prior fiscal years that failed to meet vesting conditions in the reported year | (809,250 | ) | (404,625 | ) | ||||||||||||||||||||||||
| Compensation actually paid (CAP) | 5,885,381 | 503,211 | 3,144,237 | (6,008,951 | ) | (1,936,899 | ) | 11,764,262 | 4,744,960 | |||||||||||||||||||